


INTRODUCTION
Understanding and controlling pathogens in complex multi-host systems is a particular challenge in epidemiology. Although some advances have been made in recent years [Reference Holt and Pickering1–Reference Holt5], the dynamics of these systems are relatively poorly understood from both theoretical and empirical perspectives. Where pathogen–host systems also involve a vector and particularly a vector with a multi-stage life-cycle, epidemiological complexity increases further [Reference Anderson and May6, Reference Randolph7]. An understanding of the ecology of each part of this system is often required to determine the dynamics and distribution of the pathogen, as well as its effect on hosts. In addition, at least from a theoretical standpoint, control may be carried out by targeting a number of potentially vulnerable points in the system. However, efforts in the field, particularly on a large scale, do not always follow theory. It is therefore important to monitor disease control efforts, not least because our assumptions about host–pathogen systems will be challenged if programmes do not follow predictions.
Louping-ill virus (LIV) is a tick-borne flavivirus that infects many wild and domestic animals in the British Isles and thus is an example of a complex pathogen–host–vector system. The virus principally causes mortality in sheep and red grouse (Lagopus lagopus scoticus) and has an effect on the economy of upland areas in the United Kingdom [Reference Reid8]. Although the virus is found in many parts of the British Isles where there is suitable tick habitat, the factors affecting its distribution are not well understood either at a landscape or local scale. Although the epidemiology of this pathogen–host–vector system can be extremely complex if multiple putative reservoir hosts occur [Reference Gilbert9–Reference Laurenson11], in situations where sheep and grouse are the predominant hosts for both the tick vector and virus, disease control efforts should be comparatively straightforward. Moreover, red grouse are not considered to be reservoirs of the disease. Red grouse suffer high mortality on LIV infection and, in addition adult ticks rarely feed on grouse; therefore a suitable host for the adult ticks is required for the tick life-cycle to be completed [Reference Reid8].
In this relatively simple two-host system, R 0, the basic reproductive rate of the disease, could theoretically be decreased by a reduction of the vector tick population through acaricide treatment of domestic sheep hosts and/or a reduction in the number of hosts susceptible to the pathogen, or through domestic host vaccination. Thus, either acaricide treatment of sheep alone, vaccination of sheep alone, or a combination of these two approaches should lead to elimination of the disease. Although the effect of wild host removal in a more complex system has been documented [Reference Laurenson11], the effect of single or dual control measures on a sheep–grouse–louping-ill system, and thus the role of grouse in louping-ill persistence, has not been reported.
In the Bowland Fells of Lancashire, between 1980 and 1993, the majority of farmers adopted a campaign to reduce tick numbers. By introducing two acaricide treatments, one before each of the spring and autumn periods of tick activity, tick numbers were reduced, but no assessment of the effect of tick control on LIV was undertaken [Reference Mathewson12]. When results were published, the owners of the shooting rights in this moorland area became interested in the control and eradication of louping-ill as they were concerned about grouse losses to this disease. Accordingly, a louping-ill control scheme was put in place by four farms in 1994 and by most farms in 1995. This paper presents results from the first 8 years of the scheme and is a retrospective analysis of a voluntary project carried out in real field conditions; therefore study design was less than ideal [Reference Mathewson13]. The paper nonetheless presents information on the factors affecting LIV distribution and abundance and how the effective force of infection changed when tick and virus control measures were put in place.
METHODS
Study area
The Bowland Fells of Northern Lancashire, Northwest England comprise 23 543 hectares (ha) of moorland and 763 ha of enclosed land between 150 m to 561 m a.s.l. (Fig. 1). The area comprises 15 land-holdings varying in size from 40 ha to 9710 ha, divided between tenanted farms and owner-occupied farms. There are also 13 common grazing areas, of 8 ha to 950 ha: 108 farms have sheep or grazing rights on commons, although not all exercise these rights. Rainfall averages 1300–2000 mm per annum and average maximum temperatures are around 6·7°C in winter and 18·8°C in summer. Heather predominates on the high moorland, with associations of bilberry, mat grass, purple moor grass, bents, fescues and heath rush. Many of the lower slopes and valley sides are infested with bracken.

Fig. 1. Map of the Bowland Fells, Lancashire, management units, with baseline seroprevalence in mainly 4-year-old ewes in 1994–1995 (■) and 5 years later (□). NT, Not tested; NTk, no ticks; NS, no sheep; UD, undisclosed.
The moorland area is used for both sheep and red grouse production. Around 34 500 Swaledale and Dales Bred hill ewes, 10 600 yearlings and 36 225 lambs, a total of some 81 000 sheep, graze the moor from April/May to clipping time in July. Generally, only ewes remain on moorland over winter. A few brown hares, rabbits and roe deer are seen in the area at the moorland edge. The number of red grouse harvested from the area were at one time the highest in Britain, with peak harvests achieved in the 1930s at over 300 birds/km2. By the 1970s, only an average of 53 birds/km2 were harvested, thus grouse densities in early August were approximately half those of sheep.
Tick control regimes
The three-host sheep tick, Ixodes ricinus, is prevalent in the area, with a bimodal tick acitivity pattern (peaks in May/June and early September) and generally a 3-year life-cycle [Reference Mathewson12, Reference Lee and Milne14]. Acaricide treatment for sheep is applied extensively either as a synthetic pyrethroid dip or pour-on preparation, although the regimes vary between farms. Up to three treatments per year were used: the first before moorland turnout in the spring [April (yearlings), early May (ewes and lambs)], a second treatment (pour-on) in late June/early July and a third treatment (pour-on) in mid August/early September for animals returning to the moor. Inadequate resources unfortunately precluded monitoring of tick populations.
LIV seroprevalence
Blood sampling
An estimate of LIV seroprevalence on each farm was determined by blood sampling sheep. Initial samples were typically of three-crop ewes, who had 5 years' exposure to ticks, and this was the sampling age group that would give most sensitivity for detection of the presence of LIV. A sample size of 30 was recommended, as this gives a 95% confidence interval of <5% for average-sized flocks. Latterly, sample sizes were specified such that a negative result would give 95% confidence that the true prevalence was <5% [Reference Ziller, Goodall and Thrusfield15]. Most initial sampling was conducted in 1994 and 1995 although six farms were sampled in 1999/2000, and these were included in baseline analysis of louping-ill presence (e.g. Fig 1). Blood samples were also taken from shot red grouse in 1994–1995. Follow-up samples (1999–2001) were of yearlings, as it was vital to establish the results of interventions as soon as possible after completion of the initial part of the programme, thereby enabling any subsequent action to be implemented quickly. Again, sample sizes were determined using the 95% confidence criterion specified above. Sera were tested for haemagglutination-inhibiting antibody (HIA) [Reference Clarke and Casals16].
Calculation of force of infection
The age of sheep, and thus the typical length of time for which they would have been exposed to ticks and thus LIV, was taken into account when calculating seroprevalence and the force of infection. A generalized linear mixed model with a complementary log-log link function and a binomial response distribution was fitted to the data [Reference McCullagh and Nelder17, Reference Brown and Prescott18]. Hence,
where α is the force of infection per week during the tick rise period, and the log of exposure (T) was fitted as an offset variable. T was estimated based on the age of animals, the date of sampling, and the typical pattern of the onset tick activity seen in the area. The logarithm of α was fitted as a random effect with respect to farm or heft (a subunit of the flock which habitually occupies a defined area of grazing) to take into account variation between farms. The form of this model was successfully validated against data from a single farm with four recorded sheep cohorts.
Change in force of infection due to control measures
The effectiveness of control measures was tested by resampling yearling sheep in 2000, generally 5 years after the initial samples were taken and between 4 and 5 years since control measures were instigated. Only data from farms where sheep were known to have been exposed to ticks during the study were included in these analyses. On two farms, data from different hefts were treated separately because they varied in their initial or post-vaccination conditions and sufficient data were available to model them separately. However, samples where the age of animals was not recorded were not included in the formal statistical analysis and data from some other farms were excluded because the samples were in breach of the sampling protocol. Thus among vaccinating farms, data from 13 of the farms initially sampled and 19 of the farms sampled on follow-up contributed to the statistical analysis. Among non-vaccinating farms, data from 17 of the farms initially sampled and 25 of the follow-up samples contributed to the analysis. Some farms did not vaccinate completely in line with the protocol and so data from three of these farms initially sampled and two of the follow-up samples contributed to the analysis. A generalized linear mixed model was fitted, with time of sampling (initial or follow-up) nested within acaricide class as the explanatory variables, and farm fitted as the random effect.
Determination of seropositivity
On farms where vaccination had never taken place or where vaccination had taken place over 22 months previously, a dilution titre >1/20 was assumed to determine exposure to natural infection, as antibody titres from a single vaccination rapidly decline [Reference Reid and Pow19]. Where animals had been more recently vaccinated, a titre of >1/160 was assumed to determine exposure to natural infection. This latter cut-off titre was chosen after analysing the sensitivity and specificity associated with alternative threshold levels (Table). A model was constructed from the distribution of highest positive titres of louping-ill antibodies in sheep from the 11 farms with more than two non-zero titre classes. The model assumed that the underlying titres of animals fell into two distributions: those with higher titres associated with infection after vaccination and those with lower titres associated with vaccination only. The probability of any assay being recorded as the highest titre was assumed to be the product of the probabilities of that dilution being positive and all more dilute assays being negative.
Table. Estimated proportion of sheep seropositive on 11 farms in the Bowland Fells through natural infection rather than vaccination, with associated sensitivity estimates for alternative cut-off thresholds

The model assumed that each animal k had a ‘propensity for detection’ μk parameter, associated with the antibody titre. Each animal was associated with an independent realization of this parameter, from a sub-distribution from a mixture distribution determined by whether the animal was in the vaccination or infection class. The sub-distributions were assumed to be Gaussian, with independent means and variances and a Poisson-type relationship between μk, the dilutions and the probability of an observation at a given titre being negative or positive. Hence, the probability of a negative observation from animal k at dilution d i is given by exp(μk/d i). (The geometric nature of the dilution series allows simplification of the equations so that the likelihood is specified by only five parameters: the proportion of animals in each class and the means and variances of the distributions. The likelihood of this model was approximated using Latin Hypercube sampling to generate approximate values of the average probability of observations falling into each titre class given the infective state of the animal.
Maximizing the approximate likelihood of this model for each of the 11 farms, the model gives a good fit to all but one of the farm datasets (Table), the exception being farm F, where the evidently low prevalence and a small sample size did not allow the fit of the model to be assessed. The estimated specificity of the test never dropped much below 100% on any farm, but the sensitivity was more variable. Overall, a 1/20 threshold gives excellent sensitivity, but the 1/160 threshold may be relatively insensitive in some circumstances.
Louping-ill control regimes
Three farms gave yearlings one dose of louping-ill vaccine prior to 1994–1995, but during the study period a further three regimes were recommended, with the choice of strategy varying according to initial seroprevalence and the financial resources available.
(1) Sheep flocks or hefts with seroprevalence to LIV on initial testing in the range 0–10% (inclusive) were not to be vaccinated but the three-treatment acaricide regime was recommended. The resulting tick suppression was predicted to be sufficient to eliminate the virus. At initial testing, 55 farms were identified as belonging to this class. The available evidence suggests that 25 of these farms adopted and maintained the prescribed acaricide regime.
(2) Where sheep flocks exhibited a seroprevalence in the range 11–80%, all sheep were to be vaccinated twice in the first year. Ewe lambs that were to remain on the moorland into the autumn and the second tick rise were then to be given a first vaccine at around 3 months of age in July, although in practice, on two farms lambs were vaccinated at 1 month of age. Younger lambs of vaccinated or naturally exposed ewes would be protected by maternally derived antibody [Reference Shaw and Reid20]. Male lambs were generally not returned to the moor after weaning when maternally derived antibody had declined and were therefore not to be vaccinated. Where another vaccine (e.g. clostridial) was used at clipping time, first LIV vaccination was to be delayed until August. A further vaccination of replacement females was recommended to ensure maximum protection both to the individual and to lambs via the colostrum [Reference Reid and Pow19, Reference Shaw and Reid20]. This could be administered at least 1 month after first vaccination, but generally at 1 year of age. It was predicted that, under this control regime, LIV would decline and be eradicated within 5 years. At initial testing, 24 farms were identified as belonging to this class. The available evidence allows identification of six farms from this class which adopted and maintained the prescribed vaccination regime. These farms represent 44% of all vaccinated sheep. Eleven farms in this class adopted and maintained regime 3 below, for reasons of economy.
(3) Where flocks had a seroprevalence >80%, vaccination of older age classes was less urgent, as many sheep were already immune. Thus only yearling ewes were to be vaccinated twice in year 1, but the ewe lambs were to be vaccinated at clipping time and then again as yearlings. It was predicted that LIV would decline and be eradicated after 5 years. This economy measure was also adopted where financial resources were limited. At initial testing, five farms were identified as belonging to this class. The available evidence allows identification of 13 farms which adopted and maintained the prescribed vaccination regime.
The information provided by the farmers indicates that, overall, four farms started louping-ill vaccination in 1994, a further eight started in 1995 and, during the period 1996–1998, 26 farms used louping-ill vaccines, although not necessarily precisely in line with the above recommendations. Although six farms stopped vaccinating in 1999, a further three new farms joined the scheme in 2000. As the project was entirely voluntary, the regimes followed varied between estates and individual farms.
RESULTS
Prevalence and spatial distribution of LIV in the Bowland Fells
In 1994–1995, sheep on 84 of 100 tick-affected farms were tested for antibodies to LIV, with a further seven farms tested in 1999–2000. In addition, LIV was reported to be present on a further two farms, from clinical and post-mortem diagnoses. Thus by 2000, the LIV status of 93% of farms had been established serologically or clinically, encompassing 98% of sheep in the moorland area. Evidence of LIV was found on 49% (n=91) of these tested farms (Fig. 2). The total number of ewes and yearlings in infected flocks was around 26 700, or 59% of the total population. However, only three farms were vaccinating against LIV in 1994.

Fig. 2. Frequency distribution of the proportion of sheep flock seropositive to louping-ill virus on tick-infested farms in the Bowland Fells, Lancashire. Virtually all samples were obtained from 4-year-old ewes.
The spatial distribution and severity of louping-ill in the area in 1994–1995 is depicted in Figure 1. Louping-ill was detected throughout the area, although the highest prevalences were observed in the east of the study area. Areas of high prevalence could be immediately adjacent to areas of low prevalence and thus geographical position appeared to have relatively little effect on the presence or prevalence of the virus. In most, but not all, cases a fence marked the boundary between estates and/or commons, but not between hefts on individual farms. When evidence of infection was surveyed using blood samples obtained in 1994 from shot red grouse of 3–6 months of age (n=2628 birds) from 14 areas, a similar distribution was observed with a high correlation in seroprevalence between the two sets of results (r=0·77, P<0·05). However the seroprevalence in red grouse was always lower than that of sheep in the same area and, when sheep seroprevalence was <12·5%, no evidence of infection was generally found in red grouse. This may be explained by higher virus-induced mortality rates in red grouse and potentially higher infection rates in sheep.
Data on age seroprevalence were available from 17 farms and were used to calculate the force of infection on these farms. The number of weeks that each animal was exposed to ticks was estimated by assuming that they would have been exposed to ticks for 12 weeks each spring and 6 weeks each autumn, but that lambs would have been refractory to infection in their first spring, due to the presence of maternally acquired antibody [Reference Reid and Pow19]. Weekly seroincidences, i.e. the proportion of animals seroconverting each week of tick rise exposure, were estimated from these data (Fig. 3). The force of infection during exposure to tick populations varied enormously between farms (100-fold) and even hefts (ten-fold), see also Figs 1 and 2). There was an excellent fit of the model to the data (χ2=12·0, d.f.=13, P=0·53) and the model was further validated by fitting it to data from four age classes of sheep on a further farm, again giving rise to a well-fitting model (χ2=2·4, d.f.=2, P=0·3).

Fig. 3. Variation in estimated flock weekly seroconversion rates (force of infection) to louping-ill virus in different management units of the Bowland Fells, Lancashire.
Factors affecting seroprevalence
The extent of acaricide use was surveyed in 1994 in order to ascertain where improvements could be made. Sixty-five of 94 tick-affected farms sampled replied to the questionnaire. Of these, 65% used two acaricide treatments per year, before the spring and autumn tick rises, 20% used acaricides only once, before the spring tick rise, whilst the remaining 15% did not use acaricide treatment regimes, or were using them in a manner likely to be ineffective. Overall, 85% of farms and 90% of ewes and yearling females had at least one acaricide treatment, in the spring.
There was a significant difference (t 34=2·8, P=0·03) in the incidence of louping-ill on farms that applied two acaricide treatments (percentage incidence of 0·23% per week) rather than one (percentage incidence of 1·22% per week) (Fig. 4).

Fig. 4. Effect on acaricide use on the estimated mean (±95% CI) flock weekly seroconversion rates (force of infection) to louping-ill virus in the Bowland Fells.
Effect of control measures on LIV
Farms adopted a variety of different measures to control LIV (see Methods section). Generally those farms (n=29) with a seroprevalence of >10% on initial testing adopted a vaccination programme as detailed above. However, of these 29 farms, ten vaccinated intermittently or did not vaccinate at all. Thus only 19 farms completed the recommended vaccination programme. With small sample sizes leading to wide confidence intervals associated with the initial seroprevalence estimates, it is likely that some of the farms that were classed as non-vaccinating would have benefited from doing so, including some of those with zero estimates of seroprevalence.
There is no evidence that the estimated force of infection (approximately equal to the proportion of flocks infected per week) changed during the study on farms that did not vaccinate, irrespective of the number of acaricide treatments (Fig. 5, t 41=0·1, P=0·92). However, the estimated force of infection on farms that did not follow a consistent protocol increased dramatically (t 2=14·0, P=0·005) to a high mean level. The estimates for this group are subject to large uncertainty because of the small sample size. Nevertheless, this group may be the most appropriate control for the programme, rather than farms that did not vaccinate, as these ‘non-protocol’ farms had a demonstrated problem with LIV, whereas the non-vaccinating group included farms with no louping-ill problem, a small, stable problem (those with consistent acaricide use) and farms where there may be large fluctuations in incidence and a non-stable louping-ill situation.
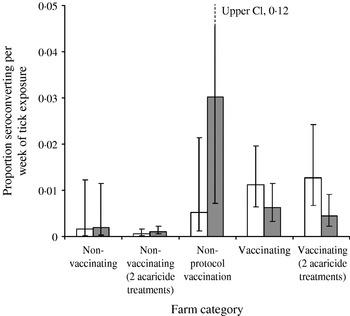
Fig. 5. Estimated mean (±95% CI) initial (□) and final ( ) flock weekly seroconversion rates (force of infection) on farms in different categories of control regimes in the Bowland Fells. Unless, specified, farms were included irrespective of frequency of acaricide use. The upper limit for the weekly seroconversion in the non-protocol vaccination group is 0·12.
Against this background of variable and potentially increasing force of infection, there was statistically significant evidence of a decrease in the mean force of infection on farms that vaccinated against louping-ill, irrespective of acaricide application frequency (t 33=2·0, P=0·05). All these farms showed a decrease in estimated infection rates, and 6 of 19 farms that maintained a full vaccination programme actually declined to zero observed seroprevalences. Five farms had a final seroprevalence of <4%, with only one yearling sheep positive in 2000, whereas two farms had a final seroprevalence of >10%. On one of these farms, with a high initial seroprevalence of 55% in yearling sheep, a rapid initial decline in seroprevalence was observed at 11% by 1999. The rate of decline then apparently plateaued as 5% seroprevalence was detected in 2000 and 3% (95% CI 1·1–7·1) in 2001 some 7 years after initial vaccination. All vaccinating farms carried out at least one acaricide treatment, and thus we cannot determine whether vaccination alone would have had an effect on louping-ill incidence.
DISCUSSION
In this analysis of the distribution and control of LIV in the Bowland Fells of Lancashire, UK, a pathogen in a complex system with multiple hosts and a vector, several important results are reported that will assist with future control measures. First, and most importantly, we have shown that vaccination of sheep before they are exposed to LIV has an effect at the population level on the dynamics of the virus as well as providing protection for individuals. This result suggests that sheep are the essential vertebrate host for this virus in this two-host, one-vector system. However, in a number of situations, total eradication was not achieved as predicted during the period of study and we discuss potential explanations for this below. Second, the frequency of acaricide use also had an effect on seroprevalence, with sheep flocks on farms using two treatments a year, before the spring and autumn rise, demonstrating lower mean seroprevalence than sheep on farms using only a single treatment.
Third, the length of exposure to ticks had an enormous influence on an animal's serological state, as indicated by the large force-of-infection parameter estimates associated with some farms (Fig. 3). This finding emphasizes the importance of incorporating time of exposure into the prevalence analyses; in the absence of such information, estimates of seroprevalence are virtually worthless. In situations, where animals are potentially exposed to a pathogen at a constant rate, age is the best measure of this effect, however, where heterogeneities are evident in exposure time, due either to natural factors, such as season, or man-made factors, such as grazing regimes or vector control, other more detailed data are required on exposure length. Finally, louping-ill prevalence in the Bowland Fells demonstrated great spatial variation. Areas of high seroprevalence could be found adjacent to areas of low seroprevalence, and whilst often separated by a firm barrier to sheep movement, this was not always the case. With apparently little horizontal spread of louping-ill, control measures in one area would not generally be affected by their neighbours' management regimes. Overall, in a stable management system, with limited horizontal spread, different management regimes that affected both tick distribution and louping-ill prevalence appeared to have more effect in determining louping-ill prevalence than natural ecological factors.
Why was louping-ill not eradicated in every situation?
Although louping-ill declined on all farms where vaccination was fully implemented, on approximately two thirds of farms (68%), there was still evidence of infection 5 years later. It had been predicted that a 5-year vaccination regime would be adequate for louping-ill eradication on these farms given that all susceptible reservoir hosts should have been removed from the system if all susceptible sheep were either vaccinated or, as pre-vaccination lambs, protected by high levels of colostrum through a double vaccination of dams. Given the tick life-cycle normally takes 3 years to complete, virus levels should quickly drop. In the current project, vaccinations have in fact continued for 8 years on one of the farms, but the mean LIV antibody level has not reached zero on this farm, although it has been reduced to 2·9% (95% CI 1·1–7·1). It is, however, possible that a few exceptional sheep could have had high titres due to vaccination alone [Reference Reid and Doherty21]. Experience with a similar project in the north of Scotland [Reference Laurenson11] has shown that there can be a considerable lag time (3–4 years) before management changes reduce louping-ill levels and that low residual levels of persistent louping-ill can occur.
This apparent difficulty in completely eradicating louping-ill from an area may arise from a number of factors. First, wild hosts, particularly red grouse, probably play some role in the transmission and maintenance of LIV, although it is unlikely that any species in the Bowland Fells could allow either LIV or tick persistence alone. Red grouse are known to allow viraemic transmission of LIV [Reference Reid8], and can also carry substantial nymph and larval tick burdens. Rabbits, small mammals and roe deer also occur in the Bowland Fells and can carry variable tick burdens [Reference Milne22]. However, small mammals feed few ticks and generally occur at low densities on heather moorland, thus Gilbert et al. [Reference Gilbert9] concluded that small mammals appear to be of little importance in LIV persistence. Although none of these species allow viraemic LIV transmission, and rabbits do not allow non-viraemic transmission between co-feeding ticks [Reference Jones23], we do not know whether roe deer or brown hares support non-viraemic LIV transmission. It may also be possible that vaccinated sheep can occasionally allow non-viraemic transmission [Reference Laurenson24]. However, transmission rates would be low under these conditions due to low species densities and infrequent transmission events and we consider it unlikely, even if transmission occurs, that any of these species could allow LIV persistence. The possibility remains however, that even if the magnitude of the contribution of these hosts was small, they may have served to slow the rate of decline of LIV and prolong the period of control needed to eradicate the virus. Continuation of the management strategies instigated in this control scheme will, in the future, provide a robust test of the role of grouse in LIV persistence.
Second, various factors affecting tick populations and their control may influence the effectiveness of control programmes. Ixodes ricinus life-cycles can extend up to 6 years in very cold climates, although a 3-year cycle is considered most likely in 90% of UK tick populations [Reference Gray25]. Although in the Bowland Fells, a classic bimodal pattern of tick activity occurs and it is probable that only a very small proportion of ticks undergo a longer cycle, a longer survival rate and tick life-cycle could ensure an enduring persistence of the pathogen or delay or failure in eradication [Reference Randolph26]. In addition, heterogeneities in the distribution of tick burdens on hosts, could lead to an increase in R 0 and thus prolong the persistence of the pathogen [Reference Randolph26]. If a few hosts carry most of the ticks, and if these core-transmitting hosts, due to chance effects, are subject to poor acaricide control or ineffective vaccination, they could contribute disproportionately to pathogen transmission. Thus it is imperative that control measure coverage is very high both within the core transmitters, if they can be identified, and if not, then the overall coverage must be higher than that expected theoretically when heterogeneities are not taken into account [Reference Randolph26, Reference Woolhouse27]. Finally, acaricide effectiveness is not 100%, even initially, and clearly wanes after application. Tick populations may therefore survive, albeit in low numbers, particularly if a low density of wild hosts are present. The continued persistence of the tick population, even if controlled at a low level by regular acaricide treatments at a cost-effective frequency, will mean that LIV persistence might occur, particularly if vaccination is not used. Indeed, even on farms where two acaricide treatments were used annually, no decline in louping-ill mean seroprevalence was observed during the course of the study, suggesting that acaricide use alone is not sufficient to control louping-ill below a certain level. Moreover, recent reports from farms that were not vaccinating, suggests that louping-ill prevalence has increased in some cases (R. Banks, personal communication).
Limitations of the control programme and study: some lessons learnt for other programmes
Although EU funds contributed to the cost of vaccines and acaricides, this programme was voluntary and funds for testing and monitoring came primarily from private sources, unlike most disease control and eradication schemes. This had a number of implications, particularly through financial constraints, on study design. First, no systematic tick monitoring was carried out and thus there is little information on changes in tick populations, and their effect on LIV on these farms. However, acaricide use has been shown to reduce tick populations in the area in previous studies [Reference Mathewson12]. However, in this study, it is difficult to separate out the effect that changes (increase or decrease) in tick populations might have had on the control scheme. We would, therefore, recommend that vector monitoring schemes should be integral to any pathogen control programmes in a complex host–vector–pathogen system.
Second, financial constraints also meant that a relatively low number of older sheep were initially sampled in some flocks, resulting in wide confidence intervals. Thus when the seroprevalence rate in older ewes was <10%, vaccination was not instigated, whereas in some cases the true level of infection probably warranted vaccination. For example, on one farm, the initial flock seroprevalence estimate was 0% but the confidence intervals for the true mean were 0–31%. No vaccination took place but 4½ years later the flock was retested with a mean seroprevalence of 16% (95% CI 13–23). Furthermore, even when a reasonable number of sheep were sampled, these were spread across well-defined subdivisions in management systems (hefts) within farms and thus control measures were recommended for the average situation, rather than the particular situation in each area. For example the initial overall level of LIV on one farm with three hefts was 10% (95% CI 2–27), but was 0% in one heft and 20% in the other two. At retesting the overall level had dropped to 5·4%, with the single heft again at 0% and the combined hefts at 8·1%. Although LIV had declined, the infected hefts might have benefited from a more aggressive regime. We would thus recommend that although initial costs may appear high, it is cost-effective to invest in detailed assessment of the initial conditions, so that appropriate control measures are instigated in each subpopulation within a flock.
Finally, all evidence from these results and from recent reports of an increase in louping-ill incidence in sheep on farms that were not vaccinating (R. Banks, personal communication) suggests that acaricide use alone is not sufficient to control or eradicate louping-ill. Thus vaccination, in at least a single dose, may be required in perpetuity if louping-ill is not eradicated through an aggressive control regime, to keep the prevalence at a low level that does not cause economic losses.
CONCLUSION
Although louping-ill was still present on all but six of the 19 farms that applied a full vaccination regime, results indicate that good tick control in combination with louping-ill vaccination can reduce levels of LIV in a relatively simple two-host (grouse–sheep) system. Indeed, where control measures were applied in an exemplary fashion, huge improvements were observed over 5 years. This was not true on farms which did not apply such stringent control methods. These results emphasize the observation that cooperation and compliance of farmers is absolutely critical to the success of a scheme. Control on independent autonomous areas, where sheep are well hefted or fenced, is apparently worthwhile, as there is apparently little horizontal transmission of the virus. However, where management systems are not stable or sheep are not well-hefted to grazing areas, control will not be successful. Overall, louping-ill can clearly be reduced to levels where it is not limiting either sheep or red grouse production. Although in principle it should be possible to eradicate louping-ill using tick control and vaccination of domestic sheep, the collection of further longitudinal data from this scheme will present a unique opportunity to see whether this can be achieved in practice in a wide variety of situations with the inherent variability of ecological and management conditions at the regional scale.
ACKNOWLEDGEMENTS
We thank all those who have supported the Bowland louping-ill project over this first phase, particularly the other members of the Bowland Louping-Ill Steering Committee; Rod Banks, Henry Bainbridge and Neil Roberts, also for the support of the Duke of Westminster and other landowners and shooting-rights owners, the veterinary surgeons (particularly Neil Roberts) and gamekeepers for blood testing sheep and grouse, Irene Pow and the Moredun laboratory staff for the blood analyses, the members of MAFF/DEFRA and the Bowland Initiative, who have helped with planning and European grants. We also thank S. Highley and C. Hewitt for their painstaking work on the GIS mapping. Funding for the research aspects of this work came from the Westminster Foundation, the Game Conservancy Trust, a NERC grant to Peter Hudson and SEERAD. The control scheme itself was financed primarily by the shooting right-owners and an EU grant to ADAS for vaccine costs under the EU Objective 5b scheme. The scheme would not have been possible without the cooperation and hard work of the farmers. We are grateful to the land and livestock owners in the area for permission to publish their test results.
DECLARATION OF INTEREST
None.


