

Abstract
In this study we identified a significant low frequency variability (8 to 20 years) that characterizes the hydroclimatology over the Central Andes. Decadal–interdecadal variability is related to the central-western Pacific Ocean (R2 = 0.50) and the zonal wind at 200 hPa above the Central Andes (R2 = 0.66). These two oceanic–atmospheric variables have a dominant decadal–interdecadal variability, and there is a strong relationship between them at a low frequency time scale (R2 = 0.66). During warming decades in the central-western Pacific Ocean, westerlies are intensified at 200 hPa above the Central Andes, which produce decadal periods of hydrological deficit over this region. In contrast, when the central-western Pacific Ocean is cooler than usual, easterly anomalies prevail over the Central Andes, which are associated with decades of positive hydrological anomalies over this region. Our results indicate that impacts of El Niño on hydrology over the Central Andes could be influenced by the low frequency variability documented in this study.
Export citation and abstract BibTeX RIS

Original content from this work may be used under the terms of the Creative Commons Attribution 3.0 licence. Any further distribution of this work must maintain attribution to the author(s) and the title of the work, journal citation and DOI.
Introduction
Precipitation in the Central Andes is characterized by a strong spatial contrast due to its complex topographic gradient (Garreaud et al 2003, Vuille and Keimig 2004) (figures 1(a) and (b)). In this region, the Andes form a natural barrier for warm and wet easterly winds from the central Amazon Basin and the Atlantic Ocean (Melice and Roucou 1998, Garreaud 1999, Garreaud et al 2003, Vuille et al 2003, Garreaud 2009, Insel et al 2010), and cold, dry winds from the subtropical Pacific Ocean (Garreaud 1999, Houston and Hartley 2003). While the eastern part of the Andes is characterized by atmospheric instability, deep convection and a huge amount of rainfall (Garreaud 1999, Garreaud 2000, Vuille et al 2000, Garreaud et al 2003, Vuille et al 2003, Vuille and Keimig 2004, Espinoza et al 2015), the Western Andes are characterized by great atmospheric stability due to large-scale subsidence and a cool subtropical east Pacific Ocean (Garreaud 1999, Houston and Hartley 2003, Rutllant et al 2003, Garreaud 2009).

Figure 1. (a) Elevation map (shaded) and location of the hydrological stations used in this study (green points). (b) Cross section (longitude versus altitude) following the green transect shown in (a). Points show the perpendicular projection of each station on the transect. (c) Standardized values for the annual December–April average of hydrological data. The La Pascana and Santa Rosa stations are merged to construct Tambo annual time series. Wet (shading) and dry (no shading) periods are shown.
Download figure:
Standard image High-resolution imagePrecipitation over the Central Andes is the principal water source for the dry southern coast of Peru, the Altiplano region and the upper part of the Amazon. In these regions, rainfall shows a strong seasonality; indeed, more than 50% of the precipitation falls during the austral summer—December to March—(Vuille et al 2000, Garreaud 2000, Garreaud et al 2003, Vuille and Keimig 2004, Knüsel et al 2005). This seasonality is related to the presence of the Bolivian High (BH) in the upper troposphere (Lenters and Cook 1997, Vuille 1999, Vuille et al 2000, Garreaud et al 2003, Garreaud 2009), which is formed by convection in the central Amazon (Silva Dias et al 1983, Lenters and Cook 1997). The BH is associated with an anticyclonic and divergent movement of winds at 200 hPa, which allows zonal winds to carry moister air from the inner part of the continent (Vuille 1999, Garreaud et al 2003). A significant correlation has therefore been documented between rainfall in the Altiplano and easterly winds at 200 hPa over the Central Andes, which have been observed from synoptic to interannual time scales (Garreaud et al 2003, Minvielle and Garreaud 2011).
Previous studies have noted that the Tropical Pacific plays a relevant role in modulating rainfall in the Central Andes on an interannual time scale (Aceituno and Garreaud 1995, Ronchail 1995, Vuille 1999, Vuille et al 2000, Garreaud and Aceituno 2001, Vuille et al 2003, Garreaud et al 2003, Lagos et al 2008, Lavado-Casimiro and Espinoza 2014). Lavado-Casimiro and Espinoza (2014) found that central El Niño events are distinguished by a precipitation decrease in the Andes, especially in the Central Andes. High (low) values of the Southern Oscillation Index are also associated with easterly (westerly) anomalies at 200 hPa over this region, which are characteristic of wet (dry) years (Vuille 1999, Garreaud and Aceituno 2001). El Niño 1982–1983 and 1997–1998 had different impacts on precipitation and hydrology in the Central Andes; for example, El Niño 1982–1983 was characterized by strong deficit of precipitation throughout the Central Andes, while El Niño 1997–1998 did not cause the same effects (Sperling et al 2008).
In the western portion of the Central Andes, a decadal–interdecadal rainfall oscillation was detected and was statistically related to sea surface temperature (SST) in the central and eastern tropical Pacific and the South Pacific Convergence Zone (Vuille et al 2000). Seiler et al (2013) suggested that extreme warm and dry events in the Bolivian highlands are more frequent during positive phase of the Pacific Decadal Oscillation (PDO), while a negative phase of the PDO enhanced floods in the Bolivian lowlands. Although a few studies have explored low frequency climate variability over the central and western part of the Altiplano, decadal/interdecadal rainfall variability over all the Central Andes remains poorly documented. There is a clear need for in-depth analysis of low frequency hydroclimatic variability over this region and its relationship to oceanic and atmospheric conditions.
In this study we use a hydroclimatic dataset as a proxy for precipitation in the Central Andes to analyze its low frequency variability. We use discharge data from rivers that drain into the Pacific (western Central Andes) and into the Amazon basin (eastern Central Andes), as well as the water level in Lake Titicaca, which synthesizes rainfall variability in the Altiplano (Aceituno and Garreaud 1995). In addition, the causes of low frequency hydroclimatic variability over the Central Andes are analyzed and discussed in relation to low frequency variability of global SST and atmospheric circulation.
Data and method
Observed hydrological data
The low density of precipitation gauges in the Central Andes makes them generally inadequate for displaying spatio-temporal rainfall variability, which is largely influenced by complex orographic characteristics (e.g. Espinoza et al 2015). Discharge and water level data (hydrological dataset) are more reliable, because they represent accumulated precipitation in the catchment. Furthermore, the time period covered by the hydrological data (1956–2014) for the Central Andes is longer than that of meteorological data (generally starting after 1963; e.g. Espinoza et al (2009)). In this study we use a comprehensive hydrological dataset of discharge and water level data from the National Meteorology and Hydrology Service (SENAMHI) of Peru and the National Meteorology and Hydrology Service (SENAMHI) of Bolivia. The dataset covers a cross-section extending from the coast across the highlands of Peru and the Peruvian-Bolivian Altiplano to the Andean/Amazonian region of Bolivia. This dataset therefore provides a good indication of the different precipitation regimes in the Central Andes (15 °S–20 °S and 73 °W–63 °W; figures 1(a) and (b)).
For the Pacific system, we analyze the Huatiapa and Puente Camaná stations, in the Camaná River, as well as the La Tranca and Aguas Calientes stations in the Sama and Caplina Rivers, respectively. In the Tambo River, we use the La Pascana station (1956–1999) and the nearby Santa Rosa (1990–2014) station, which are highly correlated during the wet season (r = 0.99). We merge the data from these two stations to create one discharge time series for 1956 to 2014. In the Amazon drainage, discharge data from the Rurrenabaque station (1968–2013) on the Beni River is also analyzed. Discharge information for each station is calculated as the annual mean from December to April, which corresponds to rainfall during the wet season over this region. Finally, we use measurements of the Titicaca water level from December (year n-1) to April (year n) as an indicator of rainfall variability during the austral summer in the Altiplano (1914–2014). Table 1 displays the location, period and type of hydrological data for each station.
Table 1. Name, geographic location, temporal range, hydrological system and type of hydrological data for each station.
| Name of station | Location | Temporal range (years) | Hydrological systems | Hydrological data |
|---|---|---|---|---|
| Aguas Calientes | 70.12 °W; 17.85 °S | 1969–2005 | Pacific | Discharge (m3 s−1) |
| La Tranca | 70.48 °W; 17.73 °S | 1969–2005 | Pacific | Discharge (m3 s−1) |
| La Pascana | 71.70 °W; 17.03 °S | 1956–1999 | Pacific | Discharge (m3 s−1) |
| Puente Santa Rosa | 71.63 °W; 16.98 °S | 1990–2014 | Pacific | Discharge (m3 s−1) |
| Camaná | 72.73 °W; 16.60 °S | 1969–2006 | Pacific | Discharge (m3 s−1) |
| Huatiapa | 72.47 °W; 16.00 °S | 1969–2006 | Pacific | Discharge (m3 s−1) |
| Titicaca | 69.63 °W; 16.10 °S | 1956–2014 | Titicaca | Water level (m) |
| Rurrenabaque | 67.54 °W; 14.44 °S | 1968–2013 | Amazon | Discharge (m3 s−1) |
Oceanic and atmospheric data
Because our goal is to link the decadal–interdecadal hydrological variability of the Central Andes with oceanic patterns, we analyze sea surface temperature (SST; 1956–2014) data from Extended Reconstructed SST V3b (NOAA, Reynolds and Smith 1994). We also use zonal winds at 200 hPa (1966–2014) from the NCEP-NCAR reanalysis (Kalnay et al 1996) to analyze atmospheric processes associated with the decadal–interdecadal oscillation in the Central Andes.
We use the mean from December to April of the SST time series from 1956 to 2014 because that is our longest record of hydrological data. Zonal wind at 200 hPa (U200) over the Central Andes, however, shows a jump in the mean from 1949 to 1965, compared with the mean from 1949 to 2014 (which is not observed in other reanalysis data; figure S1). In addition, the Cramer test (Cramer 1946) shows that the difference in the means is significant at 90%. We therefore use only the mean from December to April of U200 time series from 1966 to 2014.
Defining the hydroclimatic index in the Central Andes
We standardized all hydrological data to compare eastern (wetter) and western (drier) regions and to compare discharge and water level data (figure 1(c), table 1). Each hydrological data is standardized subtracting its 50th percentile value and dividing by its standard deviation of each time series. To synthetize hydrological data (discharge and water level), we use the first principal component (PC1) resulting from an Empirical Orthogonal Function (EOF, Lorenz 1959), which is computed considering the standardized values of the seven hydrological data sets. Thus, the input matrix for the EOF is a 37 × 7 dimension (37 years for the common 1969 to 2005 period and seven standardized hydrological time series). We also propose a hydrological index over the Central Andes, which is computed as the mean of the standardized values of the discharge data for the Tambo River and the water level data for Titicaca Lake. We call this index Tam-Titi. To investigate the dominant frequency in our region of study, spectral analysis of PC1 and Tam-Titi is calculated using the multitaper power spectral density estimate (Thomson 1982). The red noise at 90% and 95% significance is computed to identify leading frequencies. The decadal–interdecadal variability of Tam-Titi, SST and zonal wind at 200 hPa is extracted by applying a Butterworth low pass filter with a cutoff at 8 years and a scale of 2. Linear regressions and correlation are then performed between the low frequency variability of Tam-Titi and the SST (1957–2013) to identify oceanic zones that have an influence in the Central Andes. The same procedure is done with the zonal wind at 200 hPa (1967–2013).
Since correlation is performed between two filtered time series, which means that the autocorrelation of the time series could influence the correlations coefficient (Bretherton et al 1999), we calculate the significance of each correlation with modified degrees of freedom proposed by Bertherton et al (1999).
Determining the hydroclimatic low frequency variability in the Central Andes
The interannual hydrological variability of all stations correlates well (figure 1(c)), with a correlation coefficient that varies from 0.38; p < 0.05 (Aguas Caliente versus Rurrenabaque) to 0.91; p < 0.01 (Camaná versus Huatiapa). Figure 1(c) shows a dominant oscillation of between 8 and 20 years, which is common in all the stations, explaining dry and wet periods over the Central Andes. This common oscillation suggests that a decadal–interdecadal low frequency is characteristic of the hydroclimate of the Central Andes.
To synthesize the main mode of hydroclimatic variability over the Central Andes, we conducted an Empirical Orthogonal Function (EOF) analysis for the seven stations. PC1 (68% of total variance) has a highly significant and positive correlation with all the hydroclimatic time series (figure 2(a)). The minimum correlation coefficient (r) is 0.71 (PC1 versus Rurrenabaque) and the maximum r is 0.94 (PC1 versus Tambo), both with a p < 0.01 (figure 2(a)). PC1 can therefore be considered an index that summarizes the variability of the hydrological stations. PC1 is also characterized by a low frequency with wet and dry periods that fluctuate between 8 and 20 years (blue line in figure 2(b)).
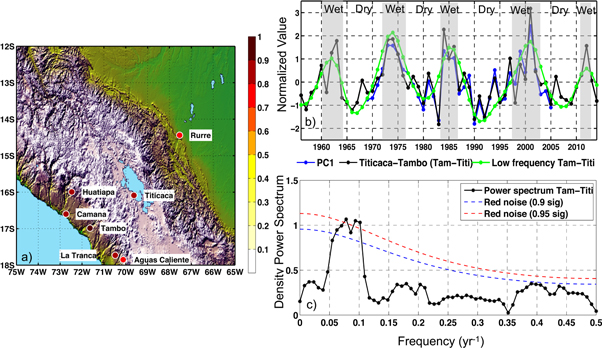
Figure 2. (a) Correlation of the first principal component (PC1) with each hydrological station. Colors from white to dark red show the strength of the correlation. (b) Interannual variability of Titicaca-Tambo (Tam-Titi, black line) index, PC1 (blue line), and the low frequency of Tam-Titi (LTam-Titi; green). Wet (shading) and dry (no shading) periods are also shown. (c) Density power spectrum of Tam-Titi (black line) and red noise at 0.9 (blue) and 0.95 (red) significance.
Download figure:
Standard image High-resolution imageAlthough PC1 is a good indicator of variability in the Central Andes, its time period is relatively short (1969–2005) and is limited to the common period of the hydrological stations. To obtain an index covering a longer period (1956–2014), we computed the average of standardized values of discharge data for Tambo River and water level data for Lake Titicaca (Tam-Titi). Tam-Titi is well correlated to PC1 (r = 0.93, p < 0.01) for the common time period (1969–2005); it also shows decadal–interdecadal fluctuations of dry and wet hydrological conditions (black line in figure 2(b)). The correlation between Tam-Titi and the average of the remaining five stations is 0.85 (p < 0.01). These correlation coefficients suggest that Tam-Titi can be considered representative of hydrological variability in Central Andes.
The density power spectrum (DPS) of Tam-Titi and PC1 are calculated using the Thompson technique (Thomson 1982). The largest peak in the DPS of Tam-Titi (figure 2(c)) and PC1 (figure S2) is between 8 to 20 years (frequency between 0.05 to 0.125 years−1). This peak in the Tam-Titi DPS is significant at p < 0.05 (figure 2(c)), taking red noise into account, and the peak in the PC1 DPS is significant at p < 0.10 (figure S2). Those results are statistically robust enough to indicate that there is a marked decadal–interdecadal hydroclimatic variability in the Central Andes.
Decadal hydrological variability and ocean and atmospheric conditions
The decadal–interdecadal variability of hydrological time series in Central Andes could be a response to atmospheric and oceanic forcings. To evaluate these influences, we use the low frequency variability of Tam-Titi, which is calculated by retaining variability with periods greater than 8 years. This new time series (LTam-Titi) is marked by dry and wet conditions in the same periods as Tam-Titi (green line in figure 2(b)).
The central-western tropical Pacific Ocean explains 45% to 60% of the variability of LTam-Titi (figure 3(a)). This suggests that El Niño regions are not the main forcing of the hydrological variability of the Central Andes at a decadal–interdecadal time scale. The relationship between the low frequency of SST in the central-western tropical Pacific and LTam-Titi is negative, which means that when SST in the central-western tropical Pacific is cooler (warmer) than normal, LTam-Titi shows positive (negative) anomalies (figures 3(a) and (e)). In addition, climatic indices such as PDO, SST in the north and south tropical Atlantic and SST of the Niño 3.4 and Niño 1 + 2 regions are analyzed, but they do not show a robust relationship with LTam-Titi (table S1). These results suggest that the decadal variability described by LTam-Titi in the Central Andes do not necessarily agree with decadal rainfall variability previously described in South America, usually related to PDO (e.g. Marengo 2004, Andreoli and Kayano 2005, Garreaud et al 2008, Seiler et al 2013). Table S1 also shows a significant correlation between LTam-Titi and ENSO Modoki Index (EMI). EMI is computed using three zones of the tropical Pacific, including western, central and eastern equatorial Pacific Ocean (Ashok et al 2007). However, according to figure 3(a) significant correlation between low frequency SST and LTam-Titi only appears in the central-western tropical Pacific Ocean, suggesting a different spatial structure than EMI in the equatorial Pacific.

Figure 3. Correlation maps of the low frequency variability of the Tambo-Titicaca index (Tam-Titi) with low frequency variability (periods >8 years) of: (a) sea surface temperature (SST; 1956–2014) and (b) zonal wind at 200 hPa (U200; 1966–2014). Positive (solid lines) and negative (dashed lines) coefficients of Pearson correlation are shown in (a) and (b). Coefficient of determination (R2) of grids, where correlation is significant at 95% (p = 0.05), are shaded in (a) and (b). (c) Density power spectrum (black line) of the central-western Pacific SST (180 °W-150 °W; 2.5 °S-15 °N; 1956–2014) and red noise (red dashed line) at 0.90 significance; (d) the same as (c), but for U200 over the Central Andes (75 °W-66 °W; 20 °S-15 °S; 1966–2014). (e) Standardized values of the low frequency variability (periods > 8 years) of the average of: SST (blue line) in the central-western Pacific, zonal winds at 200 hPa (blue line) over the Central Andes and Tam-Titi (black line). Note that SST and U200 are multiplied by −1 in (e).
Download figure:
Standard image High-resolution imageLow frequency of zonal wind at 200 hPa (U200) above the central Andes explains between 45% and 75% of the variance of LTam-Titi (figure 3(b)). The low frequency of the U200 is therefore related with LTam-Titi at a decadal–interdecadal time scale, and the relationship between them is negative (figures 3(b) and (e)). During decades when the low frequency of U200 has negative (positive) anomalies, more (less) precipitation is expected, and high (low) values of LTam-Titi are observed. Decades with high (low) LTam-Titi values appear to be characterized by strong intensity of easterly (westerly) wind anomalies. These results are consistent with Garreaud et al (2003), which showed that U200 over the Central Andes plays an important role in the variability of precipitation at seasonal and interannual time scales in this region, since easterly anomalies carry moisture from the inner part of the continent. Nevertheless, our results reveal that decadal–interdecadal variability of U200 above the Central Andes also controls low frequency rainfall variability over this region.
A DPS analysis of SST over the central-western tropical Pacific and U200 over the Central Andes shows that both indices are dominated by decadal–interdecadal variability with significant values of between 8 and 14 years (frequency between 0.125 and 0.07 years−1), which coincide with the Tam-Titi DPS (Figures 3(c) and (d)). Extracting the low frequency time series of SST over the central-western Pacific Ocean (180 °W-150 °W; 2.5 °S-15 °N) and U200 over the Central Andes (75 °W–66 °W; 20 °S–15 °S), and comparing with LTam-Titi, figure 3(e) shows that years with high (low) values of LTam-Titi are characterized by negative (positive) anomalies of both low frequency SST over the central-western Pacific Ocean and U200 over the Central Andes. Indeed, during cold (warm) periods of low frequency SST, normalized anomaly of low frequency U200 and LTam-Titi are −1.04 (0.94) and 0.78 (−0.83), respectively (table 2). These anomalies are significantly different comparing to the long-term mean values of low frequency U200 and LTam-Titi, according to a t-test at p < 0.01. This result suggests that cold (warm) periods of low frequency SST enhance easterlies (westerlies) anomalies, which significantly increase (decrease) the rainfall over the central Andes (table 2).
Table 2. Periods of extreme warm (cold) low frequency sea surface temperature (SST) in the central west Pacific Ocean (180 °W-150 °W; 2.5 °S-15 °N), considering years of normalized SST values above (below) 0.5 (−0.5). Mean normalized anomalies for cold and warm periods of low frequency values of SST, zonal wind at 200 hPa (U200) over the central Andes (80 °W–70 °W; 19 °S–14 °S) and hydrolcimatic index in the central Andes (LTam-Titi) are indicated.
| Normalized anomaly | ||||
|---|---|---|---|---|
| Extreme SST low frequency conditions | Periods (years) | SST | U200 | LTam-Titi |
| Cold SST | 1972–1977; 1998–2001; 2008–2012 | −1.25 | −1.04* | 0.78* |
| Warm SST | 1967–1970; 1980–1981; 1989–1996; 2003–2006 | 1.14 | 0.94* | −0.83* |
*Values of U200 and LTam-Titi for warm and cold conditions are significantly different compared to their long-term mean according to t-test at p < 0.01.
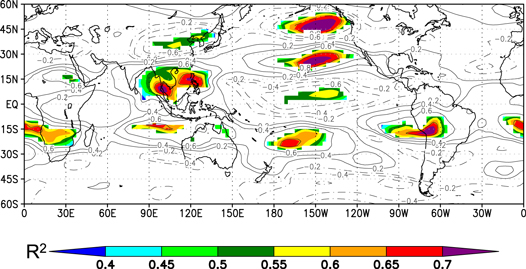
The relationship between SST in the central-western Pacific Ocean and the low frequency of U200 above the Andes is evaluated using a regression and correlation analysis (figure 4). The central-western Pacific Ocean explains 66% of the low frequency of U200 above the Andes and the relationship between them is positive; this means that during decades when the central-western Pacific Ocean is in a warm (cold) state, westerly (easterly) anomalies in low frequency variability of U200 are predominant above the Central Andes (figure 4).
Figure 4. Correlation map of low frequency variability (periods >8 years) of SST (180 °W-150 °W; 2.5 °S-15 °N; 1966–2014), with low frequency variability of zonal wind at 200 hPa (U200). Positive (negative) values of correlation are drawn in solid (dotted) line. In addition, coefficient of determination (R2, shaded) of grids that have a correlation with significance greater than 95% (p = 0.05) is shown.
Download figure:
Standard image High-resolution image
In addition, figure 4 shows significant correlation between SST in the central-western Pacific Ocean and zonal winds at 200 hPa over the southern Africa, southeastern Asia and the northeastern Pacific Ocean. In coherence with these signals, previous papers have documented decadal rainfall variability over these regions related to SST in the tropical Pacific Ocean. Indeed, Zhang et al (2015) document decadal rainfall variability over southern Africa modulated by SST in the central-western tropical Pacific. Zhu et al (2014) suggest decadal rainfall variability in southern China related to warming in the western Pacific Ocean and cooling in the eastern Pacific Ocean, which produces a strengthening of the Walker cell. Finally, Barlow et al (2001) point out that rainfall variability over south-western USA at decadal time scale is associated with SST in the central-western tropical Pacific Ocean. These results might suggest the role of decadal variability of SST in the central-western Pacific Ocean in modulating rainfall in several regions; nevertheless the atmospheric processes related to these teleconections are still not fully understood.
Discussion of the hydrological impacts of El Niño events
Extremely dry conditions occurred in the Central Andes during the 1982–83 El Niño ((Garreaud and Aceituno 2001; figures 1(c) and 2(b)); during the 1997–98 El Niño, however, which was one of the warmest El Niño events (MacPhaden 1999), the Central Andes did not show extremely dry conditions at all of the stations (figure 1(c)). Meanwhile, 1965, 1966, 1980, 1990, 1992 and 2005 were not classified as extreme El Niño years, but there were extremely dry conditions in Central Andes (figures 2(b) and 3(c)). These extreme impacts in the hydroclimate over this region can be explained by the low frequency modulation of LTam-Titi, since the years 1965, 1966, 1980, 1990, 1992 and 2005 fall within decades of lower LTam-Titi values (figures 2(b) and 3(e)). These results therefore suggest that low frequency variability plays a relevant role in modulating extreme hydrological impacts over the Central Andes.
Final comments
Analyzing annual hydrological data for the Central Andes and using density power spectral, we identified a significant decadal–interdecadal oscillation that controls the hydroclimatic variability of this region, which includes Peruvian and Bolivian Andes/Amazon and Altiplano and northern Chilean Andes. Following a regression analysis, our results suggest that the central-western tropical Pacific is the principal source of the decadal–interdecadal variability of the Central Andes, which influences low frequency variability of zonal wind at 200 hPa (U200) over this region. Decades characterized by cold (warm) conditions in the central-western Pacific Ocean are associated with easterly (westerly) anomalies of U200 over the Andes. These easterly (westerly) anomalies enhance (inhibit) conditions for precipitation over the Central Andes at a decadal–interdecadal time scale. The results provided in this study indicate that while El Niño plays a relevant role in modulating rainfall variability over central Andes at interannual time scale, central-western Pacific SST have a major influence at decadal–interdecadal time scale. Finally, our results suggest that the intensity of hydrological impacts over the Central Andes during El Niño events might be influenced by the low frequency variability of central-western Pacific SST and U200 over this region.
Acknowledgments
We thank the following agencies/organizations for providing access to data: the National Meteorology and Hydrology National Service (SENAMHI) of Peru, the National Meteorology and Hydrology National Service (SENAMHI) of Bolivia, and the Observation Service for the geodynamical, hydrological and biogeochemical control of erosion/alteration and material transport in the Amazon, Orinoco and Congo basins (SO-HYBAM) for the hydrological data set used in this study; and NOAA/OAR/ESRL PSD, Boulder, Colorado, USA (www.esrl.noaa.gov/psd/) for the NOAA_ERSST_V4 sea surface temperature and NCEP reanalysis zonal wind data. We also thank PNICP-Peru for providing funds through contract 397-PNICP-PIAP-2014. We are grateful to Dr Kobi Mosquera, Dr Ivonne Montes, Ing. Yakelyn Ramos and Ing. Francisco Segura for their assistance with the discussion of our results. We are grateful to Barbara Fraser for her contribution to improve this letter.