
Abstract
In this work we document and analyze the hydrological annual cycles characterized by a rapid transition between low and high flows in the Amazonas River (Peruvian Amazon) and we show how these events, which may impact vulnerable riverside residents, are related to regional climate variability. Our analysis is based on comprehensive discharge, rainfall and average suspended sediment data sets. Particular attention is paid to the 2010–11 hydrological year, when an unprecedented abrupt transition from the extreme September 2010 drought (8300 m3 s−1) to one of the four highest discharges in April 2011 (49 500 m3 s−1) was recorded at Tamshiyacu (Amazonas River). This unusual transition is also observed in average suspended sediments. Years with a rapid increase in discharge are characterized by negative sea surface temperature anomalies in the central equatorial Pacific during austral summer, corresponding to a La Niña-like mode. It originates a geopotential height wave train over the subtropical South Pacific and southeastern South America, with a negative anomaly along the southern Amazon and the southeastern South Atlantic convergence zone region. As a consequence, the monsoon flux is retained over the Amazon and a strong convergence of humidity occurs in the Peruvian Amazon basin, favoring high rainfall and discharge. These features are also reported during the 2010–11 austral summer, when an intense La Niña event characterized the equatorial Pacific.
Export citation and abstract BibTeX RIS
1. Introduction
The Amazonas River is the main western tributary of the Amazon, downstream from which the Solimões River begins in Brazil. At Tamshiyacu station, the most upstream gauging station on the Amazonas River, it drains a large area of 750 000 km2, 50% of which lies in the Andes above 500 m (figure 1(a)). The long term mean discharge at this station is 32 000 m3 s−1, about 16% of the Amazon discharge at the estuary (Espinoza et al 2006, 2009a). Its total suspended sediment yield is estimated at 395 × 106 t yr−1 (Guyot et al 2007), which represents around 60% of the sediment discharge at Óbidos, the most downstream gauged station on the Amazon River (Guyot et al 2005, Martinez et al 2009). While the historical lowest discharge (8300 m3 s−1) was reported in the Amazonas River during the 2010 austral spring (Espinoza et al 2011b), an unprecedented discharge increase occurred during the subsequent summer and autumn. Between 1st February and 15th April, the water level at Tamshiyacu station increased by 7 cm d−1. It generated a flood in late April 2011 (49 500 m3 s−1), which has been among the four highest floods on records (figure 1(b)) and led the Peruvian authorities to declare a state of emergency (e.g. Decreto Supremo N°033-2011-PCM). In this study, we aim to document these hydrological annual cycles characterized by extremes in discharge at Tamshiyacu station, in particular by high amplitudes between low and high flows, and to show how they relate to climate variability. Especially, we aim to report and analyze the exceptional 2010–11 hydrological year.
In recent decades, several extreme hydrological events occurred in the Amazon region. Among them, two of the most severe droughts were reported during 2005 and 2010, which were harmful for agriculture, ecosystems and caused massive forest fires (e.g. Phillips et al 2009, Lewis et al 2011, Xu et al 2011, Fernandes et al 2011, Davidson et al 2012). In both cases, dry conditions were particularly intense in the western Amazon (Marengo et al 2008, Espinoza et al 2011b). Also, heavy floodings were reported in the central part of the Amazon basin in 1999 and 2009 (Chen et al 2010, Marengo et al 2011b). An increase of the frequency of extreme hydrological events in the Amazon basin is thus observed since the end of the 1980s (Espinoza et al 2009a), which is coherent with the hypothesis that extreme droughts may become more frequent and intense because of a future climate change (Cox et al 2008).
Droughts are generally associated with positive SST anomalies in the tropical North Atlantic during austral autumn and winter, an anomalous northward position of the ITCZ, weak trade winds and water vapor transport towards the Amazon basin (Zeng et al 2008, Marengo et al 2008, Yoon and Zeng 2010, Marengo et al 2011a, Espinoza et al 2011b, Lavado et al 2012). El Niño events can also produce dry conditions during the austral summer, especially in the northeast of the basin (e.g. Uvo et al 1998, Ronchail et al 2002) and exceptionally in the western Amazon (e.g. in 1998 and 2010) (Espinoza et al 2011b). In contrast, during La Niña, abundant rainfall and flooding occur during the austral summer in the north and northeast of the Amazon region (Marengo 1992, Ronchail et al 2002, Espinoza et al 2009a, 2009b). In addition, the meridional tropical Atlantic SST gradient influences the ITCZ migration, and large positive SST anomalies in the tropical South Atlantic, especially in late summer and autumn, can produce abundant rainfall and floods, as occurred in 2009 in the central Amazon region (Marengo et al 2011b). In the western Amazon basin, however, the climatic origins of abundant rainfall that may lead to flooding remain poorly documented.
2. Data description
Daily river discharge data are available for seven gauging stations located in the Peruvian Amazon, most of them during the 1989–2011 period. Requena station on the Ucayali River and San Regis station on the Marañón River, which enable the analysis of the southern and northern rivers contributions (figure 1(a)), have short records, for the 1997–2011 and 1999–2011 periods, respectively. In Tamshiyacu station (figure 1(a)), daily discharge is available for the 1984–2011 period; however, monthly discharge was extended to the 1970–2011 period using correlation analysis with the water level data measured at the nearby Iquitos hydrometric station (Espinoza et al 2006, 2011b). Average monthly rainfall for the Tamshiyacu basin (figure 1(c)) was determined from monthly rainfall data available at 234 stations (figure 1(a)) for the period 1963–2008 (Espinoza et al 2009b, 2011b). In addition, the variability of average suspended sediments (ASS) concentrations at San Regis and Tamshiyacu stations is also investigated during the extreme 2010–11 hydrological annual cycle. Samples of water were taken every 10 days and ASS estimated for the 2004–11 period. More details about ASS data are given in Guyot et al (2007), Martinez et al (2009), Espinoza Villar et al (2012). Discharge and ASS data analyzed in this work were obtained from the Hydrogeodynamics of the Amazon Basin Observatory (ORE-HYBAM, www.ore-hybam.org) and the rainfall dataset from the Peruvian and Ecuadorian hydro-meteorological services (SENAMHI, www.senamhi.gob.pe and INAMHI, www.inamhi.gov.ec, respectively).
Climate variability is analyzed using the global monthly SST data (Reynolds and Smith 1994), which is available at CPC–NOAA (www.cpc.ncep.noaa.gov). We also examined the 2.5° × 2.5° resolution horizontal and vertical winds, 850 hPa geopotential height and humidity data from NCEP–NCAR reanalysis (Kalnay et al 1996) to describe the atmosphere characteristics. These data were obtained from the NOAA data server. The vertically integrated water vapor flux is derived from the specific humidity and the horizontal wind between the ground and 300 hPa (Peixoto and Oort 1992). Climatic anomalies are computed considering the 1970–2011 period.
3. High discharge amplitude in the Amazonas river
The hydrological annual cycle at Tamshiyacu basin is the result of several rainfall regimes in this region (Espinoza et al 2009b, 2011b). The cycle is characterized by high rainfall during October–April, with a maximum in February–March. Maximum discharge occurs one to two months later (figure 1(c)). Moreover, mean rainfall and discharge at Tamshiyacu station are strongly correlated (r = 0.91) at interannual time step (Espinoza et al 2006, 2011b). The correlation is higher than on the main stem of the Amazon (r = 0.71 (Callède et al 2004)), as the effect of rainfall on discharge is more direct when considering a smaller basin (Tomasella et al 2010). The ASS annual cycle shows a weak correlation with the river discharge as the ASS concentration increases much more rapidly than the discharge. It shows a peak in February, at the beginning of the high rainfall period. This peak is probably related to enhanced erosion favored by the relatively low vegetation coverage after the dry season and the beginning of the high rainfall period (figure 1(c)).
In this study, we analyze the years characterized by strong discharge increase rates (dir) defined as the difference between high and low discharge during the intense discharge increasing period, from 1st February to 15th April, divided by the number of days between the two dates (figure 1(c)). Four years, 1986, 1997, 2000 and 2011 show strong dir with values that are higher than 200 m3 s−1 d−1 (figures 1(b) and 2(a)). The year 2002 is not taken into account because its high dir is related to a short period (∼15 days) of low waters at the end of January. The referred four years are characterized by large periods with discharge lower than normal during the first part of the hydrological cycle and by a discharge higher than normal afterwards (figure 1(b)). Among them, 2011 shows negative discharge anomalies during the whole beginning of the annual cycle from September to March. Consequently, it presents the highest dir (>300 m3 s−1 d−1) in association with the transition from the historical 2010 drought to the high 2011 flood in Tamshiyacu station (figure 1(b)). This unusual transition is also observed in ASS concentrations at Tamshiyacu station, where the lowest (130 mg l−1) and the very high (1150 mg l−1) mean monthly value were observed in October 2010 and February 2011, respectively (figure 1(d)). The concomitant extremes in dir and ASS concentrations are remarkable during 2010–11, considering that ASS and discharge are weakly correlated (Martinez et al 2009). In addition, high ASS observations during February 2011 can be explained by the exceptional decline in greenness during the 2010 drought, which caused loss of vegetation cover on a large portion of the northwestern Amazon (Xu et al 2011). At San Regis station on the Marañón River (the main northwestern tributary of the Amazonas River, figure 1(a)), discharge amplitude has been unprecedented during 2010–11 (figure 2(a)). Discharges attained the lowest (5500 m3 s−1) and highest (26 200 m3 s−1) values of the 1999–2011 period, during October and April, respectively (figure S1(a) available at stacks.iop.org/ERL/7/024008/mmedia). In this station, ASS observations also described a short transition between the lowest and the very high values during September–October and January–February, respectively (figure 1(e)). On the other hand, the Ucayali River (the southern tributary of the Amazonas River) at Requena station (figure 1(a)) shows the lowest discharge value in September–October 2010 but the austral summer value has been near normal (figure S1(b) available at stacks.iop.org/ERL/7/024008/mmedia). These results suggest that discharge and rainfall in the Amazonas basin were particularly intense over the northwest part of the basin during summer 2011.
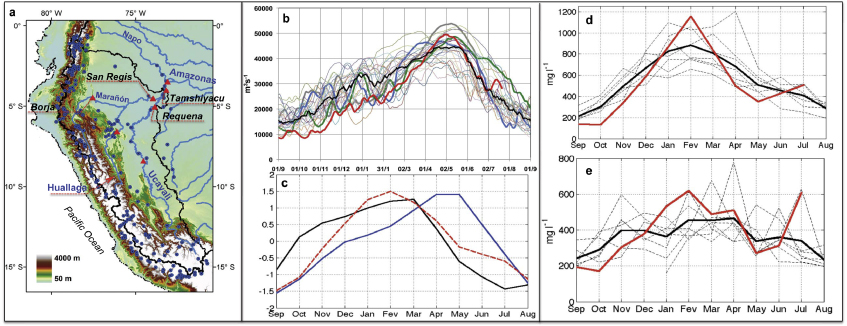
Figure 1. (a) Hydrological and rainfall stations used in this work are represented by red triangles and blue circles, respectively. The names of the main rivers are indicated. (b) Annual hydrological cycle at Tamshiyacu station for 2010–11 (red line), 1999–2000 (green line), 1996–97 (blue line), 1985–86 (gray line) and median (black line). (c) Annual cycle of mean rainfall (1963–2008, black line), discharge (1970–2011, blue line) and average suspended sediment (2004–11, red) at Tamshiyacu station. Values are standardized. (d) Average suspended sediment for the 2004–11 period at Tamshiyacu station. The monthly mean values and the 2010–11 values are indicated with black and red lines, respectively. (e) As (d), but for San Regis station.
Download figure:
Standard image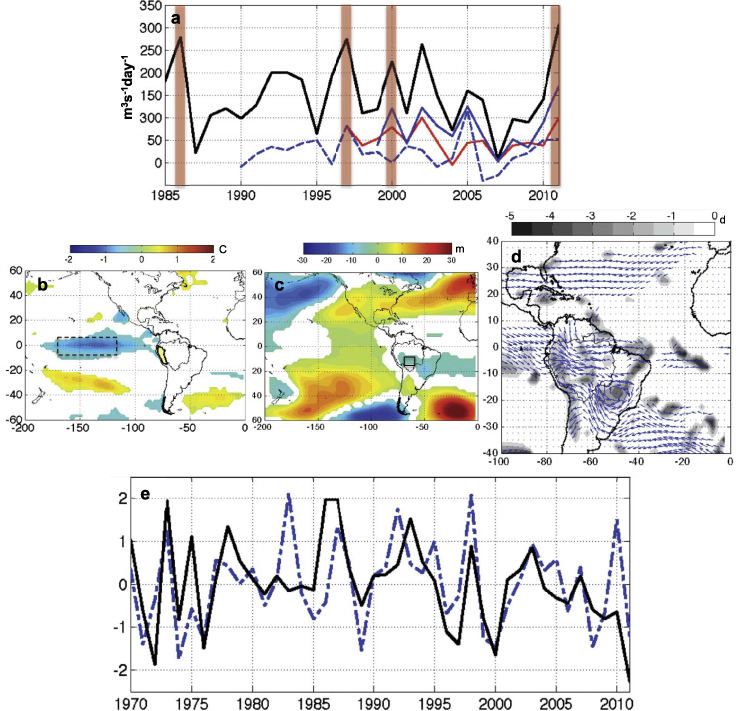
Figure 2. (a) Discharge increase rate (dir, m3 s−1 d−1) between 1st February and 15th April at Tamshiyacu (black line), Requena (red line), San Regis (blue line) and Borja (blue-dashed line). The vertical red bars indicate the year with high dir. Composites of January–February–March 1986, 1997, 2000 and 2011 anomalies for (b) SST (°C), (c) 850 hPa geopotential height (m) and (d) vertically integrated water vapor flux anomalies (vectors, kg m−1 day−1) and negative divergence standardized values (contours, without unit) between the ground and 300 hPa. Only values higher than 1 × standard deviation are plotted (2 ×standard deviation for SST data). (e) Mean January–February–March SST in Niño 3.4 region (blue line) and mean geopotential height in a 60W–70W, 10S–15S box (black line). Both regions are shown in (b) and (c) with black boxes. The values are standardized.
Download figure:
Standard image4. Climate features during high discharge amplitudes
Composites of January–February–March (JFM) anomalies (1970–2011) for SST, 850 hPa geopotential height and vertically integrated humidity fluxes between 1000 and 300 hPa are computed for the four events with an extreme dir (figure 2(a)). These events are characterized by negative SST anomalies in the central equatorial Pacific ( − 1.5 °C between 100–170°W), depicting a Niña-like situation, while no major signal is observed in the Atlantic Ocean (figure 2(b)). Positive geopotential height anomalies are predominant in the subtropical Pacific, on both sides of the cold surface, the southern one extending over southern South America. On the contrary, negative anomalies are observed along the portion of the SACZ between the Atlantic coast and the Amazon basin (figure 2(c)). These successive geopotential anomalies suggest the usual teleconnection pattern between the equatorial Pacific and the South East of South America (e.g. Vera et al 2004, Grimm and Zilli 2009). Consistently with this geopotential pattern, the South American Low-Level Jet (SALLJ) and the monsoon flux towards La Plata basin are reduced and humidity is maintained in the western Amazon basin (figure 2(d)). This is coherent with (Marengo et al 2004) who shows that the SALLJ is weakened during La Niña. These humidity anomalies favor convergence (figure 2(d)), convection and intense rainfall in the western Amazon (e.g. Liebmann et al 1999, Espinoza et al 2011a). At an interannual time-scale, a significant positive relation is observed between Niño 3.4 SST and the geopotential height in the southern Amazon, confirming the teleconnection between equatorial Pacific and tropical South America (figure 2(e)). It appears that during the last forty years low geopotential height values (1997, 2000, 2011) correspond to La Niña events and high discharge amplitudes. Finally, during La Niña event of 2011, the absolute lowest 850 hPa geopotential height anomaly is recorded concomitantly with the highest dir at Tamshiyacu (figure 2(a)).
5. The particular 2010–11 hydrological transition
Mean SST, 850 hPa geopotential height and humidity transport fluxes anomalies are computed for three-month periods for July–September 2010, the very dry period, which corresponds to the lowest discharge at Tamshiyacu, for October–December 2010 and also for January–March 2011, which precede the 2011 flood. July–September 2010 is characterized by high SST in the northern tropical Atlantic and reduced humidity flux towards northern Amazon (figures 3(a), and (c), contributing to explaining the dramatic 2010 drought in western Amazon, when 170 mm instead of 280 mm have been registered between July and September 2010, producing a difference by twice the standard deviation (for more information, see Espinoza et al 2011b, Lewis et al 2011). During the austral spring, the Atlantic SST anomaly weakens and is displaced towards the African coast, while La Niña signal that had begun in July–September, amplifies (figure 3(d)). Negative geopotential height anomalies appear from the Amazon to the subtropical southern Atlantic and over the tropical north Atlantic (figure 3(e)). The negative anomalies over the North Atlantic favor a cyclonic circulation and, consequently, eastward humidity flux anomalies are predominant near the Equator (see figures 3(e) and (f)), avoiding an intense transport of humidity towards the Amazon, producing low rainfall and explaining negative discharge anomaly (figure 1(b)). These results are also consistent with a larger than normal dry period in 2010 noticed by (Marengo et al 2011a). In summer 2011, La Niña conditions are still observed and negative SST anomalies are confined in the central equatorial Pacific (figure 3(g)). These conditions support a westward displacement of the mid-latitude geopotential wave train and a positive geopotential height anomaly on the southern part of South America (figure 3(h)), which favors southern winds anomalies towards the southern Amazon (figure 3(i)). This feature, in association with the expansion of negative geopotential height anomalies over the southwestern Amazon and with the deviation of the trade winds by the Andes, enhances the convergence in the western Amazon. (Figures 3(h) and (i).) This pattern of atmospheric circulation has been already associated to strong rainfall in the western Amazon basin at submonthly time-scale (e.g. Liebmann et al 1999, Espinoza et al 2011a). Moreover, the disappearance of the negative geopotential height anomalies in the Azores region, corresponding to a geopotential height increase, cancels the eastward water vapor flux anomalies over the Atlantic, favoring on the contrary a westward transport (figure 3(h)). It results in no water vapor flux anomalies in this region or in anomalies directed towards the continent (figure 3(i)). This permits a near normal supply of humidity to the Amazon basin and finally convergence together with rainfall and high discharge, as already described (figure 3(i)).
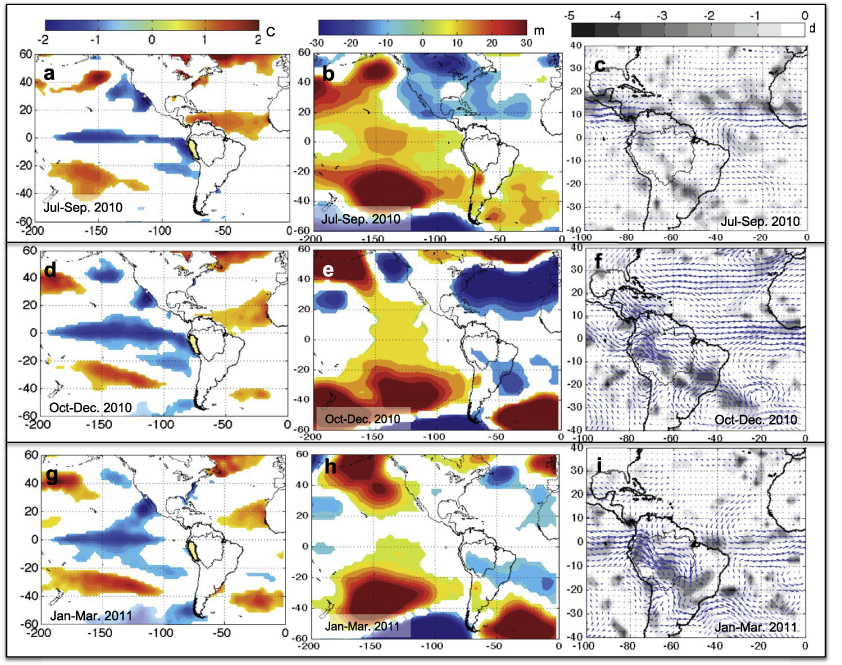
Figure 3. SST (°C, left), 850 hPa geopotential height (m, center), vertically integrated water vapor flux anomalies (vectors, kg m−1 day−1, right) and negative divergence standardized values (contours, without unit) between the ground and 300 hPa (right) in (a)–(c) July–August–September 2010, (d)–(f) October–November–December 2010, (g)–(i) January–February–March 2011. Only values higher than 1 ×standard deviation are plotted (2 × standard deviation for SST data).
Download figure:
Standard image6. Concluding remarks
During the 2010–11 hydrological cycle, the highest discharge increase rate of the 1984–2011 period has been reported in the Amazonas River. It is related to an unprecedentedly abrupt transition from the extreme drought in September 2010 to one of the four highest discharges in April 2011. This unusual transition is also observed in average suspended sediments, which present the lowest and highest concentrations in October 2010 and February 2011, respectively. Years characterized by a rapid increase in discharge during the annual hydrological cycle are related to negative SST anomalies in the central equatorial Pacific during the austral summer, corresponding to a La Niña-like mode. It originates a geopotential wave train over the subtropical South Pacific and southeastern South America, producing a negative geopotential anomaly along the portion of the SACZ between the Atlantic coast and the southern Amazon basin. Consistent with this geopotential pattern, the monsoon flux and humidity are maintained in the western Amazon basin. The 2011 austral summer is characterized by an intense La Niña event in the central equatorial Pacific and the lowest geopotential height in the southern Amazon region. Consequently, a strong convergence of humidity and rainfall occurred in the western Amazon.
While previous works demonstrated the influence of the tropical North Atlantic on extreme drought in the western Amazon basin, during the austral winter and spring, this work reveals that SST variability in the central equatorial Pacific contributes to modulating floods intensity during the austral summer season when the ENSO signal-peak occurs.
Acknowledgments
We are grateful to the two anonymous reviewers and to Léa Thalmard for their contribution to improve this letter.