


Abstract
Windthrows (trees uprooted and broken by winds) are common across the Amazon. They range in size from single trees to large gaps that lead to changes in forest dynamics, composition, structure, and carbon balance. Yet, the current understanding of the spatial variability of windthrows is limited. By integrating remote sensing data and geospatial analysis, we present the first study to examine the occurrence, area, and direction of windthrows and the control that environmental variables exert on them across the whole Amazon. Windthrows are more frequent and larger in the northwestern Amazon (Peru and Colombia), with the central Amazon (Brazil) being another hot spot of windthrows. The predominant direction of windthrows is westward. Rainfall, surface elevation, and soil characteristics explain the variability (20%–50%) of windthrows but their effects vary regionally. A better understanding of the spatial dynamics of windthrows will improve understanding of the functioning of Amazon forests.
Export citation and abstract BibTeX RIS
1. Introduction
Amazon forests absorb and store large amounts of atmospheric CO2, thereby mitigating the warming effects of this greenhouse gas [1–3]. Tree mortality in the Amazon has increased [4, 5], and is expected to increase in a warming environment [6]. Drivers of tree mortality include, among others, deforestation [7–9], fires [10, 11], droughts [12–14] and severe storms [15–19], and these drivers are expected to become more frequent and intense [12, 20, 21]. Increases in tree mortality raise concerns due to the associated changes in carbon storage, forest structure, floristic composition and functioning of forest ecosystems [14, 22–24] and their legacies including loss of ecosystem resilience [18, 25]. This mortality has already shifted some areas to be sources of CO2 in the Amazon [7, 26]. Drivers of natural tree mortality in the Amazon are poorly studied and represent a key missing component of the overall tree mortality trend found in the Amazon [5].
Extreme rainfall events are a distinctive characteristic of the Amazon. These events are produced by mesoscale convective systems (MCSs) [27, 28]. Associated with MCSs are downdrafts [17, 18, 29], which are strong winds that descend from these systems [30] that can produce windthrows (trees uprooted and broken by winds [31]) when they reach the forest [30]. Windthrows in the Amazon are a recurrent form of tree mortality, ranging in size from single trees [14, 32, 33] to large gaps of uprooted and broken trees that can reach thousands of hectares [16, 18, 34–36]. Lightning is another driver of tree mortality associated with extreme rainfall that produces gaps from 3 to 11 down trees [37, 38]. Previous studies have shown that soil type, soil organic carbon (SOC) and soil nutrients have a positive association with forest gaps [37, 39, 40]. On the other hand, the effect of topography on gaps of dead trees has contradictory effects, related not only to the type of disturbance but to the spatial scale of the analysis [40–42]. These studies suggest that controls of windthrows across the Amazon remain poorly quantified.
Changes in extreme rainfall events have the potential to alter the frequency and intensity of windthrows and related tree mortality. Despite the importance of windthrows in forest dynamics and carbon storage of the Amazon, few studies have focused on windthrow characteristics across the whole Amazon. By using Landsat images and geospatial analysis, here we present the first study of windthrow characteristics across the whole Amazon and identify (a) spatial patterns of the occurrence and size of windthrows, (b) direction of windthrows, (c) regional differences of windthrows, and (d) effects of environmental variables on the occurrence of windthrows.
2. Method and data
2.1. Study area and windthrows detection, size and direction
The study area is the Amazon rainforest (5.65 × 10⁶ km2) [18]. We used 392 Landsat 8 images (each image covering ∼3.4 × 10⁴ km2, and 30 m × 30 m of spatial resolution) with low cloud cover (<20%) from 2018 and 2019 (see supplementary figure S1). Windthrows were identified by their spectral characteristics [17] and distinctive fan-shape diverging from a central area [35]. To identify windthrows, spectral mixture analysis (SMA) [43] was applied to bands 2–7 in Landsat 8 images. SMA quantifies the per pixel fraction of endmembers which sums to match the full pixel spectrum of the image [43]. Image-derived endmembers of photosynthetic vegetation (PV), non-photosynthetic vegetation (NPV), and shade were used. One set of endmembers was used to identify windthrows across the whole Amazon (figure S2). The fractions of PV and NPV were then normalized without shade as PV/(PV + NPV) and NPV/(PV + NPV) [44]. The normalized NPV and PV images were used to identify new and old windthrows, respectively. Each identified windthrow was verified using historical Landsat images dating back to 1984. Windthrows were visually verified for their fan-shape (diverging from a central area with small pixels scattered at the tail). For this task we used a band combination RGB as shortwave infrared (1.57–1.65 μm), near infrared (0.85–0.88 μm) and red (0.64–0.67 μm). In this band composition, old windthrows look bright green (due to the presence of pioneers that reflect more near infrared [45]) and new windthrows (<1 year old) look red (due to high shortwave infrared reflectance from exposed bare wood) (figure S3). The 2018–2019 Landsat images used encompass new windthrows as well as old windthrows in the Amazon for a period of ∼30 years since the Landsat reflectance recover to pre-disturbance conditions in about 40 years in the central Amazon [45, 46] and about 20 years in the western Amazon [47]. We only considered windthrows that were further than 5 km from human settled areas. In total we identified 1116 windthrows.
To determine windthrow area, the main gap of each windthrow was manually delineated by a triangle with one vertex in the beginning of the fan-shaped windthrow and the other vertices at the extreme ends of the fan (figure S3). The area of the windthrow was determined by the area of its respective triangle. The selection of Landsat 8 images (Landsat 8 Collection 2 Tier 1 calibrated top-of-atmosphere, TOA, reflectance) with less than 20% of cloud cover, the SMA analysis, the delineation of the windthrows area, and the calculation of their area with their respective centroid were done in the Google Earth Engine (GEE) platform [48] that provides tools and algorithms for these tasks. Only windthrows larger than 5 ha were used in our analysis. The direction of the windthrow was determined from the vertex (tail) representing the beginning of the fan-shaped windthrow to the middle of the side connecting the other vertices (figure S3). We used the geographic convention of true north as 0° with the angle increasing clockwise.
2.2. Environmental data
2.2.1. Rainfall data
We used the Tropical Rainfall Measuring Mission (TRMM) Multi-Satellite Precipitation (TMPA) rainfall Level 3 V7 0.25° × 0.25° 3 h (3B42) and monthly (3B43) data [49] from 1 January 1998 to 31 December 2018, available at https://disc.gsfc.nasa.gov/datasets/. TRMM data compare well with observations in tropical forests [50, 51]. The TRMM satellite stopped collecting data in 2015. TRMM-like data were processed using the successor satellite, the Global Precipitation Measurement [49, 52] until 2019. The mean annual number of extreme rainfall rate events (MANERR) per pixel was calculated using TRMM 3B42 by adding the number of rainfall rate events ⩾6 mm h−1 (extreme rainfall produced by MCSs [28]) per pixel and dividing this total by the number of years used. TRMM 3B43 was used to calculate the mean annual rainfall (MAR) as the average of total annuals. Dry season length was calculated from TRMM 3B43 data by computing the mean monthly rainfall and from there the number of months with rainfall ⩽100 mm per month [53].
2.2.2. Soil classification
Variations of physical and chemical properties of soil strongly affect trees and root growth [54, 55], and therefore might affect the response of trees to winds. The Harmonized World Soil Database (HWSD) v1.21 [56] was used to determine the soil classification. The HWSD is a 30 arc second (∼1 km) resolution dataset that combines current regional and national-level soil data from around the world. The data are available at www.fao.org/soils-portal/data-hub/soil-maps-and-databases/harmonized-world-soil-database-v12/en/.
2.2.3. Soil properties
The SOC pool is driven by the rates of organic inputs [54, 57] of decomposition that in turn facilitate nutrient availability such as nitrogen and phosphorous. Disturbances can result in a dramatic increase in organic matter inputs into soils [58, 59] with associated effects on soil nutrients. Previous studies have shown that soil carbon and nutrients decay exponentially with depth in the Amazon, with the upper 15 cm having the highest values [54]. Therefore, we used SOC and soil organic nitrogen (SON) from these layers. SOC and SON were obtained from SoilGrids 2.0 which is a global digital soil mapping database with a spatial resolution of 250 m and multiple depths [60]. These data are available in GEE (https://git.wur.nl/isric/soilgrids/soilgrids.notebooks/-/blob/master/markdown/access_on_gee.md).
2.2.4. Elevation
Tree mortality varies inversely with surface elevation [61, 62]. Soil elevation data is from Advanced Land Observing Satellite (ALOS) World 3D (AW3D30) Version 3.2 which is a global digital surface model (DSM) with a horizontal resolution of 30 m (1 arcsec) [63]. The Japan Aerospace Exploration Agency (JAXA) generated these global digital elevation/surface model (DEM/DSM) and orthorectified images using the archived data of the Panchromatic Remote-sensing Instrument for Stereo Mapping onboard ALOS. These data are available in GEE (ee.ImageCollection("JAXA/ALOS/AW3D30/V3_2")).
2.2.5. Landform classification
Landform classification data is from height above the nearest drainage (HAND) and provides the vertical distance from hillslope to nearest stream [64, 65]. HAND could be an indicator of whether windthrows are more or less likely in areas of low or high elevation. The HAND data used a one arc-second (∼30 m) resolution version of Shuttle Radar Topography Mission [66]. The data are available in GEE (users/gena/global-hand/hand-100).
2.2.6. Temperature
Trees respond to their climate. The association between tree gaps and temperature is investigated through the mean annual temperature (MAT) (1998–2018). MAT data is from the Climatic Research Unit Version 4, CRU v4 which has a spatial resolution of 0.5° and is derived from the interpolation of monthly data from an extensive network of weather stations [67]. The data are available at https://crudata.uea.acuk/cru/data/temperature/.
2.2.7. Canopy height
The proportion of trees exposed to wind is related to their height. We used data derived from global spaceborne lidar available at a spatial resolution of 1 km using 2005 data from the Geoscience Laser Altimeter System aboard Ice, Cloud, and land Elevation Satellite [68]. The data is available in GEE (ee.Image("NASA/JPL/global_forest_canopy_height_2005")).
2.2.8. Wind speed
Horizontal wind speed data are from ERA5 (European Centre for Medium-Range Weather Forecasts Reanalysis v5) which has a detailed record of atmospheric, land surface and ocean measurements from 1950 onward at a horizontal resolution of 0.1° [69]. We used the average land monthly data of the 10 m u- and v-wind components (in ms−1) for the period 1998–2018. u is the component of wind parallel to the x-axis and v is the component of wind parallel to the y-axis. The u and v wind components were averaged separately to obtain the mean annual component where the annual average wind speed was calculated (wind speed =  ). Data is available at www.ecmwf.int/en/forecasts/datasets/reanalysis-datasets/era5.
Table S1 summarize the data used. Figure S4 shows the suite of environmental data in our study area.
2.3. Procedures
2.3.1. Density of windthrow occurrence and size
Our study focuses on the regional variation of windthrows over the entire Amazon, therefore we used a spatial resolution of 0.1° to capture the variation across different regions in the Amazon, a desirable characteristic when choosing spatial resolution [70]. Using 0.1° resolution, we found that 934 individual windthrows were inside one grid cell, in 81 cases two windthrows coincided in one cell, and in 7 cases three windthrows. When windthrows coincided in the same grid cell then only one windthrows was randomly selected. After this procedure we had one windthrows per cell, totaling 1022. The density of the occurrence of windthrows and their sizes were calculated by applying a kernel density estimator [71] using the System for Automated Geoscientific Analyses geospatial library available in Quantum Geographic Information System (QGIS, version 3.10 that is freely available at https://qgis.org) using a quartic kernel with 1° radius and resampled to 0.1°.
2.4. Windthrows and environmental data
The environmental data were resampled to 0.1°, to match the windthrow density resolution. The resampling used the cubic spline resampling method on all datasets except for the Soil Classification data which was resampled using the nearest neighbor method, a common practice for categorical data [70]. The resampling was done in QGIS. The spline resampling method produces reliable resampling results for climate [72] and topographic [73] data. The environmental data used here are the best data currently available for the Amazon and properly represent the climatic, edaphic, topographic, and forest structural characteristics observed in the Amazon [74]. The availability and continuous improvement of these data are key to understanding the dynamics of this ecosystem.
2.4.1. Spatial autocorrelation, regionalization, and spatial regression
Each windthrow was used to locate the associated density and respective environmental variables. We used Moran's I [75] to measure the global spatial autocorrelation of the data. Windthrows are multivariate processes because they are affected by numerous factors. In order to analytically identify spatial patterns of windthrows and their environmental variables, we used regionalization. Regionalization uses unsupervised learning methods to identify spatial structures of multivariate processes and aggregates areas into contiguous regions that have internal homogenous characteristics with all regions being statistically different among them [76–78]. Prior to regionalization, the data were standardized using a robust scaling method, where each variable has the median subtracted and divided by the interquartile range (the difference between the 75th and 25th percentiles) [79]. The spatial criterion is structured by spatial weight. We used two spatial weights matrices, the queen contiguity matrix (Queen) where observations are connected to neighbors they touch, and the k-nearest neighbor matrix (KNN) where observations are connected to their fourth nearest observations. For the regionalization we used the Ward's hierarchical method, an agglomerative hierarchical clustering method that minimizes the total within-cluster variance [80]. We used the Calinski-Harabasz score (CH) [81] to assess the goodness of fit for the regions obtained. Higher CH values indicate better fits [81].
A spatial regression was performed using the density of windthrows occurrence (hereafter referred to as windthrow density) as the independent variable (predictant). We used a spatial regression model based on ordinary least squares to compute the regression coefficients. To assess the spatial dependence, we used the Lagrange multiplier (LM) (lag and error) statistics. If Lagrange statistics were not significant then we used Robust LM (lag and error) statistics. If Robust lag was significant and Robust error was not, then a spatial error model was used, in the opposite case a spatial lag model was used. In the case that statistics were significant then the statistic with highest value was used. Details of the statistical flow used in this study are found in Anselin and Rey [82]. The regionalization and spatial regression were done using the Python Library of Spatial Analytical Methods, PySAL [83].
3. Results
3.1. Windthrows characteristics
The highest windthrow density (figure 1(A)) was observed in the northwestern (Peru and Colombia) and central (Brazil) Amazon, and regions with lower occurrence were observed in the northern (Venezuela, Guyana, Suriname and French Guiana), eastern (Brazil) and southern (Peru, Bolivia and Brazil) Amazon. The largest windthrows were observed in the northwestern Amazon followed by the central Amazon (figure 1(B)). We found that most windthrows (81% of cases) have a westward component (figure 1(C)). A map with the direction of each windthrow is shown in figure S5.
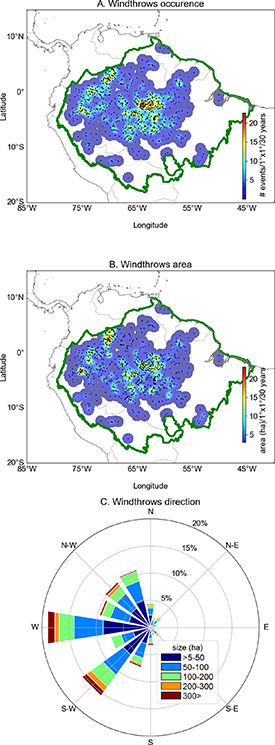
Figure 1. Characteristics of windthrows in the Amazon. The Amazon region is represented by the green contour line. Kernel density map for (A) windthrow occurrence and (B) windthrow area. (C) Direction in which windthrows are pointing according to the observed windthrows. Windthrow density map used a kernel of 1° radius and was resampled at 0.1°. Black dots in (A) and (B) represent the observed windthrows.
Download figure:
Standard image High-resolution image3.2. Regions of windthrows
Using regionalization analysis, we found the highest CH score (table S2) was using windthrow density, Elevation, SOC stock from 0–5 cm depth, and MAR (figure 2). The Moran's I value was >0.7 (p = 0.001) for these variables suggesting clear spatial structures with non-random distributions.

Figure 2. Environmental variables used to explain windthrow density in the Amazon. (A) Mean annual rainfall (MAR), (B) surface elevation, and (C) soil organic carbon (SOC) in the 0–5 cm soil layer.
Download figure:
Standard image High-resolution imageThe Queen weighting method yielded the best regionalization results (table S2). The four Regions obtained using this method are shown in figure 3 (results using the KNN method are in figure S6). The distribution profile of each variable for each Region is shown in figure S7. The number of windthrows contained in Regions 1, 2, 3, and 4 were 390, 291, 297, and 44, respectively. Using 5 regions we obtained CH scores of 256 and 277 using the Queen weighting and KNN methods, respectively.
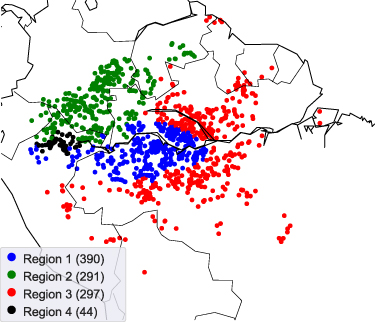
Figure 3. Windthrow regions in the amazon determined by a regionalization analysis. The regionalization analysis used the queen weighting method. The number of windthrows in regions 1–4 are 390, 291, 297, and 44, respectively.
Download figure:
Standard image High-resolution image3.3. Explanatory variables
Using the results from our regionalization analysis, we determined an association between windthrow density, the predictant, and predictors (Elevation, SOC stock from 0–5 cm, and MAR). No multicollinearity was observed in the models (table S3). The F-statistic showed that all models were significant and have predictive capabilities (probability < 0.05), except for Region 4 (probability = 0.5) (figure 4). The errors from the models with respect to observations were normally distributed around zero (figure S8), indicating no critical under- and over-estimates. The results showed that windthrows are positively correlated with MAR (except in Region 2), but vary inversely with Elevation (except in Region 4) and SOC. Overall, MAR and Elevation contribute the most (largest magnitude) in the prediction of windthrows. Across the whole Amazon the predictors explained 11% of windthrows density (figure 4(E)).

Figure 4. Comparison of observed versus modeled windthrow density for the four Regions determined through regionalization (figure 3), and the whole Amazon. All regressions were statistically significant (p < 0.05), except for Region 4 and the whole Amazon. Statistical details for all regions are shown in table S3.
Download figure:
Standard image High-resolution image
4. Discussions and conclusions
4.1. Windthrows characteristics
Windthrows were common from the rainy northwest to the dry southeast Amazon. The high occurrence of windthrows in the central Amazon is consistent with a recent study of small forest gaps in this region [40] and was not identified in previous studies [35, 36] that used a threshold windthrow size of 30 ha which might have underestimated the occurrence of windthrows. Only one study has focused on the spatial-temporal variability of windthrows in the central Amazon for the period 1998–2010 [84]. That study did not find an increase of windthrows, suggesting that if an increase has occurred it has happened after 2010. Nevertheless, an increase in windthrows would be consistent with the observed increase in tree mortality found in inventory plots across the Amazon [5] and could provide insights into the mechanisms underlying this trend. An increase in the frequency of windthrows in the central Amazon could promote changes in the regional floristic composition as shown in Negron-Juarez et al [18]. Our study included only windthrows >5 ha but windthrows cover a large spectrum of disturbances including single downed trees. Integration of field and remote sensing data (e.g. LiDAR, Landsat, etc), is needed in order to determine the fraction of tree mortality associated with winds in the Amazon. Such integration will provide a better understanding of the Amazon. For instance, by including wind induced tree mortality, we found that the forest dynamics associated with these events properly represent the values of biomass in the central Amazon [16]. Our results also showed a low number of MANERR in the northeastern Amazon (1.5° N, 53° W) (figure S4), an area where recent studies have found trees taller than 80 m [85].
Our study showed that windthrows in the Amazon have a preferential east to west direction (figure 1(C)). This direction coincides with the dominant direction of MCSs in the Amazon [27]. On the other hand, windthrows with an easterly direction are less frequent and can be related to the lower frequency of easterly MCSs [84]. These results suggest that MCSs are key drivers of windthrows and complement previous studies that found squall lines (i.e. aligned bands of MCSs) [86] to be the drivers of windthrows [17, 29, 84], despite the fact that squall lines are not common in the northwestern Amazon [86], a region where we found a large amount of windthrows.
4.2. Regionalization
Regions 1 and 3 were characterized by elevations < 300 meters above sea level and a lower number of extreme rainfall events than the western Amazon (figure 2(B)). These Regions appear to have the most severe storms across the Amazon as suggested by the high values of convective available potential energy [87], and more frequent lightning [88]. Observational studies have shown that during the wet season, rainfall occurs independent of elevation; however, differences on the order of 100 m in surface elevation could provide the forcing for cloud formation during the dry season [89]. Regions 2 and 4 are located in the northwest part of the Amazon, an area characterized by higher elevations, due to its proximity to the Andes. These two Regions had the largest values of MAR (and MANERR) because higher elevation favors higher rainfall. This is due to the subsidence of thermal heating which allows an increase in convection that organizes into MCSs [90]. However, the closer a region is to the Andes, the lower the rainfall, as rainfall decreases with elevation [91]. The patterns we report here require further investigation spanning temporal scales since trends in extreme rainfall have been observed across the Amazon due to deforestation and climate variability [92].
4.3. Regressions
Windthrow correlated positively with MAR. In general, rainfall can promote saturated soils that in turn limit the anchoring of trees making them more sensitive to winds [18]. Regions 2 and 4 have a high frequency of extreme rainfall events (figure S4), and a high occurrence of windthrows. Coincidently, in these Regions studies have shown a low tree residence time (high tree mortality) [22]. On the other hand Regions 1 and 3 appear to have the most severe storms [88] which might help to explain the high occurrence of windthrows in these Regions. In Region 2, maximum MAR values were observed in an area with low elevation in the border between Colombia, Brazil and Venezuela where the relief shape and concavity of the Andes promote air convergence and high rainfall [93, 94]. Associated with this high rainfall is cloud cover (figure S1) that might have influenced the low number of identified windthrows along the border between these countries.
Windthrows vary inversely with elevation. A decrease in tree mortality with elevation was found in the tropical forest of Borneo [95]. A decrease in tree mortality with elevation was also found in inventory plots in other tropical forests [42, 96]. Furthermore, observational studies have shown that wood density increases with elevation [95, 97–99], and therefore these trees are less vulnerable to winds [99, 100]. Similarly, trees in plateaus have deeper root systems [101, 102] resulting in stronger tree anchoring. These studies suggest that, apart from tree-soil interactions and differential exposure to wind gusts, variations in tree mortality across topography are likely to reflect the vertical heterogeneity of the forest canopy, as well as interactions among trees, lianas, and epiphytes, which can influence the mechanical stability and anchoring efficiency. In Region 4 windthrows vary positively with elevation but this effect is very small and was not significant. Our results corroborate the important and complex role of elevation on the occurrence of windthrows.
Windthrows vary inversely with SOC. The occurrence of windthrows implies the presence of dead trees and therefore SOC [59, 103] and nutrient availability [104] dependencies. Studies have shown that large amounts of rainfall promote accumulation of SOC [105, 106], explaining the large amounts of SOC in the northwestern Amazon (figure 2(C)). A decrease in SOC is observed from Regions 2 and 4, in contrast to the increases in windthrows in those regions (figure 1(B)). Similarly, an increase in SOC is observed from east to west in Regions 1 and 3 (figure 2(C)), in contrast to a high density of windthrows in the eastern-central part of the Amazon (figure 1(A)). These patterns explain the negative association between windthrows and SOC (table 1). Previous studies suggest that SOC, nitrogen (N) and phosphorous (P), are related [39, 107], suggesting that the effect of N and P on windthrows might be similar to that of SOC.
Table 1. Coefficients of environmental variables obtained from OLS regression. Full statistics results are shown in table S3. Non-significant F-statistics given in italics.
| MAR | Elevation | SOC 0–5 cm | r2 | F-statistic | |
|---|---|---|---|---|---|
| Region 1 | 0.1 | −0.6 | −0.1 | 0.5 | 87.7 |
| Region 2 | −0.13 | −0.04 | −0.04 | 0.2 | 19.7 |
| Region 3 | 0.17 | −0.23 | −0.02 | 0.2 | 37.5 |
| Region 4 | 0.17 | 0.07 | −0.1 | 0.06 | 0.88 |
| Amazon | 0.06 | −0.18 | −0.11 | 0.1 | 50.6 |
Windthrows have the potential to change forest composition in the Amazon [18]. Forest composition influences the climate feedback from cloud formation and rain to carbon uptake [108–111]. Since rainfall has a direct effect on the occurrence of windthrows, we suggest that Earth system models should include the effects of windthrows to reduce uncertainties on the projected functionality of the Amazon in the future.
4.4. Final remarks
Intrinsic to windthrows is the fact that forested surfaces facing the direction of the storms have the most windthrown trees as shown in our previous studies [17, 18, 112, 113]. Westward MCSs will have a larger impact on surfaces with an eastern aspect, and eastward MCSs will affect largely western-facing surfaces. Thus, it has been suggested that aspect (the direction that a terrain surface faces) is not an explanatory variable, but rather a factor [114]. Aspect in the Amazon is a local characteristic that can produce misleading results after upscaling since several aspect values will be averaged together, muting their effect [115]. We estimate that about 10%–15% of all windthrows identified did not have a clear fan shape, and were not included in the total number of windthrows identified (1116). A more comprehensive regression or machine learning analysis should explore the effect of endogenous variables as well as different regimes in each of the selected regions. Regimes analysis implies that in each Region the regression model changes due to the spatial heterogeneity of the data [82]. We found that windthrows in the Amazon have regional characteristics of occurrence and size, and further analyses are needed to understand the causes of these characteristics.
Acknowledgments
This study was supported by the Office of Science, Office of Biological and Environmental Research of the US Department of Energy, Agreement Grant. DE-AC02-05CH11231, Next Generation Ecosystem Experiments-Tropics, and the Office of Science's Regional and Global Model Analysis of the US Department of Energy, Agreement Grant. DE-AC02-05CH11231, Reducing Uncertainties in Biogeochemical Interactions through Synthesis Computation Scientific Focus Area (RUBISCO SFA). DMM was supported by German Federal Ministry of Education and Research, Grants 01LB1001A and 01LK1602A. JDUM was supported by the Max Planck Institute of Biogeochemistry and the DAAD (German Academic Exchange Service). Landsat Imagery was analyzed using the Google Earth Engine: A planetary-scale geospatial analysis platform, Google Earth Engine Team 2015, https://earthengine.google.com. RNJ thanks Megan McGroddy for discussions of soil nutrients related to this study.
Data availability statement
All data that support the findings of this study are included within the article (and any supplementary files).
Conflict of interest
All the authors declare they have no competing interests.
Supplementary data (2.5 MB DOCX)