


Abstract
Crops genetically engineered to produce insecticidal proteins from Bacillus thuringiensis (Bt) have advanced pest control, but their benefits have been reduced by evolution of resistance in pests. The global monitoring data reviewed here reveal 19 cases of practical resistance to Bt crops, which is field-evolved resistance that reduces Bt crop efficacy and has practical consequences for pest control. Each case represents the responses of one pest species in one country to one Bt toxin. The results with pink bollworm (Pectinophora gossypiella) and Bt cotton differ strikingly among the world’s three leading cotton-producing nations. In the southwestern United States, farmers delayed resistance by planting non-Bt cotton refuges from 1996 to 2005, then cooperated in a program that used Bt cotton, mass releases of sterile moths, and other tactics to eradicate this pest from the region. In China, farmers reversed low levels of pink bollworm resistance to Bt cotton by planting second-generation hybrid seeds from crosses between Bt and non-Bt cotton. This approach yields a refuge of 25% non-Bt cotton plants randomly interspersed within fields of Bt cotton. Farmers adopted this tactic voluntarily and unknowingly, not to manage resistance, but apparently because of its perceived short-term agronomic and economic benefits. In India, where non-Bt cotton refuges have been scarce and pink bollworm resistance to pyramided Bt cotton producing Cry1Ac and Cry2Ab toxins is widespread, integrated pest management emphasizing shortening of the cotton season, destruction of crop residues, and other tactics is now essential.
Crops genetically engineered to produce insecticidal proteins from the bacterium Bacillus thuringiensis (Bt) kill some voracious insect pests, but are not toxic to most nontarget organisms including natural enemies (Mendelsohn et al. 2003, Romeis et al. 2019). The hectares (ha) planted globally to Bt corn, cotton, and soybean grew from 1.1 million in 1996 to 101 million in 2017 (ISAAA 2017). Bt proteins produced by transgenic crops now include various crystalline (Cry) proteins (Pardo-López et al. 2013) and a vegetative insecticidal protein (Vip3Aa; Chakroun et al. 2016). Cry proteins are produced by the bacteria during sporulation and accumulate within cells, whereas Vips are produced during the vegetative phase and secreted (Chakroun et al. 2016). Although Cry proteins and Vip3Aa share a similar mode of action, they have no structural homology, they bind to different sites in the insect midgut, and cross-resistance between them is not strong (Carrière et al. 2015, Chakroun et al. 2016, Tabashnik and Carrière 2017).
Bt crops can suppress pests, decrease treatments with conventional insecticides, conserve natural enemies, and thereby boost yields and grower profits (Wu et al. 2008, Carpenter 2010, Hutchison et al. 2010, Tabashnik et al. 2010, Edgerton et al. 2012, Kathage and Qaim 2012, NASEM 2016, Dively et al. 2018, Romeis et al. 2019). However, despite the widespread adoption of Bt crop pyramids producing two or more distinct Bt proteins toxic to each targeted pest (Carrière et al. 2016), evolution of resistance by pests has diminished the benefits of Bt crops (Tabashnik and Carrière 2017).
Here we briefly review definitions of three categories of resistance, update the global status of field-evolved insect resistance to Bt crops, compare resistance to Bt crops with resistance to Bt sprays and conventional insecticides, and summarize the strikingly different responses of the pink bollworm, Pectinophora gossypiella (Saunders) (Lepidoptera: Gelechiidae), to Bt cotton in the United States, China, and India. We conclude that in India, where pink bollworm resistance to dual-toxin Bt cotton is widespread, integrated pest management (IPM) is now essential for this pest.
Each case of published resistance monitoring data reviewed here represents responses of one pest species in one country to one Bt toxin. This updated summary based on a literature review completed on 18 May 2019 considers 44 such cases: 36 cases summarized in a previous review (Tabashnik and Carrière 2017) plus 8 new cases (Fourie et al. 2017, Leite et al. 2017, Smith et al. 2017, Chandrasena et al. 2018, Grimi et al. 2018, Kukanar et al. 2018, Saleem et al. 2019, Vassallo et al. 2019, Yang et al. 2019). We also provide updates on many previously reported cases (e.g., Jin et al. 2018, Naik et al. 2018, Reisig et al. 2018, Bilbo et al. 2019, Kaur et al. 2019, Little et al. 2019, Strydom et al. 2019, Zhang et al. 2019).
Definitions of Categories of Resistance
Here we classify each case into one of three previously described categories: 1) practical resistance, 2) early warning of resistance, or 3) no decrease in susceptibility (Tabashnik and Carrière 2017). Both of the first two categories entail field-evolved resistance, which is a genetically based decrease in susceptibility of an insect population to a Bt toxin caused by selection in the field (Tabashnik and Carrière 2017). ‘Practical resistance’ to a Bt crop is field-evolved resistance that reduces the efficacy of the Bt crop and has practical consequences for pest control (Tabashnik et al. 2014). In addition to the criteria for field-evolved resistance, practical resistance signifies that more than 50% of individuals in a population are resistant and the efficacy of the Bt crop is reduced in the field (Tabashnik et al. 2014). ‘Early warning of resistance’ includes all cases of field-evolved resistance where the two additional criteria for practical resistance are not met. For practical resistance and early warning of resistance, at least one population must meet the relevant criteria, whereas other populations may remain susceptible. No decrease in susceptibility indicates the monitoring data show no statistically significant decrease in susceptibility in any population tested after field populations have been exposed to a Bt crop (Tabashnik and Carrière 2017). A panel of experts convened by the U.S. Environmental Protection Agency (EPA 2018) recommended classifying resistance monitoring data into three categories similar to those described above. Although the criteria and names proposed by the panel are not identical to those used here, we are encouraged by the consensus on a three-tiered approach that includes practical resistance.
Global Status of Field-Evolved Resistance to Bt Crops
The 44 cases reviewed here consist of 19 cases of practical resistance, 19 cases of no decrease in susceptibility, and 6 cases of early warning of resistance (Tables 1–3). Of the 16 pest species monitored, 15 are lepidopterans. The other is Diabrotica virgifera virgifera (western corn rootworm), a major coleopteran pest of corn in the United States. The resistance monitoring data are from 12 countries and include responses to nine Cry toxins and one Vip toxin (Vip3Aa) produced by Bt corn, cotton, and soy.
Practical resistance to Bt corn and cotton: 19 cases involving seven pest species, nine Cry toxins, and six countries (mean years to resistance = 5.3, SE = 0.7), updated from Tabashnik and Carrière (2017)
| Insect | Crop | Toxin | Country | First yeara | Yearsb,c | Referencesd |
|---|---|---|---|---|---|---|
| B. fusca | Corn | Cry1Ab | S. Africa | 1998 | 8 | Strydom et al. (2019)e |
| D. saccharalis | Corn | Cry1A.105 | Argentina | 2011 | 1c | Grimi et al. (2018) |
| D. saccharalis | Corn | Cry1Fa | Argentina | 2008 | 4c | Grimi et al. (2018) |
| D. v. virgifera | Corn | Cry3Bb | United States | 2003 | 6 | Shrestha and Gassmann (2019)f |
| D. v. virgifera | Corn | Cry34/35Ab | United States | 2006 | 7 | Ludwick et al. (2017)g |
| D. v. virgifera | Corn | eCry3.1Ab | United States | 2014 | 0c | Andow et al. (2016)h |
| D. v. virgifera | Corn | mCry3A | United States | 2007 | 4c | Andow et al. (2016)i |
| H. zea | Corn | Cry1Ab | United States | 1996 | 8 | Dively et al. (2016) |
| H. zea | Corn | Cry1A.105 | United States | 2010 | 6c | Kaur et al. (2019)j |
| H. zea | Cotton | Cry1Ac | United States | 1996 | 6 | Little et al. (2019)k |
| H. zea | Both | Cry2Ab | United States | 2003 | 2c | Kaur et al. (2019)l |
| P. gossypiella | Cotton | Cry1Ac | India | 2002 | 6 | Naik et al. (2018)m |
| P. gossypiella | Cotton | Cry2Ab | India | 2006 | 8 | Naik et al. (2018) |
| S. albicosta | Corn | Cry1Fa | Canada | 2003 | 9 | Smith et al. (2017) |
| S. albicosta | Corn | Cry1Fa | United States | 2003 | 10 | Ostrem et al. (2016) |
| S. frugiperda | Corn | Cry1Ab | Brazil | 2008 | 2c | Omoto et al. (2016) |
| S. frugiperda | Corn | Cry1Fa | Argentina | 2005 | 8 | Vassallo et al. (2019)n |
| S. frugiperda | Corn | Cry1Fa | Brazil | 2009 | 2 | Farias et al. (2014) |
| S. frugiperda | Corn | Cry1Fa | United States | 2003 | 4 | Huang et al. (2014)o |
aFirst year of commercial planting of a Bt crop in the region monitored.
bYears from the first commercial planting of a Bt crop in the region to the first sampling of field populations in the region yielding evidence of resistance.
cCross-resistance suspected or known as a factor contributing to resistance.
dIn cases where multiple references are cited, the most recent reference cited is listed above and references from the same year or earlier years are listed below:
No significant decrease in susceptibility to Bt crops: 19 cases involving five Bt toxins, 11 pest species, and seven countries (mean documented years of susceptibilitya = 10.5 yr), updated from Tabashnik and Carrière (2017)
| Insect | Crop | Toxin | Country | Year commb | Yearsa | Referencec |
|---|---|---|---|---|---|---|
| C. includens | Soyd | Cry1Ac | Brazil | 2013d | 1d | Yano et al. (2016) |
| D. grandiosella | Corn | Cry1Ab | United States | 1999 | 6 | Huang et al. (2007) |
| E. biplaga | Cotton | Cry1Ac | South Africa | 1998 | 15 | Fourie et al. (2017) |
| H. armigera | Cotton | Cry1Ac | Australia | 1996 | 16 | Downes 2016 |
| H. armigera | Cotton | Cry2Ab | Australia | 2004 | 11 | Downes 2016 |
| H. punctigera | Cotton | Cry1Ac | Australia | 1996 | 19 | Walsh et al. 2018 |
| H. punctigera | Cotton | Cry2Ab | Australia | 2004 | 11 | Downes 2016 |
| H. virescens | Cotton | Cry1Ac | Mexico | 1996 | 11 | Blanco et al. (2009) |
| H. virescens | Cotton | Cry1Ac | United States | 1996 | 11 | Blanco et al. (2009) |
| H. virescens | Cotton | Cry2Ab | United States | 2003 | 2 | Ali et al. (2007) |
| H. zea | Corn | Vip3Aa | Brazil | 2009 | 6 | Leite et al. (2017) |
| O. nubilalis | Corn | Cry1Ab | Spain | 1998 | 15 | EFSA (2015) |
| O. nubilalis | Corn | Cry1Ab | United States | 1996 | 15 | Siegfried and Hellmich (2012) |
| O. nubilalis | Corn | Cry1Fa | United States | 2003 | 8 | Siegfried et al. (2014) |
| P. gossypiella | Cotton | Cry1Ac | China | 2000 | 15 | Wan et al. (2017) |
| P. gossypiella | Cotton | Cry1Ac | United States | 1996 | 12 | Tabashnik et al. (2010) |
| P. gossypiella | Cotton | Cry2Ab | United States | 2003 | 5 | Tabashnik et al. (2010) |
| S. frugiperda | Corn | Vip3Aa | Brazil | 2010 | 5 | Bernardi et al. (2015) |
| S. nonagroides | Corn | Cry1Ab | Spain | 1998 | 15 | Castañera et al. (2016) |
aYears of documented susceptibility was calculated as the year of the most recent monitoring data cited minus the first year of commercialization in the region. Because susceptibility has probably persisted beyond the year of the most recent monitoring data, the years of documented susceptibility underestimate the total years of susceptibility.
bFirst year of commercial planting of a Bt crop in the region monitored.
cThe most recent reference is cited above. For additional references, see the references cited within the papers listed above and in Tabashnik and Carrière (2017).
dThe first season of commercial planting in Brazil for transgenic plants producing Cry1Ac was 2013–2014 for soy and 2006–2007 for cotton, which is an occasional host of C. includens (Yano et al. 2016). Based on monitoring data from the 2014–2015 season, documented susceptibility to Cry1Ac is 1 yr since introduction of Bt soy and 8 yr since introduction of Bt cotton.
Early warning of resistance to Bt corn and cotton: six cases involving four pest species, three Cry toxins, and five countries, updated from Tabashnik and Carrière (2017)
| Insect | Crop | Toxin | Country | First yeara | Yearsb | Reference |
|---|---|---|---|---|---|---|
| D. saccharalis | Corn | Cry1Ab | United States | 1999 | 10 | Huang et al. (2012) |
| H. armigera | Cotton | Cry1Ac | China | 1997 | 20 | Zhang et al. (2019)c |
| H. armigera | Cotton | Cry1Ac | India | 2002 | 12 | Kukanar et al. (2018) |
| H. armigera | Cotton | Cry1Ac | Pakistan | 2010d | 3 | Saleem et al. (2019) |
| O. furnacalis | Corn | Cry1Ab | Philippines | 2003 | 6 | Alcantara et al. (2011) |
| H. zea | Both | Vip3Aa | United States | 2010e | 8 | Yang et al. (2019) |
aFirst year of commercial planting of a Bt crop in the region monitored.
bYears from the first commercial planting of a Bt crop in the region to the most recent year of monitoring data reviewed here.
cAlso see Jin et al. (2015, 2018).
dIn Pakistan, the first officially approved Bt cotton was cultivated in 2010, but it also was grown before 2010 (Malik and Ahsan 2016).
eAlthough United States registration of Vip3Aa-producing plants occurred in 2008 for cotton and 2009 for corn (Tabashnik et al. 2009), adoption of such plants has been relatively slow in the United States, with <1% for cotton in 2016 and <5% for corn in 2013 (Tabashnik and Carrière 2017). In 2018, 14% of cotton planted in Texas produced Vip3Aa (USDA AMS 2018).
The cases of practical resistance to the Cry toxins in Bt crops rose from 4 in 2006 to 19 in 2016 (Fig. 1). Practical resistance has been documented for some populations of seven major pest species: one pest resistant to Bt corn and cotton (Helicoverpa zea), five resistant to Bt corn (Busseola fusca, Diatraea saccharalis, D. v. virgifera, Spodoptera frugiperda, and Striacosta albicosta), and one resistant to Bt cotton (P. gossypiella; Table 1). Four cases of practical resistance have been reported for each of three pests (D. v. virgifera, H. zea, and S. frugiperda), which means these three pests account for 63% (12 of 19) of the cases of practical resistance. Practical resistance to Bt crops has occurred in six countries: 10 cases in the United States, 3 in Argentina, 2 each in Brazil and India, and 1 each in Canada and South Africa (Table 1). Each of the following nine Cry toxins produced by Bt crops is involved in at least one case of practical resistance: Cry1Ab, Cry1Ac, Cry1A.105, Cry1Fa, Cry2Ab, Cry3Bb, mCry3A, eCry3.1Ab, and Cry34/35Ab.
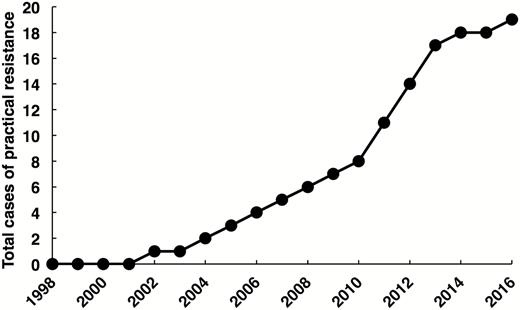
Total cases of practical resistance to Bt crops. The total of 19 cases in 2016 reflects results of published evidence of practical resistance based on a literature search completed 18 May 2019. The mean delay between field sampling that yields evidence of practical resistance and publication of the data is 3.5 yr.
For the 19 cases of practical resistance, 5.3 yr is the mean time from the first commercial planting of a Bt crop in a region to the first sampling of field populations in the region providing evidence of practical resistance. Confirming a pattern seen previously with smaller data sets (Tabashnik 2016, Tabashnik and Carrière 2017), the time for practical resistance to evolve has decreased significantly for more recently commercialized Bt crops, largely because of cross-resistance (Fig. 2). Resistance evolved faster in seven cases where cross-resistance is suspected or known (mean = 2.7 yr) than in 12 cases where cross-resistance is not involved (mean = 6.8 yr; t = 4.0, df = 17, P < 0.001).
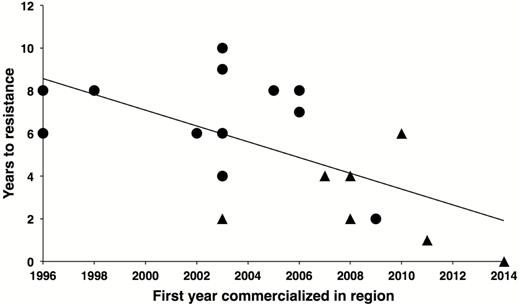
Practical resistance evolved faster to more recently commercialized Bt crops. For the 19 cases of practical resistance (Table 1), the time from the first commercial planting of a Bt crop in the region to the first sampling of field populations in the region yielding evidence of resistance (years to resistance) decreased from 1996 to 2014 (linear regression: y = −0.37x + 747, R2 = 0.37, df = 17, P = 0.005). Circles show 12 cases where cross-resistance was not involved; triangles indicate seven cases known or suspected to be affected by cross-resistance.
Balancing the 19 cases of practical resistance summarized above are 19 other cases where monitoring data document no significant decrease in susceptibility to the Bt toxins in transgenic crops (Table 2). Sustained susceptibility is documented for 10 yr or more in 63% (12 of 19) of these cases, and the mean documented duration of susceptibility is 10.5 yr (range: 1–19 yr, n = 19 cases; Table 2). This mean value underestimates the ultimate duration of susceptibility because susceptibility may be sustained for years to come in some or all of these cases. These 19 cases of no decrease in susceptibility represent responses to Vip3Aa and four Cry toxins in Bt crops by 11 lepidopteran pests: Chrysodeixis includens, Diatraea grandiosella, Earias biplaga, Helicoverpa armigera, Helicoverpa punctigera, Heliothis virescens, H. zea, Ostrinia nubilalis, P. gossypiella, S. frugiperda, and Sesamia nonagroides.
The six cases of early warning of resistance involve responses to Cry1Ab by D. saccharalis in the United States and Ostrinia furnacalis in the Philippines, to Cry1Ac by H. armigera in China, India, and Pakistan, and to Vip3Aa by H. zea in the United States (Table 3). The highest percentage of resistant individuals reported for any field population screened (based on survival at a diagnostic concentration in diet bioassays) was 2.4% for D. saccharalis, 5.5% for O. furnacalis, ca. 35% for H. zea (Yang et al. 2019), and 22.2% for H. armigera in China (Zhang et al. 2019). For H. armigera in India, the maximum resistance allele frequency reported was 0.085 in 2013, an increase of 65-fold relative to 2004 (Kukanar et al. 2018). The magnitude of resistance can also be gauged by the resistance ratio, the concentration of a toxin killing 50% of larvae (LC50) for a population divided by the LC50 for a susceptible population. For H. armigera in Pakistan, the highest resistance ratio based on LC50 values was 16 (Saleem et al. 2019).
Comparisons with Resistance to Bt Sprays and Conventional Insecticides
Whereas the review here reveals practical resistance to Bt crops in 7 of 16 major target pests evaluated after two decades, we know of practical resistance caused by exposure to sprays containing Bt toxins in only two lepidopterans: Plutella xylostella (Tabashnik et al. 1990, Furlong et al. 2013) and Trichoplusia ni (Janmaat and Myers 2003), despite the broader range of pests targeted by Bt sprays (including Coleoptera, Diptera, and Lepidoptera) and their extensive use for over 50 yr (Sanahuja et al. 2011, Sanchis 2011). This pattern probably reflects more intense selection by Bt crops caused by their wider adoption (ISAAA 2017) and continuous exposure to toxins in Bt crops versus intermittent exposure to Bt sprays of short persistence (Tabashnik 1994). Also, although the first Bt crops each produced only a single toxin, nearly all Bt sprays contain mixtures of several toxins (Tabashnik 1994, Sanahuja et al. 2011).
A comprehensive comparison with the >10,000 records of resistance to conventional insecticides (Mota-Sanchez and Wise 2019) is beyond the scope of this study. However, a previous review showed that after 25 yr of exposure to sprays of the organophosphate azinphosmethyl, 7 of 12 North American apple pests evaluated had evolved practical resistance (Tabashnik and Croft 1985). The median for years to evolve resistance was 17.5 for all 12 pests and 5.0 for the seven resistant pests (Tabashnik and Croft 1985). Based on the data summarized here, Bt crops and azinphosmethyl do not differ significantly in the proportion of species evaluated that attained practical resistance (Fisher’s exact test, P = 0.70) or the years to evolve practical resistance for the resistant pests (U-test, n = 19 cases for Bt crops and 7 for azinphosmethyl, P = 0.27). We caution that this comparison is complicated by differences in many factors other than resistance management practices including the target species, insecticide chemistry, mode of exposure, and crop. By contrast, the comparisons below provide compelling insights for resistance management by focusing on the same pest exposed to the same Bt toxins in the same Bt crop.
Pink Bollworm versus Bt Cotton in the United States, China, and India
The pink bollworm, found in over 100 nations (CABI 2016), has been a key pest of cotton in the world’s three leading cotton-producing countries: the United States, China, and India. In the 2017/2018 season, these three countries produced 17, 22, and 23% of the world’s cotton, respectively (USDA FAS 2019). Pink bollworm was first recorded in 1842 from India and had invaded the United States and China by 1917 (Hunter 1926, Ingram 1994). Although its origin is not known, candidates include India, Pakistan, Australia, and Southeast Asia (Ingram 1994, Wang et al. 2011, CABI 2016). Across the geographic range of this cosmopolitan pest, its caterpillars feed on cotton and some other host plants including okra that are almost all in the family Malvaceae (CABI 2016). For most populations of pink bollworm, ‘natural refuges’ of non-Bt host plants other than cotton are limited or absent. First generation larvae may feed on cotton flower buds and flowers, whereas larvae from subsequent generations primarily bore inside bolls where they feed on seeds and can destroy the entire content of the bolls (Ingram 1994, Henneberry and Naranjo 1998). Larvae from unselected populations are highly susceptible to Cry1Ac and Cry2Ab (Sivasupramaniam et al. 2008), two of the toxins produced by the widely used HD-1 strain of Bt, which was isolated from pink bollworm (Tabashnik 1994, Sanchis 2011). The stunning differences in responses of pink bollworm to Bt cotton in the United States, China, and India provide important insights for resistance management (Table 4).
Pink bollworm and Bt cotton in the United States, China, and India
| Trait | United States | China | India |
|---|---|---|---|
| Region | Southwest | Yangtze River Valley | Central and southa |
| Bt cotton | |||
| Cry1Ac | 1996–2010 | 2000–now | 2002–nowb |
| Cry1Ac + Cry2Ab | 2003–now | None | 2006–now |
| First year >90%c | 2007 | 2008 | 2008 |
| Non-Bt cotton refuges | |||
| Required | Yes, 1996–2005 | No | Yes |
| No, 2006–now | 2019 RIB 5–10%d | ||
| Planted | Yes, 1996–2005 | F2 hybrids provide | Scarce |
| No, 2006-now | 25% non-Bt plants | ||
| Pink bollworm | |||
| Cry1Ac resistance | No | Low level, reversed | 2008 |
| Cry2Ab resistance | No | No | 2014 |
| Population status | Eradicated | Suppressed | Damaging |
Sources: Choudhary and Gaur (2010, 2015); Tabashnik et al. (2010, 2013a); Wan et al. (2012, 2017); ISAAA (2017); Naik et al. (2018); see text for details.
a87% of India’s cotton is planted in the central and south regions (Naik et al. 2018).
bIllegal planting started in about 2000 in the western Indian state of Gujarat.
cFirst year when Bt cotton fields accounted for >90% of all cotton ha planted; data from Arizona for United States, Yangtze River Valley for China, and all of India.
dSeed mixture (refuge in a bag = RIB) with 5–10% non-Bt cotton seeds required starting Dec. 2019.
United States
The pink bollworm was first reported from Texas in 1917, then gradually spread to other cotton-growing states including Arizona, California, and New Mexico (Ingram 1994). In Arizona, before Bt cotton was introduced in 1996, pink bollworm population density was often high and the mean number of sprays per cotton field per year targeting this pest was 2.7 from 1990 to 1995 (Tabashnik et al. 2012). From 1996 to 2005, Arizona cotton growers complied with the mandated refuge strategy and non-Bt cotton accounted for >25% of cotton planted statewide each year, with most of the non-Bt cotton planted in blocks separate from Bt cotton fields (Carrière et al. 2005, Tabashnik et al. 2012). During this period, Bt cotton caused a regional decline in pink bollworm population density (Carrière et al. 2003) and reduced sprays of broad-spectrum insecticides (Cattaneo et al. 2006). In 2003, cotton growers in the United States began gradually switching from transgenic cotton producing only one Bt toxin (Cry1Ac) to transgenic cotton producing two Bt toxins (primarily Cry1Ac and Cry2Ab; Tabashnik et al. 2013a).
Three monitoring methods showed no net decrease in susceptibility of pink bollworm to Cry1Ac in Arizona from 1997 to 2005 (Tabashnik et al. 2012). These methods were as follows: field efficacy tests comparing infestation of Bt and non-Bt cotton, laboratory diet bioassays, and DNA screening of field-sampled insects for mutations affecting the Cry1Ac-binding cadherin protein linked with resistance to Cry1Ac in lab-selected strains. Consistent with the evolutionary theory underlying resistance management strategies, four factors probably delayed pink bollworm resistance to Bt cotton in Arizona during this period: abundant refuges of non-Bt cotton plants, recessive inheritance of resistance, fitness costs associated with resistance, and incomplete resistance (Carrière and Tabashnik 2001; Tabashnik et al. 2005, 2012; Carrière et al. 2006, 2010). Fitness costs associated with resistance reduce the fitness on non-Bt host plants of resistant insects relative to susceptible insects (Carrière et al. 2018). Incomplete resistance occurs when the fitness of resistant insects is lower on Bt plants than on their non-Bt plant counterparts (Carrière et al. 2010).
Starting in 2006, cotton growers collaborated with scientists from the USDA, the University of Arizona, and others to implement a multi-tactic eradication program in the southwestern United States and northern Mexico (Grefenstette et al. 2009). In Arizona, this program used mass releases of irradiated, partially sterile pink bollworm moths instead of refuges to delay resistance to Bt cotton (Tabashnik et al. 2010, 2012). This approach is based on the idea that rare resistant pink bollworm moths emerging from Bt cotton will mate primarily with the abundantly released moths. The relatively few larvae arising from such matings are expected to be heterozygous for recessive resistance and thus unable to survive on Bt cotton. Moreover, even without exposure to any Bt toxins, these larvae are not likely to become fertile adults (Henneberry and Clayton 1981, Tabashnik et al. 2010). With growers allowed to plant up to 100% Bt cotton based on a special waiver from the U.S. Environmental Protection Agency (EPA 2007), the statewide percentage of cotton planted consisting of non-Bt cotton refuges decreased from >25% to below 5% (Tabashnik et al. 2010). Meanwhile, the percentage of Arizona’s Bt cotton producing two toxins (primarily Cry1Ac and Cry2Ab) increased from 11% in 2005 to 79% in 2009, and was close to 100% in 2010, after the registration for Bt cotton producing only Cry1Ac expired in 2009 (Tabashnik et al. 2012).
After the eradication program began in 2006, pink bollworm populations plummeted in Arizona (Tabashnik et al. 2010; Liesner et al. 2011, 2018, 2019). The percentage of field-collected non-Bt cotton bolls infested with pink bollworm larvae dropped from 15.3% in 2005 to 0.012% in 2009, a 99.92% decline (Tabashnik et al. 2010). Wild male pink bollworm moths caught per pheromone trap per week fell from 26.7 in 2005 to 0.0054 in 2009, a 99.98% decrease (Tabashnik et al. 2010). Insecticide treatments for pink bollworm decreased 98.6% from 2005 to 2007, with no treatments in subsequent years (Liesner et al. 2011). Extensive annual monitoring in Arizona detected no pink bollworm larvae in cotton bolls from 2010 to 2018 and no wild pink bollworm moths in the field from 2013 to 2018 (Liesner et al. 2019, B. E. Tabashnik et al., unpublished data). Based on similar patterns in other states, the U.S. Secretary of Agriculture declared pink bollworm eradicated from all commercial cotton production areas of the continental United States in October 2018 (USDA 2018).
China
Unlike the United States and most other countries, China has not mandated refuges for delaying pest resistance to Bt cotton. Also, in contrast with multi-toxin Bt crops widely adopted elsewhere, Bt cotton producing only Cry1Ac is still grown throughout China’s cotton-producing regions. The millions of smallholder farmers in China’s Yangtze River Valley began planting Bt cotton in 2000 to control pink bollworm and some other caterpillar pests (Wan et al. 2017). As adoption of this Bt cotton increased, the percentage of cotton ha planted with non-Bt cotton varieties first declined below 20% in 2006 (Wan et al. 2017). Testing of pink bollworm derived from 17 field sites in six provinces documented a small but statistically significant (P < 0.001) increase in resistance to Cry1Ac in 2008–2010 relative to 2005–2007 (Wan et al. 2017). The percentage of populations with at least one larva surviving in diet bioassays at a diagnostic concentration (9 µg Cry1Ac per ml diet) increased from 0% in 2005–2007 to 56% in 2008–2010. Over the same pair of time periods, the median percentage survival at the diagnostic concentration increased from 0 to 1.6%.
Because refuges of non-Bt cotton varieties had declined to only 6% of all cotton planted, resistance was expected to rise quickly after 2010 (Wan et al. 2017). However, the percentage of populations with at least one larva surviving at the diagnostic concentration fell from 56% in 2008–2010 to 0% in 2011–2015 and the median percentage survival at the diagnostic concentration dropped from 1.6% in 2008–2010 to 0% in 2011–2015 (each P < 0.0001; Wan et al. 2017).
What could explain this surprising decrease in pink bollworm resistance to Cry1Ac in China? Wan et al. (2017) inferred that millions of growers serendipitously implemented a novel seed mixture strategy by planting second-generation (F2 hybrid) seeds from crosses between Bt and non-Bt cotton, which is expected to yield a refuge of 25% non-Bt plants randomly interspersed within fields of Bt cotton. The F2 hybrid seeds are created and sold by seed companies in China, but this practice was not widely known before Wan et al. published their findings. Because of heterosis, F1 and F2 cotton hybrids often have higher yield than their parent varieties (Dong et al. 2004, Feng et al. 2014). Whereas production of F1 hybrid seeds requires costly hand pollination, self-pollination of F1 hybrids produces F2 hybrid seeds (Wan et al. 2017). Crossing Bt cotton with non-Bt cotton generates F1 hybrids that produce Bt toxin. Self-pollination by these F1 hybrids creates F2 hybrid seeds expected to consist of 25% Bt homozygotes and 50% hemizygotes that produce Bt toxin and 25% non-Bt homozygotes that do not (Wan et al. 2017). Although hybrid cotton seeds have been widely adopted in China for many years (Dong et al. 2004), the seed companies have sold them as hybrids without identifying them as F1 or F2 hybrids. However, for 45 popular hybrids sold in 2015, the mean price was 35% higher for F1 hybrids than F2 hybrids, reflecting the higher cost of production (Wan et al. 2017).
By using immunoassays to test 14,000 seeds, Wan et al. (2017) estimated the percentage of seeds containing Cry1Ac for each of the 84 most popular types of cotton in the region. By analyzing these results together with planting data for the region, they discovered that the percentage of all cotton planted to F2 hybrids had jumped from 16% in 2009 to 59% in 2010. Thus, in 2010, approximately 15% of all cotton plants were non-Bt cotton plants in fields of F2 hybrid cotton (59% F2 hybrid fields × 25% non-Bt cotton plants in F2 hybrid fields). Summing the non-Bt cotton plants in fields of non-Bt cotton varieties and in fields of F2 hybrids, the overall percentage of non-Bt cotton plants nearly doubled from 12% in 2009 to 23% in 2010 and was 25 to 27% from 2011 to 2015 (Wan et al. 2017). Results from simulation modeling showed that this increase in the percentage of non-Bt cotton plants caused by planting F2 hybrids is sufficient to account for the observed decrease in the percentage of pink bollworm resistant to Cry1Ac (Wan et al. 2017).
The seed mixture generated with F2 hybrids in China may be especially effective against pink bollworm because of the substantial fitness cost associated with its resistance to Cry1Ac and its recessive inheritance of resistance (Wan et al. 2017). Selfing of F2 plants in subsequent generations is expected to maintain approximately 75% of plants producing Cry1Ac (25% Bt homozygotes and 50% hemizygotes) and 25% non-Bt homozygotes. Unlike other resistance management tactics supported by regulatory intervention (Carrière et al. 2019), growers adopted this strategy voluntarily and unknowingly, apparently because of perceived short-term advantages that may include better yield than parent varieties as well as lower costs for seeds and insecticides (Wan et al. 2017). In 2011–2015, when F2 hybrid fields accounted for a mean of 67% of all cotton ha, pink bollworm population density was reduced by 96% and insecticide sprays decreased by 69% relative to 1995–1999, the 5 yr before Bt cotton was adopted (Wan et al. 2017).
India
In India, Bt cotton hybrids generated by crossing a Bt cotton cultivar producing Cry1Ac with local non-Bt cotton cultivars were commercialized and planted on 50,000 ha in 2002 (Choudhary and Gaur 2015). However, illegal planting of Bt cotton began sooner in the western Indian state of Gujarat (Herring 2007, Lalitha et al. 2009). In 2006, Bt cotton hybrids producing two toxins (Cry1Ac + Cry2Ab, Bollgard II) were introduced in India. In 2014, 7.7 million farmers in India planted 11.6 million ha of Bt cotton, which was 95% of all cotton planted (Choudhary and Gaur 2015). Of India’s Bt cotton planted in 2014, 96% produced Cry1Ac + Cry2Ab and 4% produced only Cry1Ac (Choudhary and Gaur 2015).
In an effort to proactively delay the evolution of resistance, India’s Genetic Engineering Approval Committee (GEAC) approved Cry1Ac cotton in 2002 with non-Bt cotton planting required in five perimeter rows or 20% of the total sown area, whichever is larger (Mohan 2018). Accordingly, seed companies provided 120 g of non-Bt cotton seeds with every packet of 450 g of Bt cotton seeds (Mohan 2018). However, Indian farmers have not planted the non-Bt cotton seeds, apparently because of factors including misunderstanding the purpose of refuges (Stone 2004) and the desire to maximize short-term yield (Mohan 2018).
In contrast with the sustained susceptibility to Bt cotton in the United States and China, pink bollworm rapidly evolved practical resistance to Bt cotton in India, where refuges of non-Bt cotton have been scarce (Mohan et al. 2016, Tabashnik and Carrière 2017, Mohan 2018). Resistance of pink bollworm to Cry1Ac was first documented with laboratory bioassays of the offspring of insects collected from the field in 2008 in Gujarat (Dhurua and Gujar 2010). In central India in 2014, the mean resistance ratio for eight populations was 310 for Cry1Ac and 78 for Cry2Ab, and the percentage of bolls infested with pink bollworm larvae was higher for Bt cotton producing Cry1Ac + Cry2Ab (52%) than for non-Bt cotton (27%; Naik et al. 2018). By 2015, pink bollworm resistance to Bt cotton producing Cry1Ac + Cry2Ab was widespread in India (Naik et al. 2018).
The molecular genetic basis of pink bollworm resistance to Cry1Ac is similar in field-selected populations from India and lab-selected strains from the United States and China (Fabrick et al. 2014, Wang et al. 2019). In all three countries, mutations the gene PgCad1 encoding a Cry1Ac-binding cadherin protein are associated with resistance to Cry1Ac (Morin et al. 2003, Fabrick et al. 2014, Wang et al. 2019). In parallel, in the United States and India, mutations in the gene PgABCA2 encoding an ATP-binding cassette (ABC) transporter protein are associated with pink bollworm resistance to Cry2Ab (Mathew et al. 2018). As far as we know, Cry2Ab resistance has not been analyzed yet in pink bollworm from China.
Integrated Pest Management Is Essential for Pink Bollworm in India
Strategies for delaying the evolution of pest resistance work best proactively when alleles conferring resistance are rare or absent in pest populations (Tabashnik et al. 2008). In India, high levels of pink bollworm resistance to both Cry1Ac and Cry2Ab are common (Naik et al. 2018). Thus, it is too late to effectively manage resistance to the currently available Bt cotton that makes these two toxins. In China, where pink bollworm susceptibility to Cry1Ac was restored after initial detection of resistance, the median percentage of resistant individuals was less than 2% before the non-Bt cotton refuge area increased to about 25% of all cotton planted (Wan et al. 2017). By contrast, with the exception of some populations in northern India still susceptible to Cry2Ab, populations of pink bollworm in India were highly resistant to both Cry1Ac and Cry2Ab in 2017, as reflected by many resistance ratios greater than 100 and high infestation rates of dual-toxin Bt cotton (Naik et al. 2018).
Recognizing the problems with resistance and the lack of farmer compliance with planting separate blocks of non-Bt cotton as structured refuges, the Ministry of Agriculture, Cooperation and Farmers Welfare, Government of India has directed a shift by December 2019 to seed mixtures of Bt and non-Bt cotton, also known as ‘refuge-in-a-bag’ (RIB; Mohan 2018). The required percentage of non-Bt cotton seeds is 5–10% of the total (Mohan 2018). This shift to RIB addresses the issue of noncompliance with planting separate refuges, but it is too little and too late to substantially remedy the high levels of pink bollworm resistance to both Cry1Ac and Cry2Ab in nearly all cotton-growing areas of India.
Moreover, scientists have challenged the use of seed mixtures with only 5–10% non-Bt seeds for Bt corn in the United States because evidence is lacking that this low refuge percentage can delay pest resistance (Alyokhin 2011, Tabashnik and Gould 2012, Yang et al. 2014, Carrière et al. 2016). Unlike the seed mixture announced for Bt cotton in India, the F2 hybrid seed mixture planted successfully in China provides a 25% refuge of non-Bt plants (Wan et al. 2017). Results from simulation modeling suggest that with a dominant 60% fitness cost (an extremely optimistic assumption) and an initial resistance allele frequency of 0.30 (optimistic relative to the situation in India), a 30% refuge would not be sufficient to substantially delay pink bollworm resistance to a single Bt toxin (Carrière and Tabashnik 2001).
In the next 10 yr, it is not likely that Bt cotton producing one or more novel toxins highly effective against pink bollworm resistant to Cry1Ac and Cry2Ab will become commercially available in India. Bt cotton producing Vip3Aa in addition to Cry1Ac and Cry2Ab has been commercialized in Australia and the United States, but Vip3Aa is not highly effective against pink bollworm. For the longer term, Bt toxins such as Cry1B and Cry1C that killed lab-selected Cry1Ac-resistant pink bollworm (Tabashnik et al. 2000) might be useful in transgenic cotton for control of resistant populations in India. In addition, genetically modified Cry1A toxins were highly effective in laboratory diet bioassays against lab-selected pink bollworm resistant to Cry1Ac and Cry2Ab (Tabashnik et al. 2013b). Because the genetic basis of resistance to Cry1Ac and Cry2Ab is similar between the lab-selected pink bollworm killed by the modified toxins and field-selected pink bollworm from India (Fabrick et al. 2014, Mathew et al. 2018), the modified toxins are expected to also kill resistant pink bollworm from India. However, this hypothesis has not been tested. More importantly, as far as we know, transgenic cotton producing Bt toxins likely to be effective against pink bollworm resistant to Cry1Ac and Cry2Ab is not available or in the pipeline for commercialization. Furthermore, the current regulatory environment in India does not encourage the introduction of new transgenic crops.
Experts agree that IPM, rather than reliance on any single tactic such as Bt crops, is the best way to achieve sustainable pest suppression (e.g., Gassmann et al. 2011, Hutchison 2015, Downes et al. 2017, Anderson et al. 2019, Hurley and Sun 2019). This principle certainly applies to managing the pink bollworm in India. Based on experience in the United States and elsewhere (Henneberry and Naranjo 1998, Carrière et al. 2017), IPM tactics recommended for pink bollworm in India include planting of early to medium maturing cotton hybrids, termination of the crop by December, strict avoidance of ratoon cotton after harvest, removal or destruction of crop residues after harvest, deep summer plowings, judicious use of insecticides based on scouting and thresholds, crop rotation, biological control with natural enemies, and pheromones for mass trapping and mating disruption (Kranthi 2015, Mohan 2017). As explained by Kranthi (2015) and Mohan (2017), the widespread loss of the efficacy of Bt cotton against pink bollworm in India means that a return to IPM emphasizing other control tactics is now essential.
Conclusions
The dramatically different outcomes for pink bollworm and Bt cotton in the United States, China, and India support the idea that resistance management can have a major impact. In particular, the contrasting results suggest that in the United States and China, abundant refuges of non-Bt cotton delayed the evolution of resistance, whereas in India, the scarcity of such refuges allowed resistance to Cry1Ac and Cry2Ab to evolve rapidly. Although refuge abundance differed among the three countries in this natural experiment, we caution that many other factors varied among these nations, including the varieties and hybrids of cotton planted, climate, and cultivation practices. Nonetheless, this tale of three countries does involve the same pest species, the same crop, and the same toxins. Moreover, genetic variation for resistance to Bt toxins does not appear to be a factor limiting adaptation in the United States or China. Pink bollworm populations in all three countries harbor cadherin mutations that confer resistance to Cry1Ac (Morin et al. 2003, Fabrick et al. 2014, Wang et al. 2019) and ABC transporter mutations conferring resistance to Cry2Ab have been detected in populations from the United States and India (Mathew et al. 2018). Thus, the trinational comparison with pink bollworm provides some of the most compelling evidence that abundant refuges of non-Bt host plants favor sustained susceptibility to Bt crops. The specific outcomes with pink bollworm in the world’s three leading cotton-producing nations reinforce general conclusions based on analysis of global patterns (Tabashnik et al. 2013a, Tabashnik and Carrière 2017) and provide insights that can improve management of resistance and enhance sustainability of current and future transgenic crops.
Acknowledgments
We thank Tarak Dhurjati, Kormalingam Mohan, Keshav Kranthi, and Keshavulu Kunusoth for sharing information about pink bollworm in India and Timothy Dennehy for his thoughtful suggestions that improved the article. This work was supported by Agriculture and Food Research Initiative Program Grant 2018-67013-27821 from the USDA National Institute of Food and Agriculture.
