


Abstract
The stringent response modulators, guanosine tetraphosphate (ppGpp) and protein DksA, bind RNA polymerase (RNAP) and regulate gene expression to adapt bacteria to different environmental conditions. Here, we use Atomic Force Microscopy and in vitro transcription assays to study the effects of these modulators on the conformation and stability of the open promoter complex (RPo) formed at the rrnA P1, rrnB P1, its discriminator (dis) variant and λ pR promoters. In the absence of modulators, RPo formed at these promoters show different extents of DNA wrapping which correlate with the position of UP elements. Addition of the modulators affects both DNA wrapping and RPo stability in a promoter-dependent manner. Overall, the results obtained under different conditions of ppGpp, DksA and initiating nucleotides (iNTPs) indicate that ppGpp allosterically prevents the conformational changes associated with an extended DNA wrapping that leads to RPo stabilization, while DksA interferes directly with nucleotide positioning into the RNAP active site. At the iNTPs-sensitive rRNA promoters ppGpp and DksA display an independent inhibitory effect, while at the iNTPs-insensitive pR promoter DksA reduces the effect of ppGpp in accordance with their antagonistic role.
INTRODUCTION
The nutritional stress-induced guanosine tetraphosphate (ppGpp), the small (∼17.5 kDa) RNA polymerase (RNAP)-binding protein DksA and the initiating ribonucleotides (iNTPs) work together to regulate rRNA synthesis in Escherichia coli (1,2). Moreover, given that the intracellular ppGpp concentration increases significantly under stress situations (3), acting as a molecular signal of the status of the host's metabolic conditions, some temperate bacteriophages, such as the λ phage, evolved gene regulation mechanisms that relay on ppGpp and DksA to modulate the expression machinery that activates/inhibits either the lysogenic or lytic pathway (4).
Transcription initiation begins with the binding of RNAP to the promoter region to form the unstable polymerase/promoter closed complex (RPc). Through a series of conformational changes both in the DNA and in the RNAP (known as isomerization), the RPc is converted into the more stable polymerase/promoter open complex (RPo) in which ∼13 bp of DNA are separated to create the transcription initiation bubble. RNA synthesis takes place upon incorporation of NTPs which triggers the transition of the RPo to a processive elongation complex. Hydroxyradical, DNaseI and High [NaCl] Fast-Kinetic MnO4 DNA footprinting (5–7), time-resolved X-ray induced OH-footprinting (8) and rapid [perturbant] upshift experiments (9) have shown that conversion from RPc to RPo passes through several intermediates whose number and thermodynamic features depend on the specific sequence of the promoter recognized by E. coli RNAP (6). It is also thought that, during RPo formation, bending and wrapping of the DNA facilitate the unwinding of the double helix (10) and several studies have shown that in the RPo the DNA is wrapped around the RNAP by an interaction between the carboxy-terminal domains of the alpha subunits (αCTD) and A/T-rich UP elements located upstream of the -35 hexamer (11–16). Although many in vitro and in vivo studies support the idea that ppGpp and DksA regulate gene expression by affecting the equilibrium of RPo formation (2,4,17–21), the structural mechanism that explains how this equilibrium is affected on different promoters is not well understood.
To dissect the RPo conformational changes associated with the binding of ppGpp and DksA to RNAP, we employed Atomic Force Microscopy (AFM) to visualize and quantify, at the single molecule level, the finite structural changes that these modulators may inflict on RPo and in vitro transcription assays to monitor promoter activity under the different conditions. AFM provides unique details about the interaction mechanism of individual protein–DNA complexes near physiological conditions, facilitates the study and dissection of different molecular species within a sample population and provides important statistical information not accessible through traditional biochemical studies (22).
In the present work we analyzed the conformation of initiation complexes formed at the ribosomal promoters (rrnA P1, rrnB P1 and its discriminator (dis) variant) and at the λ phage pR promoter which are strongly but differently regulated by stringent response modulators ppGpp and DksA (4,11,15,16,21,23–26). By measuring the contour length of RNAP–promoter complexes we obtained information about the extent of DNA wrapping under the different conditions assayed. Moreover, the large amount of complexes and free DNA molecules analyzed allowed us to determine the promoter occupancy in the absence and in the presence of one or both modulators. The promoter occupancy is then used to calculate microscopic Kd values for each condition assayed. Based on genetic, biochemical (18,27,28) and recent structural data (29,30), our results support a model where ppGpp decreases RNAP–promoter affinity by reducing the mobility between the β and β’ subunits, which in turn limits the accommodation of promoter DNA into the enzyme active site and hinders the subsequent isomerization to open complex. Differently, DksA binding to the RNAP secondary channel interferes with the proper ribonucleotide positioning in the RNAP active site, decreasing open complex stability but only at promoters with an intrinsically unstable open complexes, such as the rrn promoters.
MATERIALS AND METHODS
Proteins and reagents
DksA expression vector was constructed by cloning the E. coli dksA gene into a pET28(b) vector (EMD Biosciences). A genomic copy of the dksA gene from K12 strain was amplified using Taq DNA polymerase with primer forward 5′ATATAAAGCTAGCATGCAAGAAGGGCAAAACCG and primer reverse 5′ATTTTAAAGCTTTTAGCCAGCCATCTGTTTTTC in standard reaction conditions. The PCR product was digested with Nhe I and Hind III (Thermo Scientific) and ligated to a linearized pET28(b) vector DNA with compatible ends. Cloning was verified by sequencing. The construct is such to add the His6-tag sequence and a thrombin recognition site to the N-terminus of DksA. His6-tagged DksA was expressed in BL21 cells (Novagene), purified from the soluble fraction and digested with thrombin (Sigma-Aldrich) as described in the Supplementary data. E. coli RNAP was purchased from Epicentre Biotechnologies, and the concentration was determined with the Qubit Protein Assay Kit (Life Technologies). ppGpp was purchased from TriLink Biotechnologies. iNTPs were purchased from Promega.
DNA templates
The 1035 and the 1044 bp long DNA templates, harboring the rrnB P1 and the rrnA P1 promoters respectively, were obtained by PCR from plasmids pNEB-rrnB and pNEB-rrnA using Taq DNA polymerase in standard reaction conditions. pNEB-rrnB was constructed by cloning the rrnB P1 promoter region (from position −375 to +80 with respect to transcription starting site) of E. coli K12 strain into the poly-linker of plasmid pNEB193. pNEB-rrnA was constructed by cloning the rrnA P1 promoter region (from position −383 to +80 with respect to transcription starting site) of E. coli K12 strain into the poly-linker of plasmid pNEB193. The 1004 bp long DNA template harboring the pR promoter from −396 to +85 was obtained by PCR from pDE13 plasmid obtained as described in (31). The 1035 DNA templates harboring the rrnB P1(dis) was obtained by PCR from plasmids pNEB-rrnB(dis), constructed by mutagenesis of pNEB-rrnB with the QuikChange II Site-Directed Mutagenesis Kit (Agilent) and oligonucleotides 5′GTTCCGTGTCAGTGGTGTATCAT TATAGGGAGTTATTC and 5′GAATAACTCCCTATAATGATACACCACTGACACGGAAC. Mutants were verified by DNA sequencing. All DNA fragments were gel purified by electroelution using an Elutrap apparatus (Schleicher & Schuell, Keene, NH, USA). The DNA was phenol/chloroform extracted, ethanol precipitated and resuspended in 5 mM Tris-HCl pH 7.4. The DNA concentration was determined by absorbance at 260 nm.
Complex formation and AFM imaging
Promoter complexes were obtained by mixing 20 nM DNA with 35 nM RNAP in transcription buffer (20 mM Tris–HCl pH 7.9, 50 mM KCl, 5 mM MgCl2, 10 mM DTT) and incubated for 20 min at 37°C. For RPo formed at the rrn promoters, 1 mM ATP and 0.1 mM CTP were added to the reaction except when otherwise stated. When required, RNAP was preincubated for 20 min at 37°C with ppGpp and/or DksA at the stated concentrations before DNA addition, except when ppGpp was added after RPo formation.
The reaction was diluted ten times in deposition buffer (4 mM HEPES pH 7.4, 10 mM NaCl, 2 mM MgCl2) and deposited onto freshly cleaved mica. For deposition of rrn promoter complexes, 1 mM ATP and 0.1 mM CTP were added to deposition buffer. The sample was incubated onto mica for 2 min before the surface was rinsed with water and finally dried with nitrogen. AFM imaging was carried out in air using tapping mode with a Nanoscope IIIA microscope (Veeco Digital Instruments, Santa Barbara, CA, USA). Images of 512×512 pixels were collected with a scan size of 2 μm at a scan rate of 2.5 lines per second.
DNA contour length measurements
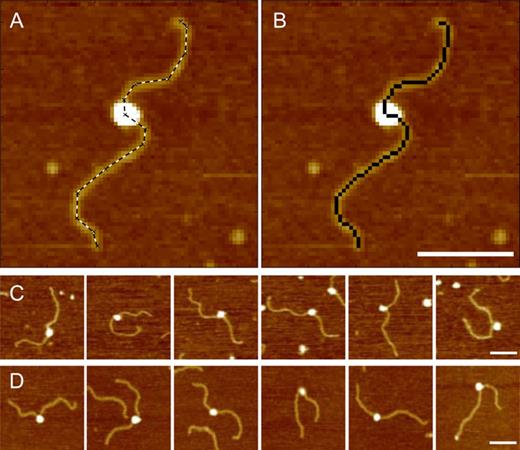
(A) A promoter complex with a manually traced outline (dashed line). (B) The same complex as in C with the sequence of pixels used for DNA contour length measurements highlighted in black. (C) Gallery of promoter complexes formed in the absence of modulators. (D) Gallery of promoter complexes formed with 200 μM ppGpp and 650 nM DksA. The broadening effect of the AFM tip does not allow to detect the presence of the modulators bound to the RNAP. Scale bars 100 nm.
Selection of specific promoter complexes
From the pool of RNAP–DNA complexes observed with AFM, promoter-specific and non-specific complexes were clearly distinguished by mapping the relative position of the RNAP along the DNA template. First, we measured the contour length and marked the position of the RNAP along the DNA trace for each observed complex which was completely contained within the image boundaries, had only one polymerase bound near the center of the DNA template, where the promoter is located, and had an unambiguous shape. Second, from the DNA contour length and the position of the RNAP, we determined the contour length of the DNA arms, i.e. the length of the DNA path from the center of the RNAP to both DNA ends. The arms ratio was used to discriminate between specific and non-specific complexes. Complexes with a DNA arm ratio within ±0.12 from the mean of the distribution were considered specifically bound to the promoter, whereas complexes with an arm ratio outside this range or bound to the DNA ends were considered non-specific. A schematic representation of the selection filter applied to each promoter is shown in Supplementary Figure S4, whereas the distributions of arm ratio for each condition assayed are shown in Supplementary Figure S6A–Z.
Dissociation constants determination
Site-specific dissociation constants of promoter complexes were determined using the inverse of Equation (5) derived in Yang (2005) (33) (see the Supplementary data for details). DNA molecules and RNAP–DNA complexes were scored and categorized as follows: (i) total DNA, those with or without RNAPs bound; (ii) specific complexes, those in which a RNAP was bound at the promoter site; (iii) non-specific complexes, all the RNAPs bound at sites away from the promoter including the DNA ends. The ratio between the number of specific complexes and the total number of DNA molecules gives the fractional occupancy. The free RNAP concentration was determined by subtracting the concentration of bound RNAP from the total RNAP concentration. In all experiments the total DNA concentration and the total RNAP concentration in the deposition solution was 2.0 nM and 3.5 nM, respectively.
In vitro transcriptions
Single-round in vitro transcription assays were carried out using linear DNA templates obtained by PCR from plasmid pNEB-rrnB and pNEB-rrnB(dis) (primer forward: 5′AGTGAATTCGAGCTCGGTAC; primer reverse 5′TGCCCGTTTTACAGCGTTAC). The 243 bp long DNA templates have the run-off termination sites located 103 bp downstream of the transcription start site. The 249 bp DNA template harboring the λ pR promoter was obtained by PCR from plasmid pDE13 (primer forward: 5′TGCTTTAAGGCGACGTGCG; primer reverse 5′TAGCAAACCGACTCTAGAGG). This template has the run-off termination site located 104 bp downstream of the transcription start site.
Transcription reactions were assembled in 10 μl final volume as follows: RNAP (35 nM) was preincubated in transcription buffer with none, one or both modulators at the concentrations indicated in Figure 8, for 10 min at 37°C. Afterward, DNA templates (20 nM) and iNTPs (as indicated in Figure 8) were added and the reaction was incubated for 15 min at 37°C to favor RPo formation. Transcription was started by the addition of 1 μl NTP mix composed of 200 μM ATP, CTP and GTP, 100 μM UTP and 1 mg/ml heparin immediately after the addition of [α-32P]UTP (1 μCi; 1 Ci = 37 GBq). After 10 min of incubation at 30°C the reaction was terminated by the addition of 10 μl of formamide loading buffer. Electrophoresis was performed on a 7 M urea-6% polyacrylamide gel and the RNA transcript was quantified by a Packard Cyclone (Alliance Analytical). The in vitro transcription assays were repeated at least two times.
RESULTS
Visualization and analysis of transcription initiation complexes
To study the effect of ppGpp, DksA and initiating nucleotides (iNTPs) on the conformation of transcription initiation complexes, we employed AFM to image RPo complexes formed at the rrnA P1, rrnB P1, rrnB P1 (dis) and λ pR promoters in the absence and in the presence of one or both modulators. Transcription complexes were assembled in vitro, deposited onto freshly cleaved mica and imaged ‘in air’ by tapping mode AFM. Because interaction of the complexes with the mica surface can potentially alter the nucleoprotein complex conformation, experiments were conducted under conditions that favor 2D equilibration of DNA on mica (34).
As previously reported by us (13,15,16,35) and by others (14,36), protein-induced DNA compaction is a measure of DNA wrapping around the bound protein that leads to an extended interaction between the protein and the DNA. AFM images of transcription complexes were then analyzed to determine the DNA contour length as illustrated in Figure 1A,B and described in the Materials and Methods. The difference between the contour lengths of bare and RNAP-complexed DNA is then used to infer the extent of DNA wrapped around the promoter bound RNAP (results are summarized in Table 1). Figure 1C and D depict a gallery of representative promoter complexes imaged as described in the Materials and Methods while full-scan AFM images of complexes formed at the different promoters, with and without modulators, are reported in Supplementary Figure S3.
Promoter occupancy and DNA compaction of different promoter complexes with and without modulators
| Promoter | Modulator | iNTPs | Promoter occupancy (%) | DNA size (bp) | Bare DNA contour length (nm) | Promoter complex DNA contour length (nm) | DNA compaction (nm) | Figure |
|---|---|---|---|---|---|---|---|---|
| rrnB P1 | – | ATP + CTP | 7.0 | 1035 | 334.6 ± 0.5 (321) | 317.3 ± 0.8 (351) | 17.3 ± 0.9 | 2A, S6A |
| rrnB P1 | 200 μM ppGpp | ATP + CTP | 6.1 | 1035 | 332.9 ± 0.7 (328) | 317.1 ± 0.8 (312) | 15.8 ± 1.1 | 2B, S6B |
| rrnA P1 | – | ATP + CTP | 6.4 | 1044 | 337.4 ± 0.3 (324) | 321.9 ± 0.4 (390) | 15.5 ± 0.5 | S5A, S6J |
| rrnA P1 | 200 μM ppGpp | ATP + CTP | 5.1 | 1044 | 339.0 ± 0.3 (310) | 321.6 ± 0.7 (354) | 17.4 ± 0.8 | S5B, S6K |
| pR | – | – | 22.1 | 1004 | 322.3 ± 0.6 (204) | 293.1 ± 1.0 (333) | 29.2 ± 1.2 | 2C, S6N |
| pR | 200 μM ppGpp | – | 4.8 | 1004 | 326.2 ± 0.6 (359) | 310.8 ± 1.1 (342) | 15.4 ± 1.3 | 2D, S6O |
| pR | 200 μM ppGpp | ATP + UTP | 11.2 | 1004 | 325.8 ± 0.4 (339) | 309.2 ± 0.9 (342) | 16.6 ± 1.0 | 3A, S6P |
| pR | – | ATP + UTP | 23.8 | 1004 | 323.6 ± 0.5 (245) | 293.4 ± 0.8 (338) | 30.2 ± 0.9 | 3B, S6Q |
| pR | 200 μM ppGpp (*) | – | 20.5 | 1004 | 325.9 ± 0.4 (136) | 298.0 ± 0.4 (456) | 27.9 ± 0.6 | 3C, S6R |
| rrnB P1 | 325 nM DksA | ATP + CTP | 4.6 | 1035 | 333.9 ± 0.5 (327) | 328.0 ± 0.7 (321) | 5.9 ± 0.9 | 4A, S6C |
| rrnB P1 | 650 nM DksA | ATP + CTP | 4.6 | 1035 | 333.3 ± 0.6 (339) | 330.8 ± 1.0 (331) | 2.5 ± 1.2 | 4B, S6D |
| rrnB P1 | – | – | 2.8 | 1035 | 338.2 ± 0.3 (347) | 336.5 ± 0.4 (291) | 1.7 ± 0.5 | 4C, S6H |
| rrnB P1 | 650 nM DksA | 10X ATP + CTP | 7.5 | 1035 | 337.9 ± 0.4 (312) | 323.6 ± 0.5 (398) | 14.3 ± 0.6 | 4D, S6I |
| rrnA P1 | 325 nM DksA | ATP + CTP | 4.2 | 1044 | 335.2 ± 0.4 (249) | 329.7 ± 0.6 (360) | 5.5 ± 0.7 | S5C, S6L |
| rrnA P1 | 650 nM DksA | ATP + CTP | 4.4 | 1044 | 335.2 ± 0.5 (227) | 334.3 ± 0.4 (422) | 0.9 ± 0.6 | S5D, S6M |
| pR | 325 nM DksA | – | 25.2 | 1004 | 323.6 ± 0.4 (256) | 291.0 ± 0.7 (345) | 32.6 ± 0.8 | 5A, S6S |
| pR | 650 nM DksA | – | 24.2 | 1004 | 323.0 ± 0.4 (277) | 295.1 ± 0.7 (380) | 27.9 ± 0.8 | 5B, S6T |
| rrnB P1 | 200 μM ppGpp 105 nM DksA | ATP + CTP | 3.7 | 1035 | 337.8 ± 0.4 (351) | 325.4 ± 0.9 (308) | 12.4 ± 1.0 | 6A, S6E |
| rrnB P1 | 200 μM ppGpp 325 nM DksA | ATP + CTP | 3.9 | 1035 | 332.5 ± 0.6 (349) | 328.1 ± 0.9 (318) | 4.4 ± 1.1 | 6B, S6F |
| rrnB P1 | 200 μM ppGpp 650 nM DksA | ATP + CTP | 3.5 | 1035 | 336.3 ± 0.3 (324) | 334.7 ± 0.6 (335) | 1.6 ± 0.7 | 6C, S6G |
| pR | 200 μM ppGpp 105 nM DksA | – | 6.5 | 1004 | 325.2 ± 0.4 (310) | 307.6 ± 1.0 (381) | 17.6 ± 1.1 | 6D, S6U |
| pR | 200 μM ppGpp 325 nM DksA | – | 11.1 | 1004 | 323.4 ± 0.5 (331) | 302.9 ± 0.9 (349) | 20.5 ± 1.0 | 6E, S6V |
| pR | 200 μM ppGpp 650 nM DksA | – | 10.5 | 1004 | 325.2 ± 0.4 (330) | 302.8 ± 0.9 (355) | 22.4 ± 1.0 | 6F, S6W |
| pR | 200 μM ppGpp 650 nM DksA | ATP + UTP | 10.0 | 1004 | 325.7 ± 0.4 (321) | 304.8 ± 0.7 (347) | 20.9 ± 0.9 | 6G, S6X |
| rrnB P1 (dis) | – | ATP + CTP | 11.7 | 1035 | 336.3 ± 0.4 (255) | 322.3 ± 0.4 (446) | 14.0 ± 0.6 | 7A, S6Y |
| rrnB P1 (dis) | 200 μM ppGpp 650 nM DksA | ATP + CTP | 11.0 | 1035 | 336.8 ± 0.5 (300) | 322.8 ± 0.7 (423) | 14.0 ± 0.8 | 7B, S6Z |
(*) ppGpp added after RPo formation. Nucleotides concentration was 1 mM for ATP and 0.1 mM for CTP or UTP. DNA contour length values are reported ± SEM. In parenthesis the number of molecules measured. In figure references S = Supplementary.
| Promoter | Modulator | iNTPs | Promoter occupancy (%) | DNA size (bp) | Bare DNA contour length (nm) | Promoter complex DNA contour length (nm) | DNA compaction (nm) | Figure |
|---|---|---|---|---|---|---|---|---|
| rrnB P1 | – | ATP + CTP | 7.0 | 1035 | 334.6 ± 0.5 (321) | 317.3 ± 0.8 (351) | 17.3 ± 0.9 | 2A, S6A |
| rrnB P1 | 200 μM ppGpp | ATP + CTP | 6.1 | 1035 | 332.9 ± 0.7 (328) | 317.1 ± 0.8 (312) | 15.8 ± 1.1 | 2B, S6B |
| rrnA P1 | – | ATP + CTP | 6.4 | 1044 | 337.4 ± 0.3 (324) | 321.9 ± 0.4 (390) | 15.5 ± 0.5 | S5A, S6J |
| rrnA P1 | 200 μM ppGpp | ATP + CTP | 5.1 | 1044 | 339.0 ± 0.3 (310) | 321.6 ± 0.7 (354) | 17.4 ± 0.8 | S5B, S6K |
| pR | – | – | 22.1 | 1004 | 322.3 ± 0.6 (204) | 293.1 ± 1.0 (333) | 29.2 ± 1.2 | 2C, S6N |
| pR | 200 μM ppGpp | – | 4.8 | 1004 | 326.2 ± 0.6 (359) | 310.8 ± 1.1 (342) | 15.4 ± 1.3 | 2D, S6O |
| pR | 200 μM ppGpp | ATP + UTP | 11.2 | 1004 | 325.8 ± 0.4 (339) | 309.2 ± 0.9 (342) | 16.6 ± 1.0 | 3A, S6P |
| pR | – | ATP + UTP | 23.8 | 1004 | 323.6 ± 0.5 (245) | 293.4 ± 0.8 (338) | 30.2 ± 0.9 | 3B, S6Q |
| pR | 200 μM ppGpp (*) | – | 20.5 | 1004 | 325.9 ± 0.4 (136) | 298.0 ± 0.4 (456) | 27.9 ± 0.6 | 3C, S6R |
| rrnB P1 | 325 nM DksA | ATP + CTP | 4.6 | 1035 | 333.9 ± 0.5 (327) | 328.0 ± 0.7 (321) | 5.9 ± 0.9 | 4A, S6C |
| rrnB P1 | 650 nM DksA | ATP + CTP | 4.6 | 1035 | 333.3 ± 0.6 (339) | 330.8 ± 1.0 (331) | 2.5 ± 1.2 | 4B, S6D |
| rrnB P1 | – | – | 2.8 | 1035 | 338.2 ± 0.3 (347) | 336.5 ± 0.4 (291) | 1.7 ± 0.5 | 4C, S6H |
| rrnB P1 | 650 nM DksA | 10X ATP + CTP | 7.5 | 1035 | 337.9 ± 0.4 (312) | 323.6 ± 0.5 (398) | 14.3 ± 0.6 | 4D, S6I |
| rrnA P1 | 325 nM DksA | ATP + CTP | 4.2 | 1044 | 335.2 ± 0.4 (249) | 329.7 ± 0.6 (360) | 5.5 ± 0.7 | S5C, S6L |
| rrnA P1 | 650 nM DksA | ATP + CTP | 4.4 | 1044 | 335.2 ± 0.5 (227) | 334.3 ± 0.4 (422) | 0.9 ± 0.6 | S5D, S6M |
| pR | 325 nM DksA | – | 25.2 | 1004 | 323.6 ± 0.4 (256) | 291.0 ± 0.7 (345) | 32.6 ± 0.8 | 5A, S6S |
| pR | 650 nM DksA | – | 24.2 | 1004 | 323.0 ± 0.4 (277) | 295.1 ± 0.7 (380) | 27.9 ± 0.8 | 5B, S6T |
| rrnB P1 | 200 μM ppGpp 105 nM DksA | ATP + CTP | 3.7 | 1035 | 337.8 ± 0.4 (351) | 325.4 ± 0.9 (308) | 12.4 ± 1.0 | 6A, S6E |
| rrnB P1 | 200 μM ppGpp 325 nM DksA | ATP + CTP | 3.9 | 1035 | 332.5 ± 0.6 (349) | 328.1 ± 0.9 (318) | 4.4 ± 1.1 | 6B, S6F |
| rrnB P1 | 200 μM ppGpp 650 nM DksA | ATP + CTP | 3.5 | 1035 | 336.3 ± 0.3 (324) | 334.7 ± 0.6 (335) | 1.6 ± 0.7 | 6C, S6G |
| pR | 200 μM ppGpp 105 nM DksA | – | 6.5 | 1004 | 325.2 ± 0.4 (310) | 307.6 ± 1.0 (381) | 17.6 ± 1.1 | 6D, S6U |
| pR | 200 μM ppGpp 325 nM DksA | – | 11.1 | 1004 | 323.4 ± 0.5 (331) | 302.9 ± 0.9 (349) | 20.5 ± 1.0 | 6E, S6V |
| pR | 200 μM ppGpp 650 nM DksA | – | 10.5 | 1004 | 325.2 ± 0.4 (330) | 302.8 ± 0.9 (355) | 22.4 ± 1.0 | 6F, S6W |
| pR | 200 μM ppGpp 650 nM DksA | ATP + UTP | 10.0 | 1004 | 325.7 ± 0.4 (321) | 304.8 ± 0.7 (347) | 20.9 ± 0.9 | 6G, S6X |
| rrnB P1 (dis) | – | ATP + CTP | 11.7 | 1035 | 336.3 ± 0.4 (255) | 322.3 ± 0.4 (446) | 14.0 ± 0.6 | 7A, S6Y |
| rrnB P1 (dis) | 200 μM ppGpp 650 nM DksA | ATP + CTP | 11.0 | 1035 | 336.8 ± 0.5 (300) | 322.8 ± 0.7 (423) | 14.0 ± 0.8 | 7B, S6Z |
(*) ppGpp added after RPo formation. Nucleotides concentration was 1 mM for ATP and 0.1 mM for CTP or UTP. DNA contour length values are reported ± SEM. In parenthesis the number of molecules measured. In figure references S = Supplementary.
Direct visualization of the molecular components of the transcription reaction and accurate determination of the RNAP binding site enabled us to distinguish not only between bound and unbound DNA, but also between promoter-bound and non-specifically bound RNAPs (Supplementary Figure S4). This determination, together with the very large number of molecules analyzed, made it possible to obtain a statistically meaningful value for the promoter occupancy under different conditions. The promoter occupancy—defined as the percent ratio between the number of complexes with an RNAP specifically bound at the promoter site and the total number of DNA molecules (bound and unbound)—was then used to determine the microscopic dissociation constant of the promoter complex under various conditions (results are summarized in Table 2). To this end, we employed a previously developed statistical analysis of AFM images for the determination of protein–DNA site-specific binding constants (33). See the Supplementary data for details.
Number of molecular species scored in the images and computed dissociation constants (Kd) and free energies of association (ΔG)
| Promoter | Modulator | iNTPs | Total DNA | N. specific complexes | N. Non-specific complexes | Fractional promoter occupancy | Kd (nM) | ΔG (kJ/mol) |
|---|---|---|---|---|---|---|---|---|
| rrnB P1 | – | ATP + CTP | 4896 | 351 | 2615 | 0.070 ± 0.002 | 30.2 ± 1.0 | −44.6 ± 0.1 |
| rrnB P1 | – | – | 10882 | 291 | 3575 | 0.028 ± 0.002 | 93.9 ± 5.3 | −41.7 ± 0.1 |
| rrnB P1 | 200 μM ppGpp | ATP + CTP | 5470 | 312 | 2055 | 0.061 ± 0.002 | 40.6 ± 1.0 | −43.9 ± 0.1 |
| rrnB P1 | 650 nM DksA | ATP + CTP | 7541 | 331 | 2133 | 0.046 ± 0.004 | 60.4 ± 5.7 | −42.9 ± 0.2 |
| rrnB P1 | 200 μM ppGpp 650 nM DksA | ATP + CTP | 9626 | 335 | 2692 | 0.035 ± 0.004 | 79.7 ± 10.1 | −42.2 ± 0.3 |
| rrnB P1 | 650 nM DksA | 10X ATP + CTP | 6015 | 398 | 1913 | 0.075 ± 0.004 | 34.2 ± 1.7 | −44.1 ± 0.2 |
| rrnB P1 (dis) | – | ATP + CTP | 3843 | 446 | 1990 | 0.117 ± 0.018 | 17.3 ± 2.9 | −46.1 ± 0.4 |
| rrnB P1 (dis) | 200 μM ppGpp 650 nM DksA | ATP + CTP | 3863 | 423 | 1628 | 0.110 ± 0.007 | 19.8 ± 1.4 | −45.7 ± 0.2 |
| pR | – | – | 1401 | 333 | 1429 | 0.221 ± 0.016 | 3.5 ± 0.3 | −50.2 ± 0.3 |
| pR | 200 μM ppGpp | – | 7156 | 342 | 1547 | 0.048 ± 0.004 | 61.6 ± 5.6 | −42.8 ± 0.2 |
| pR | 200 μM ppGpp (*) | – | 2139 | 456 | 2275 | 0.205 ± 0.034 | 2.8 ± 1.7 | −51.1 ± 1.5 |
| pR | 200 μM ppGpp | ATP + UTP | 2972 | 342 | 2020 | 0.112 ± 0.007 | 15.2 ± 1.1 | −46.4 ± 0.2 |
| pR | – | ATP + UTP | 1443 | 338 | 1471 | 0.238 ± 0.015 | 2.9 ± 0.2 | −50.7 ± 0.2 |
| pR | 650 nM DksA | – | 1532 | 380 | 2157 | 0.242 ± 0.015 | 0.8 ± 0.1 | −54.0 ± 0.2 |
| pR | 200 μM ppGpp 650 nM DksA | – | 3373 | 355 | 1399 | 0.105 ± 0.025 | 22.2 ± 7.0 | −45.5 ± 0.8 |
| pR | 200 μM ppGpp 650 nM DksA | ATP + UTP | 3715 | 347 | 1152 | 0.100 ± 0.016 | 25.7 ± 4.4 | −45.1 ± 0.5 |
(*) ppGpp added after RPo formation. Nucleotides concentration was 1 mM for ATP and 0.1 mM for CTP or UTP. Total DNA represents the number of bound and unbound DNA molecules visualized in the images. Specific complexes represent the number of RNAP bound at the promoter following the criteria described in the Materials and methods. Non-specific complexes are those in which the RNAP is bound away from the promoter. The promoter occupancy is obtained from the ratio between the number of specific complexes and the total number of DNA. The dissociation constant (Kd) was determined as described in the text. ΔG = RT ln Kd. Values are given ± SD of three experiments.
| Promoter | Modulator | iNTPs | Total DNA | N. specific complexes | N. Non-specific complexes | Fractional promoter occupancy | Kd (nM) | ΔG (kJ/mol) |
|---|---|---|---|---|---|---|---|---|
| rrnB P1 | – | ATP + CTP | 4896 | 351 | 2615 | 0.070 ± 0.002 | 30.2 ± 1.0 | −44.6 ± 0.1 |
| rrnB P1 | – | – | 10882 | 291 | 3575 | 0.028 ± 0.002 | 93.9 ± 5.3 | −41.7 ± 0.1 |
| rrnB P1 | 200 μM ppGpp | ATP + CTP | 5470 | 312 | 2055 | 0.061 ± 0.002 | 40.6 ± 1.0 | −43.9 ± 0.1 |
| rrnB P1 | 650 nM DksA | ATP + CTP | 7541 | 331 | 2133 | 0.046 ± 0.004 | 60.4 ± 5.7 | −42.9 ± 0.2 |
| rrnB P1 | 200 μM ppGpp 650 nM DksA | ATP + CTP | 9626 | 335 | 2692 | 0.035 ± 0.004 | 79.7 ± 10.1 | −42.2 ± 0.3 |
| rrnB P1 | 650 nM DksA | 10X ATP + CTP | 6015 | 398 | 1913 | 0.075 ± 0.004 | 34.2 ± 1.7 | −44.1 ± 0.2 |
| rrnB P1 (dis) | – | ATP + CTP | 3843 | 446 | 1990 | 0.117 ± 0.018 | 17.3 ± 2.9 | −46.1 ± 0.4 |
| rrnB P1 (dis) | 200 μM ppGpp 650 nM DksA | ATP + CTP | 3863 | 423 | 1628 | 0.110 ± 0.007 | 19.8 ± 1.4 | −45.7 ± 0.2 |
| pR | – | – | 1401 | 333 | 1429 | 0.221 ± 0.016 | 3.5 ± 0.3 | −50.2 ± 0.3 |
| pR | 200 μM ppGpp | – | 7156 | 342 | 1547 | 0.048 ± 0.004 | 61.6 ± 5.6 | −42.8 ± 0.2 |
| pR | 200 μM ppGpp (*) | – | 2139 | 456 | 2275 | 0.205 ± 0.034 | 2.8 ± 1.7 | −51.1 ± 1.5 |
| pR | 200 μM ppGpp | ATP + UTP | 2972 | 342 | 2020 | 0.112 ± 0.007 | 15.2 ± 1.1 | −46.4 ± 0.2 |
| pR | – | ATP + UTP | 1443 | 338 | 1471 | 0.238 ± 0.015 | 2.9 ± 0.2 | −50.7 ± 0.2 |
| pR | 650 nM DksA | – | 1532 | 380 | 2157 | 0.242 ± 0.015 | 0.8 ± 0.1 | −54.0 ± 0.2 |
| pR | 200 μM ppGpp 650 nM DksA | – | 3373 | 355 | 1399 | 0.105 ± 0.025 | 22.2 ± 7.0 | −45.5 ± 0.8 |
| pR | 200 μM ppGpp 650 nM DksA | ATP + UTP | 3715 | 347 | 1152 | 0.100 ± 0.016 | 25.7 ± 4.4 | −45.1 ± 0.5 |
(*) ppGpp added after RPo formation. Nucleotides concentration was 1 mM for ATP and 0.1 mM for CTP or UTP. Total DNA represents the number of bound and unbound DNA molecules visualized in the images. Specific complexes represent the number of RNAP bound at the promoter following the criteria described in the Materials and methods. Non-specific complexes are those in which the RNAP is bound away from the promoter. The promoter occupancy is obtained from the ratio between the number of specific complexes and the total number of DNA. The dissociation constant (Kd) was determined as described in the text. ΔG = RT ln Kd. Values are given ± SD of three experiments.
At rrn promoters ppGpp does not affect DNA wrapping and slightly reduces promoter occupancy
To understand the mechanism of ppGpp action, we examined its effect on the conformation and stability of RPo formed at the rrnB P1 promoter in the presence of iNTPs. First, we analyzed the RPo at this promoter in the absence of ppGpp; specifically, we analyzed the extent of DNA wrapping around the RNAP by measuring the DNA contour length of RPo and comparing it to the contour length of bare DNA. The DNA template used in these experiments was 1035 bp long with the rrnB P1 +1 site located 444 bp from the upstream end (Figure 2A, top), which allows accurate determination of a specific complex based on the position of the RNAP on the DNA template. The DNA contour length distribution of RPo showed a mean value of 317.3 ± 0.8 nm (SEM), i.e. 17.3 ± 0.9 nm shorter than the contour length of free DNA molecules (334.6 ± 0.5 nm) scored in the same set of images (Figure 2A). This DNA compaction indicates that the DNA is wrapped around the RNAP during RPo formation, most probably by an interaction between the C-terminal domain of the α subunit (αCTD) and the UP element, located between the −38 and −59 positions in the promoter (37–39). This result disagrees from previously published data reporting a DNA compaction of ∼30 nm upon the binding of RNAP to the rrnB P1 promoter (14). This discrepancy most likely arises from the significantly different number of complexes analyzed in the two studies, from different experimental condition and also from the methodology used to measure the DNA contour length.
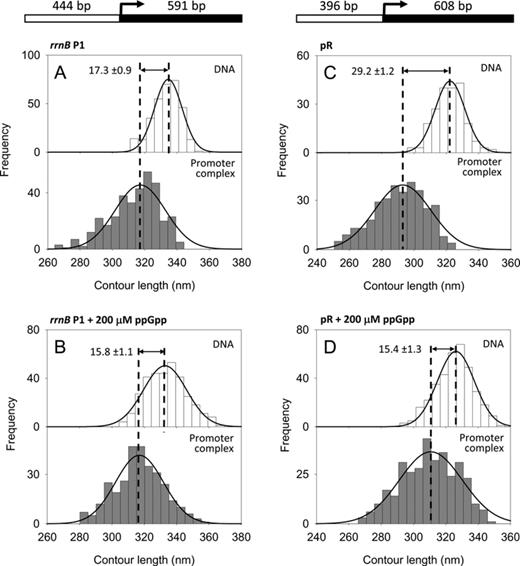
DNA contour length distributions of bare DNA (top panel) and RPo complexes (bottom panel). (A) rrnB P1 promoter without ppGpp. (B) rrnB P1 promoter with 200 μM ppGpp. (C) λ pR promoter without ppGpp. (D) λ pR promoter with 200 μM ppGpp. The DNA compaction is shown as the difference between the mean values of the fitted Gaussian functions ± SEM. A schematic representation of the DNA templates used is drawn at the top.
To test the effect of ppGpp on RPo conformation, RNAP was preincubated with saturating concentration of ppGpp (200 μM, Supplementary Figure S1) for 20 min at 37°C prior to incubation with DNA to form the RPo. As shown in Figure 2B, the observed DNA compaction (15.8 ± 1.1 nm) was similar to the DNA contour length of the RPo in the absence of ppGpp (17.3 ± 0.9 nm), indicating that under these conditions ppGpp does not affect DNA wrapping at the rrnB P1 promoter. This result is further confirmed by the analysis of the RPo formed at the rrnA P1 ribosomal promoter, which has a very similar nucleotide sequence. As shown in Supplementary Figure S5A and B, RPo formed at the rrnA P1 promoter displays a DNA compaction of 15.5 ± 0.5 nm in the absence of ppGpp and 17.4 ±0.8 nm in the presence of 200 μM ppGpp.
In addition to the DNA contour length measurements, the same set of images was subjected to a statistical analysis of the number of molecular species present on the surface. With the rrnB P1 promoter, in the absence of ppGpp, the observed RNAP promoter occupancy was 7.0%, while in the presence of a saturating concentration of ppGpp, the promoter occupancy was 6.1%. Similar results were observed with rrnA P1, where the RNAP promoter occupancy was 6.4% in the absence of ppGpp and 5.1% in the presence of 200 μM ppGpp (Table 1). Thus, at the rrn promoters, in the presence of iNTPs, ppGpp does not affect DNA wrapping and decreases only slightly the RNAP promoter occupancy.
At λ pR ppGpp reduces promoter occupancy and DNA wrapping
Similarly to the ribosomal promoters, the λ phage pR promoter is down-regulated by ppGpp (26,40). However, it is not clear how and at which stage of the transcription cascade this down-regulation occurs. To characterize the effect of ppGpp on DNA wrapping at this promoter, we imaged RPo by AFM and analyzed their conformation in the absence and in the presence of ppGpp. RPo were assembled in transcription buffer without the addition of the first nucleotides (iNTPs) since these are not necessary to make a stable RPo at this promoter. The 1004 bp DNA construct used to assemble the complexes harbors a pR promoter near the center of the fragment as depicted at the top of Figure 2C. The contour length analysis of free DNA and RPo assembled without ppGpp yielded a DNA compaction of 29.2 ± 1.2 nm in the RPo, a value which is in full agreement with previous results (13,15) and that is explained by a model where the DNA promoter wraps around the RNAP up to position −100 due to the presence of two A–T rich sequences, similar to UP elements, in the pR upstream region (16). Interestingly, when RPo complexes were assembled with RNAP preincubated with 200 μM ppGpp, we observed two significant effects: (i) the fraction of RNAP molecules specifically bound at the promoter (4.8%) was significantly smaller than that the fraction of specific complexes observed in the absence of ppGpp (22.1%) and (ii) the measured DNA compaction was of 15.4 ± 1.3 nm (Figure 2D), one-half of the value observed in the absence of ppGpp (29.2 ± 1.2 nm) (Figure 2C). Thus, in contrast to the ribosomal promoters, at pR ppGpp reduces significantly the number of stable RPo and decreases by half the extent of DNA contacts with the RNAP. Importantly, an equal concentration of GTP does not affect DNA wrapping at pR (data not shown). Taken together, these results suggest that in the presence of ppGpp, RNAP is unable to make the conformational changes required for a complete interaction with the DNA promoter region, which leads to a reduced DNA wrapping and destabilization of the RPo.
The effect of ppGpp on DNA wrapping is independent of the initiating nucleotides
It has been suggested that the inhibitory effect of ppGpp on transcription may be mitigated by high concentrations of the first two nucleotides to be incorporated into the RNA chain (41,42). This hypothesis was supported by the idea that ppGpp could compete for the nucleotide binding site in RNAP; however, recent structural and biochemical evidence indicates that ppGpp binds at the interface between the ω and the β′ subunits (29,30). Nonetheless, it is possible that the absence of ppGpp effect observed on RPo at the ribosomal promoters was due to the initiating nucleotides (1 mM ATP and 0.1 mM CTP) added to the reaction to stabilize the RPo. Because RPo cannot be observed at rrnB P1 without iNTPs (43) (see below), we analyzed the effect of ppGpp on the DNA wrapping at pR, in the presence of initiating nucleotides (1 mM ATP and 0.1 mM UTP) to assess whether the ppGpp effect on DNA wrapping and RPo stability was abolished by the iNTPs. As shown in Figure 3A, under these conditions we observed a DNA contour length compaction of 16.6 ± 1.0 nm, indicating that the initiating nucleotides do not alter the effect of ppGpp on DNA wrapping at pR. However, the presence of iNTPs increased significantly the promoter occupancy from 4.8% to 11.2% (Table 1) implying that, with ppGpp-saturated RNAP, the nucleotides favor RPo formation. Interestingly, such a large stabilizing effect was not observed in the absence of ppGpp (Figure 3B and Table 1) indicating that the alarmone constrains the conformation of RPo in a state that is less stable, less wrapped and iNTPs-sensitive.
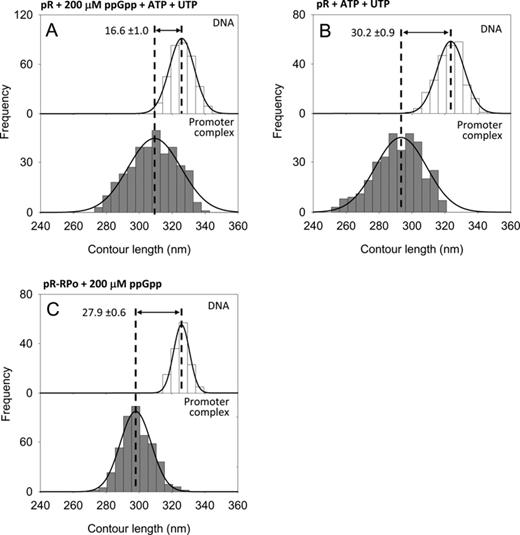
DNA contour length distributions of bare DNA (top panel) and RPo complexes (bottom panel) at the λ pR promoter. (A) With 200 μM ppGpp and 1 mM ATP, 0.1 mM UTP. (B) With 1 mM ATP, 0.1 mM UTP. (C) With 200 μM ppGpp added after RPo formation.
ppGpp reduces DNA wrapping only when bound to RNAP before RPo formation
Since the energetic barrier of the isomerization from a closed complex (RPc) to an open complex (RPo) is significantly high, we asked if the effect of ppGpp depends on the order in which it is added relative to the formation of the RPo. To this end, RNAP and promoter DNA were allowed to form first the open promoter complex by incubation in transcription buffer for 20 min at 37°C, after which 200 μM ppGpp was added to the reaction followed by 20 min incubation at 37°C. Under these conditions, we observed a DNA compaction of 27.9 ± 0.6 nm (Figure 3C) and a promoter occupancy of 20.5% (Table 1), values similar to those obtained at pR in the absence of ppGpp. The slight decrease of DNA compaction may be due to a small fraction of complexes formed after ppGpp addition. Together, these results indicate that ppGpp affects both RNAP–promoter affinity and DNA wrapping only when bound to the RNAP before RPo formation. According to this interpretation, ppGpp could regulate gene expression by altering the equilibrium between intermediates involved in the formation of a stable RPo.
DksA reduces promoter occupancy and DNA wrapping only at short-lived RPo
Genetic and biochemical evidences suggest that the transcription regulator DksA binds to the RNAP secondary channel with a Kd of about 100 nM (44), and modulates the expression of a series of genes through an unknown mechanism. To dissect the regulatory mechanism of DksA, we studied its effect on the DNA wrapping and RPo stability under different conditions. To this end, we used a similar strategy to the one we used with ppGpp: we imaged RPo assembled at the rrn and pR promoters with RNAP preincubated with different concentrations of DksA. Figure 4A shows the DNA contour length distribution of free DNA and RPo formed at the rrnB P1 promoter in the presence of 325 nM DksA. As described above, the RPo formed at this promoter in the absence of modulators displays a DNA compaction of 17.3 ± 0.9 nm, whereas in the presence of DksA the DNA compaction is reduced to 5.9 ± 0.9 nm, value that is further reduced to 2.5 ± 1.2 nm at 650 nM DksA (Figure 4B). This observation was confirmed by data obtained with the rrnA P1 promoter, where DksA is seen to display the same effect as in rrnB P1 promoter (Supplementary Figure S5C,D and Table 1). Furthermore, in the presence of DksA the promoter occupancy observed at these promoters is lower than that observed without the modulator (Table 1), indicating a reduced affinity of the DksA-bound promoter complex. Thus, saturating concentrations of DksA reduce both promoter occupancy and DNA wrapping in RPo formed at the rrn promoters.
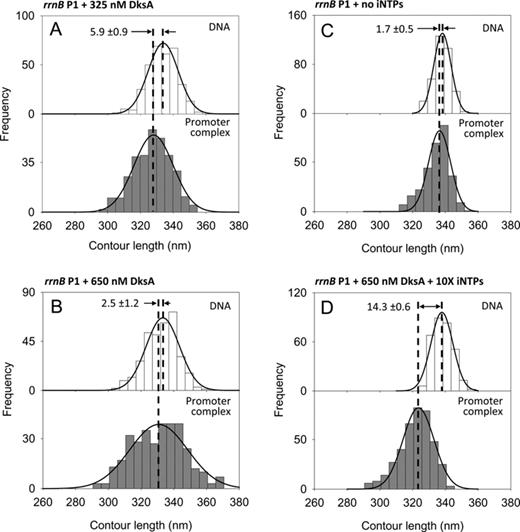
DNA contour length distributions of bare DNA (top panels) and promoter-bound complexes (bottom panels) assembled onto a 1035 bp long DNA fragment harboring the rrnB P1 promoter under different conditions. (A) 325 nM DksA; (B) 650 nM DksA; (C) without iNTPs; (D) 650 nM DksA, 10 mM ATP and 1 mM CTP.
To better understand the effect of DksA on the structure and stability of the RPo formed at the ribosomal promoters, we performed experiments aimed at characterizing the nucleotide dependence of this effect. First, we analyzed the effect of nucleotides omission, a condition that prevents the formation of stable RPo in ribosomal promoters (see below), in the absence of modulators (43). AFM images of complexes assembled in the absence of iNTPs revealed that RNAP could still bind to the promoter in a specific way, as shown by the position of the enzyme along the DNA template (see Supplementary Figure S6H). However, the DNA contour length analysis of these complexes revealed that, in the absence of iNTPs, the RNAP–promoter complexes displayed no DNA compaction (Figure 4C), which is consistent with a closed transcription complex (RPc) (45). The absence of DNA wrapping was associated with a lower promoter occupancy value of 2.8%, compared to the 7.0% observed when iNTPs were added to the reaction (Table 1). This scenario—low promoter occupancy and no wrapping—was also observed when the experiment was repeated with saturating concentrations of iNTPs and DksA, suggesting an interplay between DksA and iNTPs. Indeed, when the complexes were assembled with 650 nM DksA and a 10X iNTPs concentration (10 mM ATP, 1 mM CTP), the rrnB P1 promoter occupancy increased from 4.6 to 7.5% (Table 1), while the DNA compaction reached a value of 14.3 ± 0.6 nm (Figure 4D), similar to the experiment with no modulators and 1X iNTPs. Thus, increasing the iNTPs concentration counteracts the negative effect of DksA, suggesting a direct competition between DksA and iNTPs for the RNAP binding site. Based on these results, we propose that DksA destabilizes the open complex at the rrnB P1 promoter by interfering with the binding of the iNTPs, thereby destabilizing the RPo and tilting the equilibrium toward the formation of a less stable complex. These results further suggest that DksA does not destabilize RPc since the promoter occupancy in the presence of DksA is comparable to that in the absence of iNTPs.
To further characterize the DksA–iNTPs interplay, we reasoned that if the mechanism of action of DksA is to interfere with nucleotide binding, DksA should have little or no effect on RPo formed at the nucleotide-insensitive λ pR promoter. Therefore, experiments were conducted to investigate the effect of DksA on the large DNA compaction and high promoter occupancy observed at λ pR. For these experiments, RPo were assembled at pR using RNAP preincubated with 325 nM or 650 nM DksA. The DNA contour length measurements reveal that the DNA compaction is not affected by saturating concentrations of DksA as it remains at values around 30 nm (Figure 5A and B); likewise, the promoter occupancy is not significantly altered by 650 nM DksA, showing even a slight increase from 22.1% to 24.2% (Table 1). These results reinforce the hypothesis that DksA interferes with nucleotide positioning into the RNAP active site, thus affecting primarily iNTPs-sensitive promoters such as the ribosomal promoters.

DNA contour length distributions of bare DNA (top panels) and specific complexes (bottom panels) assembled onto a 1004 bp long DNA fragment harboring the pR promoter. (A) With 325 nM DksA. (B) With 650 nM DksA.
ppGpp does not interfere with the effect of DksA at the rrnB P1 promoter
It has been shown that ppGpp and DksA work together in the cell to down-regulate rrn promoters (2,18), but the mechanism by which these modulators interact is unclear. To explore the synergistic/antagonistic mechanisms of ppGpp and DksA, we studied the combined effects of these modulators on DNA wrapping and RPo stability at the rrnB P1. Specifically, we analyzed RPo complexes formed with RNAP preincubated with a fixed saturating concentration of ppGpp (200 μM) at different concentrations of DksA (105 nM, 325 nM and 650 nM) (Figure 6A–C). The 1035 bp DNA fragment harboring the rrnB P1 promoter was used as template. The DNA compaction observed at 200 μM ppGpp plus 325 nM DksA is of 4.4 ±1.1 nm (Figure 6B), a value very closed to that observed with 325 nM DksA alone. Likewise, the DNA compaction observed at 200 μM ppGpp plus 650 nM DksA is of 1.6 ± 0.7 nm (Figure 6C), again in full agreement with the results obtained with 650 nM DksA alone. In both experiments, the promoter occupancy was also comparable (3.9%) to that in the presence of DksA alone (4.6%) (Table 1). Thus, the effect observed in the presence of the two transcriptional modulators replicates that of DksA alone.
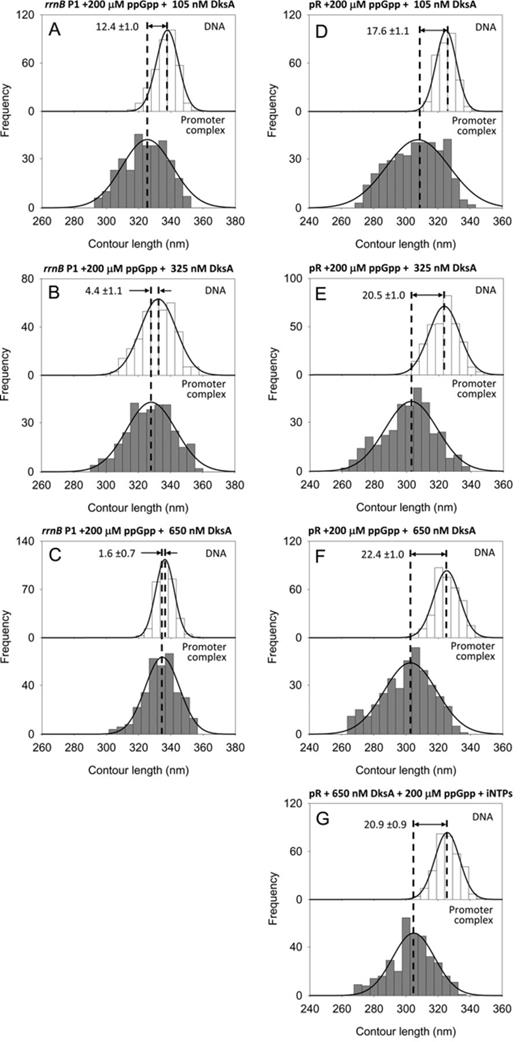
(A–C) DNA contour length distributions of bare DNA (top panels) and promoter-bound complexes (bottom panels) assembled onto a 1035 bp long DNA fragment harboring the rrnB P1 promoter in the presence of 200 μM ppGpp and increasing concentration of DksA. (D–F) DNA contour length distributions of bare DNA (top panels) and RPo (bottom panels) assembled onto a 1004 bp long DNA fragment harboring the λ pR promoter in the presence of 200 μM ppGpp and increasing concentration of DksA. (A,D) 105 nM DksA; (B,E) 325 nM DksA; (C,F) 650 nM DksA. (G) DNA contour length distributions of bare DNA (top panels) and RPo (bottom panels) assembled at pR with 200 μM ppGpp, 650 nM DksA, 1 mM ATP and 0.1 mM UTP.
Although this result confirms that ppGpp does not affect DNA wrapping at the rrnB P1 promoter, we reasoned that a possible synergistic effect of ppGpp could be hidden by the use of saturating amounts of DksA in the previous experiments. Therefore we performed experiments under a non-saturating concentration of DksA. Specifically, RPo were assembled with RNAP preincubated with 200 μM ppGpp and 105 nM DksA, close to its Kd of ∼100 nM (44). The DNA contour length distribution shown in Figure 6A displays a DNA compaction of 12.4 ± 1.0 nm, which falls in between the values observed with no DksA (17.3 ± 0.9 nm) and 325 nM DksA (5.9 ± 0.9 nm), thus confirming that under these conditions the effect of the two modulators reflects that of DksA alone.
DksA counteracts the effect of ppGpp at the pR promoter
It has been shown both in vivo and in vitro that the down-regulation exerted by ppGpp at pR can be neutralized by a stimulatory effect of DksA on this promoter (4). To test if this effect involves a change on DNA wrapping and/or promoter occupancy, we performed experiments aimed to verify the effect of DksA at pR in the presence of ppGpp. RPo complexes were assembled on the 1004 bp pR template using RNAP preincubated with 200 μM ppGpp and increasing DksA concentrations. The DNA contour length distributions shown in Figure 6D–F reveal a DNA compaction of 17.6 ± 1.1 nm, 20.5 ± 1.0 nm and 22.4 ± 1.0 nm at 105 nM, 325 nM and 650 nM DksA, respectively. These results suggest that the loss of DNA wrapping observed with ppGpp alone is gradually mitigated by DksA. This effect is also expressed in terms of binding, as we observed a substantial increase of promoter occupancy from 4.8% at 200 μM ppGpp and no DksA up to 11% at 200 μM ppGpp and saturating DksA concentration (Table 1).
In the presence of ppGpp, the stabilizing effect of DksA is similar to that of iNTPs, although while DksA increases both DNA wrapping and promoter occupancy, the iNTPs increase significantly only promoter occupancy (from 4.8% to 11.2%). To characterize the interplay between ppGpp, DksA and iNTPs at the λ pR promoter, we have analyzed the conformation of complexes assembled at pR with 200 μM ppGpp, 650 nM DksA and iNTPs (1 mM ATP and 0.1 mM UTP). Under these conditions, we observe a DNA wrapping of 20.9 ± 0.9 nm (Figure 6G) and a promoter occupancy of 10.0% (Table 1). These results indicate that the presence of DksA prevents the stabilizing effect of iNTPs probably by hindering their access to the RNAP active site, consistent with our results observed in the ribosomal promoters with DksA and iNTPs.
ppGpp and DksA do not affect DNA wrapping and promoter occupancy at the rrnB P1 (dis) promoter mutant
To investigate the possible relations between DNA wrapping and the core promoter sequences, we have analyzed the effect of ppGpp and DksA on the rrnB P1(dis) promoter mutant. rrnB P1(dis) is a variant of rrnB P1 with a 3-bp change in the discriminator region from −5 to −7 (GCG → TAT) that forms a much longer-lived open complex which is insensitive to both ppGpp and DksA (2,46). Figure 7A shows that RPo formed at this promoter mutant have a DNA compaction of 14.0 nm, in agreement with the DNA compaction observed at the rrnB P1 promoter. The ability to form a longer-lived RPo is revealed by the observation that under our imaging conditions, rrnB P1(dis) has a promoter occupancy of 11.7%, higher than rrnB P1 but lower than λ pR. The presence of 200 μM ppGpp and 650 nM DksA does not affect neither the DNA wrapping nor the promoter occupancy (Figure 7B and Table 1). This result indicates that the different extensions of DNA wrapping caused by ppGpp and DksA as observed by AFM reflect different states of core promoter elements along the pathway of open complex formation.
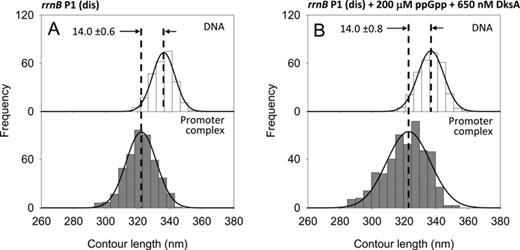
DNA contour length distributions of bare DNA (top panels) and promoter-bound complexes (bottom panels) assembled onto a 1035 bp long DNA fragment harboring the rrnB P1 (dis) promoter mutant. (A) In the absence of modulators. (B) In the presence of 200 μM ppGpp and 650 nM DksA.
Determination of RNAP–promoter binding constants from statistical analysis of AFM images
The promoter occupancy, defined as the ratio between the number of specific complexes and the total number of DNA molecules present in the AFM images, provides a simple way to compare promoter binding affinities under the different experimental conditions used in this study. In principle, by using this approach, it would be possible to determine the RNAP binding affinity or dissociation constant (Kd) of a set of transcription complexes imaged with AFM, through the analysis of the promoter occupancy in conjunction with the values of free RNAP and free DNA concentrations. Following this concept, Yang et al. developed a statistical analysis of AFM images to estimate the binding constant of nucleoprotein complexes, which relies solely on counting the different molecular species (33). We employed this method to estimate the microscopic dissociation constant (Kd) of the RNAP–promoter complex imaged by AFM under different conditions (see the Materials and Methods and Supplementary data for details). Table 2 reports the counts of the different species found in the AFM images, the promoter complex dissociation constants and corresponding ΔG values. The dissociation constant for the rrnB P1 promoter in the presence of iNTPs is 30.2 ±1.0 nM (S.D.), while without iNTPs the Kd is 93.9 ±5.3 nM, confirming the positive effect of the iNTPs on the stability of the rrn open promoter complex. The addition of 200 μM ppGpp slightly reduces the affinity of the RNAP for the rrnB P1 promoter resulting in a Kd of 40.6 ±1.0 nM with a ΔΔG of +0.7 kJ/mol. This observation is in agreement with the small effect of the alarmone on the stability of the open complex at these promoters. Conversely, the Kd in the presence of 650 nM DksA is 60.4 ±5.7 nM, corresponding to a ΔΔG of +1.7 kJ/mol and reflecting the negative effect of the protein on the stability of these complexes. In the presence of both ppGpp and DksA we observed a Kd of 79.7 ± 10.1 nM with a ΔΔG of +2.4 kJ/mol. The ΔΔG values indicate that under our experimental conditions ppGpp and DksA destabilize the RPo by independent mechanisms (i.e. +0.7 kJ/mol +1.7 kJ/mol = +2.4 kJ/mol). Interestingly, rrnB P1 promoter complexes assembled in the presence of 650 nM DksA but with a 10X concentration of iNTPs display a Kd of 34.2 ± 1.7 nM, suggesting a direct interference between DksA and nucleotide binding. The rrnB P1 (dis) promoter mutant displays a Kd that is about half that of the wt promoter confirming its ability to make longer-lived open complexes and, most importantly, the Kd is not affected by ppGpp and DksA.
The same statistical analysis was carried out on AFM images of complexes formed with the λ pR promoter. As shown in Table 2, the dissociation constant of RPo at this promoter is 3.5 ± 0.3 nM, confirming the significantly higher stability of the pR RPo compared to the rrn promoters, even in the absence of initiating nucleotides. The addition of 200 μM ppGpp caused a dramatic reduction of the promoter occupancy, which is reflected in a Kd of 61.6 ± 5.6 nM with a ΔΔG of +7.4 kJ/mol. This decrease in affinity was not observed when ppGpp was added after the formation of the RPo (Kd 2.8 ±1.7 nM). Because RNAP forms long-lived RPo at pR (26,47,48), the dependence on the order of addition of the alarmone supports the hypothesis that ppGpp constrains the complex in some intermediate state before RPo formation. Interestingly, the addition of iNTPs during the formation of RPo by ppGpp-bound RNAP resulted in a recovery of affinity as indicated by the Kd value of 15.2 ± 1.1 nM. Notice that the iNTPs do not change the Kd of the RPo in the absence of ppGpp (2.9 ± 0.2 nM). These results indicate that the promoter complexes formed at pR with ppGpp-bound RNAP have become iNTPs-sensitive.
Table 2 also shows that DksA, although it does not reduce DNA wrapping at pR, increases significantly the RNAP affinity for this promoter as indicated by a Kd of 0.8 ± 0.1 nM corresponding to a change in ΔΔG of −3.8 kJ/mol. This result is consistent with previously reported data (4) confirming that ppGpp and DksA have an antagonist effect on the transcription at pR. Because at this promoter iNTPs are not required for the formation of a stable RPo, the observation that DksA does not decrease the affinity of RNAP for this promoter (indeed increases it) is consistent with the hypothesis that the inhibitory effect of DksA on rrn promoters most likely occurs by interfering with the binding of nucleotides to the polymerase active site. The concomitant addition of both modulators resulted in a Kd of 22.2 ± 7.0 nM with a ΔΔG of +4.7 kJ/mol. This value is somewhat larger than the 3.6 kJ/mol that would be expected if the two modulators acted independently.
Determination of promoters activity by single-round in vitro transcription
To verify the activity of the different promoters under the different conditions used in this study, we have performed single-round in vitro transcription assays. For these experiments we used linear DNA templates with a run-off termination site located ∼100 bp downstream of the transcription start site (see the Materials and Methods for details). As depicted in Figure 8A, ppGpp reduces transcription of the rrnB P1 promoter by half (lane 2). A similar effect is observed with DksA (lane 3). The addition of both ppGpp and DksA have an independent cumulative effect on transcription inhibition of this promoter (lane 4). No transcription was observed in the absence of iNTPs during RPo formation (lane 5), confirming that the promoter complexes observed by AFM under these conditions are in a closed conformation. To test the observation made by AFM that an increase of the iNTP concentration counteracts the DksA effect (Figure 4D), a transcription reaction was assembled using 10 mM ATP and 1 mM CTP (10X iNTPs) as initiating nucleotides, in the absence and in the presence of 650 nM DksA. Under these conditions, the transcriptional output of the rrnB P1 promoter was almost unaffected by DksA (Figure 8B, lanes 1 and 2). To further confirm this hypothesis, we conducted a transcription assay using a much lower iNTPs concentration, 0.1 mM ATP and 0.01 mM CTP (0.1X iNTPs) (Figure 8B, lanes 3 and 4). Under these conditions, transcription from rrnB P1 can occur, but in the presence of DksA we observed an inhibitory effect significantly stronger than that with higher iNTPs concentrations. A plot of the relative promoter activity in the presence of DksA as a function of the iNTPs concentration is depicted in Figure 8C.
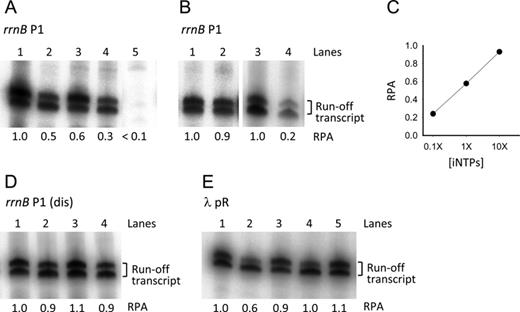
In vitro single-round transcription assays. (A) rrnB P1 promoter activity with 1X iNTPs (1 mM ATP, 0.1 mM CTP) and with no modulators (lane 1); with 200 μM ppGpp (lane 2); with 650 nM DksA (lane 3); with 200 μM ppGpp and 650 nM DksA (lane 4); without iNTPs (lane 5). (B) rrnB P1 promoter activity with 10X iNTPs (10 mM ATP, 1 mM CTP) and no modulators (lane 1); with 10X iNTPs and 650 nM DksA (lane 2); with 0.1X iNTPs (0.1 mM ATP, 0.01 mM CTP) and no modulators (lane 3); with 0.1X iNTPs and 650 nM DksA (lane 4). (C) Plot of the rrnB P1 relative promoter activity (RPA) in the presence of 650 nM DksA versus the iNTPs concentration. (D) rrnB P1 (dis) promoter activity with 1X iNTPs and with no modulators (lane 1); with 200 μM ppGpp (lane 2); with 650 nM DksA (lane 3); with 200 μM ppGpp and 650 nM DksA (lane 4). (E) λ pR promoter activity with no modulators (lane 1); with 200 μM ppGpp (lane 2); with 650 nM DksA (lane 3); with 200 μM ppGpp and 650 nM DksA (lane 4); with 200 μM ppGpp added after RPo formation (lane 5). All transcription reactions were carried out in the presence 100 μg/ml heparin. The two bands of the transcript are probably due to inhomogeneous run-off termination. For each gel, the RPA indicated below each lane was determined from the cumulative intensity of the two bands relative to that in lane 1 except for lane 4 in panel B which is relative to lane 3.
Figure 8D shows that the promoter activity of the rrnB P1 (dis) promoter mutant is substantially insensitive to the presence of ppGpp and DksA added either alone or in combination. These results are consistent with the AFM data showing that the rrnB P1 (dis) DNA wrapping and binding affinity are unaffected by the two modulators.
The pR promoter (Figure 8E) is inhibited by ppGpp (lane 2) whereas DksA has little or no effect on the transcriptional output (lane 3). However, the presence of DksA cancels the inhibitory effect of ppGpp (lane 4). Moreover, in line with the AFM observation, the addition of ppGpp after RPo formation has no effect on transcription (lane 5).
DISCUSSION
The conformational analysis of a large number of E. coli RNAP–DNA complexes—more than 140 000 single molecules have been considered in this study—made it possible to gain new insights on the effect of the stringent response modulators ppGpp and DksA at two promoters that form RPo with different thermodynamic and kinetic features. The rrnB P1 promoter forms stable RPo only in the presence of high concentration of iNTPs, resulting in a DNA wrapping of ∼17 nm, most probably due to an interaction between the RNAP αCTDs and the UP element located in the −38 to −59 region. The value of the microscopic Kd of the RNAP for the rrnB P1 promoter determined under these conditions is 10 times higher than the Kd observed for λ pR, where the formation of stable RPo does not require iNTPs and results in a DNA wrapping of ∼30 nm. The larger DNA wrapping observed at pR is attributed to extensive contacts between a particularly AT-rich sequence located far upstream of this promoter (up to −100) and the carboxy-terminus domain of RNAP α subunits (αCTDs) (15,16).
At λ pR, RPo formation passes through at least two intermediates (I1 and I2) characterized by different extents of DNA protection (i.e. DNA wrapping) and different degrees of strand separation: I1 is a DNA-wrapped complex in a closed state (5), while I2 is a DNA-wrapped complex in the open state (6). The upstream DNA can contact dynamic elements of the RNAP (jaw domain, trigger loop and β’SI3) involved in the conformational changes that result in the tight closure of the core and shelf modules around the downstream DNA (7). Our data indicate that this extended interaction is not transient and represents a characteristic feature of the pR open complex, in agreement with previous biochemical characterizations of this promoter (49,50). The far upstream sequence of rrnB P1 does not make a stable interaction with the RNAP, and therefore the structural transition that leads to the tight closure of the jaw and stabilization of the open complex does not occur. The presence of a G+C-rich discriminator sequence at this promoter also contributes to this effect (51,52). Based on these results, we propose that the lack of a tightly wrapped RPo conformation makes the open complex at this promoter unstable and it can be accumulated only with high concentrations of iNTPs, which stabilize the open state by binding into the RNAP active site.
Noteworthy, in the absence of iNTPs, rrnB P1 does not form productive RPo (Figure 8A, lane 5) suggesting that the promoter complexes seen by AFM under these conditions are in a closed conformation (RPc). Our observation that RPc do not display DNA wrapping further supports the idea that there exists a topological link between the degree of DNA wrapping around the RNAP and the extend of strand separation at the RNAP active site with the concomitant stabilization of RPo (10).
Recent structural evidences (53) show that the shelf and core modules form a clothespin-like leverage system, hinged on the core-shelf ratcheting axis, that can make ratcheting movements relative to each other. The crystal structure shows that ppGpp binds at the interface between these two modules on the rear side of the clothespin-like structure, where it is proposed to interfere with the ratcheting dynamics of the RNAP (30). Our data show that the addition of ppGpp has a drastic effect on the formation of the RPo at pR, in fact it decreases promoter occupancy and, more importantly, it decreases the extent of DNA wrapping. This observation is in agreement with the inhibitory effect of ppGpp at pR as assessed by in vitro transcription assay (Figure 8E, lane 2) and published data (4,26). Our data support the hypothesis that binding of ppGpp to the switch region constrains the RNAP in a conformation that prevents the tight closure of the shelf and core modules and suggest that this structural transition is coupled to the wrapping of DNA around the RNAP. Interestingly, the complexes formed at pR in the presence of ppGpp are structurally (they have the same DNA wrapping) and thermodynamically (they have comparable association free energies) similar to the RPo formed at rrnB P1 without ppGpp and with iNTPs. This observation is in agreement with the hypothesis that the I2 and/or I3 intermediates at λ pR resemble the open complex at rrnB P1 (5,6,50).
Two further experiments conducted with λ pR shed light into the action mechanism of ppGpp: first, the observation that the addition of ppGpp after RPo assembly has no or very little effect on DNA wrapping, promoter occupancy and transcriptional output suggests that ppGpp prevents RNAP to undergo the conformational changes that lead to the formation of the RPo; however, once formed, the long-lived open complex is unaffected by ppGpp. Moreover, the presence of iNTPs during complex assembly does not prevent ppGpp from reducing DNA wrapping at λ pR, confirming that the iNTPs do not compete with ppGpp. Notice that, under these conditions, we observed a significant increase in promoter occupancy indicating that the destabilizing effect of ppGpp on RPo is, in part, compensated by iNTPs binding. This result implies that promoter complexes formed at pR by ppGpp-bound RNAP become iNTPs-sensitive, which is another feature shared with the rrnB P1 promoter complex. We speculate that under environmental stress conditions, high levels of ppGpp decrease DNA wrapping and RPo stability at pR, turning these complexes sensitive to the intracellular concentration of nucleotides. The loss of affinity and DNA wrapping may also expose the divergent pRM promoter, which is sequestered in the DNA-wrapped region of pR, thus favoring a genetic switch toward the lysogenic pathway, which actually takes place during host starvation (54).
In line with the hypothesis that ppGpp prevents or decrease the ratcheting movement of RNAP, we found that the addition of saturating amounts of ppGpp does not significantly affect either promoter affinity or DNA wrapping at the ribosomal promoters. Since there is no evidence of an I2 intermediate during RPo formation at the ribosomal promoters, we favor a scenario where the I2 → RPo transition is the most probable target of ppGpp, which explains both the lack of effect of ppGpp on the ribosomal promoters and the large reduction of DNA wrapping and promoter occupancy at pR. Consequently, the transcription inhibition of the rrnB P1 promoter observed in the presence of ppGpp (Figure 8A, lane 2) must take place in steps following RPo formation, such as promoter clearance and/or elongation.
The analysis of the effect of DksA on RPo formation at these two promoters provides new insights into the action mechanism of this modulator. At the ribosomal promoters, DksA reduces promoter affinity and eliminates DNA wrapping, suggesting that this modulator tilts the equilibrium toward a state that resembles the RPc obtained in the absence of iNTPs. DksA may destabilize the RPo directly, by interfering with nucleotide positioning in the RNAP active site, or allosterically, by affecting the RNAP conformational changes required for RPo formation (21). However, the observation that increasing concentrations of iNTPs counteract the effect of DksA at rrnB P1 and that DksA alone does not destabilize the iNTPs-insensitive RPo at pR inclines us to support a mechanism in which DksA interferes directly with nucleotide binding. Interestingly, when pR complexes become iNTPs-sensitive by the addition of ppGpp, DksA prevents the stabilizing effect of the nucleotides. Based on similarities with other RNAP secondary channel binding proteins, DksA may exert its interference by positioning the coiled-coil domain into this channel as proposed in various structural studies (2,18,21,27). Two conserved aspartate residues in the coiled-coil tip of DksA are thought to coordinate a Mg+2 ion in the RNAP active site destabilizing nucleotide positioning. However, at λ pR DksA alone increases RNAP–promoter affinity (Kd changes from 3.5 to 0.8 nM; Table 2) in accordance with published EMSA data (4). This effect cannot be explained with a simple nucleotide competition mechanism but requires the assumption of an allosteric effect, not detectable in our AFM images, that lead to rearrangements in RNAP regions interacting with the promoter.
Several lines of evidence indicate that ppGpp and DksA act synergistically to reduce transcription at the rrn promoters (2,42). Here we show that the concomitant addition of DksA and ppGpp reduces the rrnB P1 promoter occupancy relative to the two modulators added independently but, as indicated by the ΔΔG values (+0.7 kJ/mol for the addition of ppGpp; +1.7 kJ/mol for the addition of DksA; +2.4 kJ/mol for the addition of both modulators) ppGpp and DksA act independently. However, we cannot exclude that the reported synergistic effect of ppGpp and DksA may be exerted at steps subsequent to RPo formation. Conversely, at λ pR, increasing concentrations of DksA progressively recover part of the DNA wrapping and promoter affinity loss caused by ppGpp (the same effect is displayed in the transcription assay), highlighting the previously reported antagonistic role of these two modulators at this promoter.
Here, we presented new evidence in support of the hypothesis that both ppGpp and DksA can regulate transcription initiation by affecting the equilibrium of the reaction that leads to the formation of the RPo. We propose that the two modulators act through different, yet connected, mechanisms: ppGpp allosterically constrains RNAP movements thereby preventing DNA–protein contacts that stabilize the open complex, while DksA hinders nucleotide binding. Based on these evidences, we propose that the interplay between the two modulators is coupled to the concentration of iNTPs, to the wrapping of upstream DNA around the RNAP and to other factors, such as the discriminator sequence, all contributing to the energy landscape toward the opening of the double helix for the formation of a productive transcription complex.
We would like to thank Rodrigo Maillard for technical support with CD experiments, Marta Kopaczynska for AFM training, Stefano Maggi for help with image analysis and Beatrice Fermi for technical advices with in vitro transcription assays. We also thank the Centro Interdipartimentale Misure of the University of Parma for the AFM facility.
FUNDING
Italian Ministry of Education, University and Research [to N.D.]; Burroughs-Wellcome Fund [to P.R.A.]; Cayetano Heredia University and the Fogarty International Center [R03 TW008610 to D.G.G.]; Howard Hughes Medical Institute and the National Institutes of Health [R01 GM32543 to C.B.]; University of Parma [to C.R.]. Funding for open access charge: Publication charges will be split among three institutions: (i) Dipartimento di Bioscienze, University of Parma. (ii) Departments of Physics, Chemistry, and Molecular and Cell Biology, University of California, Berkeley. (iii) Laboratorio de Moléculas Individuales, Facultad de Ciencias y Filosofía, Universidad Peruana Cayetano Heredia.
Conflict of interest statement. None declared.

Comments