-
PDF
- Split View
-
Views
-
Cite
Cite
J. Castresana, Selection of Conserved Blocks from Multiple Alignments for Their Use in Phylogenetic Analysis, Molecular Biology and Evolution, Volume 17, Issue 4, April 2000, Pages 540–552, https://doi.org/10.1093/oxfordjournals.molbev.a026334
Close - Share Icon Share
Abstract
The use of some multiple-sequence alignments in phylogenetic analysis, particularly those that are not very well conserved, requires the elimination of poorly aligned positions and divergent regions, since they may not be homologous or may have been saturated by multiple substitutions. A computerized method that eliminates such positions and at the same time tries to minimize the loss of informative sites is presented here. The method is based on the selection of blocks of positions that fulfill a simple set of requirements with respect to the number of contiguous conserved positions, lack of gaps, and high conservation of flanking positions, making the final alignment more suitable for phylogenetic analysis. To illustrate the efficiency of this method, alignments of 10 mitochondrial proteins from several completely sequenced mitochondrial genomes belonging to diverse eukaryotes were used as examples. The percentages of removed positions were higher in the most divergent alignments. After removing divergent segments, the amino acid composition of the different sequences was more uniform, and pairwise distances became much smaller. Phylogenetic trees show that topologies can be different after removing conserved blocks, particularly when there are several poorly resolved nodes. Strong support was found for the grouping of animals and fungi but not for the position of more basal eukaryotes. The use of a computerized method such as the one presented here reduces to a certain extent the necessity of manually editing multiple alignments, makes the automation of phylogenetic analysis of large data sets feasible, and facilitates the reproduction of the final alignment by other researchers.
Introduction
Phylogenetic analysis of DNA sequences requires as a first step the alignment of nucleotides or the corresponding amino acid sequences in such a way that they are homologous in every position. However, not all alignments of homologous sequences are useful for phylogenetic reconstruction, because to make a reliable phylogenetic tree, sequences should be neither so similar that they are devoid of phylogenetic information nor so divergent that many positions are saturated by multiple substitutions (Goldman 1998 ; Yang 1998 ). Since not all regions of a gene evolve at the same rate, a very common situation occurs when some parts of an alignment are well conserved and therefore suitable for phylogenetic analysis, whereas others are very divergent and full of gaps, such that positional homology cannot be precisely determined and multiple substitutions have erased the phylogenetic information. In such cases, it is recommended that the divergent regions be removed prior to phylogenetic analyses (Lake 1991 ; Olsen and Woese 1993 ; Swofford et al. 1996 ). This is usually done in an arbitrary way, with a resulting difficulty for other researchers to reproduce the same final alignments. Furthermore, it has been shown that the alignment strategy may have more impact on the reconstructed tree than does the type of tree-building method used (Morrison and Ellis 1997 ), reinforcing the importance of using accurate sequence alignments in molecular phylogenetics.
Few objective methods have been described for removing divergent regions or gap positions from an alignment. Fernandes, Nelson, and Beverley (1993) used a method based on pairwise comparisons in successive alignment windows to detect conserved regions that, however, did not deal with gap positions, which are the most problematic, in any special way. Rodrigo, Bergquist, and Bergquist (1994) proposed a method to remove only gap positions and adjacent nonidentical positions. Gatesy, DeSalle, and Wheeler (1993) suggested that regions of the alignment sensitive to different gap weights given to the alignment procedure in different runs are the most ambiguous and should be removed. In a variation of this method, the same authors downweighted the gap-sensitive regions of an alignment by concatenating alignments made with different parameters into a single alignment, but the assignment of multiple putative homologies to the same data makes the assessment of the reliability of the resulting tree difficult (Wheeler, Gatesy, and DeSalle 1995 ).
In addition, a number of other methods are able to distinguish between conserved and variable regions of an alignment (Pesole et al. 1992 ; Herrmann et al. 1996 ; Thompson et al. 1997 ), but they have not been specifically devised for efficiency in phylogenetic analysis and may not be able to distinguish important informative positions.
Here, I explore the possibility of using a computerized method that excludes alignment segments that have too many variable positions or gaps with the aim of making alignments more appropriate for phylogenetic reconstruction. A data set of 10 mitochondrial proteins from diverse eukaryotes was used for a test. Several alignment features, such as the amino acid composition and pairwise distances, as well as the performance of phylogenetic reconstruction by maximum likelihood, were analyzed in the original and final alignments to examine the advantages and disadvantages of using conserved blocks for phylogenetic analysis.
Materials and Methods
Sequences and Alignments
Complete mitochondrial genome sequences were extracted from the EMBL database (Stoesser et al. 1998 ), and protein sequences were obtained from the submitting author's translations or from the SwissProt database (Bairoch and Apweiler 1998 ). Sequences (and accession numbers) used for the first data set were as follows: the metazoans Asterina pectinifera (D16387; Asakawa et al. 1995 ), Balanoglossus carnosus (AF051097; Castresana et al. 1998 ), Homo sapiens (X93334; Arnason, Xu, and Gullberg 1996 ), Drosophila melanogaster (U37541; Lewis, Farr, and Kaguni 1995 ), Katharina tunicata (U09810; Boore and Brown 1994 ), Lumbricus terrestris (U24570; Boore and Brown 1995 ), and Metridium senile (AF000023; Beagley, Okimoto, and Wolstenholme 1998 ); the fungi Allomyces macrogynus (U41288; Paquin and Lang 1996 ), Pichia canadensis, also known as Hansenula wingei (D31785; Sekito et al. 1995 ), and Podospora anserina (X55026; Cummings et al. 1990 ); the plants Arabidopsis thaliana (Y08501 and Y08502; Unseld et al. 1997 ) and Marchantia polymorpha (M68929; Oda et al. 1992 ); the green alga Prototheca wickerhamii (U02970; Wolff et al. 1994 ); the red alga Chondrus crispus (Z47547; Leblanc et al. 1995 ); the amoeboid Acanthamoeba castellanii (U12386; Burger et al. 1995 ); and the jacobid flagellate Reclinomonas americana (AF007261; Lang et al. 1997 ). The orthologous proteins in the α-purple bacterium Paracoccus denitrificans, a close relative of the ancestral endosymbiont that gave rise to mitochondria (Yang et al. 1985 ), were used as an outgroup. The P. denitrificans NADH dehydrogenase subunits, whose nomenclature is different from that of mitochondrial genomes, were used according to Yagi (1993) . Eleven protein subunits (three subunits of cytochrome c oxidase, CO1, CO2, and CO3, one subunit of cytochrome c-ubiquinol oxidoreductase, CYTb, and seven subunits of NADH dehydrogenase, ND1, ND2, ND3, ND4, ND4L, NAD5, and ND6) were present in all chosen species. ND6 contained almost no conserved positions and was not further used.
In a second data set, only the five proteins in which most of the conserved positions had been detected, CO1, CYTb, ND1, ND4, and ND5, were used. This allowed the inclusion of the green algae Chlamydomonas eugametos (AF008237; Denovan-Wright, Nedelcu, and Lee 1998 ), Chlamydomonas reinhardtii (U03843), and Pedinomonas minor (AF116775; Turmel et al. 1999 ). In addition, the green algae Nephroselmis olivacea (AF110138; Turmel et al. 1999 ), the red algae Cyanidioschyzon merolae (D89861; Ohta, Sato, and Kuroiwa 1998 ) and Porphyra purpurea (AF114794; Burger et al. 1999 ), and the slime mold Dictyostelium discoideum (AB000109) were also included. Sequences of Tetrahymena pyriformis and Paramecium aurelia were not used, since they were extremely divergent.
Protein sequences were aligned with the program CLUSTAL W (Thompson, Higgins, and Gibson 1994 ), version 1.7, with default parameters, i.e., gap opening penalty (GOP) = 10, gap extension penalty (GEP) = 0.05, and the BLOSUM amino acid substitution matrix series. In addition to these, other parameter values were tested to study the discrepancies in the selected conserved blocks when the original alignments differed.
The Gblocks Method of Selecting Blocks from Alignments for Their Use in Phylogenetic Analysis
The method defines a set of conserved blocks from a multiple alignment according to a set of requirements designed to be as simple as possible. It uses a total of five thresholds, IS, FS, CP, BL1, and BL2, and it proceeds according to the following steps:
The degree of conservation of every position of the multiple alignment is evaluated and classified as nonconserved (<IS identical residues or there is a gap), conserved (≥IS and <FS identical residues), or highly conserved (≥FS identical residues). Default values for IS and FS are set to 50% of the number of sequences + 1 and to 85% of the number of sequences, respectively. Since the levels of identity must be very high to outline conserved blocks, no attempt has been made at the moment to define more precisely the degree of conservation of the different positions. However, further work is necessary to determine if the use of similarity matrices leads to an improvement of the method by reducing some loss of information.
All stretches of contiguous nonconserved positions >CP are rejected. In such stretches, alignments are normally ambiguous and, even when in some cases a unique alignment could be given, multiple hidden substitutions make them inadequate for phylogenetic analysis. The default value for CP is 8 positions.
In the remaining blocks, flanks are examined and positions are removed until blocks are surrounded by highly conserved positions at both flanks. This way, selected blocks are anchored by positions that can be aligned with high confidence.
Only blocks with lengths of ≥BL1 positions are kept in order to avoid small regions in which the quality of the alignment is difficult to assess. The default value for BL1 is 15 positions.
All positions with gaps are removed. Furthermore, nonconserved positions adjacent to gaps are also eliminated until a conserved position is reached, because regions adjacent to a gap are the most difficult to align.
Finally, small blocks remaining after gap cleaning are also removed (only those with ≥BL2 positions are kept). The default value for BL2 is 10 positions.
Values for the five parameters that the method uses can be adjusted to make the selection of conserved blocks more or less stringent. Default values described above are suitable for moderately divergent protein alignments. For more conserved alignments, or for DNA or rRNA alignments, other values might be preferable. For example, for rRNA alignments, BL1 and BL2 should be set to smaller values (such as 10 and 5, respectively) to be able to include many short motifs that are present in these alignments. Similarly, for protein alignments that are well conserved except for a few regions with gaps, the values of BL1 and BL2 can be smaller than default values. If groups of highly related sequences are included within the alignment, it is convenient to exclude them during the process of searching for blocks so that they do not bias the definition of conserved positions.
This procedure defines a unique set of blocks that are concatenated into a single alignment for use in further analyses. The method has been implemented in an ANSI C program called Gblocks that is available from the author.
This method of selection of conserved blocks was applied individually to the 10 mitochondrial protein alignments. Several parameters were varied in order to study the effect of the stringency of the selection. The resulting alignments were further concatenated into a single grand alignment in order to calculate several alignment parameters and to perform the subsequent phylogenetic analysis from a bigger data set.
Phylogenetic Analysis
Pairwise distances of the different alignments were calculated by maximum likelihood using the MOLPHY package, version 2.3 (Adachi and Hasegawa 1996b ), with the mtREV model of amino acid substitution (Adachi and Hasegawa 1996a ). To estimate the overall conservation of the alignments, the average distance from the outgroup to all other sequences was calculated for every individual or concatenated alignment.
Maximum-likelihood trees were calculated with the mtREV model of amino acid substitution (Adachi and Hasegawa 1996a ). For the first data set, tree searches were initially performed with the local rearrangement search available in MOLPHY. Since the topology within animals, within plants, and within fungi was very stable, the log-likelihood values of the 945 possible topologies for these three clades plus A. castellanii, C. crispus, R. americana, and the bacterial outgroup were calculated. Relative support of the maximum-likelihood tree was tested by comparing this tree with alternative topologies by means of the Kishino-Hasegawa test (Kishino and Hasegawa 1989 ), where a difference in log-likelihood of >1.96 times the standard error of that difference (P < 0.05) was considered significant. In addition, the support of the maximum-likelihood tree was also measured by bootstrap analysis in 10,000 replicates by the RELL (resampling of the estimated log-likelihood) method as implemented in MOLPHY (Kishino, Miyata, and Hasegawa 1990 ).
For the second data set, for which the inclusion of more protist lineages made impossible the calculation of the log-likelihood for all possible topologies within a reasonable time, a heuristic search for the maximum-likelihood tree by local rearrangement was done (Adachi and Hasegawa 1996b ). The starting tree was a neighbor-joining tree obtained from a matrix of likelihood distances calculated with the mtREV model.
Amino Acid Composition
The homogeneity of the amino acid composition of the sequences in the selected conserved blocks was studied by correspondence analysis (Greenacre 1984 ) of the amino acid frequencies in every sequence using the ADE-4 package (Thioulouse et al. 1997 ).
Results and Discussion
Selection of Conserved Blocks from Different Mitochondrial Protein Alignments
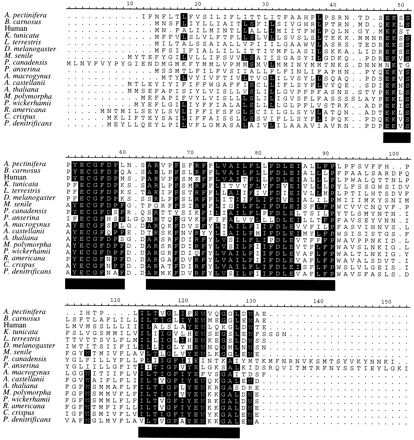
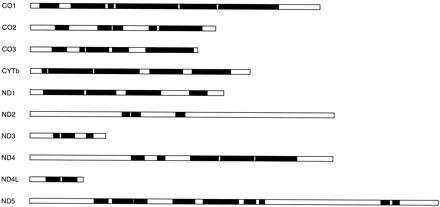
Mitochondrial protein alignments from diverse eukaryotic groups, including animals, plants, fungi, and several protists, provide a good set of cases with which to test the performance of the Gblocks method of selection of conserved blocks, since they are very different in degree of conservation and, therefore, in the number of ambiguously aligned positions to be removed. The alignment of ND3 in figure 1 illustrates how Gblocks works with default parameters. Initially, two blocks (positions 48–91 and 114–128, respectively) were selected, since they fulfilled the following conditions: both are surrounded by highly conserved positions (in this case, with ≥14 identical residues), have no big (>8) stretches of nonconserved positions (with <9 identical residues) within them, and are ≥15 positions. The first block has a gap inside, so this position plus contiguous nonconserved positions were eliminated, giving rise to two blocks from position 48 to position 60 and from position 64 to position 91, respectively. Both blocks were kept, since they were ≥10 positions. Thus, three blocks were finally selected, and they were concatenated together with blocks from other proteins for subsequent phylogenetic analyses. A schematic representation of the number and relative positions of the blocks selected in the same way from the 10 protein alignments is shown in figure 2 .
Table 1 shows the percentages of positions removed by Gblocks in the 10 proteins, which had different degrees of conservation as estimated by the average distance from the outgroup to all other sequences. As expected, the percentages of removed positions were higher in the most divergent alignments: 90.7% in ND2 and 64.8% in ND5. In comparison, 23.6% and 23.7% of the sites were removed from the best conserved alignments, CYTb and CO1, respectively. The average outgroup distance decreased in all Gblocks alignments. When all original alignments were concatenated and compared with the concatenated Gblocks alignments, this distance was reduced from 1.438 to 0.919 substitutions per site. The number of constant positions in the concatenated Gblocks alignment was 467, which includes most of the constant positions in the original alignment (479).
Amino Acid Composition in the Selected Blocks
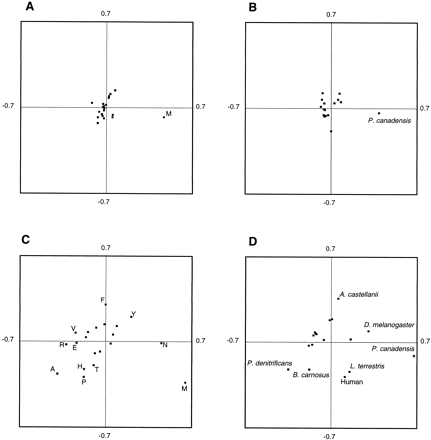
A positive effect of using conserved blocks from multiple alignments for phylogenetic reconstruction is that the amino acid composition becomes more uniform, and therefore current models of amino acid substitution that require, among other things, homogeneous composition, can be more appropriately applied. Figure 3A and B shows the distribution of amino acids and species with respect to the two principal axes obtained in a correspondence analysis of the matrix of amino acid frequencies of the 17 species in the Gblocks alignment with default parameters (2,167 positions). Figure 3C and D shows, for comparison, the same analysis in the segments that were rejected by Gblocks (2,286 positions). In the amino acid plot corresponding to the Gblocks alignment (fig. 3A ), most residues form a single cluster close to the origin. The only exception is methionine, which is far from the origin due to the anomalous amino acid composition in the mitochondrial proteins of the budding yeast Pichia canadensis, which has three times as many methionines than the average in the other species. Correspondingly, P. canadensis also appears separate from the rest of species in the species plot (fig. 3B ). In contrast, in the segments rejected by Gblocks (fig. 3C and D ), most amino acids and species are more dispersed along both principal axes, indicating a more heterogeneous amino acid composition. A possible reason for the heterogeneous amino acid composition in these segments is the existence of certain AT pressure in some species that could bias more strongly the incorporation of some amino acids in the divergent segments (Foster, Jermiin, and Hickey 1997 ). In addition, since some species in this data set differ in their mitochondrial genetic codes, the incorporation of certain amino acids in the divergent segments may be favored upon changes in the genetic code, as previously shown (Castresana, Feldmaier-Fuchs, and Pääbo 1998 ). This clearly discourages the use of the original alignments containing divergent segments, for which the amino acid composition is likely to be more heterogeneous.
Pairwise Distances and Branch Lengths in the Selected Blocks
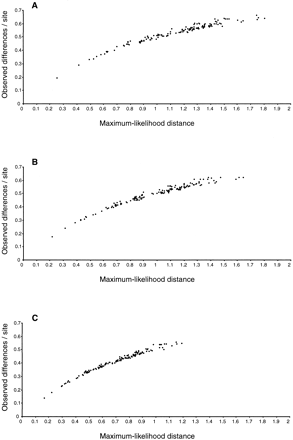
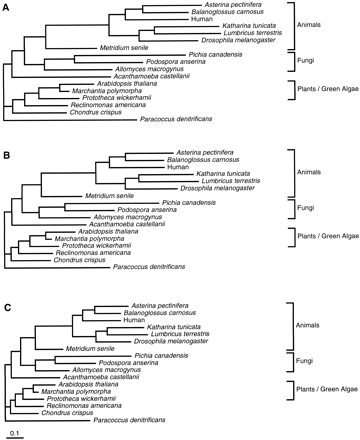
Figure 4 shows plots of pairwise maximum-likelihood distances versus observed differences in the concatenated mitochondrial protein alignments. In the original alignment, the largest distances are almost three times as large as the corresponding observed differences (fig. 4A ), and the same is true when only gap positions are removed (fig. 4B ). However, when Gblocks is applied, this ratio is notably reduced (fig. 4C ), therefore alleviating the problem of saturation. The reduction in distance upon cleaning divergent segments is also apparent in the branch lengths of the corresponding maximum-likelihood trees (fig. 5 ).
The distance values achieved after treatment with Gblocks are still very large when compared with those obtained from alignments normally used in studies of more closely related species. However, as pointed out by Yang (1998) in a study of simulated DNA sequences, optimal levels of sequence divergence are higher than previously suggested. Therefore, these Gblocks alignments may be suitable for phylogenetic analysis. Further studies are necessary to determine optimal divergence levels in protein alignments and the point at which saturation starts erasing the phylogenetic information.
Influence of Different Parameters of the Gblocks Program on the Selection of Blocks
Values for the five parameters that define a conserved block can be modified according to the desired degree of stringency. Table 2 shows the numbers of selected positions and the average outgroup distances in the concatenated blocks generated by Gblocks when these parameters were changed one by one, within sensible limits, in comparison with the concatenated original alignment and with the ungapped alignment. The number of positions selected with different parameters ranges from 1,849 to 2,271 (corresponding to a 58.5%–49% range of removed positions), and the average outgroup distance ranges from 0.797 to 0.946 substitutions per site. This variation allows one to select, within certain limits imposed by the Gblocks method, the desired degree of stringency of the selection. To have a better impression about the variation among the different alignments obtained, I calculated the numbers of positions that were chosen under all conditions (1,688 positions) and under all conditions except one (1,910 positions). Thus, an important fraction of positions is selected under most conditions, while a smaller number of them are affected by different degrees of stringency.
All possible maximum-likelihood trees for seven clades were calculated for the resulting concatenated alignments, as explained in Materials and Methods, and in all except one, the topology of the maximum-likelihood tree was the same as the one obtained with default parameters (fig. 5C ). The only different topology was obtained with IS = 13, at which R. americana was close to the outgroup instead of grouping with the plants-algae clade. Since this species is thought to be an early offshoot within these eukaryotes (Lang et al. 1997 ), this topology may be more reasonable than the others. Alternatively, it is possible that when IS equals 13 sequences, the selection of blocks may be too stringent, since the percentage of removed positions goes up to 58.5% and the average outgroup distance drops to 0.797. It is possible that a large number of informative positions are lost at such stringency levels, reducing the resolution of certain nodes. In any case, it is important to note that different degrees of stringency in the selection of blocks may produce different phylogenetic trees and, until better methods to determine optimal degrees of divergence are developed, it may be desirable to study several levels of stringency in the selection of blocks.
Influence of Different Alignment Parameters on the Selection of Blocks
Gap weights (GOP and GEP) were modified in the program used for making the alignments, CLUSTAL W, in order to generate different starting alignments and to analyze the differences in the final alignments cleaned with Gblocks (table 3 ). Low values for GOP and GEP tend to introduce more gaps, such that the original alignments become longer (4,501 positions after concatenating the 10 protein alignments obtained with GOP = 5 and GEP = 0.05), whereas higher values for these parameters lead to the introduction of less gaps, generating shorter alignments (4,365 positions with GOP = 20 and GEP = 0.5). Regions in which gaps are introduced are completely rejected by Gblocks, and therefore the different starting alignments treated with this method tend to converge in length and average outgroup distance, as shown in table 3 , producing very similar alignments. The maximum-likelihood topology in all these alignments was the same as in figure 5 .
The fact that different alignment parameters give rise to different alignments mostly in the regions that are difficult to align has been exploited by some authors to remove ambiguous regions of an alignment (Lake 1991 ; Gatesy, DeSalle, and Wheeler 1993 ). The six different alignments generated here were used to extract the positions that were consistently aligned through all alignments, in a process known as “culling” (Gatesy, DeSalle, and Wheeler 1993 ). Furthermore, gap positions were also removed to facilitate a better comparison with the Gblocks method. Interestingly, the numbers of positions extracted by the culling method with this set of alignment parameters for CO1 (459), CO2 (95), CO3 (239), CYTb (334), ND1 (284), ND2 (0), ND3 (73), ND4 (326), ND4L (69), and ND5 (304) were quite similar to the numbers of positions of the blocks outlined by Gblocks with default parameters (table 1 ). Most importantly, the identities of the selected positions were also very similar, with only 12% of the original positions being selected by one of the methods and not by the other, or vice versa. In addition, the tree topology obtained from the culled sites was the same as that for the tree obtained from the Gblocks alignment (fig. 5 ), although there were slightly larger branch lengths in the former. This shows again that Gblocks mostly selects alignment-invariant sites, requiring for that only one optimal alignment and using a set of parameters that easily allows the adjustment of the desired degree of stringency.
Phylogenetic Reconstruction by Maximum Likelihood and Eukaryote Phylogeny
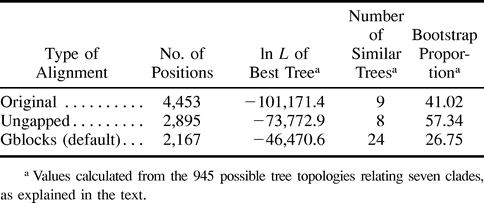
As already mentioned, the topology of the maximum-likelihood tree was the same in the alignments obtained after concatenating the original alignment (fig. 5A ), in the ungapped original alignment (fig. 5B ), and in the concatenated Gblocks alignment with default parameters (fig. 5C ), although, importantly, branch lengths were much smaller in the latter. The phylogenetic tree obtained from the Gblocks alignment clearly supports the grouping of animals and fungi, and all trees in which these two eukaryotic groups did not cluster together had significantly lower log-likelihood values. The same topology was obtained when the Dayhoff model of amino acid substitution was used (Dayhoff, Schwartz, and Orcutt 1978 ). When the orthologous proteins in the recently sequenced genome of the α-purple bacterium Rickettsia prowazekii, supposedly more closely related to mitochondria than P. denitrificans (Andersson et al. 1998; Gray, Burger, and Lang 1999 ), were used as outgroup, the same topology was found again (not shown). The relationship found between animals and fungi is in agreement with other molecular studies (Baldauf and Palmer 1993 ; Wainright et al. 1993 ; Kumar and Rzhetsky 1996 ; Borchiellini et al. 1998; Gray, Burger, and Lang 1999 )—although not all had adequate support (Rodrigo, Bergquist, and Bergquist 1994 )—and in contrast with other works that support a closer relationship of animals and plants (Gouy and Li 1989 ; Veuthey and Bittar 1998 ). The positions of other eukaryotic groups are, however, not easy to define, because 24 different trees—with different positions for the amoeboid A. castellanii, the red alga C. crispus, and the jacobid flagellate R. americana—had log-likelihood values not significantly different from the one in the maximum-likelihood tree (table 4 ).
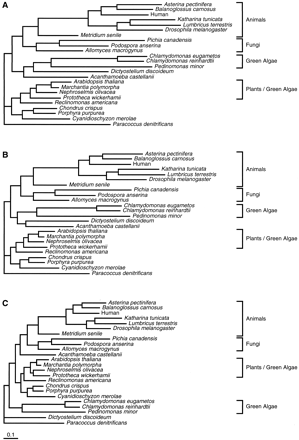
A second data set was constructed with the inclusion of additional taxa. This data set was constructed to show the phylogenetic positions of other eukaryotes whose mitochondrial genomes have been completely sequenced, as well as to illustrate that as more taxa are included, it becomes more likely that the removal of divergent blocks has an impact on the topology of the tree. The use of only five of the proteins, CO1, CYTb, ND1, ND4, and ND5, which contribute to approximately three quarters of the total number of positions selected by Gblocks (table 1 ), allowed the inclusion of additional species without much loss of informative positions. The original, ungapped, and Gblocks alignments derived from this data set contained 2,916, 1,965, and 1,429 positions, respectively. The phylogenetic trees reconstructed from these alignments are shown in figure 6 . In them, the relative positions of the species in common with the smaller data set are not changed (fig. 5 ). Although the trees derived from the original and ungapped alignments are similar, the tree obtained from the Gblocks alignment is very different, with the Chlamydomonas/Pedinomonas group and D. discoideum going to the basal part of the tree. This clearly shows that the use of conserved blocks may have important effects on the topology of the tree. The basal position of D. discoideum within mitochondria-bearing eukaryotes is in good agreement with other works based on 18S rDNA (Cavalier-Smith 1993 ; Kumar and Rzhetsky 1996 ). In addition, the mitochondrial protein tree shows green algae as paraphyletic, which is probably not so reasonable. However, both Chlamydomonas and Pedinomonas have highly derived mitochondrial genomes, with a very reduced set of proteins (Denovan-Wright, Nedelcu, and Lee 1998 ; Turmel et al. 1999 ), which may indicate that these genomes are subject to very different modes of evolution. The imprecision in determining the branching order in the basal part of the tree may also be due to a rapid radiation of protist lineages during the early evolution of eukaryotes (Philippe and Adoutte 1998 ), so more molecular data are probably necessary to resolve this phylogeny.
Relative Support of the Maximum-Likelihood Tree in the Alignment of the Conserved Blocks
One could presume that in the Gblocks alignment, in which saturated and poorly aligned regions have been eliminated, there would be a higher resolution in some parts of the tree such that the maximum-likelihood tree would be better supported, and most other trees would be statistically rejected. However, in a tree-by-tree analysis of the first data set (table 4 ), the number of trees not significantly different with respect to the maximum-likelihood tree was smaller in the concatenated original alignment (9 trees) and in the concatenated ungapped alignment (8 trees) than in the Gblocks alignment with default parameters (24 trees). Accordingly, the bootstrap proportion calculated by the RELL method supporting the maximum-likelihood tree decreased in the Gblocks alignment (table 4 ). Similar results were obtained with less stringent parameters in Gblocks, and, with the most stringent parameters, even more equivalent topologies were found. The decrease in the resolution of parsimonious trees after eliminating ambiguous regions of an alignment with the culling method has also been reported for other data sets (Gatesy, DeSalle, and Wheeler 1993 ).
To test whether the reduction in the relative support of the maximum-likelihood tree in the Gblocks alignment was not simply due to the lower number of positions, two sets of 100 samples of 2,167 positions randomly selected either from the original or from the ungapped alignments were constructed. Since the animals-fungi grouping always received strong statistical support in the Gblocks alignment, I calculated the log-likelihood values of 105 possible topologies for six clades (animals-fungi, plants, A. castellanii, C. crispus, R. americana, and the outgroup) in the two sets of 100 alignments. On average, 13.4 ± 4.78 and 15.2 ± 5.11 topologies could not be statistically rejected from the 2,167 positions randomly selected from the original or from the ungapped alignments, respectively. Thus, the larger number of statistically similar topologies obtained after selecting the same number of positions with Gblocks (24) is due to the selective process of eliminating divergent regions and not only to the smaller number of positions. In fact, the alignment resulting after using Gblocks may reflect more realistically the difficulty in estimating the phylogeny of early-branching eukaryotes, as discussed above. A possible explanation for this result may be that the alignment program used, which is based on a progressive method that aligns sequences according to an initial guide tree, may introduce gaps in a such way that the alignment is biased according to this tree. This tendency would be especially pronounced in the most divergent segments, not selected by Gblocks, in which the larger number of gaps to be introduced allows more possibilities to increase similarity at the expense of homology. Thus, the inclusion of these divergent regions would facilitate the rejection of certain topologies in the complete alignments. Alternatively, shorter internode distances or the loss of too many informative positions may cause the decrease in resolution. Further work is necessary to determine optimal sequence divergences in phylogenetic analysis, as already pointed out, and to better discern the reasons for the decrease in support of the trees derived from alignments from which saturated and poorly aligned positions were removed.
Advantages and Disadvantages of the Selection of Conserved Blocks for Their Use in Phylogenetic Analysis
The most obvious advantages of removing nonconserved segments from an alignment intended for phylogenetic analysis are the elimination of many possible nonhomologous positions, at which residues do not derive from a common ancestor, and the reduction in pairwise distances, mitigating the problem of saturation. Furthermore, the amino acid or nucleotide composition becomes more homogeneous in the conserved blocks, hence better fulfilling an important prerequisite for making phylogenetic trees with most methods. Gblocks pays special attention to gap positions, which are likely to be misaligned and may change depending on the alignment parameters, but it also detects highly divergent regions that, even if properly aligned, contain little or useless phylogenetic information. An apparent disadvantage of the elimination of these segments is the loss of relative support in the final tree. However, the alignment and amino acid composition may be biased in these regions and, in fact, it is better to construct a partially unresolved tree than to construct a biased tree.
This method may be specially useful for moderately divergent protein or DNA alignments, for which it becomes necessary to remove only a small part of the alignment. The program will also detect especially well conserved blocks that constitute minor parts within very divergent alignments, but the exclusive use of this kind of block for making trees should be treated very cautiously, since most of these sites are probably maintained under a very strong selective pressure, and therefore the neutrality of the majority of sites assumed by phylogenetic methods does not hold in these cases.
The use of a computerized method to remove poorly aligned positions may to a certain extent speed up the process of phylogenetic analysis, thus making the automation of phylogenetic analysis of large data sets feasible, but it is still necessary to carefully examine both the original alignment and the alignment obtained by the Gblocks program. For example, a case in which careful inspection is necessary occurs when one of the sequences is completely misaligned within a very well conserved block (because of a frameshifting sequencing error or high divergence in this particular sequence). If there are enough identities in the rest of the sequences, Gblocks will consider the block conserved and it will be selected. There are methods to detect such misaligned fragments (Thompson et al. 1997 ), and they should be used to assure that sequences with many of these fragments are not included in the alignments.
Finally, it is important to emphasize that the use of a computerized method makes it possible to define a set of parameters used for removing blocks that, together with the alignment parameters, allows the exact reproduction of the final alignment by other researchers.
Manolo Gouy, Reviewing Editor
Keywords: multiple alignments conserved blocks amino acid composition mitochondrial proteins eukaryotes
Address for correspondence and reprints: J. Castresana, European Molecular Biology Laboratory, Meyerhofstrasse 1, 69117 Heidelberg, Germany. E-mail: jose.castresana@embl-heidelberg.de.
Table 1 Positions Removed by Gblocks with Default Parameters, and Reduction in the Average Pairwise Distance from the Outgroup to Other Sequences in Different Mitochondrial Protein Alignments
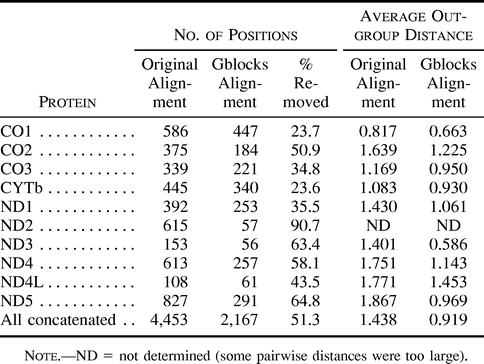
Table 1 Positions Removed by Gblocks with Default Parameters, and Reduction in the Average Pairwise Distance from the Outgroup to Other Sequences in Different Mitochondrial Protein Alignments

Table 2 Effect of Different Parameters of the Gblocks Program on the Final Alignment
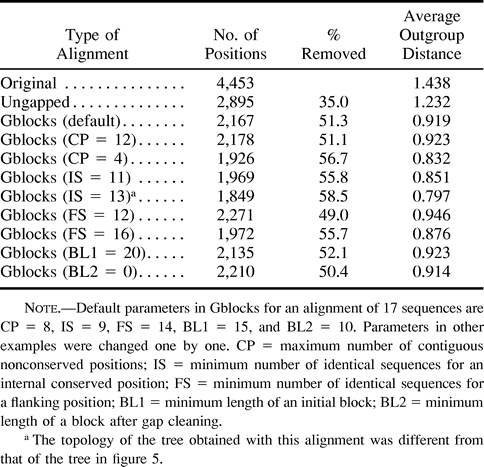
Table 2 Effect of Different Parameters of the Gblocks Program on the Final Alignment

Table 3 Effects of Different CLUSTAL W Alignment Parameters on the Final Blocks Selected by Gblocks
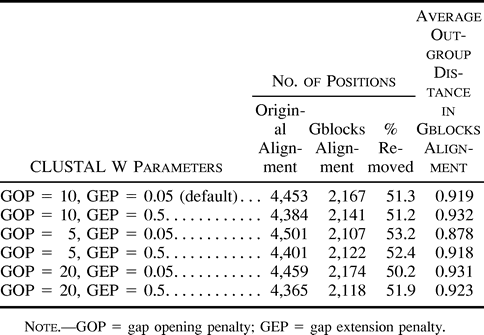
Table 3 Effects of Different CLUSTAL W Alignment Parameters on the Final Blocks Selected by Gblocks

Fig. 1.—Alignment of ND3 sequences from several eukaryotes and a bacterial outgroup with the blocks selected by the Gblocks program with default parameters underlined. Positions at which more than 50% of the residues are identical and have no gaps are shaded.
Fig. 2.—Schematic representation of the blocks selected by the Gblocks program with default parameters from different mitochondrial protein alignments. The empty box in each protein represents the whole alignment, and the black boxes represent the selected blocks. All blocks are drawn at the same scale according to length in amino acids
Fig. 3.—Representation on the first two principal axes obtained in a correspondence analysis of the amino acid frequencies in the blocks selected by Gblocks (A and B) and in the rejected ones (C and D) in 10 concatenated mitochondrial proteins. Amino acids (A and C) and species (B and D) are represented in different plots. In the blocks selected by Gblocks (A and B), the axes represent 47% and 23% of the total inertia, respectively. In the analysis of the rejected blocks (C and D), the axes represent 41% and 22% of the total inertia, respectively. Only names outside an arbitrary central circle are given for simplicity
Fig. 4.—Maximum-likelihood pairwise distances calculated with the mtREV model of amino acid substitution versus observed pairwise differences from the original (A), the ungapped (B), and the Gblocks (C) alignments of 10 concatenated mitochondrial proteins
Fig. 5.—Maximum-likelihood trees obtained from the original (A), the ungapped (B), and the Gblocks (C) alignments of 10 concatenated mitochondrial proteins using the mtREV model of amino acid substitution. The horizontal bar represents a distance of 0.1 substitutions per site. The three trees are drawn at the same scale
Fig. 6.—Maximum-likelihood trees obtained from the original (A), the ungapped (B), and the Gblocks (C) alignments of five concatenated mitochondrial proteins (CO1, CYTb, ND1, ND4, and ND5) using the mtREV model of amino acid substitution and a local rearrangement search. The horizontal bar represents a distance of 0.1 substitutions per site. The three trees are drawn at the same scale
I thank Svante Pääbo, in whose laboratory at the University of Munich this work was initiated, for many discussions that contributed to the improvement of the work, and Toby Gibson for useful help during the final stage of the work.
literature cited
Adachi, J., and M. Hasegawa. 1996a. Model of amino acid substitution in proteins encoded by mitochondrial DNA. J. Mol. Evol. 42:459–468.
———. 1996b. MOLPHY version 2.3: programs for molecular phylogenetics based on maximum likelihood. Comput. Sci. Monogr. 28:1–150.
Andersson, S. G., A. Zomorodipour, J. O. Andersson, T. Sicheritz-Ponten, U. C. Alsmark, R. M. Podowski, A. K. Naslund, A. S. Eriksson, H. H. Winkler, and C. G. Kurland.
Arnason, U., X. Xu, and A. Gullberg.
Asakawa, S., H. Himeno, K. Miura, and K. Watanabe.
Bairoch, A., and R. Apweiler.
Baldauf, S. L., and J. D. Palmer.
Beagley, C. T., R. Okimoto, and D. R. Wolstenholme.
Boore, J. L., and W. M. Brown.
———.
Borchiellini, C., N. Boury-Esnault, J. Vacelet, and Y. Le Parco.
Burger, G., I. Plante, K. M. Lonergan, and M. W. Gray.
Burger, G., D. Saint-Louis, M. W. Gray, and B. F. Lang.
Castresana, J., G. Feldmaier-Fuchs, and S. Pääbo.
Castresana, J., G. Feldmaier-Fuchs, S. Yokobori, N. Satoh, and S. Pääbo.
Cummings, D. J., K. L. McNally, J. M. Domenico, and E. T. Matsuura.
Dayhoff, M. O., R. M. Schwartz, and B. C. Orcutt.
Denovan-Wright, E. M., A. M. Nedelcu, and R. W. Lee.
Fernandes, A. P., K. Nelson, and S. M. Beverley.
Foster, P. G., L. S. Jermiin, and D. A. Hickey.
Gatesy, J., R. DeSalle, and W. Wheeler.
Goldman, N.
Gouy, M., and W. H. Li.
Herrmann, G., A. Schon, R. Brack-Werner, and T. Werner.
Kishino, H., and M. Hasegawa.
Kishino, H., T. Miyata, and M. Hasegawa.
Kumar, S., and A. Rzhetsky.
Lake, J. A.
Lang, B. F., G. Burger, C. J. O'Kelly, R. Cedergren, G. B. Golding, C. Lemieux, D. Sankoff, M. Turmel, and M. W. Gray.
Leblanc, C., C. Boyen, O. Richard, G. Bonnard, J. M. Grienenberger, and B. Kloareg.
Lewis, D. L., C. L. Farr, and L. S. Kaguni.
Morrison, D. A., and J. T. Ellis.
Oda, K., K. Yamato, E. Ohta et al. (11 co-authors).
Ohta, N., N. Sato, and T. Kuroiwa.
Paquin, B., and B. F. Lang.
Pesole, G., M. Attimonelli, G. Preparata, and C. Saccone.
Philippe, H., and A. Adoutte.
Rodrigo, A. G., P. R. Bergquist, and P. L. Bergquist.
Sekito, T., K. Okamoto, H. Kitano, and K. Yoshida.
Stoesser, G., M. A. Moseley, J. Sleep, M. McGowran, M. Garcia-Pastor, and P. Sterk.
Swofford, D. L., G. J. Olsen, P. J. Waddell, and D. M. Hillis.
Thioulouse, J., D. Chessel, S. Doledec, and J. M. Olivier.
Thompson, J. D., T. J. Gibson, F. Plewniak, F. Jeanmougin, and D. G. Higgins.
Thompson, J. D., D. G. Higgins, and T. J. Gibson.
Turmel, M., C. Lemieux, G. Burger, B. F. Lang, C. Otis, I. Plante, and M. W. Gray.
Unseld, M., J. R. Marienfeld, P. Brandt, and A. Brennicke.
Veuthey, A. L., and G. Bittar.
Wainright, P. O., G. Hinkle, M. L. Sogin, and S. K. Stickel.
Wheeler, W. C., J. Gatesy, and R. DeSalle.
Wolff, G., I. Plante, B. F. Lang, U. Kuck, and G. Burger.
Yagi, T.
Yang, D., Y. Oyaizu, H. Oyaizu, G. J. Olsen, and C. R. Woese.


