


Abstract
In an attempt to dissect the mechanism of Strychnos nux-vomica, a commonly used Chinese folk medicine in the therapy of liver cancer, the cytotoxic effects of four alkaloids in Strychnos nux-vomica, brucine, brucine N-oxide, strychnine, and isostrychnine, on human hepatoma cells (HepG2) were screened by 3-(4,5-dimethylthiazol-2-yl)-2,5-diphenyl-tetrasolium bromide (MTT) assay. Brucine, among the four alkaloids, exhibited the strongest toxic effect, the mechanism of which was found to cause HepG2 cell apoptosis, since brucine caused HepG2 cell shrinkage, the formation of apoptotic bodies, DNA fragmentation, cell cycle arrest, as well as phosphatidylserine externalization, all of which are typical characteristics of apoptotic programmed cell death. Brucine-induced HepG2 cell apoptosis was caspase dependent, with caspase-3 activated by caspase-9. Brucine also caused the proteolytic processing of caspase-9. In addition, brucine caused depolarization of the mitochondrial membrane of HepG2 cells, the inhibition of which by cyclosporine A completely abrogated the activation of casapses and release of cytochrome c in brucine-treated HepG2 cells. These findings suggested a pivotal role of mitochondrial membrane depolarization in HepG2 cell apoptosis elicited by brucine. Furthermore, brucine induced a rapid and sustained elevation of intracellular [Ca2+], which compromised the mitochondrial membrane potential and triggered the process of HepG2 cell apoptosis. Finally, Bcl-2 was found to predominately control the whole event of cell apoptosis induced by brucine. The elevation of [Ca2+]i caused by brucine was also suppressed by overexpression of Bcl-2 protein in HepG2 cells. From the facts given above, Ca2+ and Bcl-2 mediated mitochondrial pathway were found to be involved in brucine-induced HepG2 cell apoptosis.
Hepatocellular carcinoma is one of the most common malignancies in China. According to the World Health Organization statistics, of 6,350,000 cancer cases reported each year, 4% are hepatocellular carcinoma, 42% of which occur in China (Cai et al., 2003). Traditional treatment of liver tumors typically has been surgical resection and chemotherapeutic; however, these commonly used techniques are frequently challenged in view of metastasis and other pathological changes. Therefore, the development of new agents for hepatocellular cancer is important to reduce the mortality caused by this disease.
Natural products have provided one of the most important sources of promising leads for the development of novel cancer therapeutics. Nux vomica, the dried seed of Strychnos nux-vomica L. (Loganiaceae), has long been one major ingredient in some commonly prescribed Chinese herbal remedies such as “Ping-xiao” capsule, “Ci-dan” capsule, or “Ma-qian-zi” tablet for the treatment of liver cancer (Xu et al., 2003). However, the mechanism underlying the anti-tumor property of nux vomica remains largely unknown.
Alkaloids are the main bioactive ingredients in nux vomica (Bisset and Phillipson, 1971); they are also responsible for the pharmacological and toxic properties possessed by nux vomica. In our previous study, 16 alkaloids have been separated and identified from the crude nux vomica, 80% of which are strychnine and brucine, as well as their derivatives such as brucine N-oxide or isostrychnine (Cai et al., 1990). The chemical structures of these alkaloids were presented in Figure 1. In our previous study, the total alkaloid fractions of nux vomica were shown to have an ability to inhibit the cell proliferation of HeLa and K562 cells (Cai et al., 1998), the results of which provided the possibility that the traditional application of nux vomica in the therapy of liver cancer is due to the direct cytotoxic effects of alkaloids on liver tumor cells. Therefore, in order to identify the alkaloid which is mainly responsible for the anti-tumor effect of nux vomica as well as its mechanisms, we planned to screen the cytotoxic effects of the four alkaloids described above on HepG2 cells and choose a representative compound to further investigate its anti-tumor mechanisms. The results of this investigation might provide a scientific explanation for the traditional application of this herbal medicine in liver cancer therapy.
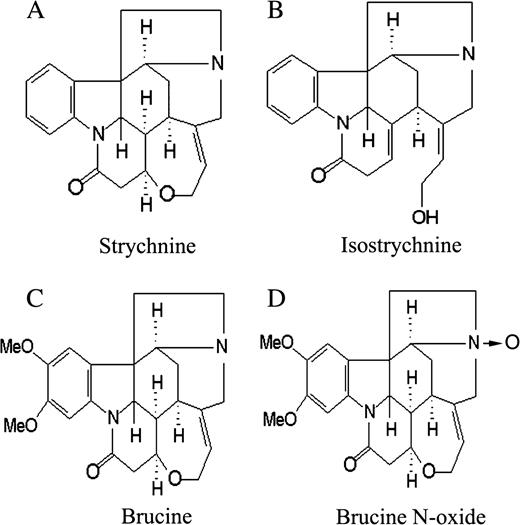
The chemical structures of strychnine (A), isostrychnine (B), brucine (C), and brucine N-oxide (D) in nux vomica.
MATERIALS AND METHODS
Chemicals.
Strychnine, 3-(4,5-dimethylthiazol-2-yl)-2,5-diphenyl-tetrasolium bromide (MTT), Hoechst 33258, propidium iodide (PI), BATPA/AM, Fluo-3/AM, and carbonylcyanide p-trifluoromethoxyphenylhydrazone (FCCP) were purchased from Sigma Chemical Co. (St. Louis, MO). Brucine and brucine N-oxide were supplied by Carl Roth GmbH+ Co. (Germany). Isostrychine was obtained from nux vomica based on the previously described method (Cai et al., 1994); its purity was more than 99%. GFP-tagged Annexin V was prepared and provided by State Key Lab of Pharmaceutical Biotechnology (Nanjing University, China). Caspase-3 substrate Ac-Asp-Glu-Val-Asp-aminomethyl coumarin (Ac-DEVD-AMC) was purchased from Merck (La jolla, CA), and z-DEVD-fmk, z-VAD-fmk, z-LEHD-fmk, and z-IETD-fmk were supplied by Biovision (U.S.A.). 3,3′-Dihexyloxacarbocyanine iodide (DiOC6) was obtained from Molecular Probes (Eugene, OR). All water-soluble compounds were reconstituted in RPMI 1640 medium (Gibco), whereas insoluble chemicals were reconstituted into DMSO. The final concentration of DMSO in each sample was less than 0.1%. Adjustment of the solutions to pH 7.2–7.4 was made with HCl (0.5 M) or NaOH (0.5 M) if necessary. All solutions were passed through a 0.22-μm filter (GVMP 01230, Millipore) and stored at 4°C until use.
Cell culture and transfection.
Human hepatoma cells (HepG2) were purchased from Cell Bank of Shanghai Institute of Cell Biology (Shanghai, China), maintained in RPMI 1640 culture medium plus 10% calf serum, 100 U/ml penicillin, and 75 U/ml streptomycin in a 37°C incubator supplied with 95% room air and 5% CO2. After 60–80% confluency, the cells were trypsinized with 0.25% trypsin (AMRESCO, dissolved in PBS, pH 7.4), counted, and placed down at a needed density for treatment. For cell transfection, a pcDNA3.1 vector harboring the human Bcl-2 cDNA flanked by FLAG tag sequence was introduced into HepG2 cells via lipofectAmine™ (Invitrogen) following manufacture's instruction. Cells transfected with mock plasmid without Bcl-2 cDNA served as a control. After transfection, Western blot, using mouse monoclonal antibody against FLAG (Sigma), was performed to confirm the expression of Bcl-2 protein. The Bcl-2 cDNA or mock plasmid transfectants of HepG2 cells were then subject to brucine treatment.
Assessment of cell viability by MTT assay.
Cell viability was quantified by colorimetric MTT assay. This method is based on the conversion of the MTT to MTT-formazan crystal by mitochondrial enzyme (Dua and Gude, 2005). Briefly, the HepG2 cells in exponential growth were placed down at a final density of 6 × 10⁴ cells/ml. After treatments, 100 μl MTT (1 mg/ml) was added, and the cells were further incubated at 37°C for 4 h. The supernatant was then discarded, and 200 μl DMSO was added. The 96-well plate was vibrated on a micro-vibrator for additional 10 min, and the optical density of each well was measured at λ492nm by enzyme-immunoassay instrument (Nanjing, China). The cell viability was calculated based on the following formula: cell viability (%) = average A492nm of treated group / average A492nm of control group × 100%.
Assessment of cell apoptosis by Hoechst 33258 staining.
The Hoechst 33258 staining was carried out as previously described (Ramonede and Perez-Tomas, 2002). Briefly, the HepG2 cells were plated in a 6-well chamber slide (Fisher Scientific) at a density of 5 × 10⁴ cells/well. After treatments, the cells were fixed with ice-cold methanol:acetic acid (3:1) at room temperature for 10 min, then washed with ice-cold PBS buffer twice, and loaded with Hoechst 33258 (1 μg/ml) for additional 20 min. The changes in the nucleus of cells after Hoechst 33258 staining were observed under a fluorescent microscope (Olympus, BX-60, Japan).
DNA fragmentation assay.
The fragmented DNA was detected based on previously described method (Sei et al., 1998). Briefly, after treatments, the nonadherent HepG2 cells were collected from the supernatant by centrifugation and combined with adherent cells, lysed in 10 mM EDTA, 0.5% Triton X-100, and 5 mM Tris–HCl (pH 8.0), and centrifuged at 10,000 × g for 30 min. The supernatant was digested with 0.1 mg/ml proteinase K at 50°C for 60 min, extracted with phenol/chloroform, and precipitated with two volumes of 100% ethanol. The pellet was treated with 0.5 mg/ml RNase A. The DNA was finally resolved in 1.8% agarose gels.
Assessment of cell cycle distribution.
The DNA content and cell cycle of HepG2 cells were determined by flow cytometry analysis based on previously described method (Yin et al., 2003a). Briefly, the HepG2 cells were plated at a density of 1 × 10⁶ cells/well. After treatments, both the adherent and nonadherent cells were collected, washed twice with ice-cold PBS buffer (pH 7.4), fixed with 70% alcohol overnight, then stained with PI (1 mg/ml) in the presence of 1% RNAase A for at least 30 min before analysis by flow cytometry (Becton Dickinson). Sub G0/G1, S, and G2/M cells were gated out as appropriate. PI fluorescence was measured in the FL3 channel (670 nm long pass filter) after cell doublets were excluded by pulse processing. 10,000 cells were counted per sample. The cell debris was excluded from analysis by appropriately raising the forward scatter threshold. The data were analyzed with CellQuest software.
Assessment of cell apoptosis by Annexin V and PI double staining.
For Annexin V/PI staining, cells were seeded in a 24-well plate at a density of 1 × 10⁵ cells/well. After treatments, cells were collected and washed with ice-cold PBS and binding buffer (10 mM HEPES/NaOH, 140 mM NaCl, 2.5 mM CaCl2). The cells were then incubated with GFP-tagged Annexin V (1:2000) on ice for additional 15 min. PI (1 μg/ml) was added immediately before analysis by flow cytometry. Green fluorescent protein (GFP) fluorescence emission was measured in the FL1 channel (530 nm band pass filter), and PI fluorescence was measured in the FL3 channel (670 nm long pass filter) after cell doublets were excluded by pulse processing. 5000 cells were counted per sample. The data were analyzed with CellQuest software (Becton Dickinson).
Measurement of caspase-3-like activity.
The activity of caspase-3-like protease was measured as increases in hydrolysis of fluorogenic tetrapeptide substrate Ac-DEVD-AMC, according to the manufacturer's instructions (BIOMOL Research Laboratories, Inc., Plymouth Meeting, PA). Because caspase-7 also cleaves the substrate, the activity obtained here represents the caspase-3-like protease activity. Briefly, after treatment of HepG2 cells with brucine for 12 h, the cells were lysed, and supernatants were taken for measurement of hydrolysis of Ac-DEVD-AMC.
Immunoblot analysis.
The immunoblot analysis was performed as previously described (Yin et al., 2003a). Briefly, the HepG2 cells were plated at a density of 8 × 10⁵ cells/well. After treatments, the adherent and nonadherent cells were collected and lysed. Protein concentration was determined by the Lowry method using BSA as a standard. Equal amounts of protein were separated on 10–15% SDS/PAGE gels. The protein was then electrophoretically blotted onto polyvinylidene fluoride (PVDF) membranes. The membranes were first hybridized with primary antibodies and then with a horseradish peroxidase-conjugated anti-mouse or anti-rabbit IgG secondary antibody (Sigma, St. Louis, MO). The antibodies against the human caspase-3, Bcl-2, Bax, Fas, caspase-9, cytochrome c were purchased from Cell Signaling. The antibody against glyceraldehyde-3-phosphate dehydrogenase (GAPDH) was purchased from Upstate Biotechnology (Lake Placid, NY). The immune blots were developed using enhanced chemiluminescence (ECL) system (Amersham Pharmacia Biotech, Buckinghamshire, UK).
Measurement of cytochrome c release.
The release of mitochondrial cytochrome c was determined by Western blot (Kwon et al., 2002). Briefly, cells (1.5 × 10⁷ cells/ml) after treatment were washed with PBS and resuspended in ice-cold homogenizing buffer (250 mM sucrose, 20 mM HEPES-KOH (pH 7.5), 10 mM KCl, 1.5 mM MgCl2, 1 mM EDTA, 1 mM EGTA, 1 mM dithiothreitol (DTT), 1 mM phenylmethylsulphonylfluoride (PMSF), 1 μg/ml aprotinin, and 1 μg/ml leupeptin). After 30 min incubation on ice, cells were homogenized with a glass Dounce homogenizer (30 strokes). The homogenate was initially subject to centrifugation at 100,000 × g for 30 min. The supernatant was then further centrifuged for 30 min for the collection of the cytosolic fraction, and 30 μg protein was loaded on a 15% SDS–PAGE gel. Western blot was performed as described in the section of immunoblot analysis.
Measurement of ΔΨm.
Mitochondrial energization was determined by the retention of the dye DiOC6 (Lei et al., 2005). For confocal microscope imaging, cells were plated in a 6-well chamber slide at a density of 5 × 10⁵ cells/well. After treatments, cells were washed with RPMI 1640 medium twice, loaded with 100 μl freshly-prepared DiOC6 (20 nM in RPMI 1640) and further incubated at 37°C for 30 min, washed again and observed under a confocal microscope (LSM 510, Carl ZEISS, Germany). For flow cytometry analysis, cells were plated at a density of 5 × 10⁵ cells/well. After treatments, the cells were collected and washed twice with RPMI 1640 medium, loaded with DiOC6 (20 nM) at 37°C for additional 30 min. PI (1 μg/ml) was added immediately before flow cytometry analysis to exclude nonviable cells. Cells incubated with 50 μM FCCP at 37°C for 5 min were included as a control (data not shown).
Measurement of intracellular [Ca2+].
The intracellular [Ca2+] was measured by using Fluo-3/AM, a fluorescent dye which is cleaved and trapped inside the cells (Suzuki et al., 1996). As described above, cells were plated in a 6-well chamber slide at a density of 5 × 10⁵ cells/well. After treatments, cells were washed with RPMI 1640 culture medium twice, loaded with 100 μl Fluo-3/AM (10 μM) for 30 min in a dark room, washed again, and observed under a confocal microscopy (LSM 510, Carl ZEISS, Germany).
Statistical analysis.
The results were expressed as mean ± SD. The statistical analysis involving two groups was performed by means of Student's t-test, whereas analysis of variance (ANOVA) followed by Dunnett's multiple comparison test were used in order to compare more than two groups. All data were processed with SPSS software. The results were considered significant when p < 0.05; significance levels are reported as followed: *p < 0.05, **p < 0.01, ***p < 0.001.
RESULTS
Cytotoxicity of Strychnine, Brucine, Brucine N-Oxide, and Isostrychnine on HepG2 Cells by MTT Assay
MTT assay was firstly used to screen the cytotoxicity of the four alkaloids on HepG2 cells. As shown in Figures 2A, 2B, and 2C, brucine caused HepG2 cell death in a concentration- and time-dependent manner. The strongest effect of brucine was 1.0 mM at 48 h after treatment (78.3%), whereas its derivative, brucine N-oxide, did not reveal a significant cytotoxic effect at any of time points or concentrations examined. Isostrychnine caused HepG2 cell death only at 48 h after treatment, the maximal effect of which was 31.4% at 1.0 mM. However, as an analogue to isostrychnine, strychnine did not reveal such a comparable effect. These findings indicated that brucine, among the four alkaloids, showed the strongest toxic effect on HepG2 cells; thus more experiments were performed to further identify its cytotoxic mechanisms.
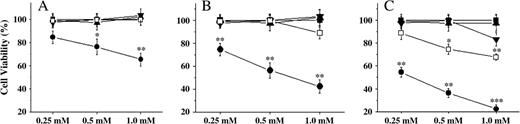
The cytotoxicity of strychnine, isostrychnine, brucine, and brucine N-oxide on HepG2 cells at different times after treatment. The HepG2 cells were incubated with the four alkaloids at 0.25, 0.5, 1 mM for 24 h (A), 36 h (B), and 48 h (C), respectively. After treatments, cell viability was measured in triplicate by using MTT assay. ▪ control, • brucine, ▴ brucine N-oxide, ▾ strychnine, □ isostrychnine. *p < 0.05, **p < 0.01, ***p < 0.001 as compared to medium-alone control.
Brucine Caused HepG2 Cell Death via Apoptosis
In an attempt to identify the cell death pattern for HepG2 cells induced by brucine, the cells after treatment were directly observed under an inverted microscope. As shown in Figure 3B, the HepG2 cells following exposure to 0.5 mM brucine for 36 h underwent significant shape and volume changes. The cells after treatment detached from the culture plate and shrank, and small apoptotic bodies formed. Other typical characteristics of apoptosis such as nuclear condensation and fragmentation were also revealed by Hoechst 33258 staining, as shown in Figure 3D. On the contrary, these apoptosis-related morphological alterations were not found in control cells (Figs. 3A and 3C).
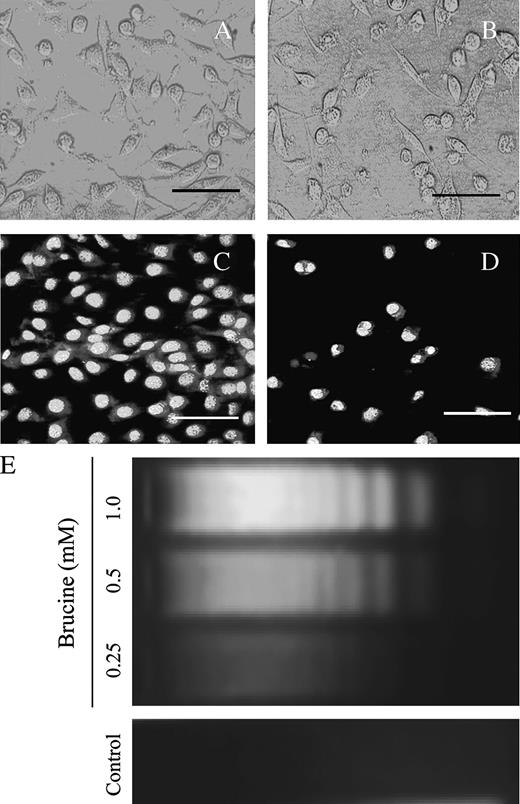
Brucine induced HepG2 cell death via apoptosis. Control cells (A) and brucine-treated cells (B) were observed under an inverted microscope; the cells morphology was photographed with a LM microscopy. For Hoechst 33258 staining, the control cells (C) and brucine- treated cells (D) were loaded with Hoechst 33258 (1 μg/ml) for 20 min and observed under a fluorescence microscope in less than 15 min; cells were treated with 0.5 mM brucine for 36 h (B, D). Scale bars, 50 μm. Dose-response effect of brucine on DNA fragmentations in HepG2 cells (E): cells after treatment for 36 h were lysed; the supernatant of the lysate was digested with 0.1 mg/ml proteinase K at 50°C for 60 min. The DNA was then extracted and resolved in a 1.8% agarose gel. Each experiment was performed in triplicate.
“DNA ladder” has been commonly recognized as a hallmark of cell apoptosis (Nagata et al., 2003). In the present study, brucine dose-dependently caused DNA fragmentations in HepG2 cells (Fig. 3E), which further confirmed that brucine induced HepG2 cell death via apoptosis.
Effects of Brucine on Cell-Cycle Progression and Phosphatidylserine (PS) Externalization of HepG2 Cells
The results presented in Figures 4A, 4B, and 4C showed that brucine dose-dependently increased the sub G0/G1 cell population in HepG2 cells after treatment for 36 h. Moreover, the HepG2 cells were probably arrested at S phase and prevented from entering G2/M phase by brucine, since the cell population in G2/M phase declined, whereas in S phase the population dramatically increased (p < 0.01). In order to further confirm the HepG2 cell apoptosis elicited by brucine, the cells after treatment were double stained with GFP-tagged Annexin V and PI. As shown in Figures 4E and 4F, brucine also dose-dependently increased the PS exposures on the outer membrane leaflet of HepG2 cells, which is a common feature of cells undergoing apoptosis. The cells did not undergo significant cell necrosis within the examined time and concentrations, since less than 3.0% of PI-positive cells were detected.
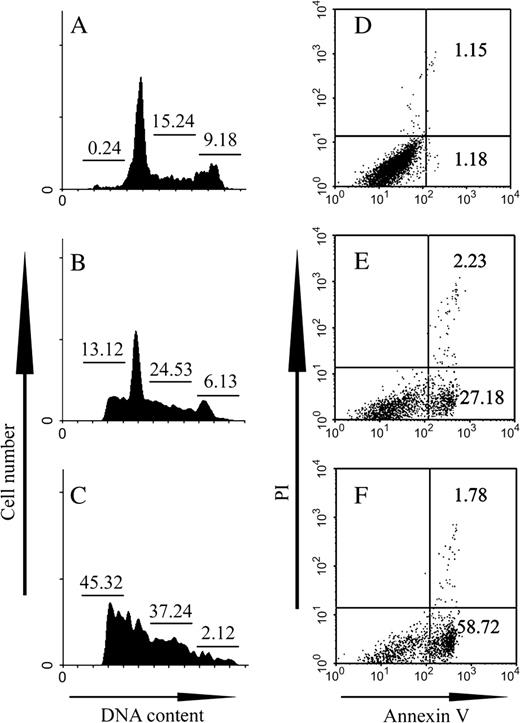
Brucine caused HepG2 cell cycle arrest and PS externalization. The cell cycle arrest (A–C) and apoptosis of HepG2 cells (D–F) following exposure to brucine were determined by flow cytometry analysis. Cells were treated with no brucine (A, D) as controls, 0.25 mM brucine (B, E), or 0.5 mM brucine (C, F) for 36 h. After treatments, the cells were stained with PI (1 mg/ml) in the presence of 1% RNAase A for 30 min after fixation with 70% ethanol overnight (A–C), or double-stained with GFP-tagged Annexin V (1:2000) and PI (1 μg/ml) in the presence of binding buffer without fixation (D–F). 10,000 cells were counted per sample. The data were analyzed with CellQuest software. Each experiment was performed in triplicate. The numbers in panels A–C indicate the percentage of cells in each cell cycle phase and in panels D–F indicate the percentage of cells at the early phase of apoptosis (lower right) or the late phase including necrosis (upper right).
Caspase-3 Was Activated in Brucine-Induced HepG2 Cell Apoptosis
To delineate the mechanisms underlying brucine-induced HepG2 cell apoptosis, z-VAD-fmk, a pan-caspase inhibitor, and z-DEVD-fmk, a selective caspase-3 inhibitor, were employed to examine their effects on HepG2 cell apoptosis elicited by brucine. The results, as shown in Figure 5A, demonstrated that both z-VAD-fmk and z-DEVD-fmk significantly rescued the cells from death or apoptosis, although the effect of z-DEVD-fmk was less potent than that of z-VAD-fmk (p < 0.05). In addition, brucine dose-dependently increased the caspase-3-like protease activity (Fig. 5B). Activation of caspase-3 was also confirmed by Western blot in Figure 5C, in which the protein abundance of cleaved caspase-3 increased in a time-dependent manner. The cleavage product (17 kD) of caspase-3 was first apparent at 4 h in HepG2 cells after brucine exposure, then remained prominent through 12 h. The control cells did not evidence the increased caspase-3-like activity and the 17 kD cleavage product (Figs. 5B and 5C), suggesting caspase-3 was specifically activated in HepG2 cells after treatment with brucine.
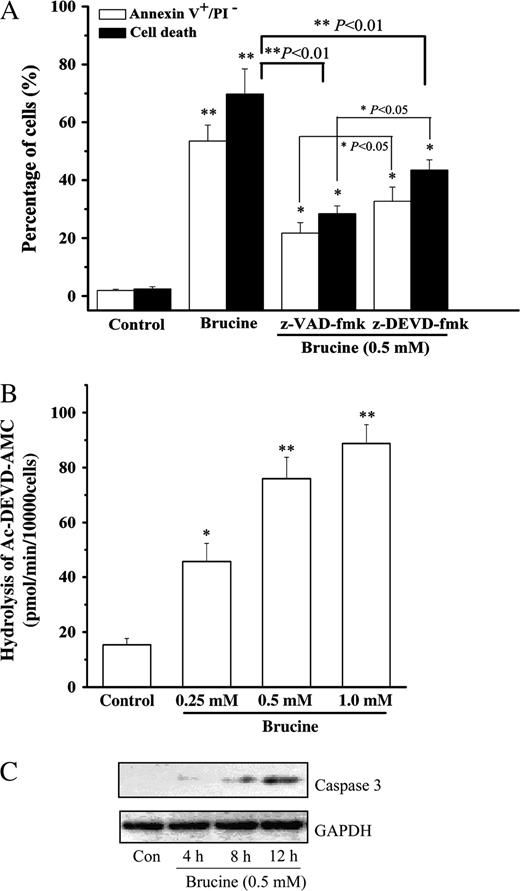
Caspase-3 was involved in brucine-induced HepG2 cell apoptosis. Effects of z-VAD-fmk, z-DEVD-fmk on HepG2 cell death and apoptosis after treatment with brucine (A). Cell death was measured by MTT assay, and apoptosis was measured by Annexin V/PI double staining method as described above. Cells were preincubated with z-VAD-fmk (4 μM) or z-DEVD-fmk (4 μM) for 30 min, then treated with brucine for 36 h. Dose-response effect of brucine on the caspase-3-like activity of HepG2 cells (B). Cells were treated with brucine for 12 h. Time-course effect of brucine on the protein abundance of cleaved caspase-3 in HepG2 cells (C). Cells were treated with 0.5 mM brucine, 50 μg protein was separated on a 12% SDS–PAGE gel. GAPDH was included as an internal standard to normalize loadings. Each experiment was performed in triplicate. *p < 0.05, **p < 0.01 as compared to medium alone control.
Brucine-Induced Cell Apoptosis and Caspase-3 Activation Are Caspase-9 Dependent
Caspase-3 has frequently been reported to be activated by either caspase-8 from intracellular death complex or caspase-9 from mitochondria in the process of apoptosis (Li et al., 1997). Therefore, a selective caspase-8 inhibitor, z-IETD-fmk (4 μM), and caspase-9 inhibitor, z-LEHD-fmk (4 μM), were adopted to investigate the role of caspase-8 or caspase-9 in brucine-induced HepG2 cell apoptosis. As shown in Figure 6A, brucine-induced cell apoptosis was greatly rescued in the presence of caspase-9 inhibitor, but not caspase-8 inhibitor. Furthermore, the enhancement of caspase-3-like activity induced by brucine was totally blocked by caspase-9 inhibitor other than caspase-8 inhibitor (Fig. 6B). Brucine also enhanced the proteolytic processing of caspase-9 in a time-dependent manner. Instead, the proteolytic processing of caspase-8 was not detected within the time examined (Fig. 6C). Finally, the cleavage of pro-caspase-3 was suppressed by caspase-9 inhibitor but not caspase-8 inhibitor. Taken together, the activation of casapse-9, rather than caspase-8, was responsible for brucine-induced HepG2 cell apoptosis and caspase-3 activation.
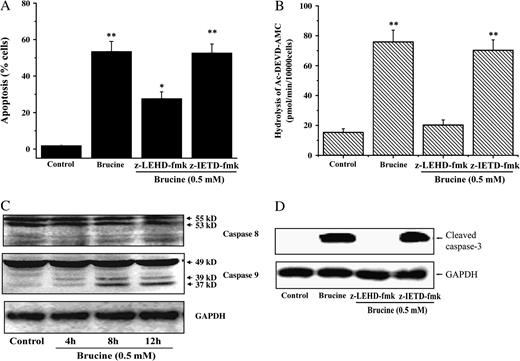
Caspase-9 was specifically involved in brucine-induced HepG2 cell apoptosis. Effect of casapse-8 or caspase-9 inhibitor on brucine-induced HepG2 cell apoptosis (A). The apoptosis was determined by Annexin V/PI double staining method. Effect of casapse-8 or caspase-9 inhibitor on the caspase-3-like protease activity in HepG2 cells after treatment with brucine (B). Time-course effects of brucine (0.5 mM) on the activation of caspase-9 and caspase-8 in HepG2 cells (C). Effect of casapse-8 or caspase-9 inhibitor on the protein abundance of cleaved caspase-3 in HepG2 cells after treatment with brucine (D). 50 μg protein was separated on a 12% SDS–PAGE gel. GAPDH was included as an inner standard to normalize the loadings (C, D). Cells were preincubated with z-LEHD-fmk (4 μM) or z-IETD-fmk (4 μM) for 30 min and further incubated with 0.5 mM brucine for 36 h (A) or 12 h (B, D). *p < 0.05, **p < 0.01 as compared to medium alone control.
Brucine Caused Mitochondrial Membrane Depolarization and Release of Cytochrome c in HepG2 Cells
DiOC6 is a frequently used fluorescent dye for monitoring the mitochondrial membrane potential (ΔΨm) (Lei et al., 2005). In present study, brucine (0.5 mM) time-dependently decreased the fluorescent intensity of HepG2 cells stained with DiOC6 (Figs. 7A, 7B, 7C, and 7D), suggesting the gradual depolarization of ΔΨm in HepG2 cells following exposure to brucine. In support of it, HepG2 cells stained with DiBAC4, a well-known fluorescent dye for monitoring the plasma membrane potential, did not undergo significant plasma membrane depolarization after treatment with brucine (data not shown), implying that DiOC6 used at 20 nM in this study was specific for the assessment of ΔΨm depolarization. Cyclosporine A (CsA, 20 nM), a better-known blocker of the collapse of ΔΨm, was adopted in this study to investigate the role of ΔΨm in brucine-induced cell apoptosis. As shown in Figure 7E, CsA totally abrogated the mitochondrial membrane depolarization in HepG2 cells induced by brucine. Surprisingly, CsA dramatically but not completely suppressed the apoptosis of HepG2 cells. CsA also suppressed the increased caspase-3-like protease activity and the cleavage of caspase-9 in HepG2 cells treated by brucine (Figs. 7F and 7G). Furthermore, the release of cytochrome c in brucine-treated HepG2 cells was found to occur as early as 4 h and remain unchanged through 12 h, implying that the release of cytochrome c caused by brucine might occur before 4 h. In addition, the release of cytochrome c was tightly controlled by CsA, since CsA almost completely abrogated the increase of cytochrome c in cytosol. These findings also implied that the mitochondrial membrane depolarization might precede the release of cytochrome c into cytosol in HepG2 cells after brucine treatment. Consistent with this, the fluorescent intensity of HepG2 cells in Figure 7B (cells treated with brucine for 2 h) was partially reduced as compared to the control cells in Figure 7A. In fact, the decrease of ΔΨm in HepG2 cells after treatment with brucine for 2 h was much more significant when determined by flow cytometry (data not shown); this inconsistency could be ascribed to the different sensitivity of instruments applied. Taken together, brucine rapidly caused the collapse of ΔΨm followed by cytochrome c release and caspase-9, caspase-3 activation, and thus triggered the machinery of HepG2 cell apoptosis.

Change of ΔΨm as well as cytochrome c release in brucine-treated HepG2 cells was blocked by CsA. Time-course effect of brucine on the mitochondrial membrane depolarization of HepG2 cells (A–D). Cells were loaded with DiOC6 (20 nM) for additional 30 min after treatment with brucine (0.5 mM) for 0 h (A), 2 h (B), 4 h (C), or 12 h (D) and observed under a confocal microscope. Scale bars, 50 μm. Effects of CsA on the ΔΨm change and apoptosis of HepG2 cells after brucine treatment (E). The ΔΨm change of HepG2 cells after brucine (0.5 mM) treatment for 12 h was measured by flow cytometry. Cell apoptosis after brucine (0.5 mM) treatment for 36 h was determined by Annexin V/PI staining. Effect of CsA on the caspase-3-like activity of HepG2 cells exposed to 0.5 mM brucine for 12 h (F). Effect of CsA on the activation of caspase-9 in HepG2 cells exposed to 0.5 mM brucine for 12 h (G). Time-course effect of brucine (0.5 mM) on the release of cytochrome c in HepG2 cells (H). Cells were preincubated with 20 nM CsA for 30 min (E, F, G, H). Each experiment was performed in triplicate. *p < 0.05, **p < 0.01, compared with control.
Ca2+ Was Involved in Brucine-Induced HepG2 Cell Apoptosis
By using fluo-3/AM as an indicator for intracellular [Ca2+], brucine (0.5 mM) caused a transient and sustained elevation of intracellular [Ca2+] when compared to control (Figs. 8A, 8B, and 8C), as visualized by a confocal microscope. In an attempt to identify the origin of the increased [Ca2+]i, cells were preincubated with BATPA/AM (50 μM) to chelate the intracellular Ca2+, whereas EDTA (0.5 mM) in culture medium was used to chelate the extracellular Ca2+. As presented in Figures 8D and 8E, BATPA/AM completely suppressed the increased caspase-3-like activity and cell death induced by brucine regardless of the presence of EDTA. In contrast, EDTA alone revealed a weaker effect as compared to that of BATPA/AM, suggesting that the increased [Ca2+]i in HepG2 cells was largely contributed by the redistribution of intracellular [Ca2+]. Also from Figure 8F, BATPA/AM was found to completely block the mitochondrial membrane depolarization in HepG2 cells treated by brucine, indicating that the elevation of [Ca2+]i was responsible for the collapse of ΔΨm in brucine-treated HepG2 cells.
![Ca2+ was involved in HepG2 cell apoptosis induced by brucine. Time-course effect of brucine (0.5 mM) on the intracellular [Ca2+] in HepG2 cells after treatment for 0 h (A), 2 h (B), or 8 h (C). Cells loaded with Fluo-3/AM (5 μM) were observed under a confocal microscope immediately (scale bars, 50 μm). Effects of BATPA/AM and EDTA (0.5 mM) on the caspase-3-like activity (D). Cell viability (E) of HepG2 cells after treatment with brucine. Cell viability was measured by MTT assay. Effect of BATPA/AM on the mitochondrial membrane depolarization of HepG2 cells after treatment with brucine (F). Cells after treatment were stained with DiOC6 (20 nM) for 30 min, and the ΔΨm change was determined by flow cytometry: (1) control, (2) BATPA/AM alone, (3) brucine + BATPA/AM, (4) bruince alone. Cells were preincubated with BATPA/AM (50 μM) for 30 min (D, E, F) and further incubated with brucine for 12 h (D, F) or 36 h (E). Each experiment was performed in triplicate. *p < 0.05, **p < 0.01 as compared to control.](https://oup.silverchair-cdn.com/oup/backfile/Content_public/Journal/toxsci/91/1/10.1093_toxsci_kfj114/1/m_toxscikfj114f08_ht.jpeg?Expires=1717027298&Signature=KmeMc4tltWGg59VTucqW8oBjCh1OrB2QM4DlSxxGAqQ2V2C0IKvVx8f77YqSX9jEZa4ee4Yiy0brPdLo9TFP~NdUKFzk9pHqLND7e4mFe1iELCFPLmHNvnD9aAzICCQJo5WuJ85hB0oRyFDb3HMO1I49yGKYDIr6PbK9OME~zKrXBczMSZQGz8oqj6vSgmq0Nzjz2MeS6VUSqr92YmlkZmnPHNH9GxqyQX7xlKS-MMcbWdmZSWXk6tYrebJvUz0g2E8IbbNq2aqjxQMnoqMif~vyu4nz5mX5MORw2ha8HnC6~0UAzK0EtBetc1HxcdeQH2-ywK72u2kgN5WHaOj1ZQ__&Key-Pair-Id=APKAIE5G5CRDK6RD3PGA)
Ca2+ was involved in HepG2 cell apoptosis induced by brucine. Time-course effect of brucine (0.5 mM) on the intracellular [Ca2+] in HepG2 cells after treatment for 0 h (A), 2 h (B), or 8 h (C). Cells loaded with Fluo-3/AM (5 μM) were observed under a confocal microscope immediately (scale bars, 50 μm). Effects of BATPA/AM and EDTA (0.5 mM) on the caspase-3-like activity (D). Cell viability (E) of HepG2 cells after treatment with brucine. Cell viability was measured by MTT assay. Effect of BATPA/AM on the mitochondrial membrane depolarization of HepG2 cells after treatment with brucine (F). Cells after treatment were stained with DiOC6 (20 nM) for 30 min, and the ΔΨm change was determined by flow cytometry: (1) control, (2) BATPA/AM alone, (3) brucine + BATPA/AM, (4) bruince alone. Cells were preincubated with BATPA/AM (50 μM) for 30 min (D, E, F) and further incubated with brucine for 12 h (D, F) or 36 h (E). Each experiment was performed in triplicate. *p < 0.05, **p < 0.01 as compared to control.
Effect of Bcl-2 on Brucine-Induced Cell Apoptosis
Proteins of the Bcl-2 family are critical determinants of the cellular threshold for apoptosis (Yang et al., 1997). As shown in Fig. 9A, brucine time-dependently decreased the protein abundance of Bcl-2 in HepG2 cells as early as 2 h after treatment. However, the protein abundance of Bax in HepG2 cells was greatly enhanced only at 4 h after treatment. Brucine did not change the protein abundance of Fas. In order to further examine the role of Bcl-2 in brucine-induced cell apoptosis, a pcDNA 3.1 plasmid harboring human Bcl-2 full length cDNA tagged with FLAG sequence was transiently expressed in HepG2 cells (Fig. 9B). The transfection efficiency was about 90% as confirmed by flow cytometry (data not shown). Over-expression of Bcl-2 blocked the increased cell death and apoptosis (Fig. 9E), caspase-3-like activity (Fig. 9F) and the elevation of intracellular [Ca2+] in brucine-treated HepG2 cells (Fig. 9C), whereas cells transfected with the mock plasmid did not show influence on them (Figs. 9D, 9E, and 9F).
![Bcl-2 was involved in brucine-induced HepG2 cell apoptosis. Time-course effects of brucine (0.5 mM) on the protein abundance of Bcl-2, Fas, Bax in HepG2 cells, as determined by immunoblot analysis (A). GAPDH was included as an inner standard to normalize loadings. The overexpression of FLAG-tagged Bcl-2 in HepG2 cells (B). Effect of Bcl-2 on the intracellular [Ca2+] of HepG2 cells after treatment with brucine (0.5 mM) for 2 h, as observed by a confocal microscope (C). Empty-vector transfected HepG2 cells were used as a control (D). Scale bars, 50 μm. Effects of Bcl-2 overexpression on brucine-induced cell death and apoptosis (E). Cell death was determined by MTT assay, apoptosis was measured by Annexin V/PI staining. Effect of Bcl-2 on the caspase-3-like activity of HepG2 cells exposed to brucine (F). Cells after transfection were treated with brucine (0.5 mM) for 36 h (E) or 12 h (F). **p < 0.01 as compared to control.](https://oup.silverchair-cdn.com/oup/backfile/Content_public/Journal/toxsci/91/1/10.1093_toxsci_kfj114/1/m_toxscikfj114f09_ht.jpeg?Expires=1717027298&Signature=fd2RuBMIMp8U5TfMdR8fkeq-ZOUPLlqI4WSVqscATbAU02~ZCWOOZriWmuWYm0sdDMtb3HNJxn1X5Oks7zYNEjS~s81LcJmzbOvWpqNkKBfEU7TO0M~DvYurxwqtPuhra3vKvf9pZGLZe1do-LCcSVu6gmAWUKIXQ7hYyouM2wZeuacKnTSTaYxsevigIC5RVPvaVXBP1X0v1COegzgvAcuk-xqAk07IadxP9crcCYMp-T1JyhBWPExzc8gVj90B6Ihce7XlpBlDArV5Ox6Ic1Y92TAhSUK61jTrGobCMtqV0X7HGIpBppwcawIvRdjjzofp83M2H9YnZjarxqEwJw__&Key-Pair-Id=APKAIE5G5CRDK6RD3PGA)
Bcl-2 was involved in brucine-induced HepG2 cell apoptosis. Time-course effects of brucine (0.5 mM) on the protein abundance of Bcl-2, Fas, Bax in HepG2 cells, as determined by immunoblot analysis (A). GAPDH was included as an inner standard to normalize loadings. The overexpression of FLAG-tagged Bcl-2 in HepG2 cells (B). Effect of Bcl-2 on the intracellular [Ca2+] of HepG2 cells after treatment with brucine (0.5 mM) for 2 h, as observed by a confocal microscope (C). Empty-vector transfected HepG2 cells were used as a control (D). Scale bars, 50 μm. Effects of Bcl-2 overexpression on brucine-induced cell death and apoptosis (E). Cell death was determined by MTT assay, apoptosis was measured by Annexin V/PI staining. Effect of Bcl-2 on the caspase-3-like activity of HepG2 cells exposed to brucine (F). Cells after transfection were treated with brucine (0.5 mM) for 36 h (E) or 12 h (F). **p < 0.01 as compared to control.
DISCUSSION
During the past decades, much effort has been directed toward the search for compounds or herbs that kill tumors through induction of apoptosis and their mechanisms (Selivanova, 2004; Smets, 1994; Watson, 1995). In the present study, brucine displayed typical characteristics of apoptosis in HepG2 cells such as cell shrinkage, PS externalization, and DNA fragmentation, all of which confirmed that the traditional application of nux vomica in liver cancer therapy was largely due to the alkaloids-induced tumor cell apoptosis, although the cell necrosis also emerged if HepG2 cells were treated with brucine at concentrations larger than 1.0 mM or for longer time than 48 h (data not shown).
In contrast to brucine, brucine N-oxide did not show any cytotoxic effect on HepG2 cells; meanwhile, neither strychnine nor isostrychnine exhibited a stronger effect than that of brucine. In fact, this phenomenon is not consistent with other pharmacological effects possessed by these alkaloids. For example, in our previous study, brucine N-oxide showed a more potent anti-inflammatory activity than that of brucine (Yin et al., 2003b). The reason could be the discrepancy in their acting mechanisms in spite of structural resemblance.
Caspases are the central executioners of apoptosis. Until now, two major apoptotic signaling pathways have been defined. The mitochondria-dependent pathway responds to extracellular cues and internal insults such as DNA damage. The second apoptotic pathway is triggered by death-receptor superfamily members through the activation of caspase-8. The death-receptor and mitochondrial pathways converge at the level of caspase-3. It is feasible to differentiate them by evaluating the activities of caspase-8 and caspase-9 (Li et al., 1997; Liu et al., 1996). In brucine-induced HepG2 cell apoptosis, the activation of caspase-3 was completely suppressed by caspase-9 inhibitor rather than caspase-8 inhibitor, brucine alone also caused the proteolytic cleavage of caspase-9. Furthermore, the expression of Fas in HepG2 cells remained unchanged after brucine treatment. Taken together, it may exclude the possibility that death-receptor mediated pathway was involved in brucine-induced cell apoptosis. Besides, in the present study, z-VAD-fmk was not found to completely prevent HepG2 cells from apoptosis or death. In fact, the concentration of z-VAD-fmk, including other inhibitors used in this study, has been proved to be high enough to inhibit the caspases activity (data not shown). Thus, the brucine-induced cell apoptosis was probably mediated by multiple pathways, among which caspases were partially involved. Meanwhile, the effect of z-DEVD-fmk on brucine-induced cell apoptosis was less potent than that of z-VAD-fmk (p < 0.05), suggesting that, in addition to caspase-3, other caspases may also participate in brucine-induced cell apoptosis.
Mitochondrial homeostasis plays a pivotal role in regulating apoptosis. Pro-apoptotic signals can trigger the mitochondria to release caspase-activating proteins into cytosol, such as cytochrome c (Hofmann et al., 1997; Kluck et al., 1997). In the present study, brucine was found to rapidly promote the release of cytochrome c into cytosol; furthermore, the release of cytochrome c and activation of caspase-9 or caspase-3 in brucine-treated HepG2 cells were totally dependent on the mitochondrial membrane depolarization.
Recently, several lines of evidence have shown that intracellular [Ca2+] played a critical role in apoptosis, probably through the direct activation of caspases or collapse of ΔΨm (Assaf et al., 2004). In addition, two hypotheses, so far, have been proposed to explain the involvement of Ca2+ in the apoptotic process. The first one is that the depletion of intracellular stores (such as endoplasmic reticulum) and possibly the influx of extracellular [Ca2+] promote the increase of cytoplasmic [Ca2+] that acts as a signal for apoptosis. The second hypothesis is the emptying of intracellular [Ca2+] stores that trigger apoptosis, perhaps by disrupting the intracellular architecture, thus allowing key elements of the effector machinery (such as DNase I) to gain access to their substrates (McConkey and Orrenius, 1997). In the present study, BATPA/AM completely blocked the cell apoptosis and death induced by brucine and suppressed the ΔΨm decrease and the increased caspase-3-like protease activity, all of which implied that the intracellular [Ca2+] increase predominantly controlled the HepG2 cell apoptosis. In contrast to BATPA/AM, EDTA revealed a minor effect on brucine-induced cell apoptosis, implying that extracellular Ca2+ influx also made a small contribution to the increase of intracellular [Ca2+]. All of these data concluded that the combinatory [Ca2+]i increase in HepG2 cells after brucine treatment acts as a signal to trigger cell apoptosis; thus, the second hypothesis as described above could be excluded. Besides this, it is noteworthy to mention that, although both BATPA/AM and CsA were found to completely suppress the mitochondrial membrane depolarization in HepG2 cells after treatment with brucine, CsA, in contrast to BATPA/AM, only partially inhibited the brucine-induced cell apoptosis. This result implied that mitochondrial pathway was largely, but not solely involved in brucine-induced HepG2 cell apoptosis. Recently, a wide range of agents and conditions known to disrupt the ability of the endoplasmic reticulum (ER) to fold proteins properly have been reported to result in the onset of ER-stress-mediated cell apoptosis (Kim et al., 2003). Thus, whether the HepG2 cell apoptosis induced by brucine was also relevant to ER-stress needed more experiments to identify.
On the other hand, brucine in the present study decreased the protein level of Bcl-2 in HepG2 cells and, instead, increased the protein level of Bax. Meanwhile, the elevation of intracellular [Ca2+] in HepG2 cells was greatly suppressed by overexpression of Bcl-2 in HepG2 cells, which is consistent with other reports that the redistribution of intracellular [Ca2+] was tightly regulated by Bcl-2 oncogene (Mathai et al., 2005). However, how Bcl-2 gained such a top priority in governing the HepG2 cell destiny remained a mystery. Recently, lines of evidence have shown that nonsteroid anti-inflammatory drugs (NSAIDs), commonly used drugs to specifically inhibit the cyclooxygenase-2 (COX-2) activity, can induce the tumor cell apoptosis through down-regulation of Bcl-2 (Li et al., 2002; Sheng et al., 1997). Nimesulide is such an example (Li et al., 2003). In our previous study, brucine was found to relieve pain and reduce the release of inflammatory factors such as prostaglandin E2, thromboxane B2, and 6-keto-PGF1a in adjuvant-induced arthritis. The mode of action of brucine, therefore, is very similar to or almost the same as those of NSAIDs (Yin et al., 2003b). As expected, brucine was found in our recent study to suppress the COX-2 protein abundance of HepG2 cells in a time-dependent manner (unpublished data). Therefore, whether the inhibition of Bcl-2 in brucine-treated HepG2 cells is closely relevant to COX-2 inhibition awaited more experiments to elucidate.
Finally, we have to acknowledge that the concentration of brucine used in this study was a little bit higher than its physiological concentration. However, the effect of brucine, at least in this study has been proven to be specific. First of all, brucine at 0.5 mM or higher did not cause significant human embryonic kidney cell (HEK293) or other mammalian cell death in our study (data not shown). Second, if the effect of brucine on HepG2 cell apoptosis is a nonspecific toxic side effect, other alkaloids such as brucine N-oxide, strychnine, or isostrychine, which closely resemble brucine in chemical structure, should also produce such an effect. However, none of these alkaloids, as described in this paper, revealed such a comparable effect. Thus, in the present study, we have successfully established an in vitro model to evaluate the possible mechanism of alkaloids in nux vomica in the therapy of liver cancer. The final goal we hope to achieve is to find a more effective anti-tumor drug by properly modifying the structure of brucine, since many alkaloids such as harringtonine, vincaleukoblastine, and vincristine, which have strong anti-tumor effects, share the indole ring in their chemical structures with brucine. Thus, the experimental model established in this paper will surely accelerate the understanding of the structure–activity relationships in brucine and pave the way for discovering new drugs.
This work was supported by National Nature Science Fund of China to Dr. Yin (30470644). The authors express thanks for the assistance from associate professor Wang Tian-Shan and Di Liu-Qing from the College of Pharmacy, Nanjing University of Chinese Medicine, in the generation of the original research proposal, also critical comments on the direction of this project and great technical assistance from Xu Dong-Qing and Sheng Yu-Qing.
References
Assaf, H., Azouri, H., and Pallardy, M. (
Bisset, N. G., and Phillipson, J. D. (
Cai, B. C., Hattori, M., and Namba, T. (
Cai, B. C., He, Y. W., Ding, H. F., Ma, C., and Wu, H. (
Cai, B. C., Wang, T. S., Kurokawa, M., Shiraki, K., and Hattori, M. (
Cai, R. L., Meng, W., Lu, H. Y., Lin, W. Y., Jiang, F., and Shen, F. M. (
Dua, P., and Gude, R. P. (
Hofmann, K., Bucher, P., and Tschopp, J. (
Kim, A. J., Shi, Y., Austin, R. C., and Werstuck, G. H. (
Kluck, R. M., Bossy-Wetzel, E., Green, D. R., and Newmeyer, D. D. (
Kwon, K. B., Yoo, S. J., Ryu, D. G., Yang, J. Y., Rho, H. W., Kim, J. S., Park, J. W., Kim, H. R., and Park, B. H. (
Lei, Y., Rebecca, S., and Beatriz, G. F. (
Li, H. L., Zhang, H. W., Chen, D. D., Zhong, L., Ren, X. D., and Tu, R. (
Li, P., Nijhawan, D., Budihardjo, I., Srinivasula, S. M., Ahmad, M., Alnemri, E. S., and Wang, X. (
Li, X. H., Li, J. J., and Zhang, H. W. (
Liu, X. S., Kim, C. N., Yang, J., Jemmerson, R., and Wang, X. D. (
Mathai, J. P., Germain, M., and Shore, G. C. (
McConkey, D. J., and Orrenius, S. (
Nagata, S., Nagase, H., Kawane, K., Mukae, N., and Fukuyama, F. (
Ramonede, B. M., and Perez-Tomas, R. P. (
Sei, Y., Fossom, L., Goping, G., Skolnick, P., and Basile, A. S. (
Sheng, H., Shao, J., and Kirkland, S. (
Smets, L. A. (
Suzuki, M., Harada, S., Owaribe, K., and Yaoita, H. (
Watson, A. J. (
Xu, X. Y., Cai, B. C., Pan, Y., and Wang, T. S. (
Yang, J., Liu, X., Bhalla, K., Kim, C. N., Ibrado, A. M., Cai, J., Peng, T., Jones, D. P., and Wang, X. (
Yin, W., Jiang, G., Takeyasu, K., and Zhou, X. (
Author notes
*College of Pharmacy, Nanjing University of Chinese Medicine, Nanjing,China, 210029; †College of Life Science, South-Central University for Nationalities, Wuhan, China, 430074; and ‡State Key Lab of Pharmaceutical Biotechnology, Nanjing University, Nanjing, China, 210093

Comments