Satisfaction of the Graduate for the Continuous Improvement of Educational Quality in UNTELS
Satisfaction of the Graduate for the Continuous Improvement of Educational Quality in UNTELS
Volume 4, Issue 5, Page No 151-157, 2019
Author’s Name: Omar Freddy Chamorro Atalaya1,a), Teodoro Neri Díaz Leyva1, Dora Yvonne Arce Santillan1, Jorge Isaac Castro Bedriñana1, Denisse Marie Barrientos Pichilingue1, Avid Roman-Gonzalez2
View Affiliations
1Faculty of Engineering and Management, Universidad Nacional Tecnológica de Lima Sur, Lima, Peru
2Aerospace Sciences and Health Research Laboratory (INCAS-Lab), Universidad Nacional Tecnológica de Lima Sur, Lima, Peru
a)Author to whom correspondence should be addressed. E-mail: omar_chamorro1@hotmail.com
Adv. Sci. Technol. Eng. Syst. J. 4(5), 151-157 (2019); ![]() DOI: 10.25046/aj040520
DOI: 10.25046/aj040520
Keywords: Student satisfaction, Graduated, Continuous Improvement, Competitions, Personal attitudes, Teaching plan, Library services, Laboratory services, Computer center, Administrative service, Support service

Export Citations
The Universidad Nacional Tecnologica de Lima Sur (UNTELS), like all universities, has as one of its objectives the training of professionals with skills that the changing working world requires. One way to establish the relevance of what UNTELS offers to its students is to know relevant information from graduates that entails, to their authorities, establish policies for continuous improvement of educational quality and improve the training of new professionals. In this context, the purpose of this research project is to collect information from graduates of the Professional Careers of Systems Engineering, Environmental Engineering, Mechanical and Electrical Engineering, Electronic Engineering and Communications, Business Administration from the National Technological University of South Lima of the second academic semester of the year 2017; To evaluate the satisfaction with regard to their professional training, receive a physical questionnaire with questions aimed at knowing their professional competencies, teaching staff, environments, library services, laboratory services, computer center services, administrative service of the Faculty and Professional School, University support services and personal and social attitudes that support decision-making for the improvement of educational quality at the National Technological University of South Lima.
Received: 12 July 2019, Accepted: 01 September 2019, Published Online: 24 September 2019
1. Introduction
The satisfaction of the educational quality of students or graduates of higher education institutions (IES) becomes more relevant because of the social relevance of higher education and the competition between the different study options of the most affluent or most talented students [1]
In a study of student satisfaction of the Ana G. Méndez University System, it tells us that the average level of overall satisfaction towards university services worldwide is 78% [2]
Likewise, according to Llanes Castillo and collaborators, it was evident that the satisfaction of the graduates in a Mexican university in terms of the training received, ranged between 54 and 65%, was evaluated regularly by 17% and good by 58.5%. Another similar study carried out in a medical university in Colombia, when exploring the aspects to improve in training, found teaching deficiencies (7.0%), deficiencies in practical activities (19.5%), deficit of texts in the library (0,9%). While a study of graduates in Peru, I detected 6.2% dissatisfaction, and 59.1% reported satisfaction, so that more than 80% of respondents rated between 4 and 5 the general training received in relation to performance as professionals [3].
Satisfaction with the training received is a subjective concept, since it depends on the fulfillment (or not) of the expectations and wishes of the students [4] In addition, it is a broad concept, whose study is conditioned by a great quantity of characteristics, as well as the existence of different points of view to address its measurement [5].
Among the latter, there is the vision provided by Lapeña and González (1996), which indicate that the degree of satisfaction of a student with the training received is related to their opinion on it (which highlights the subjectivized commented) [6]. According to these authors, it would be an attempt to see to what extent the student considers training in the performance of their work or training useful and if they liked it [7].
Thus, the continuous improvement of university quality is not only due to increasing resources and infrastructures in academic units, but mainly by launching trained professionals with optimal academic performance and, above all, satisfied with the preparation received [8].
In this sense, the National Technological University of Lima Sur (/UNTELS) aims to have information on the satisfaction of graduates regarding their professional training, so that the managers of the National Technological University of Lima South support the taking of decisions to adapt their professional training of students to the existing demand of the productive environments.
The present work is structured as follows. Section 2 presents the methodology used in this research work; this methodology will be descriptive / correlational, with which the relationship of the indicators that present the highest level of dissatisfaction will be found. Section 3 shows the results obtained after the surveys carried out. In Section 4 he presents the statistical analysis. Finally, in Section 4 the discussion of the results obtained is presented.
2. Methodology
2.1. Kind of investigation
The research is basic; the level is descriptive/ correlational.
2.2. Population and Sample
The population is made up of the 160 graduates of the second academic semester of 2017 of the professional careers of Systems Engineering, Mechanical and Electrical Engineering, Environmental Engineering, Business Administration and Electronic and Telecommunications Engineering of the National Technological University of Lima Sur.
The sample is equal to the population and is not probabilistic, because it was only considered, to apply the questionnaire to graduates of the second academic semester of 2017, which corresponds to a number of 160 graduates; these results were obtained as part of the application of a questionnaire made to all graduates. It should be noted that UNTELS University is an institution with few years of operation specifically founded in 2007, and its first graduate promotion is registered in 2011, to date the University has no report or reference base or point Starting that allows taking actions in relation to the satisfaction of the graduates.
Then the type of non-probabilistic sampling that was used is “deliberate, critical or trial sampling”, which is a technique in which the members of the sample are chosen only on the basis of the knowledge and judgment of the investigator. As the knowledge of the researcher is instrumental in creating a sample, there are chances that the results obtained are highly accurate with a minimum margin of error. This type of sampling is more effective in situations where there are only a limited number of people they possess the same qualities that a researcher expects from the target population [9].
There is no bias in the data because the questionnaire was applied to the entire population formed by the 160 graduates of all professional careers, without considering any distinction; the self-selection was possible since the presence of the 160 graduates was counted, thus having a form of control over the possibility of their participation. Due to this control it was possible to obtain all the answers requested in the questionnaire.
2.3. Applied Techniques in the Collection of Informacion and Measuring Instruments
A questionnaire with opinion questions about the satisfaction of the graduate of the quality of the different services offered by UNTELS was used as an instrument, considering indicators regarding knowing their professional competencies, teaching staff, environments, library services, laboratory services, services of computer center, administrative service of the Faculty and Professional School, support services of the University and personal and social attitudes; Because it is the first time this type of research is carried out, it was decided to opt for a simple, easy to understand and low cost tool for the collection of information.
Questionnaires were used to measure satisfaction, since according to Franklin and Walker (2010), the use of questionnaires has the advantages of speed, moderate cost, and can cover a wide variety of potential problems ranging from spelling errors, grammar or of writing up problems with the concepts that are being operationalized in the questionnaire, additionally covers cognitive aspects of the respondents, can reveal potential difficulties for the interviewer (if there is one) and can reveal possible problems for data analysis. (Landa, M. & Ramírez, M., 2017). [9]
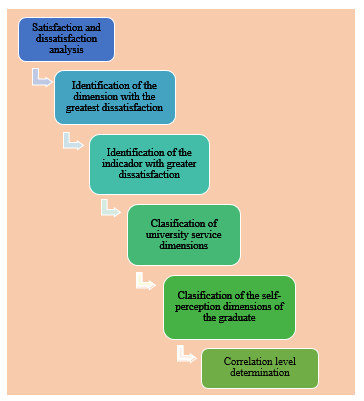 Figure 1: Sequence of the investigation procedure
There are other methods to measure student satisfaction, such is the case of the SERVQUAL method, but according to the empirical studies carried out by Cronin and Taylor, this is not the most appropriate evaluations, due to the frequent interpretation problems that it poses to the people to whom questions are administered; They also represent a redundancy within the measuring instrument, since perceptions are influenced by expectations, while the questionnaires are one of the most economical ways of obtaining quantitative data and a wide scope; They also allow you to analyze the results easily with integrated tools, without having to have knowledge of statistics or scientific research.
The following figure shows the sequence of the procedure that the present investigation has.
3. Results
The results obtained from the application of the data collection instrument of the “Graduate Satisfaction Survey”, for the second academic semester of 2017, are shown below.
The following Figure 2 shows the results of the Indicators with the highest levels of dissatisfaction by specialty of the Professional Competencies dimension.
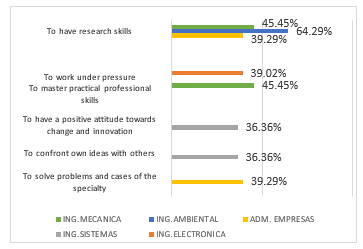 Figure 2: Indicators with the highest dissatisfaction levels by specialty of the dimension professional competences
As can be seen in Figure 2, the indicator that shows the highest percentage of dissatisfaction is “To have research skills” equivalent to 64.29% in the specialty of Environmental Engineering in the Professional Competencies dimension.The following Figure 3 shows the results of the Indicators with the highest levels of dissatisfaction by specialty of the Teaching Plan dimension.As can be seen in Figure 3, the indicator that shows the highest percentage of dissatisfaction is “Proficiency in the subjects of the courses it develops” equivalent to 64.29% in the specialty of Environmental Engineering in the Teaching Plane dimension.The following Figure 4 shows the results of the Indicators with the highest levels of dissatisfaction by specialty of the University Environments dimension.
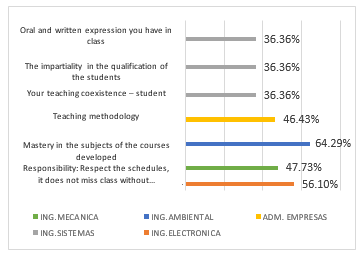 Figure 3: Indicators with the highest dissatisfaction levels by specialty of the teaching flat dimension
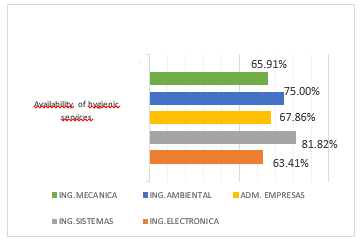 Figure 4: Indicators with the highest dissatisfaction levels by specialty of the dimension environments of the University
As shown in Figure 4, the indicator that shows the highest percentage of dissatisfaction is “Availability of Hygienic Services” equivalent to 81.82% in the specialty of Systems Engineering in the University Environments dimension.The following Figure 5 shows the results of the Indicators with the highest levels of dissatisfaction by specialty of the Library Services dimension.
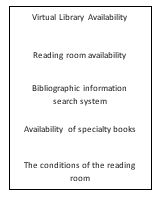 Figure 5: Indicators with the highest dissatisfaction levels by specialty of the dimension library services
As shown in Figure 5, the indicator that shows the highest percentage of dissatisfaction is “Virtual library availability” equivalent to 61.11% in the specialty of Environmental Engineering in the Library Services dimension
The following Figure 6 shows the results of the Indicators with the highest levels of dissatisfaction by specialty of the Laboratory Services dimension.
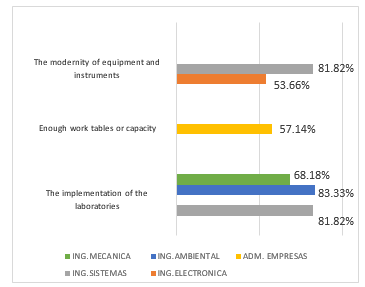 Figure 6: Indicators with the highest dissatisfaction levels by dimension specialty laboratory services
As shown in Figure 6, the indicator that shows the highest percentage of dissatisfaction is “The implementation of laboratories” equivalent to 83.33% in the specialty of Environmental Engineering in the Laboratory Services dimension.The following Figure 7 shows the results of the Indicators with the highest levels of dissatisfaction by specialty of the Computer Center dimension.
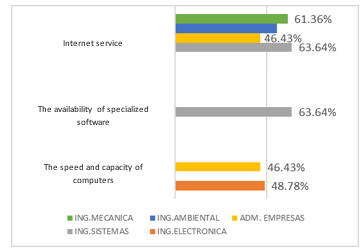 Figure 7: Indicators with the highest dissatisfaction levels by specialty of the dimension computer center
As shown in Figure 7, the indicators that show the highest percentage of dissatisfaction are “Internet service and availability of specialized Software” equivalent to 63.64% in the specialty of Systems Engineering in the Computer Center dimension.The following Figure 8 shows the results of the Indicators with the highest levels of dissatisfaction by specialty of the Administrative Service dimension of the Faculty and Professional School.
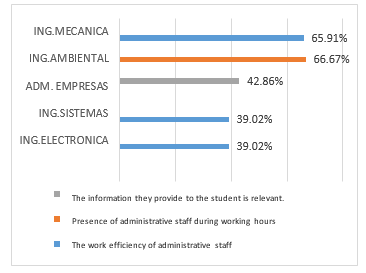 Figure 8: Indicators with the highest insatisfaction levels by specialty of the dimension administrative service of the school and professional school
As shown in Figure 8, the indicator that shows the highest percentage of dissatisfaction is “Presence of administrative staff during working hours” equivalent to 66.67% in the specialty of Environmental Engineering in the Administrative Service dimension of the Faculty and Professional School.The following Figure 9 shows the results of the Indicators with the highest levels of dissatisfaction by specialty of the Support Services dimension of the University.
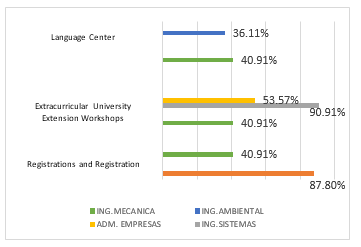 Figure 9: Indicators with the highest dissatisfaction levels by specialty of the dimension support services of the University
As can be seen in Figure 9, the indicator that shows the highest percentage of dissatisfaction is “Registries and enrollment” equivalent to 90.91% in the specialty of Systems Engineering in the Support Services dimension of the University.
The following Figure 10 shows the results of the Indicators with the highest levels of dissatisfaction by specialty of the Personal and Social Attitudes (Self-perception) dimension.
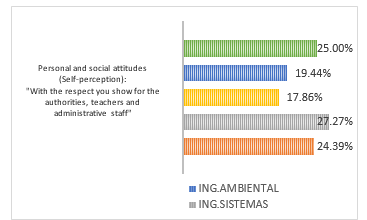 Figure 10: Indicators with the highest insatisfaction levels by specialty of the dimension personal and social attitudes (Self-perception)
As shown in Figure 10, the indicator that shows the highest percentage of dissatisfaction is “With the respect you show for the authorities, teachers and administrative staff” equivalent to 27.27% in the specialty of Systems Engineering in the Personal Attitudes and social (Self-perception).
4. Statistical Analysis
Initially for this analysis we will classify the dimensions into two groups dimensions by university services and self-perception dimensions of the graduate. This classification is shown in the following table.
Tabla 1: Clasification of dimensions
| UNIVERSITY SERVICE DIMENSIONS | GRADUATE SELF-PERCEPTION DIMENSIONS |
| TEACHING PLAN | PROFESSIONAL COMPETENCES |
| UNIVERSITY ENVIRONMENTSD | PERSONAL AND SOCIAL ATTITUDES (Self-perception) |
| LIBRARY SERVICES | |
| LABORATORY SERVICES | |
| COMPUTER CENTER | |
| ADMINISTRATIVE SERVICE OF THE SCHOOL AND PROFESSIONAL SCHOOL | |
| UNIVERSITY SUPPORT SERVICES |
For this analysis we will see the correlation that exists between the indicators that present the highest percentage of dissatisfaction, for this we will be guided by the results obtained in the previous point; being our indicators to analyze: implementation of laboratories, records and enrollment, research skills and respect that students show towards the authorities, teachers and administrative staff; corresponding to the dimensions: laboratory services, University support service, professional skills and personal and social attitudes (self-perception), respectively.To analyze the correlation you have the following interpretations:There is no correlation = 0Moderate positive correlation Strong +0.5Perfect positive correlation +1.0The results obtained in relation to the correlation of the indicators implementation of laboratories and research skills are shown below.
Table 2: Pearson correlation of the implementation of laboratories and research competences
| Laboratory Implementation |
Competitions investigative |
||
|
Laboratory Implementation |
Pearson correlation |
1 | ,651 |
| N | 160 | 160 | |
|
Competitions_ investigative |
Pearson correlation |
,651 | 1 |
| N | 160 | 160 | |
The above table shows a moderate positive correlation of 0.651, in relation to the dissatisfaction of the graduates towards having investigative competencies, because there was no adequate implementation for the professional development of the student of the National Technological University of Lima Sur.
Table 3: Pearson correlation the registrations and registration and personal and social attitudes
| Registrations and registration matriculas | Personal and Social Attitudes | ||
|
Registrations_ and_ registration matriculas |
Pearson correlation |
1 | ,502 |
| N | 160 | 160 | |
|
Personal_and_ Social attitudes |
Pearson correlation |
,502 | 1 |
| N | 160 | 160 | |
The results obtained in relation to the correlation of the registration and enrollment indicators are shown below, and the respect shown by the students towards the authorities, teachers and administrative staff.The above table shows a moderate positive correlation of 0.502, in relation to the dissatisfaction of the graduates towards the respect they show towards the authorities, teachers and administrative staff, this because the graduates during their years of study have always shown discomfort of the registration system, whose processes were carried out manually and the lack of technological tools was evident.
5. Discussion
In relation to the results of this research, the following discussions are held below:· Regarding the indicators “Implementation of laboratories and the modernity of equipment and instruments” which show a level of dissatisfaction of 83.33% and 81.82%, respectively, it can be said that these agree with the study conducted by (Salinas & Martínez , 2017) which concludes that at the UPM, regarding the workshops where the students’ practices are carried out; a highly dissatisfied degree of 30% is shown; This is reflected, because he did not have the necessary implements for the professional development of the student of the National Technological University of South Lima [10].· Regarding the “Registries and enrollment” indicator which shows a level of dissatisfaction of 90.91%, it can be said that these agree with the study carried out by (Coveñas, 2017), in his thesis entitled Study of student satisfaction with services education provided by PROEDUNP – Sullana 2016, concludes that: Regarding administrative services; a dissatisfaction degree of 58.75% is shown; This is reflected, due to the delay in the enrollment process, since there was no enrollment system, which controls and optimizes the service of the students of the National Technological University of South Lima [11].· Regarding the indicator “Availability of hygienic services” which shows a level of dissatisfaction of 81.82%, it can be said that they agree with the study conducted by (Coveñas, 2017), in his thesis entitled Study of student satisfaction with students educational services provided by PROEDUNP – Sullana 2016, concludes that: Regarding sanitary facilities; a dissatisfaction degree of 44% is shown; This is reflected, because there were cases of lack of cleanliness, as well as the availability of permanent drinking water in the hygienic services of the National Technological University of South Lima. [11]
6. Conclusions
· It is concluded that it was possible to determine the levels that present the greatest satisfaction of the graduate in relation to the quality of the educational services of their professional training at the National Technological University of South Lima, which are to assume a self-education (self-learning and continuing education) and I treat students in and out of the classroom; The two indicators present 85.71% satisfaction and belong to the dimensions of Professional Competencies and Teaching Plan respectively.· It is concluded that it was possible to determine the highest levels that present dissatisfaction of the graduate in relation to the quality of the educational services of their professional training at the National Technological University of South Lima, which are Registries and enrollments with 90.91%, Implementation of the laboratories with 83.33% and availability of hygienic services with 81.82%; These indicators belong to the dimensions of University Support Services, Laboratory Services and University Environments respectively.· Finally it is concluded that it was possible to determine the highest levels that present dissatisfaction of the graduate according to professional careers in relation to the quality of educational services in their professional training at the National Technological University of Lima, which are: in Electronic Engineering and Telecommunications, Services of Transportation with 87.80% and Availability of hygienic services with 63.41%, in Systems, Registries and Enrollment Engineering with 90.91%, Modernity of equipment and instruments with 81.82% and Implementation of laboratories with 81.82%, in Business Administration, Availability of hygienic services with 67.86% and Availability of books of their specialty with 57.14%, in Environmental Engineering, Implementation of laboratories with 83.33%, Presence of administrative staff in working hours with 66.67% and Availability of hygienic services with 75%, and in Mechanical and Electrical Engineering ica, Implementation of laboratories with 68.18%, The efficiency of the work of administrative staff with 65.91% and Internet service with 61.36%.
Conflict of Interest
The authors declare no conflict of interest.
Acknowledgment
The authors wish to recognize and thank the Universidad Nacional Tecnologica de Lima Sur for their support of this investigation.
- Gonzáles, R., “Analysis of the satisfaction of the university experience of the graduates”, Economic Paradigm, 59-84, 2016.
- Salinas, A., & Martínez, P., “Main satisfaction factors among university students”, Revista Internacional de Ciencias Sociales y Humanidades, 163-192, 2017.
- Vázquez, M.; Hernández, M.; Mantecón, M. & Chávez, D., “Satisfaction of Cuban graduates of the Medicine degree with the training received”, Curso 2015-2016, Cienfuegos. Universidad de Ciencias Médicas, Cienfuegos, Cienfuegos, Cuba, CP: 55100 Revista Medisur, vol.14: 512-513, 2017.
- Athiyaman, A., “Linking student satisfaction and service quality perceptions: thecase of university education”, European Journal of Marketing, vol.31, núm.7: 528-540, 1997.
- Pérez Gil, J.A.; Lozano Lozano, J.A.; Gómez de Terreros Guardiola, M. Y Aguilera Jiménez, A., “Design of an instrument for the evaluation of the satisfaction of the training received from the different subjects corresponding to the Curriculum of the degree in psychology of the University of Seville”, Revista de Enseñanza Universitaria, vol.36: 45-61, 2010.
- LapeñaLapeña, A. Y González Sánchez, M.C., “The continuous training of workers: manual del formador / [autores, Equipo IFES,]”. Madrid Instituto de Formación y Estudios Sociales, 1996.
- González, M. &Sanchís, C., “Satisfaction of graduates with the training received in the Master of Advanced Studies in Business Administration”, Journal of Education in Accounting, Finance and Business Administration.pp. 33-48, 2014.
- Paredes, M. &Cristaldo, M., “Satisfaction level of students and graduates of the National University of Asunción”, Paraguayan Education Magazine, Volumen 1, Número 4, 2014, pp. 57-69, 2013.
- Landa, M. & Ramírez, M., “Design of a student satisfaction questionnaire for a profesional level course under the inverted learning model”, Revista Páginas de Educación. Vol. 11, Núm. 2, 2018.
- Salinas, A. M., & Martínez, P. “Student satisfaction and university quality: an explanatory analysis in the academic and multidisciplinary agronomy and science unit of the Universidad Autónoma de Tamaulipas”, México. Revista de Enseñanza Universitaria, 39-65, 2008.
- Coveñas, J., “Study of student satisfaction with the educational services provided by PROEDUNP-Sullana 2016”, UNIVERSIDAD NACIONAL DE PIURA, Piura, 2017.