The Correlation of the Specific and Global Performance of Teachers in UNTELS Engineering Schools
The Correlation of the Specific and Global Performance of Teachers in UNTELS Engineering Schools
Volume 4, Issue 6, Page No 196-202, 2019
Author’s Name: Omar Freddy Chamorro Atalaya1,a), Dora Yvonne Arce Santillan1, Jorge Isaac Castro Bedriñana2, Yesica Pamela Leandro Chacón1, Martin Díaz Choque1
View Affiliations
1Faculty of Engineering and Management, Universidad Nacional Tecnológica de Lima Sur, Lima, Perú
2Faculty of Zootechnics, Universidad Nacional del Centro del Perú, Huancayo, Perú
a)Author to whom correspondence should be addressed. E-mail: omar_chamorro1@hotmail.com
Adv. Sci. Technol. Eng. Syst. J. 4(6), 196-202 (2019); ![]() DOI: 10.25046/aj040625
DOI: 10.25046/aj040625
Keywords: Teaching performance, Student appreciation, Professional schools, Specific Dimension, Global Dimension, University, School of Engineering, Course planning, Teaching strategies, Student communication, Administration of the class

Export Citations
This article presents an analysis on the existing correlation of the specific and global performance of teachers in UNTELS engineering schools, whose data collection was carried out during the development of the first academic semester of the year 2019, using the Survey technique; which presents indicators classified in two dimensions: “Specific Dimension of Teaching Performance” and “Global Dimension of Teaching Performance”, the first dimension includes indicators such as course planning, teaching strategies, teaching communication, student communication, administration of the class, and personal and professional traits, that the teacher shows towards the student; Likewise, the global dimension is related to the student’s appreciation, as to whether the teacher surveyed should continue with the development of the course. This research was carried out, due to the low percentage of satisfaction in the student survey, and the appreciations in some negative cases, of the students in the Professional Engineering Schools. For this, initially it was sought to identify the number of teachers by Professional School of Engineering, whose teaching performance is poor, resulting in 17 teachers, which represents 14.05% of the total number of teachers; with which it was determined the Specific Dimension that presents the lowest level of qualification, resulting in Dimension 2 (D2): Didactic strategies, with an average grade of 10.41; These results will allow decisions to be made by the University authorities, regarding the development of a pedagogical training plan focused on improving said dimension, thus benefiting teachers in improving their teaching methodology. According to the analysis made, the dimensions of the specific and global performance of teachers in UNTELS engineering schools show a high positive level of Pearson’s correlation.
Received: 13 September 2019, Accepted: 03 November 2019, Published Online: 05 December 2019
1. Introduction
University teaching is one of the primary functions of the university; The university teacher is one of the pillars on which educational quality is supported, so the evaluation of teacher performance is a practice that is taking more and more strength in higher education institutions, it is becoming the key element of efforts to improve the quality of education, and the idea that the success of an educational system depends essentially on the quality of the performance of its teachers is increasingly widespread. [1]
Within the framework of institutional evaluations, university teaching should be approached from the whole university work, containing the different teaching and learning functions. [2]
In the process of evaluating teacher performance, it is crucial to have clarity in the aims and objectives that are to be achieved; some researchers consider teaching as an institutional project aimed at raising the quality of education. [3] For higher education institutions it is vital to have a teacher evaluation system that responds to the needs of the educational process and the functions of the teaching staff and fosters a culture of evaluation in the institution. [4]
Thus, the evaluation of the student to the teaching performance translates to some extent, in the evaluation of the same teaching, since the quality of the explanation of the knowledge is related to the quality of understanding on the part of the student. [5] University teaching does not admit the slightest contradiction between knowing a subject well and not knowing how to teach it, in order to achieve continuous training towards the development of the professional skills necessary to meet the challenges of education. [6]
The results of research on the evaluation of teaching based on student opinions have found that the use of this source of information has benefits. [7] Numerous studies have examined the validity of students’ assessments of their teachers and have found that students are one of the most important sources of information on teacher performance. [8]
In September 2015, through Supreme Decree No. 016-2015-MINEDU, the Policy for Quality Assurance of Higher University Education in Peru was approved, as the main guiding document of the reform process, which allows universities provide a quality educational service, based on getting graduates from public universities with adequate skills for their professional performance. Thus, one of the aspects to be considered by universities in Peru is the strengthening of the teacher evaluation system based on student surveys. [9]
In this sense, the present article seeks, through a descriptive analysis, to identify the number of teachers per Professional School of Engineering, whose teaching performance is poor, and then determine the dimensions in which they present the lowest level of qualification; In addition, it is also intended to determine if there is a correlation between the specific dimensions of the teacher and the Global Dimension of teacher performance.
2. Methodology
2.1. Level of Research
The level of research addressed in this article is Descriptive / Correlational. Descriptive because it seeks to specify the properties and characteristics of a group of teachers whose performance is poor. That is, they only intend to measure or collect information independently or jointly. And it is correlational since it seeks to know the relationship or degree of association with the Global Dimension of teacher performance. [10].
In the search to achieve these results; the following specific objectives have been set: Identify the number of teachers by Professional School of Engineering, whose teaching performance is poor. Determine the Specific Dimension that has the lowest level of qualification.
2.2. Source of Data Collected
The source of data collected was generated by the 2228 students of the 2019-I academic semester of the Engineering degrees, which qualified the teaching performance of the National Technological University of South Lima.
For greater detail these teachers are distributed as follows: 23 belong to the School of Mechanical and Electrical Engineering, 35 to the School of Systems Engineering, 31 to the School of Environmental Engineering and 32 to the School of Electronic Engineering and Telecommunications Being a total of 121 teachers.
2.3. Instrument used data collection
The instrument used in data collection is the “Survey”, this instrument responds to what is established by the Ministry of Education within its policies of Quality Assurance of Higher University Education in Peru. The structure of the student assessment survey of teacher performance is approved with Resolution of the Organizing Committee RCO N ° 090-2018-UNTELS. [11]
Which is composed of five dimensions which make up the group of “Specific Dimensions of Teacher Performance” and one dimension which forms the “Global Dimension of Teacher Performance”.
Table 1: Survey Dimensions
| SURVEY DIMENSIONS | |
| Specific Dimension of Teaching Performance | Global Dimension of Teaching Performance |
| Planning (D1) | Global evaluation of Teaching performance (D6) |
| Teaching strategies (D2) | |
| Communication (D3) | |
| Class administration (D4) | |
| Professional and personal traits (D5) | |
Source: Untels
The previous table shows the 6 dimensions of each survey; The following factors have intervened in each of them (See Table 2).
Next, in the following Table 3, the range of scores is detailed, which was used to rate the teaching performance, these averages classified the teachers as excellent, very good, good, regular and deficient.
Table 3: Averages that Classify Teachers
| Description Value | Description Value |
| Excellent teaching performance | 18 to 20 |
| Very Good teaching performance | 16 to 17 |
| Good teaching performance | 14 to 15 |
| Regular teaching performance | 12 to 13 |
| Deficient teaching performance | Less than or equal to 11 |
Source: Untels
Table 2: Factors Intervening in each Dimension
| Question | Dimensions | |
| Skill and effort of the teacher in the preparation and achievements of the course | ||
| Do you present and explain the syllable on the first day of class? | D1 | |
| Does the student communicate clearly and precisely the objective and activities to be developed in the class? | ||
| Make known the bibliographic support material required to broaden the topic? | ||
| Teacher effectiveness so that their students acquire relevant knowledge, skills and attitudes | ||
| Do you apply appropriate teaching methods, procedures and techniques to the development of the subject? | D2 | |
| Does it promote basic or applied research in the development of the subject? | ||
| Is it motivating, dynamic, innovative and promotes student participation and teamwork in the development of the subject? | ||
| Does it lead to problem solving and exemplify the topic discussed with practical or real-life applications? | ||
| Does it reinforce learning with feedback activities? | ||
| Does the evaluation form coincide with that indicated in the syllabus, is it fair and objective in its grades and returns the exams and qualified practices on the established dates, showing the solution of them? | ||
| Do you practice and encourage positive attitudes and values (discipline, responsibility, punctuality, ethics) towards the profession during class development? | ||
| Teacher effectiveness in promoting a favorable learning environment | ||
| Does it arouse interest and encourage student participation through opinions, questions, discussions, teamwork or other actions and answer questions and concerns accurately and in a good way? | D3 | |
| Do you use oral (syntax, tone, diction), written (clarity of the letter, syntax, spelling) and gestural languages? | ||
| Group management and achievement of objectives | ||
| Does your class start and end at the scheduled times? | D4 | |
| Do you maintain discipline and comply with the activities scheduled at the beginning of the class and indicated in the syllabus? | ||
| Do you invest all the time in the class in academic and training activities, without addressing issues outside the class? | ||
| Personality attributes, characteristics of the professional teacher and ability to interact positively with students | ||
| Does it show solid mastery of the knowledge of the subject it teaches and relates it to professional practice? | D5 | |
| Do you pour your academic and professional experiences in the development of the subject? | ||
| Do you project positive attitudes towards the University, life and social responsibility? | ||
| Do you always assume proactive attitudes that allow you to lead by example? | ||
| Perception | ||
| Should the teacher continue again with the development of this course? | D6 | |
Source: Untels
It should be noted that the results in the survey are obtained from the tabulation of the six dimensions, considering a Likert scale, then in Table 4, the described is shown.
Table 4: Likert Scale Indexes
| Alternative | Factor (Fi) |
| Strongly disagree | 0 |
| In disagreement | 1 |
| Neither agree nor disagree | 2 |
| Disagreement | 3 |
| Totally disagree | 4 |
Source: Untels
3. Results
Being consistent with the purpose of the research proposed in this article, then we proceed to describe the results obtained as part of the processing of the data collected:
The Table 5, shows the number of teachers grouped by their performance status.
Table 5: Number of Teachers Grouped by Their Performance Condition
| Performance Condition | |||||
| Poor | Fair | Good | Very Good | Excellent | |
| Number of Teachers | 17 | 32 | 60 | 12 | 0 |
| Percentage | 14.05% | 26.45% | 49.59% | 9.92% | 0.00% |
Source: Untels
It is important to highlight that the concern is focused on analyzing the dimension of teacher performance, in which teachers with a “Poor” condition have a lower level of qualification, so that from this result the authorities can establish policies that improve the teacher performance condition. In this sense, Table 6 shows the distribution by Professional School of the number of teachers whose qualification status is poor:
Table 6: Number of Teachers with Deficient Condition Grouped by Professional Care
| Professional Schools | ||||
| Mechanical and Electrical | Systems | Environmental | Electronics and Telecommunications | |
| Number of Teachers | 1 | 4 | 5 | 7 |
| Percentage | 5.88% | 23.53% | 29.41% | 41.18% |
Source: Untels
In relation to the distribution of teachers whose performance condition is “Poor”, the grades were determined on average in the 6 dimensions that make up the data collection instrument, by Professional School.
![]() The average result by area (PA) has been determined by applying the following formulas:
The average result by area (PA) has been determined by applying the following formulas:
Where: Xi is the number of students who marked the alternative i.
![]() The general average classification (PG) is obtained as:
The general average classification (PG) is obtained as:
Shown the method with which the average was found, in relation to the distribution of teachers classified as deficient, in the following Fig. 1, the results obtained in relation to the Average of qualifications by dimension of the deficient teachers of the School of Electric engineering and telecommunications.
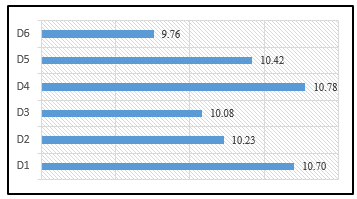 Figure 1. Average grades by size of poor teachers of the School of Electronic Engineering and Telecommunications (Source: Untels)
As seen in the previous figure, dimension D6, has the lowest grade point average, that is, the grade point average is 9.76, this is reflected in the students’ disagreement regarding the permanence of teachers, in the dictation of the course.
In Fig. 2, the graphic representation of the results obtained in relation to the Average of grades by dimension of the poor teachers of the School of Environmental Engineering is shown.
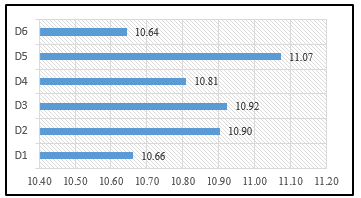 Figure. 2. Average grades by area of poor teachers of the School of Environmental Engineering (Source: Untels)
In Fig. 3, the graphic representation of the results obtained in relation to the Average of grades by dimension of the poor teachers of the School of Systems Engineering is shown.
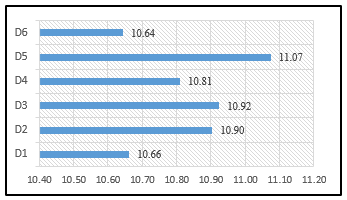 Figure. 3. Average grades by area of poor teachers of the School of Systems Engineering (Source: Untels)
As can be seen in the previous figure, dimension D6 has the lowest grade point average of 10.64; also, dimension D1 follows with a 10.66, this is reflected in the students’ disagreement in relation to teacher planning; at these points the ability and effort of the teacher intervene in the preparation and achievements of the course.
In Fig. 4, the graphic representation of the results obtained in relation to the Average of grades by dimension of the poor teachers of the School of Mechanical and Electrical Engineering is shown.
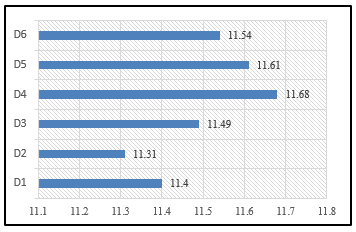 Figure. 4. Average grades by area of poor teachers of the School of Mechanical and Electrical Engineering (Source: Untels)
As can be seen in the previous figure, dimension D2, has the lowest grade point average, this is reflected in the students’ disagreement in relation to the teaching strategies of the teacher; at these points the effectiveness of the teacher intervenes so that their students acquire relevant knowledge, skills and attitudes.
From the Figures shown above you can determine the average of the dimension with the lowest qualification of teachers with “Deficient” performance, of all professional schools, these are shown in Fig. 5.
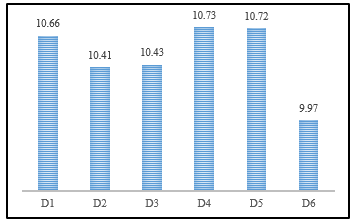 Figure. 5. Average of grades grouped by dimensions of all Professional Schools of teachers with poor performance (Source: Untels)
From the last figure above, we can determine that the lowest qualification percentage of all the races is in dimension D2. “Teaching strategies of the teacher” (10.41); at these points the effectiveness of the teacher intervenes so that their students acquire relevant knowledge, skills and attitudes.
Now if we look at the rating of the overall dimension of teacher performance, we determine that the result is quite low (9.97), compared to the specific dimensions.
Thus, in order to identify if there is a relationship or degree of association between the Specific Dimensions and the Global Dimension of teacher performance, the Pearson Correlation Index was determined, using the statistical software SPSS V25.
In Table 7, Pearson’s correlation between dimension D6 and dimension D5 is shown.
Table 7. Pearson Correlation Between D6 and D5
| Pearson correlation between D6 and D3 | |||
|
D6 Global evaluation of Teaching performance |
D3 Comunication |
||
| D6 | Correlation Pearson | 1 | ,978** |
| Sig. (bilateral) | ,000 | ||
| N | 121 | 121 | |
| D3 | Correlation Pearson | ,978** | 1 |
| Sig. (bilateral) | ,000 | ||
| N | 121 | 121 | |
| **. The correlation is significant at the 0.01 level (bilateral). | |||
Source: SPSS
As the correlation of the global evaluation of teacher performance (D6) with professional and personal traits (D5) is shown, it is 0.982, this result reflects a high positive level of significance between the dimensions.
In Table 8, Pearson’s correlation between dimension D6 and dimension D4 is shown.
Table 8. Pearson Correlation Between D6 and D4
| Pearson correlation between D6 and D4 | |||
|
D6 Global evaluation of Teaching performance |
D4 Class Administration |
||
| D6 | Correlation Pearson | 1 | ,952** |
| Sig. (bilateral) | ,000 | ||
| N | 121 | 121 | |
| D4 | Correlation Pearson | ,952** | 1 |
| Sig. (bilateral) | ,000 | ||
| N | 121 | 121 | |
| **. The correlation is significant at the 0.01 level (bilateral). | |||
Source: SPSS
As the correlation of the global evaluation of teacher performance (D6) with the administration of the teacher’s class
(D4) is shown, is 0.952, this result reflects a high positive level of significance between the dimensions.
In Table 9, Pearson’s correlation between dimension D6 and dimension D3 is shown.
Table 9. Pearson Correlation Between D6 and D3
| Pearson correlation between D6 and D5 | |||
|
D6 Global evaluation of Teaching performance |
D5 Professional and personal traits |
||
| D6 | Correlation Pearson | 1 | ,982** |
| Sig. (bilateral) | ,000 | ||
| N | 121 | 121 | |
| D5 | Correlation Pearson | ,982** | 1 |
| Sig. (bilateral) | ,000 | ||
| N | 121 | 121 | |
| **. The correlation is significant at the 0.01 level (bilateral). | |||
Source: SPSS
As the correlation of the global evaluation of teacher performance (D6) with the teacher’s communication (D3) towards the student is shown, it is 0.978, this result reflects a high positive level of significance between the dimensions.
In Table 10, Pearson’s correlation between dimension D6 and dimension D2 is shown.
Table 10. Pearson Correlation Between D6 and D2
| Pearson correlation between D6 and D2 | |||
|
D6 Global evaluation of Teaching performance |
D2 Teaching Strategies |
||
| D6 | Correlation Pearson | 1 | ,979** |
| Sig. (bilateral) | ,000 | ||
| N | 121 | 121 | |
| D2 | Correlation Pearson | ,979** | 1 |
| Sig. (bilateral) | ,000 | ||
| N | 121 | 121 | |
| **. The correlation is significant at the 0.01 level (bilateral). | |||
Source: SPSS
As the correlation of the global evaluation of teacher performance (D6) with teaching strategies of the teacher (D2) towards the student is shown, it is 0.979, this result reflects a high positive level of significance between the dimensions.
In Table 11, Pearson’s correlation between dimension D6 and dimension D1 is shown.
As the correlation of the overall evaluation of teacher performance (D6) with teacher planning (D1) towards the student is shown, it is 0.979, this result reflects a high positive level of significance between the dimensions.
It is important to specify that in all cases the correlation analysis is significant high; this allows us to establish that if there is an association between the Specific Dimensions and the Global Assessment of teaching performance.
Table 11. Pearson Correlation Between D6 and D1
| Pearson correlation between D6 and D1 | |||
|
D6 Global evaluation of Teaching performance |
D1 Planation |
||
| D6 | Correlation Pearson | 1 | ,979** |
| Sig. (bilateral) | ,000 | ||
| N | 121 | 121 | |
| D1 | Correlation Pearson | ,979** | 1 |
| Sig. (bilateral) | ,000 | ||
| N | 121 | 121 | |
| **. The correlation is significant at the 0.01 level (bilateral). | |||
Source: SPSS
Also, in order to determine the validity of the data collection instrument, the results of the Cronbach’s alpha test are shown below:
Table 12. Reliability Statistics
| Reliability Statistics | |
| Cronbach Alfa | Numero of elements |
| ,995 | 44560 |
Source: SPSS
The value obtained for Cronbach’s alpha is 0.995 which gives evidence of the reliability of the data collection instrument is reliable; The number of elements represents the number of students surveyed (2228) and the number of questions answered (20).
4. Discussion
In relation to the results obtained and the objectives set forth, the following discussions are required:
In relation to objective 1: Identify the number of teachers by Professional Engineering School that have poor classification
Regarding the percentage of teaching performance by Professional School of Engineering, which is deficient in 14.05%, it can be said that this result is consistent with that carried out in the article entitled, The evaluation of teaching performance in higher education, which states that 44.2% of students evaluate teacher performance as regular or deficient, so they recommend permanent training to improve their professional development and performance and thus improve the quality of learning management offered to students. [12]
In relation to objective 2: Determine the dimensions in which the lowest level of teacher qualifications is presented
Regarding the Specific Dimension that presents the lowest level of qualification, which is, Teaching Strategies, with a grade point average of 10.41; which is related to the effectiveness of the teacher so that their students acquire relevant knowledge, skills and attitudes; It can be said that these results are consistent with the study carried out in the Educational Institution No. 3089 “Los Angeles” – Ventanilla, where they conclude that methodological strategies influence 37.1% in the planning of teaching work in Educational Institution No. 3089 “Los Angeles” – Window. Lima 2017, the generating satisfaction in students. [13]
5. Conclusions
It is concluded that the number of teachers was determined per Professional School of Engineering, whose teaching performance is poor, which turned out to be 17, which represents 14.05% of the total number of teachers, distributed per school in one of Electrical Mechanical Engineering, 4 of Systems Engineering, 5 of Environmental Engineering and 7 of Electronic and Telecommunications Engineering.
It is concluded that the Specific Dimension that has the lowest level of qualification was determined to be Dimension 2 (D2): Teacher’s teaching strategies, with a grade point average of 10.41. It should be noted that comparing with the other dimensions corresponding to the Specific Dimensions, the difference between one and the other does not turn out to be much, which allows to conclude that as long as some type of training is intended, it should be given at the level of all indicators contained this dimension
It is concluded that there is a significantly high and positive correlation between each of the dimensions that are part of the Specific Dimensions, with the Global Dimension of Teaching performance.
6. Recommendations
It is recommended to develop pedagogical training plans, in order to improve the teaching methodology.
It is recommended to implement a mechanism for supervision and control of teachers in the classroom, since, currently, the university does not have a marking system for the beginning and end of class; It is also recommended to implement mechanisms for the supervision and control of school directors, since teachers currently do not carry out class plans, which should be consigned to a teaching portfolio.
It is recommended to implement tools related to the use of Information and Communication Technologies (ICT); it is also recommended to conduct training for the student and the teacher; in order to improve planning, academic management and research and dissemination of knowledge.
- Jaik Dipp, A., Villanueva Gutiérrez, R., García Salas, M. E., & Tena Flores, J. A. (2017). Assessment of teacher performance and presence of Burnout in teachers of higher education. Electronic Journal Educational Dialogues, 11 (21), 71-87
- Albarrán, D. & Alarcon, L. (2017). Evaluation of teaching performance in UAGro High School 1. Iberoamerican Magazine for research and educational development.
- León, L., Noriega, E. & Murillo, M. (2018). Impact of the organizational climate on the teacher’s work performance. Fides et Ratio – Journal of Cultural and Scientific Dissemination of La Salle University in Bolivia, 16 (16), 15-32.
- Guzman, F. (2018). The Teaching Evaluation Experience in Mexico: Critical Analysis of the Taxation of the Professional Teaching Service. Iberoamerican Journal of Educational Evaluation, 2018, 11 (1), 135-158
- Cabero, J., Llorente, M., Morales, J. (2018). Evaluation of teaching performance in virtual training: ideas for the configuration of a model. Iberoamerican Journal of Distance Education, 21 (1), pp. 261-279.
- Yánez, S., Hernandez, H., Cheza, L., Valdiviezo, W., Méndez, J., Rivera, M., Vargas, C., (2018). Teaching performance in the training of the accompaniment to the complex exam. Scientific magazine domain of science. Vol. 4, no. 1, pp. 102-114
- Gálvez, E., & Milla, R. (2018). Assessment of teacher performance: Preparation for student learning in the Framework of Good Teacher Performance. Purposes and Representations, 6 (2), 407-429.
- Obreque, A., Hernández, C., Peña, S., Agredo, M., & Salvatierra, M. (2019). Evaluation of teacher performance in Chile: perception of poorly assessed teachers. Cadernos de Pesquisa, 49 (172), 144-163
- MINEDU. (September 25, 2018). MINEDU Retrieved from https://www.gob.pe/institucion/minedu/normas-legales/118310-016-2015-minedu
- Valenzuela, J. (2018). Fundamentals of educational research. Volume 2 and 3. Mexico: Monterrey Digital Technology Publishing
- Sur, U. N. (s.f.). National Technological University of South Lima. Obtained from http://www.untels.edu.pe/
- Pacheco, M., Ibarra, I., Iñiguez, M., García, H. & Sanchéz, C. (2018). The evaluation of teaching performance in higher education. University digital magazine.
- Vidal, O. (2018). Management Leadership Management and Teaching Performance in the Educational Institution No. 3089 “Los Angeles” – Ventanilla. Journal of scientific research igobernanza.