A Critical Analysis of Usability and Learning Methods on an Augmented Reality Application for Zoology Education
A Critical Analysis of Usability and Learning Methods on an Augmented Reality Application for Zoology Education
Volume 5, Issue 2, Page No 384-392, 2020
Author’s Name: Diego Iquira-Becerraa), Michael Flores-Conislla, Juan Deyby Carlos-Chullo, Briseida Sotelo-Castro, Claudia Payalich-Quispe, Carlo Corrales-Delgado
View Affiliations
Universidad Nacional de San Agustn de Arequipa, Peru
a)Author to whom correspondence should be addressed. E-mail: diquira@unsa.edu.pe
Adv. Sci. Technol. Eng. Syst. J. 5(2), 384-392 (2020); ![]() DOI: 10.25046/aj050250
DOI: 10.25046/aj050250
Keywords: Augmented reality, Education, Zoology, Usability

Export Citations
In recent years, research has been conducted focused on the use of technologies in the classroom, but one of the main problems is to demonstrate that the use of this technology favors learning compared to traditional methods. One of these technologies is augmented reality that allows seeing virtual objects superimposed in the real world, but to achieve its correct use it is necessary to evaluate the usability that is the ease with which an interface is used. In this work we develop and analyze from two perspectives an educational application for zoology that uses augmented reality, a first perspective is usability, where an analysis has been carried out on how the correct design of an augmented reality application should be focusing on heuristic evaluations, the second perspective is at the educational level where we analyze it at the classroom level where we measure the different learning methods (Traditional Learning, Self Learning, and Guided Learning) and which one should be used.
Received: 16 January 2020, Accepted: 11 March 2020, Published Online: 04 April 2020
1. Introduction
This paper is an extension of work originally presented in XIII Latin American Conference on Learning Technologies(LACLO) [1]. The emergence of new technologies creates a need to adopt new strategies in the classroom, which complement the learning process to improve the way of teaching.
This research focuses on conducting a case study from the perspective of usability and learning methods of an application of augmented educational reality for the teaching of zoology. Usability is understood as the degree to which users interact with an application that must be effective, efficient and easy to learn [2].
The learning methods have been based on game-based learning where three different methodologies were used (Traditional, Self and Guided) [3].
In the design of the application, we have taken as a basis the traditional method of teaching zoology where cards with descriptions of animals are used, which have been transformed into markers, these markers are recognized by a mobile device that generates a model of the animal and its habitat in 3D. Finally, the case study was carried out in an educational institution where students were divided into groups to which an evaluation was made before and after using the application.
1.1 Augmented Reality
Augmented reality (AR) is a variation of virtual environments (VE) or virtual reality (VR). The Figure 1 shows a vision of the continuity between virtuality and reality defined by Milgram in 1995 [4], where VE technologies completely immerse the user in a synthetic environment (right of the Figure 1), not being aware of the real world that surrounds it. In contrast, AR allows the user to see virtual objects superimposed in the real world. Therefore, AR complements reality instead of completely replacing it [5].
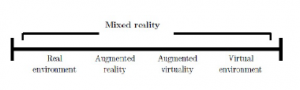
Figure 1: Milgrams reality-virtuality continuum [6]
Azuma defines AR as a technology that meets three characteristics [7]:
- Combines real and virtual.
- Interactive in real time.
- Registered in 3-D.
1.2 Usability
Usability is an attribute that evaluates the ease with which a user interface is used; It can also refer to methods to improve ease of use during the design process [2].
The 5 main components of usability are defined by the following questions:
- Learning: How easy is it for users to perform basic tasks the first time they encounter the design?
- Efficiency: Once users have learned the design, how quickly can they perform tasks?
- Easy to remember: When users return to the design after a period of not using it, how easily can they restore their competition?
- Errors: How many errors do users make, how serious are these errors and how easy can they recover from errors?
- Satisfaction: How nice is it to use the design?
. An important point is utility, which refers to the functionality of the design: Does it do what users need? [2].
ISO 9241 is a standard focused on quality, providing requirements and recommendations relating to the attributes of the hardware, software, and environment that contribute to the usability and ergonomic principles that guide them [8].
Specifically, ISO 9241-11 tells us that the objective of the design and evaluation of systems, products, and services for usability is to allow users to reach goals effectively, efficiently and with satisfaction, taking into account the context of use. Thus, it defines usability as ”The extent to which a system, product or service can be used by specific users to achieve specific objectives with effectiveness, efficiency, and satisfaction in a specific context of use” [8] [9].
Usually, to measure usability according to ISO 9241-11, it is done by user tests, the advantage of these is that resources can be quite modest. The number of users varies, but a small sample of 5 to 8 users can identify 80-85% of usability problems in a controlled environment.
The goal of usability evaluation is to see the degree to which a system is easy and pleasant to use, to determine the scope of its usability, using robust, reliable and objective metrics [10]. The evaluation of traditional systems is based on predefined usability methods. These can be classified as Inspection methods, test methods and user reports [10]- [12].
1.3 Learning Methods
1.3.1 Traditional Learning
In the traditional teaching method participants are required to attend the classes in the fix hour and place regularly and receive training face to face, mainly in the form of verbal and textual ones. What is more remarkable is that this method of teaching is provided in the same way for all learners [13].
Therefore, this method generates space-time limitations since it is only performed at predetermined times and is limited to only being carried out in classrooms [14].
1.3.2 Self Learning
According to Acosta, self learning is a form of active learning in which students, guided by a facilitator, autonomously increase their skills in a specific area [15].
Operational units of students or autonomous work teams are established, which choose a situation or reality to investigate by team, then establish their baseline of competencies, then choose their learning objectives, finally design a simulation scenario, experience it and reflect. Likewise, self-learning can be understood as the process in which the student is involved in the construction of their learning, thus promoting autonomous work [16].
1.3.3 Guided Learning
Guided learning lies midway between direct instruction and free learning, presenting a learning goal, and scaffolding the environment while allowing students to maintain a large degree of control over their learning [17].
Guided learning approaches are effective because they create learning situations that encourage students to become active and engaged partners in the learning process [17].
1.4 Zoology Education
Children from birth have a scientific interest in exploring and knowing the objects and beings of their environment, for this reason, the teaching of science and technology encourages their curiosity, discovery and the pleasure to learn, as well as providing sensitivity and respect for the environment and living things, specifically in the area of zoology which focuses on animal studies.
In the first years of age, children develop their ability to understand nature in their environment, where the student questions, reflects and thinks about the beings that inhabit it, for this reason, the Ministry of Education of Peru (MINEDU) proposes the use of learning paths to guide the correct teaching of students [18].
So that the student can progress in the learning pathways of the zoology area, it is expected that they will be able to explain the beings of nature-based on evidence from various sources of information and that they will be able to describe in their own words the characteristics or qualities of living beings in their environment based on previous knowledge.
According to MINEDU, the learning paths for zoology teaching are the competences, capacities, and indicators which focus on [18]:
- Competence: It is intended that the student explain the physical world based on their scientific knowledge and that their scientists understand and apply knowledge, arguing them scientifically.
- Capacity: The student must be able to recognize animals according to their characteristics and must be able to relate an animal according to its environment.
- Indicators: The student must describe the characteristics of the animals, must mention their similarities between their descendants and parent and must relate them according to their environment.
Once the learning path is completed; students will be able to: learn the characteristics and needs of living beings, understand that living beings are born from another living being, grow and develop, similarities between parents and descendants and the names of Animals and the place they inhabit.
Another central point in the learning paths is the map of progress that are instruments that allow identifying the progress of the students, to have greater clarity regarding the expectations that are expected of them regarding each established competence [18].
At a more specific level, the progress maps contain a clear and agreed definition of the learning goals that must be achieved by all students at the end of a learning cycle, in this way we can determine that the progress maps provide us with all the information necessary of the students according to each competition [19].
Finally, the materials used in the classes are [18]:
- Metal board and magnetized animal parts.
- Cards with descriptions of the animals.
- Paper, markers and duct tape.
- Science and Environment Book provided by MINEDU.
2. Related Works
In recent years, interest in the use of augmented reality for teaching in children has increased. Different previous investigations have built applications through programs such as Unity (Multi-platform video game engine) used in conjunction with augmented reality libraries such as Vuforia. A study [20] shows a mobile application of augmented reality to reinforce student learning and experience, among the activities of the application was the 3D visualization of the Earth by focusing the view on the encyclopedia and being able to visualize an animal model in 3D using as markers bills from different countries. All this allowed increasing the curiosity of the student by stimulating his memory since he related the virtual 3D models with the physical elements.
In another study, they developed educational software in Unity for teaching physics where a methodology for the evaluation of didactic usability was proposed [21].
Another study [22] is about how to create educational software using augmented reality combined with Bloom’s Taxonomy, whose main purpose was to stimulate spatial reasoning by improving the children’s learning process. In another investigation [23], an application has been created which takes a specific image of an anatomy atlas and converts it into a three-dimensional and dynamic model , which allows improving the interactivity of the student in the learning process, in that system they are stored in a database the different scanned photos of the anatomy atlas and then are consulted by the application, they made the three-dimensional models in Unity3D and Maya, one of the most important points of that research is that it encourages students’ self-learning.
Teaching an alphabet can be complicated at times, but augmented reality also works for these cases, as in this study [24], where an attractive and interesting learning process of the Hijaiyah alphabet is developed through a mobile application using augmented reality technology. The purpose of this application is to encourage children’s interest in learning the Hijaiyah alphabet. This application uses smartphones and markers. It was built using Unity and the Vuforia library, as well as Blender for modeling 3D objects. To use the application, the smartphone camera tracks the marker and once it is identified, the marker will have projected the objects of the Hijaiyah alphabet in three-dimensional form. Finally, the user can learn and understand the form and pronunciation of the Hijaiyah alphabet by touching the virtual button on the marker.
Augmented reality can also be used in the area of chemistry as in the application called PeriodikAR [25], which is an application developed for the Android platform through the use of the Vuforia library. The tracking technique used is without a marker. This application runs dynamically to provide certain information about the elements in an animated video. The information includes the name of each element, atomic number, boiling point, melting point, density, atomic mass, standard atomic weight, oxidation state, symbol, phase, element category, electron configuration, and electron orbital display. In this case, the dynamic term means that all the markers and animated videos of the application can be added or subtracted without modifying the source code of the application. It is because all the markers and the storage of animated videos are placed in a different place from the application storage. This application aims to increase interest in studying chemical elements. Finally, another work [26] focuses on an Android application that teaches playing musical instruments. This application was made using technologies such as augmented reality Vuforia, 3D modeling with Blender and Unity 3D.
3. Zoology Augmented Reality Application
3.1 Application Overview
The application was developed for mobile devices that have a camera, which recognizes the markers found on the cards; the markers contain images of the animals in their environment. The target audience is kindergarten students, who can interact with the virtual animals that appear in their habitat.
The objective of the application is to provide new technological tools to the classroom, specifically the cards with virtual reality markers, which will allow students to interact and recognize the animals according to their characteristics and their environment. Additionally, activities in the application focused on self-learning were added, where the student recognizes the animals based on their shadow, these activities contain a system of scores and notifications; in order to generate continuous feedback between the student and the application.
3.2 Hardware and Software
For the development of the application, we have used Android mobile devices version 7.0 or higher, which had a gyroscope. Also, a computer with the following features was used: Intel Core I7 processor, 8 GB of RAM, 1 TB of storage memory and an Nvidia GeForce GTX 980M graphics card.
The programs that were used were: Unity 3D and Vuforia for the main development of the application, Inkscape for graphic design and Audacity for audio editing.
3.3 Activities
The application will teach about the animals of the following groups: mammals, birds, reptiles, fish and amphibians as shown in Figure 2, the application will have five levels that represent the learning sessions of each day: Monday, Tuesday, Wednesday, Thursday and Friday, as seen in Figure 3, we will describe the activities of each level below:
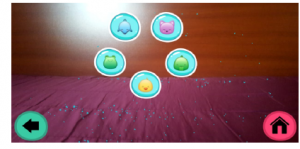
Figure 2: Groups of animals: mammals, birds, reptiles, fish and amphibians (Source: Own Elaboration)
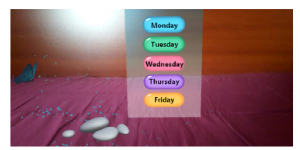
Figure 3: Application levels: Monday, Tuesday, Wednesday, Thursday and Friday(Source: Own Elaboration)
3.3.1 Monday
It is the first level of the lessons, in which students learn the names and descriptions of each of the animals. They can also observe the models of each of the animals.
3.3.2 Tuesday
In this level, the animations of each animal are presented, which are interactive through the use of touch.
3.3.3 Wednesday
At this level, 3d animal models are presented in a 3d environment that represents their habitat as seen in Figure 4.
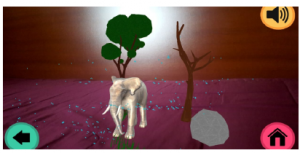
Figure 4: 3d animal models in their habitat (Source: Own Elaboration)
3.3.4 Thursday
This level shows the 3d animal models that were seen in the previous levels but on a real scale, as seen in Figure 5.
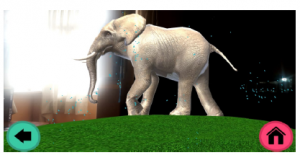
Figure 5: Real-size animal 3d model with animations (Source: Own Elaboration)
3.3.5 Friday
Final level, the student link the animals to their habitat, which are selected randomly. The student must drag the animal with its corresponding habitat, see Figure 6.
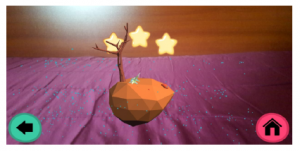
Figure 6: Activity to relate animals with their habitats (Source: Own Elaboration)
4. Methodology
4.1 Usability Evaluation
To perform the evaluation, we made use of user tests that contain a combination of task completion rates, errors, task times and task level satisfaction. Two ways of testing were considered:
- Formative: Provides immediate feedback to improve learning
- Summative: Evaluate what has been learned.
The experiences to evaluate and improve user interaction with the application was formative, and the problems were quantified in terms of frequency and severity, we monitored the users who had problems, we measured the time it took to complete a task and we determined whether they completed the tasks correctly. The method used to evaluate the results is described below.
- Task Time: The time a user spends in an activity, specifically:
- Completion task time: Time for users to complete the task correctly.
- Failure task time : Time for users to complete the task incorrectly.
- Total task time: Total duration of time users spend on a task.
- Errors: The capture of touch events in the activities of the application, considering actions such as:
- ACTION DOWN: This event is manifested when the screen is pressed and we don’t move the pointer anywhere.
- ACTION MOVE: This event is manifested when after pressing the screen we proceed to move the pointer, in other words, when we do these 2 events will appear, the ACTION DOWN and then when moving the pointer the ACTION MOVE event will appear.
- ACTION UP: This event is manifested when we lift the finger or pointer of the screen, for this event to occur, the ACTION DOWN event must have occurred before.
- ACTION OUTSIDE: This event is manifested when the event occurs outside the normal limits of an user interface element.
- Effectiveness: Measured by the rate of completed tasks and the rate of errors in tasks, the following will be analyzed: Completed tasks, Objectives achieved, Errors in a task, Tasks with errors and Intensity of task error.
- Efficiency: It is measured by the time it takes to complete a task, it will be analyzed: Task time, Time efficiency, Profitability, Production time ratio, and Unnecessary actions.
- Satisfaction: The perception of the ease of use of a system is measured, if they can be completed immediately after a task
(post-task questionnaires), at the end of a usability session
(post-test questionnaires), or outside of A usability test is analyzed.
4.2 Evaluation Learning Methods
4.2.1 Participants
A total of 45 5-year-old children participated in the study, they were kindergarten students of a national school; There were a greater number of men (62.2 %) than women, the students belonged to two classrooms.
4.2.2 Method
The students were divided into three groups chosen at random, they were given the first test to measure their knowledge about zoology, this test focused on presenting a group of thirteen animal cards, of which the students had to recognize the name and habitat of different animals.
Subsequently, each group was assigned a different teaching method, a first group used the traditional learning where the teacher used cards with descriptions of the animals to teach them about zoology, the second group were given mobile devices and a set of markers that contained figures of animals with which students should self-learning about animals, finally, the third group used mobile devices and markers but their learning was led by a teacher who guided and explained about the different animals.
After the end of the learning session, a second evaluation was carried out on the students in which the acquired knowledge was measured.
5. Results
5.1 Usability Results
To evaluate the results, three aspects of usability were considered: Effectiveness, efficiency, and satisfaction. We capture the events of user interaction with the application in Friday activity.
The measurement by task completion rate and task error rate are shown in Figure 7.
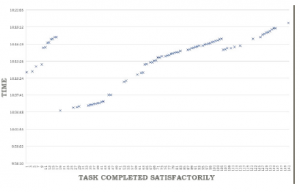
Figure 7: Tasks completed satisfactorily (Source: Own Elaboration)
To analyze the results, the tasks completed in the sample of 141 tasks were observed as a collection of points in time, the position of each point on the vertical axis (y) is the time at which the value was collected. Tasks that do not have a point associated were not completed successfully.
To recognize effectiveness as a characteristic of the usability evaluation of the application, the total percentage of tasks completed with or without cognitive errors related to animals was considered. Figure 8 shows that 91% represents the total of complete tasks with or without cognitive errors, while 9% represents tasks that did not reach the objective. Comparing the result with the percentage of tasks completed, 31% represents tasks completed with cognitive errors.
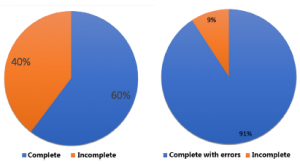
Figure 8: Percentage of completed tasks and complete tasks with errors (Source: Own Elaboration)
To recognize the efficiency, we considered the task time in the accomplishment of the task and an average time of 5 seconds was considered. Of the sample size of 141 tasks, only the time of 128 tasks that were completed was considered. In Figure 9, the time of accomplishment of each task is observed; The average time ranges from 0 seconds to 5 seconds, considering the highest peak with 23 seconds and the lowest peak 0 seconds.
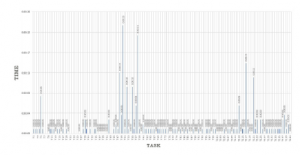
Figure 9: Task Time (Source: Own Elaboration)
In Figure 10, it is observed that the tasks completed within the average time of 5 seconds represent 91%, being a total of 116 tasks. While the remaining 9% represents a total of 12 tasks that obtained a task completion time greater than 5 seconds. According to the evaluation of this characteristic of Usability, the high percentage of tasks completed within the average time assigned is observed, therefore, it can be affirmed that the application in Friday activity complies with this aspect of usability by 91%.
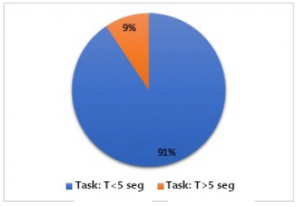
Figure 10: Percentage of the execution time of a task (Source: Own Elaboration)
To know satisfaction, we measured with the SUS (System Usability Scale) questionnaire, an instrument of Likert scale of 10 items. The evaluation was carried out immediately after the interaction, which allowed the evaluators to record their initial feelings and responses with greater certainty.
According to the results presented in Figure 11, the SUS score obtained is 69. Since the theoretical maximum is 100, we can deduce good but not excellent usability of the system.
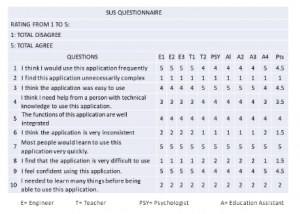
Figure 11: SUS questions of the application (Source: Own Elaboration)
5.2 Results Learning Methods
To analyze the results obtained from the pre-test and the post-test we decided to apply the regression and correlation of data, which were applied to both the names of the animals and the habitat of the animals of the following thirteen animals: cow, shark, frog, penguin, polar bear, lion, giraffe, gorilla, seal, elephant, crocodile, sea horse, and owl.
In the Figure 12, the data was processed with the STATA
(Software for Statistics and Data Science) tool where a regression equation was used that explains the students’ learning about the names of the animals which turned out to be in inverse function of the self-learning method, that is that by applying the method of self-learning, the learning of animal names is reduced but there is a direct relationship between guided learning and traditional learning.
A regression equation was used for the analysis of animal name learning, this equation is a function of self-learning plus guided learning towards traditional learning.
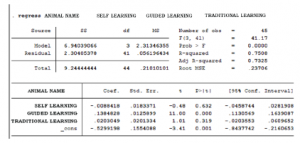
Figure 12: Regression of animal name learning between different learning methods(Source: Own Elaboration)
LEARNING ANIMAL NAME(∧=)
− 0.0088418 Self learning
+ 0.1384828 Guided learning
+ 0.203049 Traditionallearning + u
The negative self-learning coefficient indicates that it has an inverse relationship with the learning of animal names, that is, when the learning of animals is achieved, self-learning has little influence. On the other hand, guided learning and traditional learning have a positive sign in their coefficients, which indicates that they influence the learning process.
For this reason the model is significant in its entirety, since its p-value of F is 0.0000 which is lower than the significance level of 5%.
The independent variables (Self learning; Guided learning; Traditional learning) explain the variable learning of animal names by 75.08%.
With which we determine the following:
- The self learning variable is not significant for the model since the p-value of its coefficient is 0.632 which is less than 5%.
- The guided learning variable is significant for the model since the p-value of its coefficient is 0.000 which is less than 5%.
- The traditional learning variable is not significant for the model since the p-value of its coefficient is 0.319 which is greater than 5%
In the same way, we perform another analysis with the data corresponding to the names of the animals where it is stated that the variable that has the greatest correlation with the learning of the name of the animals as seen in the Figure 13 is the guided learning with 86.21 % and the variable that has a negative correlation of -5.99% is the traditional learning.
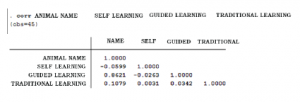
Figure 13: Correlation of animal name learning between different learning methods (Source: Own Elaboration)
On the other hand, we perform another regression equation was used for the analysis of animal habitat learning, this equation is a function of self-learning plus guided learning towards traditional learning. 14.
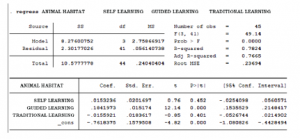
Figure 14: Regression of animal habitat learning between different learning methods(Source: Own Elaboration)
LEARNING ANIMAL HABITAT(∧=)
0.0153236 Self learning
+ 0.1841973 Guided learning
− 0.0155931 Traditionallearning + u
(1)
The negative traditional learning coefficient indicates that it has an inverse relationship with the learning of animal habitat, that is, when the learning of animals habitat is achieved, traditional learning has little influence. On the other hand, guided learning and self learning have a positive sign in their coefficients, which indicates that they influence the learning process.
The model is significant in its entirety since its p-value of F is 0.0000 which is below the significance level of 5%. The independent variables (Self learning; Guided learning; Traditional learning) explain the variable learning of the location of the animals by 78.24%.
With which we determine the following:
- The self learning variable is not significant for the model since the p-value of its coefficient is 0.452 which is less than 5%.
- The guided learning variable is significant for the model since the p-value of its coefficient is 0.000 which is less than 5%.
- The traditional learning variable is not significant for the model since the p-value of its coefficient is 0.401 which is greater than 5%
Additionally, we perform another analysis with the data corresponding to the habitat of the animals as seen in Figure 15, where it is stated that the variable that has the greatest correlation with the learning of the location of the animals is the guided learning with an 88,07% and the variables that have a negative correlation of -1.62% and -0.74% are those of self and traditional learning respectively.
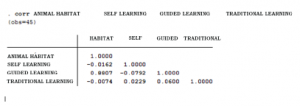
Figure 15: Correlation of animal habitat learning between different learning methods (Source: Own Elaboration)
Finally, we made a comparison between the pre-test and post-test of the different learning methods as seen in Figure 16, in which the guided learning was the one that obtained the highest percentage of improvement, they get to improve the understanding of animals and the habitat in 48.6% followed by self learning with a 30.5% improvement and finally traditional learning that obtained only 21%.
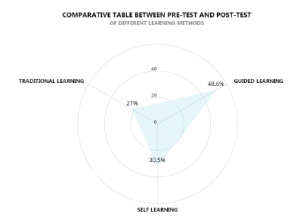
Figure 16: Comparative table between pre-test and post-test of different learning methods (Source: Own Elaboration)
6. Conclusions and Future Works
6.1 Conclusions
According to the usability characteristics established by ISO 9241-11 presented in this research, it provides a practical way to evaluate the usability of AR applications. Thus, the proposal is expected to become part of the AR application development process, which will allow users to perform tasks that achieve the objectives of effectiveness, efficiency, and satisfaction.
During the evaluation carried out in the development of the applications, several design problems were found including the use of AR techniques in the application. When the end-users of the application are children, it is advisable not to use markers for the recognition of 3D elements, it was difficult to keep their attention on pointing to the marker and at the same time seeing the recognition image. Due to these first tests, the application uses navigation and selection techniques. Therefore, it is concluded that to choose the interaction techniques depends on the requirements of the application. The same set of techniques will not work well in all situations.
An important observation was that children seemed to understand how to use the augmented reality application as soon as they began to interact with technology.
In the process of development and evaluation of the application, it is essential to involve teachers in the development of activities directly related to the needs of students, especially if the application is aimed at children 5 years old; since it allows researchers to have a better overview and better understand the problems that could occur.
We can conclude that the applications of AR that follow the principles of usability help in the motivation and learning of children.
When analyzing the results obtained in the tests we determine that for the recognition of animal names a guided learning method turns out to be better than a self-learning.
Which was because the application failed to explain the name correctly, since it was not repeated and when it was heard at the same time that the sound generated by the animal caused a distraction in the students and did not take the corresponding attention unlike of guided learning, where the teacher indicated the animal they should look for and explained information about the animal that is complemented by the visualization of the 3D model.
As for the habitat, the guided learning method turned out to be the best, because with traditional learning the student could not identify visually the environment where the animal lived, since the habitat was described orally, on the other hand in the car if the student could recognize the environment, but since there were no dialogues that would indicate information about the environment, the student had to rely on his previous knowledge to identify the correct name of the environment, finally when comparing the post-test and the pre-test we identified that the guided learning method obtained a higher score reaching 48.3% of positive responses.
With which we have been able to conclude that the use of augmented reality does show improvements in traditional education, but the best method to carry out education through this technology is that the teacher guides the student on what to do and can maintain at all times the control of the actions that each student will take.
6.2 Futures Work
Articles focused on the use of augmented reality in the classroom will continue, while many will focus on short-term research, it is also necessary to consider long-term research and the use of other technologies, so we suggest the following topics that could be investigated:
- Add specific ergonomic tests regarding the user experience. It is also recommended to consider ergonomics usability issues in terms of interaction with mobile devices.
- Perform more extensive tests using the evaluation proposal presented to evaluate new virtual contents and the use of other types of 3D interactivity techniques or sensors.
- Perform new educational activities that focus on Machine Learning to improve the free education process and serve as a complement to targeted education.
- Find new technologies of augmented reality that not only focus on markers such as ARCore for the creation of new educational activities focused on the topic of zoology.
- The creation of other augmented reality applications that explain natural phenomena that occur in the student environment is proposed.
Acknowledgment
Thanks to the Universidad Nacional de San Agustn de Arequipa for support in the research.
- D. A. I. Becerra, B. D. S. Castro, M. M. F. Conislla, and C. Corrales-Delgado, “Augmented reality applied in the design of learning activities in zoology,” in 2018 XIII Latin American Conference on Learning Technologies (LACLO). IEEE, 2018, pp. 121–126.
- J. Nielsen, “The usability engineering life cycle,” Computer, vol. 25, no. 3, pp. 12–22, 1992.
- E. Danniels and A. Pyle, “Definir el aprendizaje basado en el juego,”Aprendizaje basado en el juego. Actualizado en febrero de, 2018.
- P. Milgram, H. Takemura, A. Utsumi, and F. Kishino, “Augmented reality: A class of displays on the reality-virtuality continuum,” in Telemanipulator and telepresence technologies, vol. 2351. International Society for Optics and Photonics, 1995, pp. 282–292.
- S. E. Schaeffer, “Usability evaluation for augmented reality,” 2014.
- P. Milgram and F. Kishino, “A taxonomy of mixed reality visual displays,” IEICE TRANSACTIONS on Information and Systems, vol. 77, no. 12, pp. 1321–1329, 1994.
- R. T. Azuma, “A survey of augmented reality,” Presence: Teleoperators & Virtual Environments, vol. 6, no. 4, pp. 355–385, 1997.
- M. Kurosu, “Nigel bevan and concepts of usability, ux, and satisfaction,” Journal of Usability Studies, vol. 14, no. 3, 2019.
- M. Georgsson, N. Staggers, E. Årsand, and A. Kushniruk, “Employing a user-centered cognitive walkthrough to evaluate a mhealth diabetes self-management application: A case study and beginning method validation,” Journal of biomedical informatics, vol. 91, p. 103110, 2019.
- G. Cockton, “Usability evaluation,” 2012.
- H. Mart´inez and P. Bandyopadhyay, “Analysis of four usability evaluation methods applied to augmented reality applications,” Helsinki, Finland: Helsinki Institute for Information Technology (HIIT), 2014.
- O. Sharhorodska and D. Iquira, “Interaction of low cost mobile virtual reality environments–using metaphor in an astronomy laboratory,” in International Conference on Human-Computer Interaction. Springer, 2019, pp. 293–300.
- M. Gharibpoor, S. Sargazi, and M. Aref, “Efficiency evaluation of e-learning compared to traditional education in human resource development (case study: Small and medium enterprises in shiraz),” in 7th International Conference on e-Commerce in Developing Countries: with focus on e-Security. IEEE, 2013, pp. 1–8.
- J. E. Thiele, “Learning patterns of online students,” Journal of Nursing Education, vol. 42, no. 8, pp. 364–366, 2003.
- C. L. Costa, A. M. Nicola´s, J. A. G. Me´ndez, M. d. G. A. Mart´inez, and J. L. D. Agea, “Ensen˜ando con metodolog´ia de autoaprendizaje en entornos simulados (maes c ). un estudio cualitativo entre profesores y alumnos de grado en enfermer´ia,” Educacio´n Me´dica, vol. 20, pp. 52–58, 2019.
- C. J. Z. Rodr´iguez, P. Garc´ia-Mart´inez, C. Ferreira, I. Ferna´ndez, and J. J. Miret, “Sistemas interactivos eficientes para la tutorizacio´n y el autoaprendizaje de o´ptica basados en la resolucio´n gra´fica de problemas,” Optica pura y aplicada, vol. 46, no. 2, pp. 197–203, 2013.
- D. S. Weisberg, K. Hirsh-Pasek, and R. M. Golinkoff, “Guided play: Where curricular goals meet a playful pedagogy,” Mind, Brain, and Education, vol. 7, no. 2, pp. 104–112, 2013.
- MINEDU. (2016) Programa curricular educacin inicial. [Online]. Available: http://www.minedu.gob.pe/curriculo/pdf/ programa-curricular-educacion-inicial.pdf
- M. J. Ramos Haro, G. Garc´ia Figueroa, E. Y. Quinteros Hijar, M. J. Nin˜o Correa,M. Ventura Panduro, W. Palomino Noa, J. M. Camavilca Vega, J. A. Pezo de la Cuba, L. Velasco Taipe, C. Yupa´n Ca´rdenas et al., “Rutas del aprendizaje¿ que´ y co´mo aprenden nuestros nin˜os y nin˜as?: Ii ciclo. a´rea curricular ciencia y ambiente, 3, 4 y 5 an˜os de edad. versio´n 2015,” 2015.
- “An educational augmented reality app to facilitate learning experience.” 2017 International Conference on Computer and Applications (ICCA), Computer and Applications (ICCA), 2017 International Conference on, p. 279, 2017.
- D. Alonso Iquira Becerra, J. Herrera Quispe, R. Guillermo Apaza Aceituno,G. Mary Poma Vargas, F. Gabriela Fernandez Zamora, J. Luis Huillca Mango,
G. Paulina Anccasi Figueroa, A. Alexis Perez Vizcarra, and J. Willian Torres Chana, “Evaluation of a gamified 3d virtual reality system to enhance the understanding of movement in physics,” 01 2017, pp. 395–401. - “Playful and interactive environment-based augmented reality to stimulate learning of children.” 2016 18th Mediterranean Electrotechnical Conference (MELECON), Electrotechnical Conference (MELECON), 2016 18th Mediterranean, p. 1, 2016.
- J. A. Juanes, D. Herna´ndez, P. Ruisoto, E. Garc´?a, G. Villarrubia, and
A. Prats, “Augmented reality techniques, using mobile devices, for learning human anatomy,” in Proceedings of the Second International Conference on Technological Ecosystems for Enhancing Multiculturality, ser. TEEM ’14. New York, NY, USA: ACM, 2014, pp. 7–11. - R. F. Rahmat, F. Akbar, M. F. Syahputra, M. A. Budiman, and A. Hizriadi, “An interactive augmented reality implementation of hijaiyah alphabet for children education,” in Journal of Physics: Conference Series, vol. 978, 2018.
- A. A. K. Oka Sudana, A. Setiawan, and I. P. A. E. Pratama, “Augmented reality for chemical elements: Periodikar,” Journal of Theoretical and Applied Information Technology, vol. 90, no. 1, pp. 88–92, 2016, cited By :2.
- M. K. Zhaparov and U. Assanov, “Augmented reality based on kazakh instrument ”dombyra”,” in 8th IEEE International Conference on Application of Information and Communication Technologies, AICT 2014 – Conference Proceedings, 2014.