
A Multi-Cohort Study of ApoE ɛ4 and Amyloid-β Effects on the Hippocampus in Alzheimer’s Disease
Abstract
The apolipoprotein E (APOE) gene has been consistently shown to modulate the risk of Alzheimer’s disease (AD). Here, using an AD and normal aging dataset primarily consisting of three AD multi-center studies (n = 1,781), we compared the effect of APOE and amyloid-β (Aβ) on baseline hippocampal volumes in AD patients, mild cognitive impairment (MCI) subjects, and healthy controls. A large sample of healthy adolescents (n = 1,387) was also used to compare hippocampal volumes between APOE groups. Subjects had undergone a magnetic resonance imaging (MRI) scan and APOE genotyping. Hippocampal volumes were processed using FreeSurfer. In the AD and normal aging dataset, hippocampal comparisons were performed in each APOE group and in ɛ4 carriers with positron emission tomography (PET) Aβ who were dichotomized (Aβ+/Aβ–) using previous cut-offs. We found a linear reduction in hippocampal volumes with ɛ4 carriers possessing the smallest volumes, ɛ3 carriers possessing intermediate volumes, and ɛ2 carriers possessing the largest volumes. Moreover, AD and MCI ɛ4 carriers possessed the smallest hippocampal volumes and control ɛ2 carriers possessed the largest hippocampal volumes. Subjects with both APOE ɛ4 and Aβ positivity had the lowest hippocampal volumes when compared to Aβ- ɛ4 carriers, suggesting a synergistic relationship between APOE ɛ4 and Aβ. However, we found no hippocampal volume differences between APOE groups in healthy 14-year-old adolescents. Our findings suggest that the strongest neuroanatomic effect of APOE ɛ4 on the hippocampus is observed in AD and groups most at risk of developing the disease, whereas hippocampi of old and young healthy individuals remain unaffected.
INTRODUCTION
The apolipoprotein E (APOE) gene is a well-established genetic risk factor for the development of late-onset Alzheimer’s disease (AD) and since its discovery, a large body of research has been conducted to explain its role in AD pathophysiology [1–3]. The APOE ɛ4 allele, a genetic risk factor known to substantially increase the risk of AD in a dose-dependent fashion, is associated with higher amyloid-β (Aβ) deposition [4, 5]. By contrast, the APOE ɛ2 allele has been suggested to confer a protective effect against AD [6].
Hippocampal volumetry has been shown to be a sensitive, albeit non-specific marker of neurodegeneration in AD. Previously, it has been used todemonstrate accelerated rates of hippocampal atrophy in ɛ4 carriers with amnestic mild cognitive impairment (MCI) [7, 8]. Although the exact temporospatial relationship between Aβ and tau in the pathological cascade of AD is unclear, it has been suggested that both proteinopathies may have a synergistic effect on neuronal toxicity [9]. Emerging data also suggests that these pathological processes that influence cognitive decline in AD are moderated by APOE ɛ4 through both Aβ-dependent and Aβ-independent mechanisms [10]. However, evidence for the direct mechanistic actions of APOE ɛ4 is mixed.
Despite the numerous studies, our limited understanding of APOE ɛ4 risk in asymptomatic individuals and individuals with varying stages of AD pathophysiology warrants further study. Evidence has suggested that equivocal findings in neuroimaging studies of APOE ɛ4 may be attributed to the lack of specificity between changes that are due to normal aging and those that manifest as a result of pathological neurodegeneration [11]. Furthermore, some APOE neuroimaging findings originate from studies with limitations in sample size and hence study power [12]. This is further exacerbated by the varying distribution of APOE ɛ4 carrier status across different samples. However, recent neuroimaging APOE studies with well-characterized samples (between 400–700 subjects) are beginning to address this methodological issue [13, 14]. Also, recent neuroimaging evidence from young APOE ɛ4 carriers has shown that structural and functional alterations in the brain may precede Aβ pathology[15, 16]. This had led researchers to postulate that APOE ɛ4 may exert neurodevelopmental changes that provide a foothold for the pathological cascade of AD later in life.
In order to capture the heterogeneity of varying AD risk, we combined several well-characterized cohort studies to evaluate the neuroanatomic effect of APOE genotype on hippocampal volumes. The first dataset in our study, known as the AD and normal aging dataset (n = 1,781) consisted of imaging data from three large multi-center AD consortiums, (i) The Alzheimer’s Disease Neuroimaging Initiative (ADNI), (ii) the AddNeuroMed study (ANM), and (iii) the Australian Imaging, Biomarkers and Lifestyles (AIBL) study, as well as a sample of non-demented individuals from the Swedish National Study on Aging and Care in Kungsholmen (SNAC-K) and a dementia study from King’s College London, UK (BRC-AD). The sample of non-demented individuals from the SNAC-K study were considered separate from healthy controls as the recruitment criteria for these subjects was epidemiological in nature and we could not exclude the possibility of memory impairment in some subjects. In our second dataset, we used a large sample of healthy 14-year-old adolescents (n = 1,387) in order to determine the neurodevelopmental effect of APOE ɛ4 genotype on hippocampal volume. This is particularly important because adolescence is a time of substantial dynamic neurobiological and behavioral changes. These changes are often beneficial and can optimize the brain for adult maturation, but can also confer neural vulnerabilities for certain types of psychiatric or neurological illness.
The aim of this study was to firstly evaluate the neuroanatomic effect of APOE genotype on thehippocampus in the AD and normal aging dataset. Previous studies have demonstrated a linear effect of APOE genotype on disease risk, with ɛ2 carriers possessing a low risk of developing AD, and ɛ4 carriers possessing the greatest risk [17]. We aimed to test if this linear stepwise effect of APOE genotype also imparted a similar neuroanatomic effect on the hippocampus across the different stages of AD pathophysiology. We then tested the neuroanatomic effect of APOE genotype on hippocampal volumes of healthy 14-year-old adolescents to determine the role of APOE in adolescent brain development.
On the other hand, converging evidence suggests that APOE ɛ4 modifies Aβ accumulation and may have downstream effects on tau neurodegeneration [18]. To further elucidate the mechanisms of this proposed synergistic relationship, we aimed to examine whether high levels of Aβ deposition would lead to greater hippocampal loss compared to low levels of Aβ deposition in APOE ɛ4 carriers.
MATERIALS AND METHOD
Datasets
Cohort specific inclusion criteria and details of the study design can be found in previous publications [19–23]. Table 1 provides details of the number of subjects from each cohort included in the AD and normal aging dataset.
AD and Normal Aging Dataset (n = 1,781)
Alzheimer’s Disease Neuroimaging Initiative (n = 779)
A detailed description of the study design can be found on the ADNI webpage (http://www.adni-info.org). Data was obtained for subjects from the ADNI online database (http://adni.loni.usc.edu). Subjects were between 55 and 90 years of age. ADNI was approved by the institutional review board and ethics committees of participating institutions, and written informed consent was obtained from all participants or their next of kin.
i. AD (n = 177): General inclusion/exclusion criteria: 1) MMSE scores between 20 and 26; 2) CDR of 0.5 or 1.0; 3) met NINCDS/ADRDA criteria for probable AD.
ii. MCI (n = 383): General inclusion/exclusion criteria: 1) subjects had MMSE scores between 24 and 30 (inclusive); 2) memory complaint had objective memory loss measured by education adjusted scores on Wechsler Memory Scale Logical Memory II; 3) CDR of 0.5; 4) absence of significant levels of impairment in other cognitive domains, essentially preserved activities of daily living, and an absence of dementia.
iii. Cognitively normal (CN) (n = 219): General inclusion/exclusion criteria: 1) MMSE scores between 24 and 30 (inclusive); 2) CDR of zero; 3) they were non- depressed, non MCI, and non-demented.
AddNeuroMed (ANM) study (n = 303)
Information regarding the study design and enrolment criteria has been previously described elsewhere [21, 24]. All AD and MCI subjects were recruited from the local memory clinics of one of the six participating sites while the control subjects were recruited from non-related members of the patient’s families, caregiver’s relatives, and social centers for the elderly or GP surgeries. ANM was approved by the South London and Maudsley NHS Foundation Trust ethics committee and other ethical review boards of each participating country. Ethics committee approval was obtained at each of the participating centers in accordance with the Alzheimer’s Associations published recommendations.
i. AD (n = 109): Inclusion criteria: 1) ADRDA/NINCDS and DSM-IV criteria for probable AD. 2) Mini-Mental State Examination (MMSE) score ranged from 12 to 28; 3) age 65 years or above. Exclusion criteria: 1) Significant neurological or psychiatric illness other than AD; 2) Significant unstable systematic illness or organ failure.
ii. MCI (n = 97) and CN (n = 97): Inclusion criteria: 1) MMSE score range between 24 and 30; 2) Geriatric Depression Scale score less than or equal to 5; 3) age 65 years or above; 4) medication stable; 5) good general health. Exclusion criteria: 1) met the DSM-IV criteria for dementia; 2) significant neurological or psychiatric illness other than AD; 3) significant unstable systematic illness or organ failure.
iii. The distinction between MCI and CN individuals was based on two criteria: 1) subject scores 0 on Clinical Dementia Rating Scale (CDR) = CN; 2) Subject scores 0.5 on CDR = MCI. For the MCI subjects, it was preferable that the subject and informant reported occurrence of memory problems. All AD subjects had a CDR score of 0.5 orabove.
The Australian, Imaging, Biomarkers, and Lifestyles (AIBL) study (n = 228)
The AIBL study is a prospective longitudinal study of aging, integrating data from neuroimaging, biomarkers, lifestyle, clinical, and neuropsychological analysis. Detailed information about the study design has been described in previous publications [20, 25]. CN individuals were recruited by advertisement in the community while MCI and AD patients were recruited from tertiary memory disorders clinics or private geriatricians, psychiatrists, and neurologists that subspecialize in dementia. All participants were at least 60 years of age, in good general health with no history of stroke or other neurological disease. The institutional ethics committees of Austin Health, St Vincent’s Health, Hollywood Private Hospital and Edith Cowan University approved the AIBL study, and all volunteers gave written informed consent beforeparticipating.
i. AD (n = 46): Inclusion criteria: 1) all met NINCDS-ADRDA criteria for probable AD; 2) had a CDR of 1 or more.
ii. MCI (n = 42): Inclusion criteria: 1) met criteria of subjective and objective cognitive difficulties in the absence of significant functional loss; 2) had a CDR of less than 1. 52 MCI participants fulfilled criteria for “amnestic” MCI, and 5 were non-amnestic cases (4 were non-amnestic multi-domain and 1 was non-amnestic single domain).
iii. CN (n = 140): Inclusion criteria: participants were separated in those who reported subjective memory complaints (n = 95) and those who did not (n = 82), according to their response to the question: “Do you have any difficulty with your memory?”
Biomedical Research Centre for Mental Health and Dementia Cohort, King’s College London (BRC-AD) (n = 89)
BRC-AD is a neuroimaging study which was designed to establish imaging markers for the earlier detection and diagnosis of AD. Data was collected at the Institute of Psychiatry, Psychology, and Neuroscience, King’s College London, UK. A total of 89 subjects (AD: 33, CN:56) were obtained with APOE data for this study. Diagnostic inclusion and exclusion criteria for this study were exactly the same as for the ANM study.
Swedish National study on Aging and Care in Kungsholmen (SNAC-K) study (n = 382)
Participants were recruited from a larger population-based epidemiological study, the SNAC-K. In this study, participants were randomly selected to take part from the island of Kungsholmen in central Stockholm to examine aging in late adulthood [26]. During the first data collection, a subsample of non-institutionalized and non-disabled participants were randomly selected to undergo MRI. Participants with dementia diagnoses, schizophrenia diagnosis, bipolar disorder diagnosis, self-reported stroke, stroke observed on MRI, self-reported Parkinson’s disease, or epilepsy, were excluded. The study design has been described in detail elsewhere [22]. We used a sample of 459 individuals from SNAC-K, who underwent MRI imaging and APOE genotyping. 77 subjects with suboptimal MRI images and neurological and/or psychiatric conditions were excluded. The SNAC-K study was population-based, therefore subjects in this sample were considered a heterogeneous sample of elderly participants and treated separate from our sample CN individuals.
The SNAC-K study complies with the declaration of Helsinki, and has been approved by the ethical committee at Karolinska Institutet. All subjects gave informed consent, and in the case of severe cognitive impairment consent was collected from next-of-kin.
Neuroimaging-Genetics IMAGEN Study (n = 1,387)
This is the first European multi-center study combining genetics with behavioral and neuropsychological measures, functional and structural neuroimaging, and genome-wide association analyses in 2,000 healthy 14-year-old adolescents. A description of the study design are provided in Schumann et al. [23]. We selected 1,387 healthy adolescents with available MRI data and ApoE status information.
Genome-wide genotyping was performed using Illumina Quad 610 and 660 arrays (San Diego, CA, USA). Quality control of the genome-wide data was performed and samples with the following criteria were excluded: genotype call rate < 95%, and those with discordance between clinical and genotypic gender. Single nucleotide polymorphisms (SNP) quality control filters were used as described in the ENIGMA consortium imputation protocol (http://enigma.ini.usc.edu/protocols/genetics-protocols/). Further details on the imputation of unobserved SNP’s to determine APOE status are described in detail elsewhere [27].
Image acquisition
High resolution 3D T1-weighted MRI were acquired for each subject and a comprehensive quality control procedure was applied to all MR images according to the AddNeuroMed study quality control framework [24, 28].
ADNI: The protocol included a high resolution T1 weighted sagittal 3D MP-RAGE volume (voxel size 1.1×1.1×1.2 mm3), and axial proton density with T2 weighted fast spin echo images. MRI scanner protocols from models of General Electric (GE) Healthcare, Philips Medical Systems, and Siemens Medical Solutions were supported.
ANM: Data acquisition took place using six different 1.5T MR systems (4 General Electric, 1 Siemens, and 1 Picker). At each site a quadrature birdcage coil was used for RF transmission and reception. Data acquisition was designed to be compatible with the ADNI. The imaging protocol included a high resolution sagittal 3D T1-weighted MPRAGE volume (voxel size 1.1×1.1×1.2 mm3) and axial proton density / T2-weighted fast spin echo images. The BRC-AD study protocol was designed to be the same as the ANM protocol.
AIBL: T1-weighted MRI was obtained using the ADNI 3D Magnetization Prepared Rapid Gradient Echo (MPRAGE) sequence, with 1×1 mm in-plane resolution and 1.2 mm slice thickness, TR/TE/T1 = 2300/2.98/900, flip angle 9° and field of view 240×256 and 160 slices. T2 FSE and FLAIR sequences were also obtained. The AIBL protocol has been described in extensive detailpreviously [20].
SNAC-K: MRI scanning was undertaken on a 1.5T scanner (Philips Intera, Netherlands) on which 3D FFE (fast field echo) T1, Axial SE (spin echo) Proton Density/T2, DTI (Diffusion Tensor Imaging), and Axial FLAIR (fluid-attenuated inversion recovery) were acquired. In this study, the 3D FFE T1 images (TR = 15 ms, TE = 7 ms, Flip angle = 15°, number of slices = 128, thickness = 1.5 mm, in-plane resolution = 0.94×0.94 mm, no gap, Field of view = 240, matrix = 256∗256) were used.
IMAGEN: MRI images were acquired using 3T MRI systems from major manufacturers (Siemens, Philips, Bruker, and General Electric). The protocol included a high-resolution 3D T1-weighted ultrafast gradient echo volume (voxel size 1.1×1.1×1.1 mm3) and axial proton density T2-weighted fast spin echo images based on the ADNI study protocol.
Aβ PET methods
Data on Aβ imaging with positron emission tomography (PET) was accessed for a total of 95 ADNI and 57 AIBL ɛ4 carriers. Aβ imaging for these subjects was conducted using either 11C-Pittsburgh Compound B (PiB), or 18F-florbetapir. PET scans that were acquired as close as possible to the structural MRI scans in the ADNI and AIBL study were chosen. The PET imaging methodology of the ADNI and AIBL studies has been extensively described elsewhere [29, 30]. For PiB PET, the measure of amyloid burden was calculated by averaging the ratio of cortical to cerebellar signal (SUVR) measurements from frontal, parietal, anterior cingulate, and parietal regions of interest [29]. For 18F-florbetapir, the SUVR was calculated for 6 pre-defined regions of interest (frontal, temporal, parietal, anterior cingulate, posterior cingulate, and precuneus). The whole cerebellum was used as a reference region for both PiB and 18F-florbetapir PET.
Of the 95 subjects that underwent PET neuroimaging in the ADNI study, 66 were scanned using 18F-florbetapir and 29 using PiB. For the AIBL study, all subjects underwent PET neuroimaging using PiB. The global measure of amyloid burden was used to define participants as Aβ positive (Aβ+) and Aβ negative (Aβ–). PiB participants were classified as Aβ+ when the measure of amyloid burden was ≥ 1.5 [30] and 18F-florbetapir participants were classified as Aβ+ if the measure of amyloid burden was ≥1.11 [31].
Image analysis
Volumetric segmentation of the hippocampus was performed using FreeSurfer (5.1.0). FreeSurfer utilizes an affine rigid linear transformation and combines spatial information about voxel intensity relative to a probability distribution for tissue classes [32]. The Freesurfer segmentation process includes motion correction of volumetric T1-weighted images, removal of non-brain tissue using a hybrid watershed/surface deformation procedure [33], automated Talairach transformation, segmentation of the subcortical white matter and deep grey matter volumetric structures (including hippocampus, amygdala, caudate, putamen, ventricles) [34], intensity normalization [33], tessellation of the grey matter white matter boundary, automated topology correction [35, 36], and surface deformation following intensity gradients to optimally place the grey/white and grey/cerebrospinal fluid borders at the location where the greatest shift in intensity defines the transition to the other tissue class [37–39]. Further details of the segmentation approach have been described previously [34]. Quality control of hippocampal images were performed by visualizing the subcortical segmentation borders of the hippocampus for every subject. Images reflecting a poor segmentation of the hippocampal structures were excluded from the study. Hippocampal volumes were normalized by subject intracranial volume (volumenormalized= volumeraw* 1,000/intracranial volume) to correct for individual differences in head size.
Statistical analysis
To compare demographic statistics, Fisher’s exact tests and ANOVA with Tukey-Kramer HSD post-hoc tests were used. A linear mixed model regression was used to compare hippocampal volumes by APOE genotype (ɛ2/ɛ3/ɛ4). In accordance with previous work, 44 ɛ2/ɛ4 individuals were excluded from the analysis due to the opposing protective effect of the ɛ2 allele and detrimental effect of ɛ4 allele [40]. The model treated subject age, gender, and baseline diagnosis as fixed terms in the final model. Interaction terms for APOE genotype and diagnosis were also included and image acquisition site was included as a random effect term.
Hippocampal comparisons were also performed in a sample of subjects from the ADNI and AIBL cohorts who were divided into Aβ+ and Aβ–participants. Pairwise multiple comparisons were corrected using a stringent Bonferroni correction method. The R statistical software environment, version 3.1.1, was used to perform all statistical analyses in RStudio. The nlme v3.1–117 [41] package was used to create linear-mixed effects models and multcomp v1.3–6 [42] package for post-hoc comparisons.
RESULTS
Demographic characteristics
In the AD group, a difference in age between APOE groups was significant (p = 0.016) with ɛ2 carriers being significantly older than ɛ3 carriers and ɛ4 carriers. For MCI subjects, ɛ2 and ɛ3 carriers had significantly higher MMSE scores than ɛ4 carriers (p = 0.016). No other demographic characteristics differed between the groups (Table 2).
Comparing the effect of APOE genotype on hippocampal volume in the AD, and normal aging dataset (n = 1,781) and the IMAGEN study of healthy 14-year-old adolescents (n = 1,387)
In AD patients, ɛ4 carriers had significantly smaller hippocampal volumes than non-carriers. A significant linear stepwise reduction in hippocampal volume was observed with ɛ2 carriers possessing the largest volumes, ɛ3 carriers possessing intermediate volumes and ɛ4 carriers possessing the smallest volumes. This pattern was also observed in the MCI group (Table 3). The effect of the ɛ4 allele on hippocampal volume was found to be moderately dose-dependent in AD patients [left region: Cohen’s d = 0.10, p≤0.0001; right region: Cohen’s d = 0.22, p≤0.0001] and MCI subjects [left region: Cohen’s d = 0.15, p≤0.0001; right region: Cohen’s d = 0.19, p≤1].
The effect of APOE genotype on hippocampal volumes in CN individuals was not significant (left region: p = 0.052; right region: p = 0.053) and the magnitude of this non-significant difference in both regions was small (Cohen’s d = 0.16; effect size r = 0.08). This non-significant pattern was also observed in elderly individuals from the SNAC-K study, as well as in healthy adolescents from the IMAGEN study (Table 3). Figure 1 displays hippocampal volumes by APOE genotype in the AD and normal aging dataset and IMAGEN study of adolescents.
Hippocampal volumes of AD ɛ4 carriers were found to be significantly smaller than MCI, CN, and non-demented ɛ4 carriers. This pattern was also observed in MCI ɛ4 carriers who had significantly smaller volumes than CN, and non-demented ɛ4 carriers (Table 4). In carriers of the ɛ2 allele, the MCI and CN groups possessed significantly larger hippocampal volumes than ɛ2 carriers of the AD group (Table 5).
Comparison of hippocampal volumes by ApoE ɛ4 and Aβ deposition
In this analysis, ɛ4 carriers from the ADNI and AIBL cohort studies were selected and divided into Aβ+ and Aβ–participants to assess if the effect of APOE ɛ4 on the hippocampus is modified by levels of Aβ deposition. Descriptive information for this sample is shown in Table 6. Among ɛ4+ CN individuals, hippocampal volumes between Aβ+ and Aβ–participants did not significantly differ (left region: p = 0.692; right region: p = 0.946). MCI Aβ+ participants were found to have significantly smaller hippocampal volumes than MCI Aβ–participants for the right hippocampus (left hippocampus: p = 0.295; right hippocampus: p = 0.054). Hippocampal volumes of MCI Aβ+ɛ4+ participants did not differ when compared to AD Aβ+ɛ4+ participants. AD Aβ+ɛ4+ participants possessed significantly smaller hippocampal volumes than (i) the CN Aβ–ɛ4+ group (left region: Cohen’s d = –1.05; p≤0.001; right region: Cohen’s d = –1.03; p≤0.001) and the (ii) CN Aβ+ɛ4+ group (left region: Cohen’s d = –1.09; p≤0.001; right region: Cohen’s d = –1.02; p≤0.001). The complete results for these comparisons are shown in Table 7. There was no interaction observed between gender and ɛ4 status in hippocampal volumes between groups. Hippocampal differences between the different Aβ+ and Aβ–participants are shown in Fig. 2.
DISCUSSION
Prior neuroimaging studies of APOE ɛ4 have helped define our current observation of structural changes in the brain, but the mechanisms associated with the detrimental effect of APOE ɛ4, particularly across the different stages of AD, still remains poorly understood. With recent studies proposing a neurodevelopmental foothold of APOE ɛ4 on the brain [43, 44], understanding whether atrophy in AD-susceptible areas, such as the hippocampus, are attributed to pre-clinical manifestations of the disease, or whether these constitute a part of non-specific normal aging is of great importance for earlierdiagnosis.
Here we present the largest cross-sectional multi-cohort study of APOE and hippocampal volume to date (n = 3,168) and discuss a number of key findings. Firstly, a linear neuroanatomic effect of the APOE genotype was observed for hippocampal volumes of AD and MCI subjects, whereby ɛ4 carriers presented with the lowest volumes, ɛ3 homozygotes possessed intermediate volumes, and ɛ2 carriers possessed the largest volumes. As expected, ɛ4 carriers in the AD and the MCI group had significantly lower hippocampal volumes when compared to CN individuals and a population-based sample of elderly non-demented individuals from the SNAC-K study. These findings are in agreement with previous studies demonstrating a distinct neuroanatomic effect of APOE genotype on brain structure, as well as studies reporting smaller hippocampal volumes in MCI subjects with prodromal stages of AD. Furthermore, our finding of larger hippocampal volumes in ɛ2 carriers in older healthy groups supports the ɛ2 allele’s suggested effect of protection against neurodegeneration. Previous cellular models have advocated its role in a disease staving protective effect, in particular its ability to modify the neuropathological effects of Aβaccumulation [45].
The absence of APOE-dependent hippocampal volume loss in CN individuals and in a population-based sample of elderly individuals suggested that APOE ɛ4 may not be independently associated with hippocampal atrophy in normal aging. Although the findings from previous APOE studies in non-demented individuals are mixed, our findings replicate a number of earlier neuroimaging studies showing no effect of APOE ɛ4 on regions such as the hippocampus in normal aging [46–48]. One explanation for the discrepant APOE findings in CN individuals may be related to differences in defining those that fulfil the criteria for pre-clinical AD from subjects showing typical normal aging [11]. Recent studies have since shown that APOE ɛ4 is linked to Aβ deposition and may exert a synergistic effect to promote cognitive decline [49, 50].
To test whether an Aβ-dependent effect of APOE ɛ4 would be associated with greater hippocampalvolume loss, we examined the combined effect of APOE ɛ4 and Aβ on the hippocampus. We found no significant differences in hippocampal volume between CN Aβ+ ɛ4+ individuals and CN Aβ–ɛ4+ individuals, suggesting that in healthy individuals there is no effect of APOE ɛ4 and Aβ on the hippocampus. This is consistent with previous studies that have shown that the relationship between APOE ɛ4, Aβ, and brain atrophy is mediated by CSF p-tau181 levels [51, 52] and, in the absence of abnormal p-tau181 levels, there is no synergistic relationship between APOE ɛ4 and Aβ deposition. Hippocampal volumes of MCI Aβ+ ɛ4+ individuals did not differ when compared to AD Aβ+ ɛ4+ participants, suggesting that a similar degree of hippocampal loss that is expected in AD has already manifested in MCI subjects. Our findings are supported by empirical evidence which has shown that APOE induces intracellular degradation of Aβ peptides facilitating synaptotoxicity, neuroinflammation, and tau hyperphosphorylation [5, 53]. It is therefore possible that Aβ and the ɛ4 in conjunction impart greater levels of neuronal toxicity and injury in the presence of hippocampal neurodegeneration.
Recent studies have suggested an Aβ independent effect of the APOE ɛ4 on neuronal integrity as another explanation for the gene’s effect on brain structure [47, 54]. A study by Dean and colleagues [44] argued that an early neurodevelopmental foothold of APOE on the brain may render individuals more susceptible to the toxic and downstream neurodegenerative effects of Aβ later in life. However, findings from our large sample of 14-year-old adolescents showed that there were no hippocampal volume differences present between the APOE groups, suggesting that ɛ4 carriers are unlikely to be at risk in adolescence, but may perhaps develop a greater risk later in life. Similar studies, such as that of O’Dwyer and colleagues [15] reported lower hippocampal volumes in ɛ4 carriers aged in their mid-twenties. Although differences may be attributed to the methodological approach adopted for the automated segmentation of the hippocampus, we cannot exclude the possibility of a low APOE penetrance in our young sample. Nevertheless, previous studies in younger ɛ4 carriers have shown that APOE plays a fundamental role in modulating brain function in the absence of any differences in brain volume [47].
An important caveat when interpreting the results of this study is that the multi-cohort data was cross-sectional and a more complete understanding of how hippocampal trajectories vary with age would require longitudinal data. In particular, more neuroimaging studies need to be conducted into typical cognitive aging across the lifespan [18] in order to differentiate between brain changes that are associated with typical normal aging from those that arise from APOE ɛ4 dependent mechanisms and β-amyloidosis.Additionally, when combining data across cohort studies, it is important to consider study design differences that may complicate the interpretation of our results. For instance, the use of different AD diagnostic criteria across the different cohort studies may contribute to a level of diagnostic variability between groups. Participants from the ADNI and AIBL study were also highly educated, had few comorbidities, and were of Caucasian background. As such, future prospective studies with more representative samples should be conducted to address how these comorbidities, namely the presence of vascular disease, could potentially influence the size of the hippocampus. We demonstrated that systematic bias was not present in our dataset when comparing hippocampal volumes between APOE groups within each cohort study separately (Supplementary Material). Additional factors such as the use of two different PET radioligands meant that SUVR values of tracer uptake could not be compared as a single continuous measure. However, ongoing working groups such as the Centiloid project will further enable a more standardized approach for the direct comparability of results across different labs when different tracers and methods of analysis areemployed [55].
Despite these limitations, this is first multi-cohort neuroimaging study of APOE genotype that attempts to characterize the differential risk of APOE on hippocampal volumes of subjects with varying stages of AD. Using metadata and clinical phenotyping pooled across several cohort studies, we were systematically able to demonstrate differential effects of the different APOE gene polymorphisms on hippocampal volume. An independent sample of healthy 14-year-old adolescents also provides an understanding into the role of APOE in adolescent brain neurodevelopment.
In conclusion, our findings in the largest APOE neuroimaging dataset show that hippocampal volume loss is present in patients with AD and in subjects with an increased risk of developing AD, particularly subjects with memory impairment. However, healthy older individuals did not show APOE ɛ4 dependent changes in the hippocampus, suggesting that the relationship between APOE ɛ4 and Aβ may be mediated by the presence of neurodegeneration. The same pattern was also observed in healthy young adolescents who possessed no hippocampal differences between different APOE groups. Our study thus shows hippocampal volume loss is moderated by APOE ɛ4 and Aβ in AD and the MCI stages of the AD pathological process. The influence of these three markers could be considered as prognostic tools in clinical trials and therapeutic interventions of AD.
ACKNOWLEDGMENTS
Data used in preparation of this article were obtained from the Alzheimer’s Disease Neuroimaging Initiative (ADNI) database (http://adni.loni.ucla.edu). As such, the investigators within the ADNI contributed to the design and implementation of ADNI and/or provided data but did not participate in analysis or writing of this report. A complete listing of ADNI investigators can be found on ADNI website (http://adni.loni.usc.edu/).
Data used in the preparation of this article were obtained from the Australian Imaging Biomarkers and Lifestyle Flagship Study of Ageing (AIBL) funded by the Commonwealth Scientific and Industrial Research Organisation (CSIRO), which was made available at the ADNI database (http://www.loni.ucla.edu/ADNI). The AIBL researchers contributed data but did not participate in analysis or writing of this report. AIBL researchers can be found on the AIBL website (http://aibl.csiro.au).
Data used in the preparation of this study was obtained from the AddNeuroMed study which was supported by InnoMed, (Innovative Medicines in Europe) an Integrated Project funded by the European Union of the Sixth Framework program priority FP6-2004-LIFESCIHEALTH-5, Life Sciences, Genomics and Biotechnology for Health, Health Research Council of Academy of Finland (HS), The Gamla Tjanarinnor Foundation, The Swedish Alzheimer’s Association and Swedish Brain Power.
Data used in the preparation of this study were obtained from the Swedish National Study of Aging and Care in Kungsholmen (SNAC-K) which was supported by Stiftelsen för Gamla Tjänarinnor and Sigurd och Elsa Goljes Minne, the Swedish Research Council, the Swedish Council for Working Life and Social Research, Swedish Brain Power, an Alexander von Humboldt Research Award, and a donation from the af Jochnick Foundation.
Data used in the preparation of this study were obtained for the IMAGEN study which was supported by the IMAGEN project, which receives research funding from the European Community’s Sixth Framework Program (LSHM-CT-2007-037286) and coordinated project ADAMS (242257), as well as the NIHR Biomedical Research Centre for Mental Health and NIHR Biomedical Research Unit for Dementia at South London and Maudsley NHS Foundation Trust and Institute of Psychiatry, Psychology, and Neuroscience (IoPPN), King’s College London, Alzheimer Research UK and the IMI funded European Medical Information Framework.
Authors’ disclosures available online (http://j-alz.com/manuscript-disclosures/161097r1).
Appendices
The supplementary material is available in the electronic version of this article: http://dx.doi.org/10.3233/JAD-161097.
REFERENCES
[1] | Saunders AM , Strittmatter WJ , Schmechel D , George-Hyslop St , Pericak-Vance PH , Joo MA , Rosi SH , Gusella BL , Crapper-MacLachlan JF , Alberts DR , Hulette MJ , Crain C , Goldgaber B , Roses D , AD ((1993) ) Association of apolipoprotein E allele 4 with late-onset familial and sporadic Alzheimer’s disease. Neurology 43: , 1467–1472. |
[2] | Lehtovirta M , Soininen H , Laakso MP , Partanen K , Helisalmi S , Mannermaa A , Ryynänen M , Kuikka J , Hartikainen P , Riekkinen PJ ((1996) ) SPECT and MRI analysis in Alzheimer’s disease: Relation to apolipoprotein E epsilon 4 allele. J Neurol Neurosurg Psychiatry 60: , 644–649. |
[3] | Harold D , Abraham R , Hollingworth P , Sims R , Gerrish A , Hamshere ML , Pahwa JS , Moskvina V , Dowzell K , Williams A , Jones N , Thomas C , Stretton A , Morgan AR , Lovestone S , Powell J , Proitsi P , Lupton MK , Brayne C , Rubinsztein DC , Gill M , Lawlor B , Lynch A , Morgan K , Brown KS , Passmore PA , Craig D , McGuinness B , Todd S , Holmes C , Mann D , Smith AD , Love S , Kehoe PG , Hardy J , Mead S , Fox N , Rossor M , Collinge J , Maier W , Jessen F , Schürmann B , Van Den Bussche H , Heuser I , Kornhuber J , Wiltfang J , Dichgans M , Frölich L , Hampel H , Hüll M , Rujescu D , Goate AM , Kauwe JSK , Cruchaga C , Nowotny P , Morris JC , Mayo K , Sleegers K , Bettens K , Engelborghs S , De Deyn PP , Van Broeckhoven C , Livingston G , Bass NJ , Gurling H , McQuillin A , Gwilliam R , Deloukas P , Al-Chalabi A , Shaw CE , Tsolaki M , Singleton AB , Guerreiro R , Mühleisen TW , Nöthen MM , Moebus S , Jöckel K-H , Klopp N , Wichmann H-E , Carrasquillo MM , Pankratz VS , Younkin SG , Holmans PA , O’Donovan M , Owen MJ , Williams J ((2009) ) Genome-wide association study identifies variants at CLU and PICALM associated with Alzheimer’s disease. Nat Genet 41: , 1088–1093. |
[4] | Jiang Q , Lee CYD , Mandrekar S , Wilkinson B , Cramer P , Zelcer N , Mann K , Lamb B , Willson TM , Collins JL , Richardson JC , Smith JD , Comery TA , Riddell D , Holtzman DM , Tontonoz P , Landreth GE ((2008) ) ApoE promotes the proteolytic degradation of Abeta. Neuron 58: , 681–693. |
[5] | Verghese PB , Castellano JM , Garai K , Wang Y , Jiang H , Shah A , Bu G , Frieden C , Holtzman DM ((2013) ) ApoE influences amyloid-β (Aβ) clearance despite minimal apoE/Aβ association in physiological conditions. Proc Natl Acad Sci U S A 110: , E1807–E1816. |
[6] | Kim J , Basak JM , Holtzman DM ((2009) ) The role of apolipoprotein E in Alzheimer’s disease. Neuron 63: , 287–303. |
[7] | Farlow MR , He Y , Tekin S , Xu J , Lane R , Charles HC ((2004) ) Impact of APOE in mild cognitive impairment. Neurology 63: , 1898–1901. |
[8] | Fleisher A , Grundman M , Jack CR , Petersen RC , Taylor C , Kim HT , Schiller DHB , Bagwell V , Sencakova D , Weiner MF , DeCarli C , DeKosky ST , van Dyck CH , Thal LJ ((2005) ) Sex, apolipoprotein E epsilon 4 status, and hippocampal volume in mild cognitive impairment. Arch Neurol 62: , 953–957. |
[9] | Jack CR , Knopman DS , Jagust WJ , Petersen RC , Weiner MW , Aisen PS , Shaw LM , Vemuri P , Wiste HJ , Weigand SD , Lesnick TG , Pankratz VS , Donohue MC , Trojanowski JQ ((2013) ) Tracking pathophysiological processes in Alzheimer’s disease: An updated hypothetical model of dynamic biomarkers. Lancet Neurol 12: , 207–216. |
[10] | Fouquet M , Besson FL , Gonneaud J , La Joie R , Chételat G ((2014) ) Imaging brain effects of APOE4 in cognitively normal individuals across the lifespan. Neuropsychol Rev 24: , 290–299. |
[11] | Fjell AM , McEvoy L , Holland D , Dale AM , Walhovd KB ((2014) ) What is normal in normal aging? Effects of aging, amyloid and Alzheimer’s disease on the cerebral cortex and the hippocampus. Prog Neurobiol 117: , 20–40. |
[12] | Cherbuin N , Leach LS , Christensen H , Anstey KJ ((2007) ) Neuroimaging and APOE genotype: A systematic qualitative review. Dement Geriatr Cogn Disord 24: , 348–362. |
[13] | Morra JH , Tu Z , Apostolova LG , Green AE , Avedissian C , Madsen SK , Parikshak N , Toga AW , Jack CR , Schuff N , Weiner MW , Thompson PM ((2009) ) Automated mapping of hippocampal atrophy in 1-year repeat MRI data from 490 subjects with Alzheimer’s disease, mild cognitive impairment, and elderly controls.S. Neuroimage 45: , 3–15. |
[14] | Shi J , Leporé N , Gutman BA , Thompson PM , Baxter LC , Caselli RL , Wang Y ((2014) ) Genetic influence of apolipoprotein E4 genotype on hippocampal morphometry: An N=725 surface-based Alzheimer’s disease neuroimaging initiative study. Hum Brain Mapp 35: , 3903–3918. |
[15] | O’Dwyer L , Lamberton F , Matura S , Tanner C , Scheibe M , Miller J , Rujescu D , Prvulovic D , Hampel H ((2012) ) Reduced hippocampal volume in healthy young ApoE4 carriers: An MRI study. PLoS One 7: , e48895. |
[16] | Alexopoulos P , Richter-Schmidinger T , Horn M , Maus S , Reichel M , Sidiropoulos C , Rhein C , Lewczuk P , Doerfler A , Kornhuber J ((2011) ) Hippocampal volume differences between healthy young apolipoprotein E ɛ2 and ɛ4 carriers. J Alzheimers Dis 26: , 207–210. |
[17] | Liu C-C , Liu C-C , Kanekiyo T , Xu H , Bu G ((2013) ) Apolipoprotein E and Alzheimer disease: Risk, mechanisms and therapy. Nat Rev Neurol 9: , 106–118. |
[18] | Jack CR , Wiste HJ , Weigand SD , Knopman DS , Vemuri P , Mielke MM , Lowe V , Senjem ML , Gunter JL , Machulda MM , Gregg BE , Pankratz VS , Rocca WA , Petersen RC ((2015) ) Age, sex, and APOE ɛ4 effects on memory, brain structure, and β-amyloid across the adult life span. JAMA Neurol 72: , 511–519. |
[19] | Aisen PS , Petersen RC , Donohue MC , Gamst A , Raman R , Thomas RG , Walter S , Trojanowski JQ , Shaw LM , Beckett LA , Jack CR , Jagust W , Toga AW , Saykin AJ , Morris JC , Green RC , Weiner MW ((2010) ) Clinical core of the Alzheimer’s disease neuroimaging initiative: Progress and plans. Alzheimers Dement 6: , 239–246. |
[20] | Ellis K , Bush AI , Darby D , De Fazio D , Foster J , Hudson P , Lautenschlager NT , Lenzo N , Martins RN , Maruff P , Masters C , Milner A , Pike K , Rowe C , Savage G , Szoeke C , Taddei K , Villemagne V , Woodward M , Ames D ((2009) ) The Australian Imaging, Biomarkers and Lifestyle (AIBL) study of aging: Methodology and baseline characteristics of 1112 individuals recruited for a longitudinal study of Alzheimer’s disease. Int Psychogeriatr 21: , 672–687. |
[21] | Lovestone S , Francis P , Kloszewska I , Mecocci P , Simmons A , Soininen H , Spenger C , Tsolaki M , Vellas B , Wahlund L-O , Ward M ((2009) ) AddNeuroMed–the European collaboration for the discovery of novel biomarkers for Alzheimer’s disease. Ann N Y Acad Sci 1180: , 36–46. |
[22] | Lagergren M , Fratiglioni L , Hallberg IR , Berglund J , Elmståhl S , Hagberg B , Holst G , Rennemark M , Sjölund B-M , Thorslund M , Wiberg I , Winblad B , Wimo A ((2004) ) A longitudinal study integrating population, care and social services data. The Swedish National study on Aging and Care (SNAC). Aging Clin Exp Res 16: , 158–168. |
[23] | Schumann G , Loth E , Banaschewski T , Barbot A , Barker G , Büchel C , Conrod PJ , Dalley JW , Flor H , Gallinat J , Garavan H , Heinz A , Itterman B , Lathrop M , Mallik C , Mann K , Martinot J-L , Paus T , Poline J-B , Robbins TW , Rietschel M , Reed L , Smolka M , Spanagel R , Speiser C , Stephens DN , Ströhle A , Struve M ((2010) ) The IMAGEN study: Reinforcement-related behaviour in normal brain function and psychopathology. Mol Psychiatry 15: , 1128–1139. |
[24] | Simmons A , Westman E , Muehlboeck S , Mecocci P , Vellas B , Tsolaki M , Kłoszewska I , Wahlund L-O , Soininen H , Lovestone S , Evans A , Spenger C ((2009) ) MRI measures of Alzheimer’s disease and the AddNeuroMed study. Ann N Y Acad Sci 1180: , 47–55. |
[25] | Ellis K , Rainey-Smith SR , Rembach A , Macaulay SL , Villemagne VL ((2013) ) Enabling a multidisciplinary approach to the study of ageing and Alzheimer’s disease: An update from the Australian Imaging Biomarkers and Lifestyle (AIBL) study. Int Rev Psychiatry 25: , 699–710. |
[26] | Ferencz B , Laukka EJ , Lövdén M , Kalpouzos G , Keller L , Graff C , Wahlund L-O , Fratiglioni L , Bäckman L ((2013) ) The influence of APOE and TOMM40 polymorphisms on hippocampal volume and episodic memory in old age. Front Hum Neurosci 7: , 198. |
[27] | Radmanesh F , Devan WJ , Anderson CD , Rosand J , Falcone GJ ((2014) ) Accuracy of imputation to infer unobserved APOE epsilon alleles in genome-wide genotyping data. Eur J Hum Genet 22: , 1239–1242. |
[28] | Simmons A , Westman E , Muehlboeck S , Mecocci P , Vellas B , Tsolaki M , Kłoszewska I , Wahlund L-O , Soininen H , Lovestone S , Evans A , Spenger C ((2011) ) The AddNeuroMed framework for multi-centre MRI assessment of Alzheimer’s disease: Experience from the first 24 months. Int J Geriatr Psychiatry 26: , 75–82. |
[29] | Jagust WJ , Bandy D , Chen K , Foster NL , Landau SM , Mathis CA , Price JC , Reiman EM , Skovronsky D , Koeppe RA ((2010) ) The Alzheimer’s Disease Neuroimaging Initiative positron emission tomography core. Alzheimers Dement 6: , 221–229. |
[30] | Rowe CC , Ellis KA , Rimajova M , Bourgeat P , Pike KE , Jones G , Fripp J , Tochon-Danguy H , Morandeau L , O’Keefe G , Price R , Raniga P , Robins P , Acosta O , Lenzo N , Szoeke C , Salvado O , Head R , Martins R , Masters CL , Ames D , Villemagne VL ((2010) ) Amyloid imaging results from the Australian Imaging, Biomarkers and Lifestyle (AIBL) study of aging. Neurobiol Aging 31: , 1275–1283. |
[31] | Clark CM , Schneider JA , Bedell BJ , Beach TG , Bilker WB , Mintun MA , Pontecorvo MJ , Hefti F , Carpenter AP , Flitter ML , Krautkramer MJ , Kung HF , Coleman RE , Doraiswamy PM , Fleisher AS , Sabbagh MN , Sadowsky CH , Reiman EP , Reiman PEM , Zehntner SP , Skovronsky DM ((2011) ) Use of florbetapir-PET for imaging beta-amyloid pathology. JAMA 305: , 275–283. |
[32] | Ségonne F , Dale AM , Busa E , Glessner M , Salat D , Hahn HK , Fischl B ((2004) ) A hybrid approach to the skull stripping problem in MRI. Neuroimage 22: , 1060–1075. |
[33] | Sled JG , Zijdenbos AP , Evans AC ((1998) ) A nonparametric method for automatic correction of intensity nonuniformity in MRI data. IEEE Trans Med Imaging 17: , 87–97. |
[34] | Fischl B , Salat H , Busa D , Albert E , Dieterich M , Haselgrove M , Van Der Kouwe C , Killiany A , Kennedy R , Klaveness D , Montillo S , Makris A , Rosen N , Dale B , AM ((2002) ) Whole brain segmentation: Automated labeling of neuroanatomical structures in the human brain. Neuron 33: , 341–355. |
[35] | Fischl B , Liu A , Dale AM ((2001) ) Automated manifold surgery: Constructing geometrically accurate and topologically correct models of the human cerebral cortex. IEEE Trans Med Imaging 20: , 70–80. |
[36] | Ségonne F , Pacheco J , Fischl B ((2007) ) Geometrically accurate topology-correction of cortical surfaces using nonseparating loops. IEEE Trans Med Imaging 26: , 518–529. |
[37] | Fischl B , Sereno MI , Tootell RB , Dale AM ((1999) ) High-resolution intersubject averaging and a coordinate system for the cortical surface. Hum Brain Mapp 8: , 272–284. |
[38] | Dale AM , Sereno MI ((1993) ) Improved localization of cortical activity by combining EEG and MEG with MRI cortical surface reconstruction: A linear approach. J Cogn Neurosci 5: , 162–176. |
[39] | Fischl B , Dale AM ((2000) ) Measuring the thickness of the human cerebral cortex from magnetic resonance images. Proc Natl Acad Sci U S A 97: , 11050–11055. |
[40] | Shaw P , Lerch JP , Pruessner JC , Taylor KN , Rose AB , Greenstein D , Clasen L , Evans A , Rapoport JL , Giedd JN ((2007) ) Cortical morphology in children and adolescents with different apolipoprotein E gene polymorphisms: An observational study. Lancet Neurol 6: , 494–500. |
[41] | Pinheiro J , Bates D , DebRoy S , Sarkar D , Team TRC ((2009) ) nlme: Linear and Nonlinear Mixed Effects Models. October R package: , 1–3. |
[42] | Hothorn T , Bretz F , Westfall P ((2008) ) Simultaneous inference in general parametric models. Biom J 50: , 346–363. |
[43] | Knickmeyer RC , Wang J , Zhu H , Geng X , Woolson S , Hamer RM , Konneker T , Lin W , Styner M , Gilmore JH ((2014) ) Common variants in psychiatric risk genes predict brain structure at birth. Cereb Cortex 24: , 1230–1246. |
[44] | Dean DC , Jerskey B , Chen K , Protas H , Thiyyagura P , Roontiva A , O’Muircheartaigh J , Dirks H , Waskiewicz N , Lehman K , Siniard AL , Turk MN , Hua X , Madsen SK , Thompson PM , Fleisher AS , Huentelman MJ , Deoni SCL , Reiman EM ((2014) ) Brain differences in infants at differential genetic risk for late-onset Alzheimer disease: A cross-sectional imaging study. JAMA Neurol 71: , 11–22. |
[45] | Tiraboschi P , Hansen LA , Masliah E , Alford M , Thal LJ , Corey-Bloom J ((2004) ) Impact of APOE genotype on neuropathologic and neurochemical markers of Alzheimer disease. Neurology 62: , 1977–1983. |
[46] | Schuff N , Woerner N , Boreta L , Kornfield T , Shaw LM , Trojanowski JQ , Thompson PM , Jack CR , Weiner MW ((2009) ) MRI of hippocampal volume loss in early Alzheimer’s disease in relation to ApoE genotype and biomarkers. Brain 132: , 1067–1077. |
[47] | Filippini N , MacIntosh BJ , Hough MG , Goodwin GM , Frisoni GB , Smith SM , Matthews PM , Beckmann CF , Mackay CE ((2009) ) Distinct patterns of brain activity in young carriers of the APOE E4 allele. Proc Natl Acad Sci U S A 106: , 7209–7214. |
[48] | Hostage C , Roy Choudhury K , Doraiswamy PM , Petrella JR ((2013) ) Dissecting the gene dose-effects of the APOE ɛ4 and ɛ2 alleles on hippocampal volumes in aging and Alzheimer’s disease. PLoS One 8: , e54483. |
[49] | Reiman EM , Chen K , Liu X , Bandy D , Yu M , Lee W , Ayutyanont N , Keppler J , Reeder SA , Langbaum JBS , Alexander GE , Klunk WE , Mathis CA , Price JC , Aizenstein HJ , DeKosky ST , Caselli RJ ((2009) ) Fibrillar amyloid-beta burden in cognitively normal people at 3 levels of genetic risk for Alzheimer’s disease. Proc Natl Acad Sci U S A 106: , 6820–6825. |
[50] | Mormino EC , Betensky RA , Hedden T , Schultz AP , Ward A , Huijbers W , Rentz DM , Johnson KA , Sperling RA ((2014) ) Amyloid and APOE e 4 interact to influence short-term decline in preclinical Alzheimer disease. Neurology 82: , 1760–1767. |
[51] | Desikan RS , McEvoy LK , Thompson WK , Holland D , Roddey JC , Blennow K , Aisen PS , Brewer JB , Hyman BT , Dale AM ((2011) ) Amyloid-β associated volume loss occurs only in the presence of phospho-tau. Ann Neurol 70: , 657–661. |
[52] | Fortea J , Vilaplana E , Alcolea D , Carmona-Iragui M , Sánchez-Saudinos M-B , Sala I , Antón-Aguirre S , González S , Medrano S , Pegueroles J , Morenas E , Clarimón J , Blesa R , Lleó A ((2014) ) Cerebrospinal fluid β-amyloid and phospho-tau biomarker interactions affecting brain structure in preclinical Alzheimer disease. Ann Neurol 76: , 223–230. |
[53] | Lee CYD , Tse W , Smith JD , Landreth GE ((2012) ) Apolipoprotein E promotes β-amyloid trafficking and degradation by modulating microglial cholesterol levels. J Biol Chem 287: , 2032–2044. |
[54] | Suri S , Heise V , Trachtenberg AJ , Mackay CE ((2013) ) The forgotten APOE allele: A review of the evidence and suggested mechanisms for the protective effect of APOE e2. Neurosci Biobehav Rev 37: , 2878–2886. |
[55] | Klunk WE , Koeppe RA , Price JC , Benzinger TL , Devous MD , Jagust WJ , Johnson KA , Mathis CA , Minhas D , Pontecorvo MJ , Rowe CC , Skovronsky DM , Mintun MA ((2015) ) The Centiloid Project: Standardizing quantitative amyloid plaque estimation by PET. Alzheimers Dement 11: , 1–15.e4. |
Figures and Tables
Fig.1
Hippocampal volumes and ApoE genotype in the AD and normal aging dataset and IMAGEN study. Shown are hippocampal volumes from (a) the left and (b) the right region in the AD and normal aging dataset by baseline diagnosis ApoE genotype (ɛ2 carriers, ɛ3 homozygotes, and ɛ4 carriers). Hippocampal volumes from (c) the left and (d) right region of healthy 14-year-old adolescents in the IMAGEN study. SNAC-K indicates Swedish National study on Aging and Care in Kungsholmen.
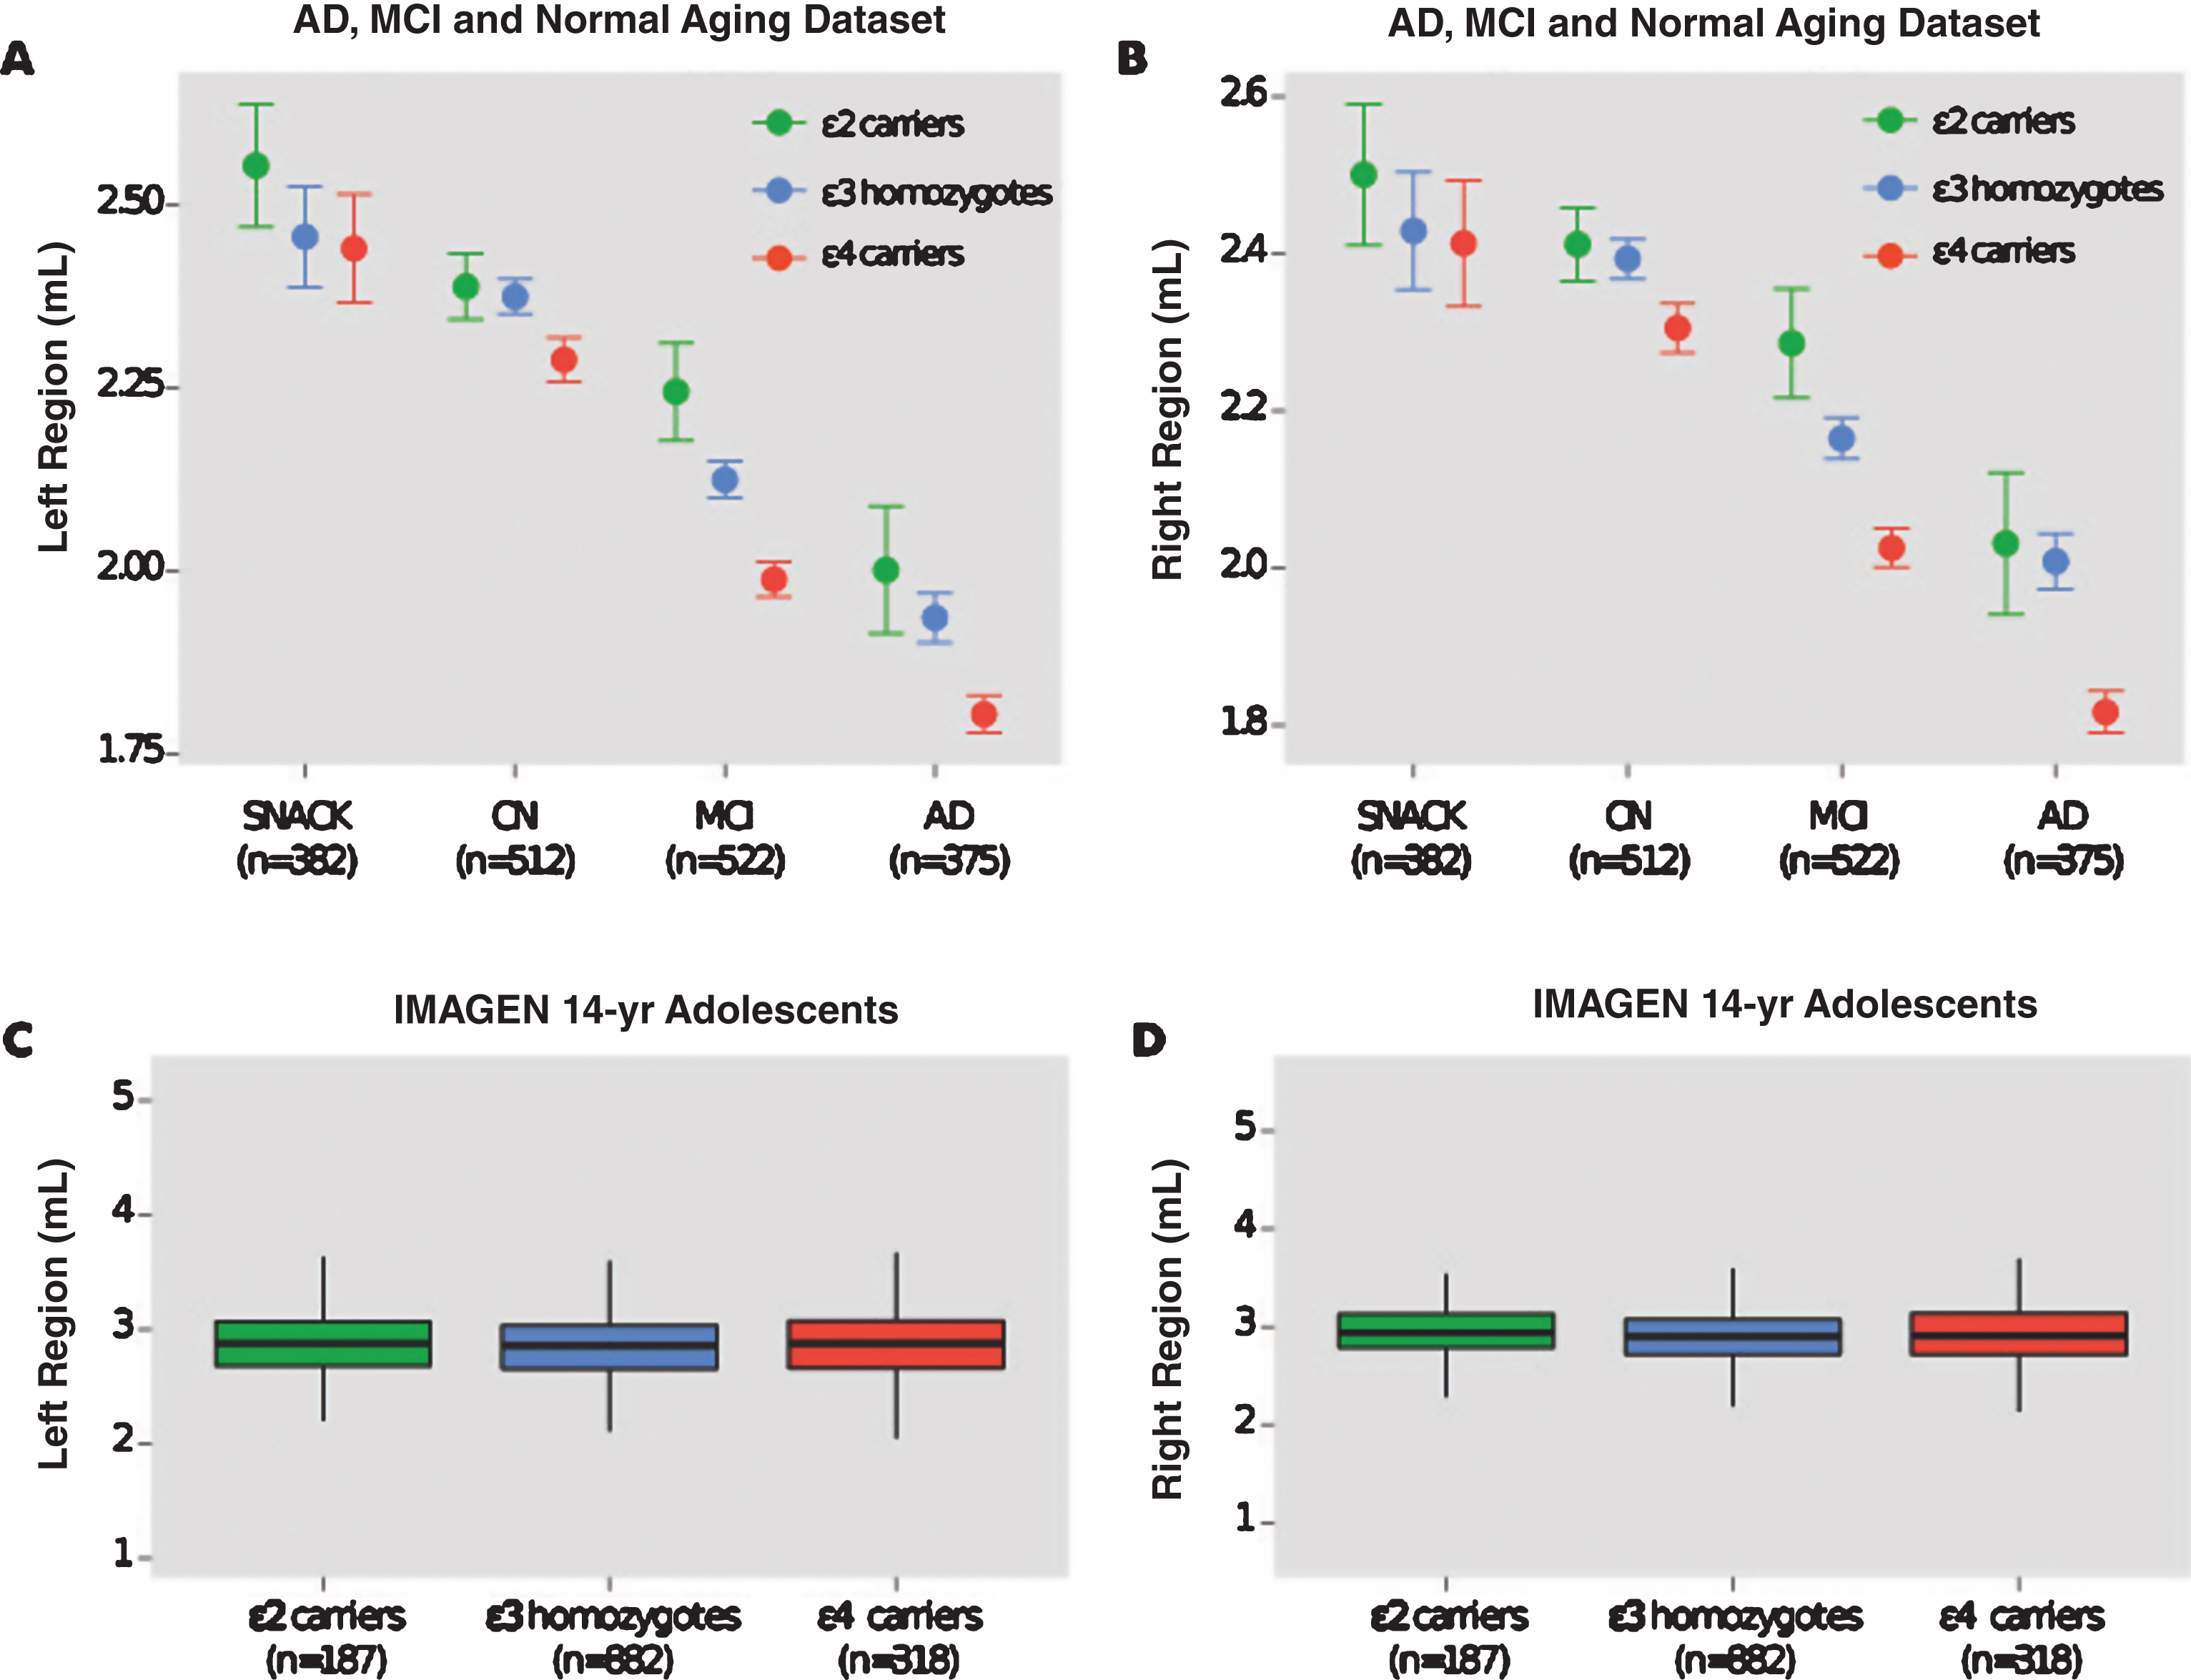
Fig.2
Hippocampal volumes of ɛ4 carriers by diagnosis and Aβ. Data was used from the ADNI and AIBL cohorts for subjects that had available PET Aβ. MCI subjects were further divided by follow-up diagnosis in ADNI (0–36 months) and AIBL (0–54 months). Shown are baseline hippocampal volumes from (a) the left and (b) the right region. Note: There were no MCI-nc Aβ–ɛ4 carriers that converted to AD during the current follow-up period of the ADNI and AIBL studies. Aβ, amyloid-β; CN, cognitively normal; CN Aβ–, Aβ–negative CN group; CN Aβ+, Aβ positive CN group; MCI, mild cognitive impairment; MCI Aβ–, Aβ negative MCI group; MCI-c, MCI non-converter; MCI-nc Aβ+, Aβ positive MCI-nc group; MCI-c, MCI-converter; MCI-c Aβ+, Aβ positive MCI-c group; AD, Alzheimer’s disease; AD Aβ+, Aβ positive AD group.
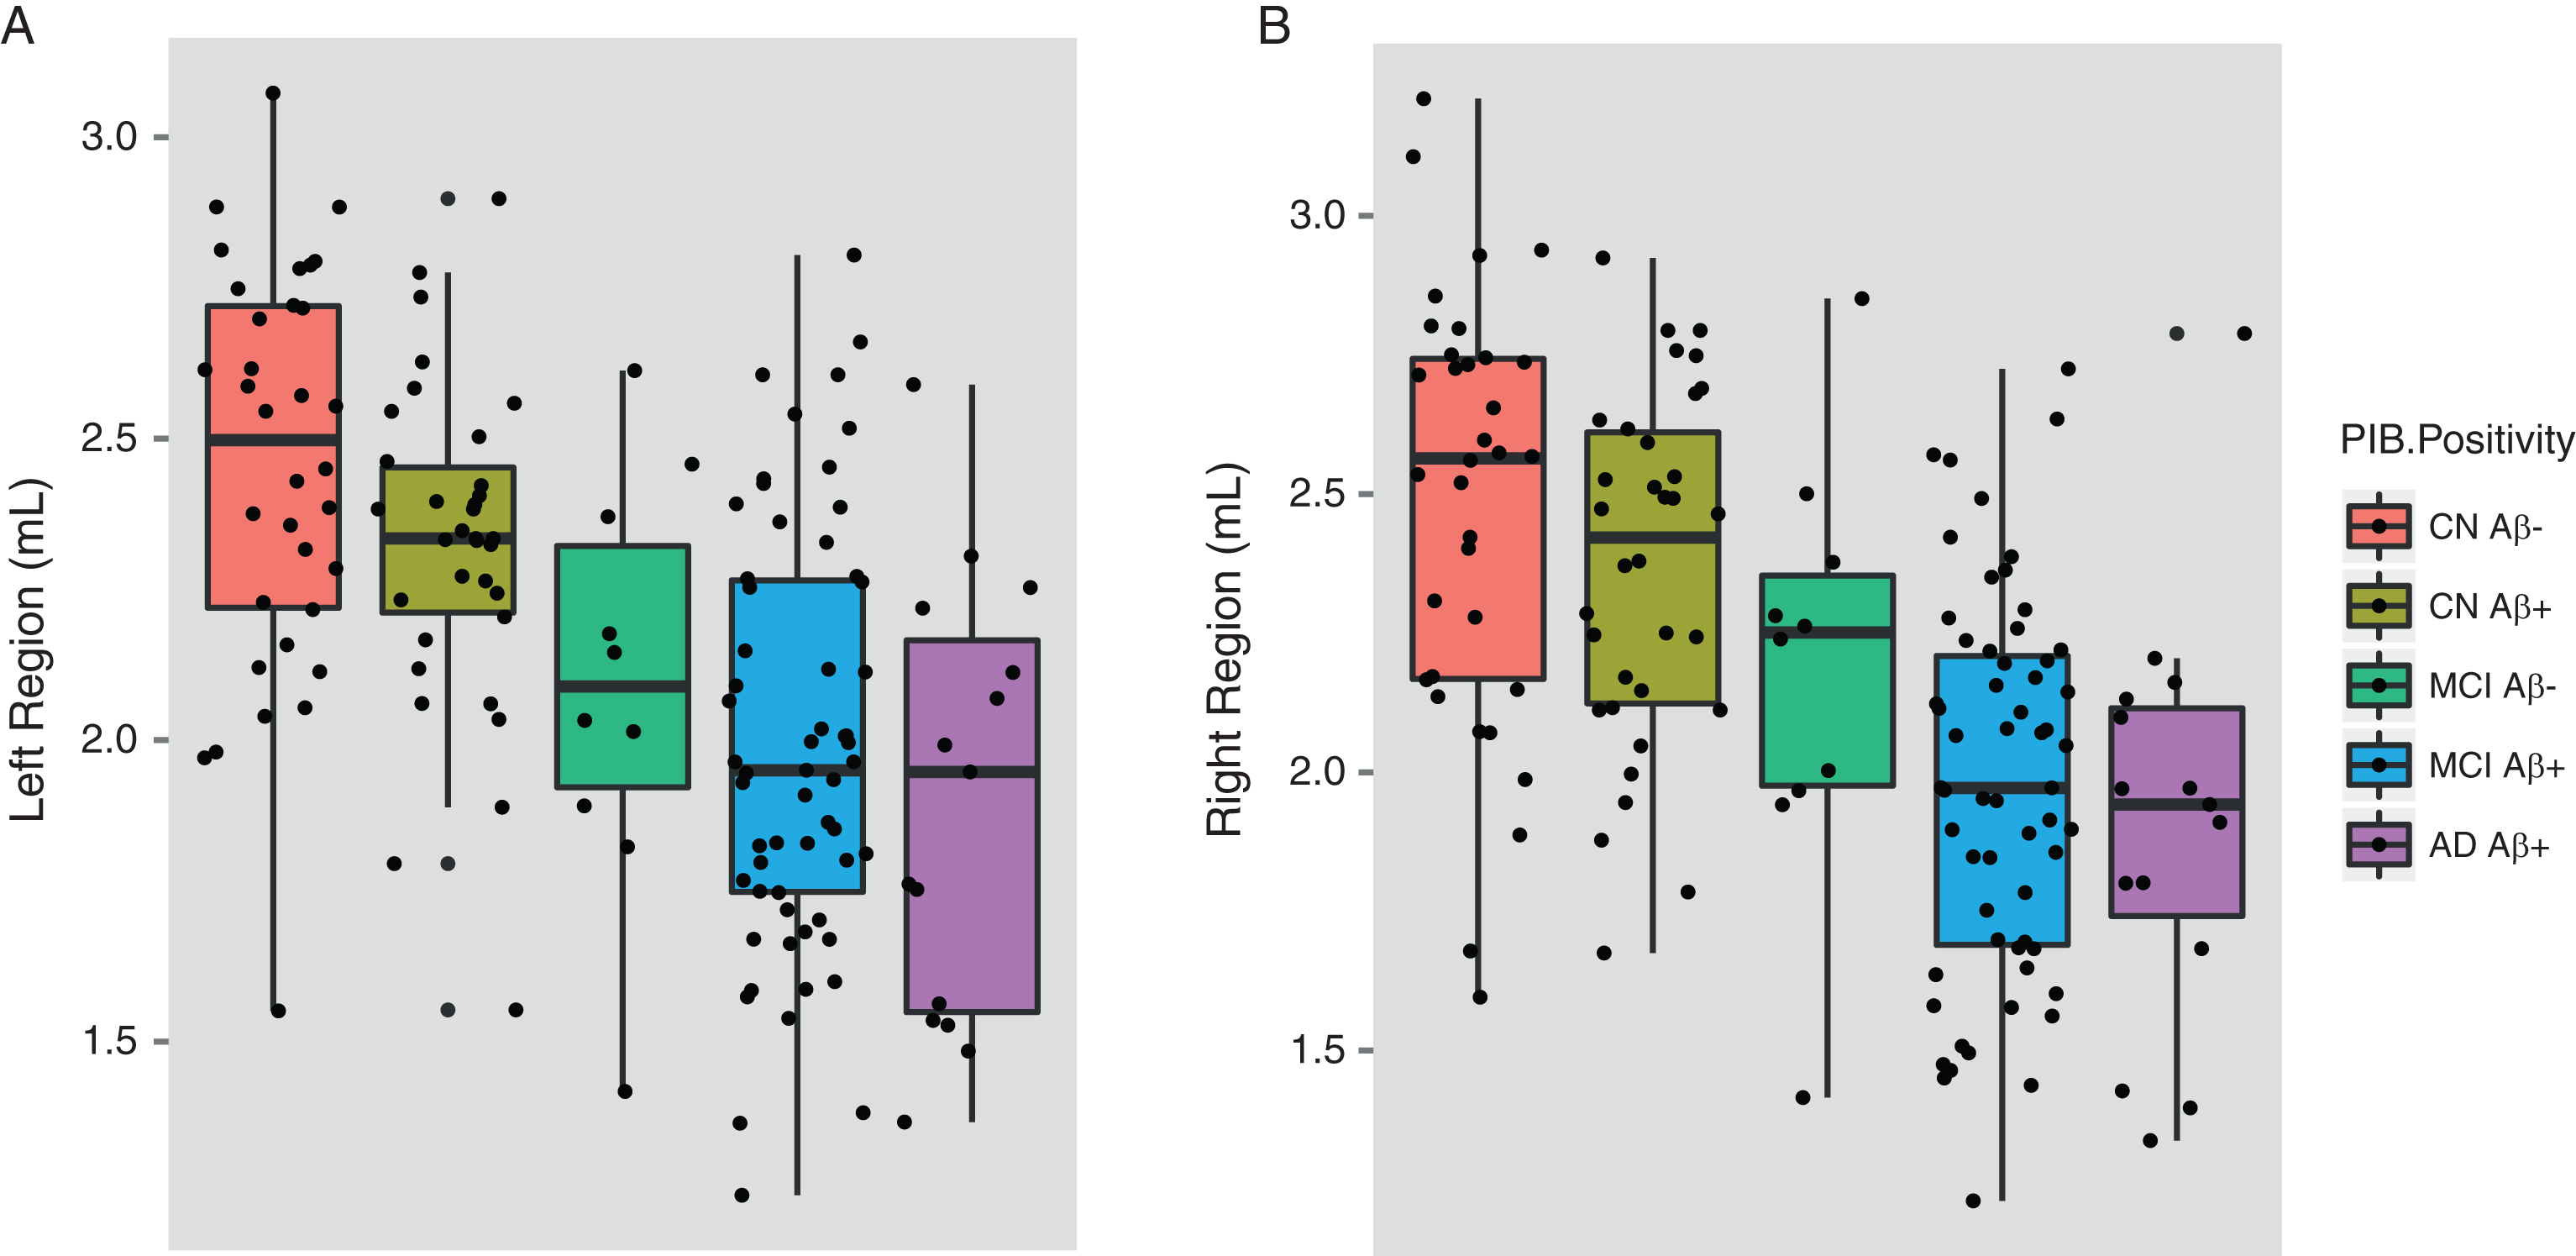
Table 1
Number of subjects obtained from each cohort study in the AD and normal aging dataset (n = 1,781)
| Cohort Study | Clinical Diagnosis | Number of subjects (%) |
| Alzheimer’s Disease Neuroimaging Initiative (n = 779) | Alzheimer’s disease | 177 (22.7%) |
| Mild Cognitive Impairment | 383 (49.2%) | |
| Healthy Controls | 219 (28.1%) | |
| AddNeuroMed study (n = 303) | Alzheimer’s disease | 109 (36.0%) |
| Mild Cognitive Impairment | 97 (32.0%) | |
| Healthy Controls | 97 (32.0%) | |
| Australian, Imaging, Biomarkers and Lifestyles (AIBL) study (n = 228) | Alzheimer’s disease | 46 (20.2%) |
| Mild Cognitive Impairment | 42 (18.4%) | |
| Healthy Controls | 140 (61.4%) | |
| Biomedical Research Centre for Dementia, King’s College London (BRC-AD) study (n = 89) | Alzheimer’s disease | 33 (37.1%) |
| Healthy Controls | 56 (62.9%) | |
| Swedish National study on aging and care in Kungscholmen (SN-ACK) (n = 382) | Healthy Controls | 382 (100%) |
Table 2
Demographic characteristics of 1) the AD and normal aging dataset by subject group and 2) the IMAGEN study of healthy adolescents
| ɛ2 carriers | ɛ3 carriers | ɛ4 carriers | ||
| (n = 344) | (n = 1754) | (n = 1070) | ||
| ɛ2/ɛ3 (n = 326) | ɛ3 | ɛ4/ɛ3 (n = 893) | p-value | |
| ɛ2/ɛ2 (n = 18) | Homozygotes | ɛ4/ɛ4 (n = 177) | ||
| 1) AD and Normal Aging Dataset (n = 1,781) | ||||
| i) AD (n = 375) | ||||
| Number of subjects (n (%)) | 17 (4.5) | 125 (33.3) | 223 (59.5) | –– |
| Age (years) | 78.1±6.6 | 76.9±7.4 | 74.9±6.7 | 0.016 |
| Male (n (%)) | 4 (23.5) | 56 (44.8) | 112 (50.2) | 0.085 |
| Education | 12.0±3.6 | 11.8±5.1 | 12.2±4.5 | 0.847 |
| MMSE | 21.3±5.8 | 22.1±4.1 | 22.1±3.7 | 0.734 |
| ICV (mL) | 1437±165 | 1520±166 | 1532±188 | 0.110 |
| ii) MCI (n = 522) | ||||
| Number of subjects (n (%)) | 29 (5.6) | 233 (44.6) | 260 (49.8) | –– |
| Age (years) | 75.6±7.1 | 75.3±7.5 | 74.2±6.9 | 0.186 |
| Male (n (%)) | 15 (2.9) | 144 (27.6) | 152 (29.1) | 0.508 |
| MMSE | 27.6±1.4 | 27.1±1.8 | 26.8±1.8 | 0.016 |
| ICV (mL) | 1491±173 | 1558±173 | 1559±169 | 0.123 |
| iii) CN individuals (n = 512) | ||||
| Number of subjects (n (%)) | 66 (12.9) | 275 (53.7) | 171 (33.4) | –– |
| Age (years) | 75.8±6.5 | 75.9±6.3 | 75.6±6.2 | 0.936 |
| Male (n (%)) | 28 (5.5) | 139 (27.1) | 84 (16.4) | 0.495 |
| MMSE | 28.9±1.1 | 29.0±1.1 | 29.1±1.1 | 0.537 |
| ICV (mL) | 1506±174 | 1521±162 | 1518±160 | 0.797 |
| iv) SNAC-K (n = 382) | ||||
| Number of subjects (n (%)) | 45 (11.8) | 239 (62.6) | 98 (25.7) | –– |
| Age (years) | 67.9±7.8 | 70.1±8.6 | 69.5±8.6 | 0.269 |
| Male (n (%)) | 15 (3.9) | 102 (26.7) | 37 (9.7) | 0.420 |
| MMSE | 29.2±0.9 | 29.2±1.0 | 29.1±1.1 | 0.365 |
| ICV (mL) | 1478±265 | 1509±248 | 1522±275 | 0.649 |
| 2) IMAGEN (n = 1,387) | ||||
| Number of subjects (n (%)) | 187 (13.5) | 882 (63.6) | 318 (22.9) | –– |
| Age (years) | 14.4±0.4 | 14.5±0.4 | 14.5±0.4 | 0.523 |
| Male (n (%)) | 97 (7.0) | 437 (31.5) | 152 (11) | 0.674 |
| Body Mass Index (BMI) | 20.6±3.2 | 20.7±3.6 | 20.8±3.3 | 0.843 |
| CANTAB SWM | 31.3±5.3 | 31.2±5.5 | 31.0±5.5 | 0.866 |
| Verbal IQ | 109.6±15.7 | 111.6±15.5 | 111.0±14.9 | 0.258 |
| Nonverbal IQ | 106.5±14.9 | 107.8±14.4 | 107.7±14.1 | 0.523 |
| ICV (mL) | 1472±155 | 1487±156 | 1490±162 | 0.397 |
MMSE, Mini-Mental State Examination; ICV, intracranial volume; CANTAB SWM, Cambridge Neuropsychological Test Automated Battery [CANTAB] Spatial Working Memory; IQ, intelligence quotient. Data are Mean±SD. Percentages are displayed in parentheses.
Table 3
Hippocampal volume results by ApoE genotype in each subject group
| ɛ2 carriers | ɛ3 Homozygotes | ɛ4 carriers | p-value | t-value | Pairwise Difference | |
| (ɛ4 versus | (ɛ2> ɛ3> ɛ4) | |||||
| ɛ2 carrier) | ||||||
| Alzheimer’s disease | ||||||
| (n = 365) | ||||||
| Left Hippocampus | 2.00 | 1.91 | 1.80 | 0.0001 | –2.2 | ɛ4< ɛ3 = 0.0006; |
| (0.11; 1.77–2.22) | (0.04; 1.83–1.97) | (0.02; 1.75–1.84) | ɛ4< ɛ2 = 0.07; | |||
| ɛ3< ɛ2 = 0.86 | ||||||
| Right Hippocampus | 2.04 | 1.98 | 1.81 | <0.0001 | –2.3 | ɛ4< ɛ3 = <0.0001; |
| (0.12; 1.80–2.29) | (0.04; 1.91–2.06) | (0.02; 1.77–1.86) | ɛ4< ɛ2 = 0.042; | |||
| ɛ3< ɛ2 = 0.99 | ||||||
| Mild Cognitive Impairment | ||||||
| (n = 522) | ||||||
| Left Hippocampus | 2.22 | 2.09 | 1.97 | <0.0001 | –3.4 | ɛ4< ɛ3 = 0.0004; |
| (0.06; 2.09–2.35) | (0.03; 2.03–2.14) | (0.02; 1.93–2.02) | ɛ4< ɛ2 = 0.0015; | |||
| ɛ3< ɛ2 = 0.19 | ||||||
| Right Hippocampus | 2.27 | 2.13 | 2.01 | <0.0001 | –3.3 | ɛ4< ɛ3 = <0.0001; |
| (0.06; 2.14–2.39) | (0.03; 2.07–2.18) | (0.02; 1.97–2.05) | ɛ4< ɛ2 = 0.0019; | |||
| ɛ3< ɛ2 = 0.22 | ||||||
| Healthy Controls (n = 512) | ||||||
| Left Hippocampus | 2.40 | 2.36 | 2.30 | 0.052 | –1.9 | ɛ4< ɛ3 = 0.076; |
| (0.04; 2.32–2.47) | (0.02; 2.32–2.40) | (0.03; 2.25–2.36) | ɛ4< ɛ2 = 0.367; | |||
| ɛ3< ɛ2 = 0.865 | ||||||
| Right Hippocampus | 2.43 | 2.39 | 2.33 | 0.053 | –2.0 | ɛ4< ɛ3 = 0.085; |
| (0.04; 2.35–2.51) | (0.02; 2.34–2.51) | (0.03; 2.27–2.39) | ɛ4< ɛ2 = 0.115; | |||
| ɛ3< ɛ2 = 0.827 | ||||||
| Population-based sample of | ||||||
| non-demented elders: | ||||||
| SNAC-K study (n = 382) | ||||||
| Left Hippocampus | 2.72 | 2.56 | 2.56 | 0.395 | –1.9 | ɛ4< ɛ3 = 0.660; |
| (0.08; 2.56–2.87) | (0.03; 2.49–2.62) | (0.06; 2.45–2.67) | ɛ4< ɛ2 = 0.367; | |||
| ɛ3< ɛ2 = 0.669 | ||||||
| Right Hippocampus | 2.66 | 2.53 | 2.53 | 0.509 | –2.0 | ɛ4< ɛ3 = 0.625; |
| (0.08; 2.50–2.82) | (0.03; 2.46–2.59) | (0.06; 2.42–2.64) | ɛ4< ɛ2 = 0.530; | |||
| ɛ3< ɛ2 = 0.868 | ||||||
| Healthy 14-year-old adolescents: | ||||||
| IMAGEN study (n = 1,387) | ||||||
| Left Hippocampus | 2.88 | 2.86 | 2.88 | 0.972 | –0.3 | ɛ4< ɛ3 = 0.714; |
| (0.02; 2.84–2.93) | (0.01; 2.84–2.88) | (0.02; 2.84–2.92) | ɛ4< ɛ2 = 0.960; | |||
| ɛ3< ɛ2 = 0.611 | ||||||
| Right Hippocampus | 2.95 | 2.91 | 2.94 | 0.751 | –0.8 | ɛ4< ɛ3 = 0.399; |
| (0.02; 2.91–3.00) | (0.01; 2.89–2.93) | (0.02; 2.91–2.97) | ɛ4< ɛ2 = 0.731; | |||
| ɛ3< ɛ2 = 0.136 |
Data are mean (SE; min-max). Mean values of normalized hippocampal volumes are reported.
Table 4
Hippocampal volume comparisons of ApoE ɛ4 carriers (ɛ4+) from different subject groups
| AD ɛ4+ group | MCI ɛ4+ group | healthy controls | SNAC-K elderly | p-value | Pairwise Difference | |
| (n = 223) | (n = 260) | ɛ4+ group | ɛ4+ group | (t-value; p-value) | ||
| (n = 171) | (n = 98) | |||||
| ɛ3/ɛ4 (n = 159) | ɛ3/ɛ4 (n = 203) | ɛ3/ɛ4 (n = 151) | ɛ3/ɛ4 (n = 84) | |||
| ɛ4/ɛ4 (n = 64) | ɛ4/ɛ4 (n = 57) | ɛ4/ɛ4 (n = 20) | ɛ4/ ɛ4 (n = 14) | |||
| Left Hippocampus | 1.79 | 1.97 | 2.30 | 2.56 | <0.0001 | AD versus MCI = –5.7; <0.001 |
| (0.02; 1.75–1.84) | (0.02; 1.93–2.02) | (0.03; 2.25–2.36) | (0.06; 2.45–2.67) | AD versus CTL = –14.0; <0.001 | ||
| AD versus SNAC-K = –8.7; <0.001 | ||||||
| MCI versus CTL = –9.0; <0.001 | ||||||
| MCI versus SNAC-K = –6.3; <0.001 | ||||||
| SNACK versus CTL = 1.9; 0.208 | ||||||
| Right Hippocampus | 1.81 | 2.01 | 2.33 | 2.53 | <0.0001 | AD versus MCI = –6.0; <0.001 |
| (0.02; 1.77–1.86) | (0.02; 1.97–2.05) | (0.03; 2.27–2.39) | (0.06; 2.42–2.64) | AD versus CTL = –13.4; <0.001 | ||
| AD versus SNAC-K = –7.9; <0.001 | ||||||
| MCI versus CTL = –8.1; <0.001 | ||||||
| MCI versus SNAC-K = –5.3; <0.001 | ||||||
| SNAC-K versus CTL = 1.2; 0.579 |
Data are presented as the mean of normalized hippocampal volumes (Volume/ICV×1000). SE with min-max is shown in parentheses.
Table 5
Hippocampal volume comparisons of ApoE ɛ2 carriers (ɛ2+) from different subject groups
| AD ɛ2+ group | MCI ɛ2+ group | healthy controls | SNAC-K elderly | p-value | Pairwise Difference | |
| (n = 17) | (n = 29) | ɛ2+ group | ɛ2+ group | (t-value; p-value) | ||
| (n = 66) | (n = 45) | |||||
| ɛ3/ɛ2 (n = 17) | ɛ3/ɛ2 (n = 29) | ɛ3/ɛ2 (n = 64) | ɛ3/ɛ2 (n = 42) | |||
| ɛ2/ɛ2 (n = 0) | ɛ2/ɛ2 (n = 0) | ɛ2/ɛ2 (n = 2) | ɛ2/ɛ2 (n = 3) | |||
| Left Hippocampus | 2.00 | 2.22 | 2.40 | 2.72 | 0.0003 | AD versus MCI = –2.1; 0.141 |
| (0.11; 1.77–2.22) | (0.06; 2.09–2.35) | (0.04; 2.32–2.47) | (0.08; 2.56–2.87) | AD versus CTL = –4.0;<0.001 | ||
| AD versus SNAC-K = –3.6; 0.002 | ||||||
| MCI versus CTL = –1.9; 0.211 | ||||||
| MCI versus SNAC-K = –2.1; 0.137 | ||||||
| SNAC-K versus CTL = 1.0; 0.753 | ||||||
| Right Hippocampus | 2.04 | 2.27 | 2.43 | 2.66 | 0.0035 | AD versus MCI = –2.1; 0.144 |
| (0.12; 1.80–2.29) | (0.06; 2.14–2.39) | (0.04; 2.35–2.51) | (0.08; 2.50–2.82) | AD versus CTL = –3.8;<0.001 | ||
| AD versus SNAC-K = –2.1; 0.129 | ||||||
| MCI versus CTL = –1.5; 0.410 | ||||||
| MCI versus SNAC-K = –0.9; 0.796 | ||||||
| SNAC-K versus CTL = 0.2; 0.998 |
Table 6
Demographic characteristics of ɛ4 carriers from the ADNI and AIBL study divided into Aβ+ and Aβ–participants
| AD Aβ+ | MCI Aβ+ | MCI Aβ– | CN Aβ+ | CN Aβ– | p-value | |
| ADNI study (n = 95) | ||||||
| Number of subjects (n (%)) | 8 (8.4) | 58 (61.0) | 7 (7.4) | 14 (14.7) | 8 (8.4) | –– |
| Age (years) | 70.2±7.3 | 72.5±7.3 | 77.3±4.9 | 77.1±3.4 | 75.1±4.0 | 0.041 |
| Male (%) | 4 (7.1) | 37 (66.1) | 5 (8.9) | 4 (7.1) | 6 (10.7) | 0.113 |
| MMSE | 23±1.7 | 27.2±1.7 | 27.1±1.9 | 29.4±0.8 | 29.4±0.9 | <0.001 |
| ICV (mL) | 1556±210 | 1583±198 | 1494±176 | 1429±98 | 1591±209 | 0.08 |
| AIBL study (n = 57) | ||||||
| Number of subjects (n (%)) | 7 (12.2) | 1 (1.8) | 3 (5.3) | 20 (35.0) | 26 (45.6) | –– |
| Age (years) | 77.7±7.8 | 58±–– | 79.7±12.0 | 78.1±6.5 | 71.5±5.8 | 0.001 |
| Male (%) | 1 (3.7) | 1 (3.7) | 1 (3.7) | 10 (37.0) | 14 (51.9) | 0.296 |
| MMSE | 19.4±3.8 | 27.0±–– | 27.7±2.5 | 27.4±3.1 | 27.2±4.3 | <0.001 |
| ICV (mL) | 1466±87 | 1515±–– | 1592±301 | 1535±159 | 1545±165 | 0.781 |
MMSE, Mini-Mental State Examination; ICV, intracranial volume. Bolded values are significant at p < 0.05 or the p < 0.001 level. In the ADNI study, of the 95 subjects who underwent PET neuroimaging, 66 were scanned using 18F-florbetapir and 29 using 11C-Pittsburgh Compound B (PiB). In the AIBL study, all subjects underwent PET neuroimaging using PiB.
Table 7
Hippocampal volume results in CN individuals, MCI subjects, and AD patient ɛ4 carriers by levels of Aβ deposition
| CN Aβ– | CN Aβ+ | MCI Aβ– | MCI Aβ+ | AD Aβ+ | p-value | Pairwise Difference | |
| (n = 34) | (n = 34) | (n = 10)¥ | (n = 27)¥ | (n = 15) | (Cohen’s d; p-value) | ||
| (versus CN Aβ– ɛ4+) | |||||||
| Left Hippocampus | 2.42 (0.052) | 2.39 (0.053) | 2.18 (0.095) | 1.97 (0.04) | 1.88 (0.078) | <0.0001 | CN Aβ+ = –0.08; 0.692 |
| MCI Aβ– = –0.42;<0.0001 | |||||||
| MCI Aβ+ = –1.26;<0.0001 | |||||||
| AD Aβ+ = –1.09;<0.0001 | |||||||
| Right Hippocampus | 2.45 (0.056) | 2.44 (0.058) | 2.27 (0.01) | 1.94 (0.043) | 1.90 (0.084) | <0.0001 | CN Aβ+ = –0.01; 0.946 |
| MCI Aβ– = –0.29; 0.147 | |||||||
| MCI Aβ+ = –1.26;<0.0001 | |||||||
| AD Aβ+ = –1.02;<0.0001 |
Data are presented as the estimated marginal mean of normalized hippocampal volumes and SE in parentheses. ¥MCI follow diagnosis was available for ADNI (0–36 months) and AIBL (0–54 months).

