Dry and Wet Events in Andean Populations of Northern Peru: A Case Study of Chachapoyas, Peru
 Jesús Rascón1*
  Wildor Gosgot Angeles1 Lenin Quiñones Huatangari2 Manuel Oliva1 Miguel Ángel Barrena Gurbillón1
- 1Instituto de Investigación para el Desarrollo Sustentable de Ceja de Selva, Universidad Nacional Toribio Rodríguez de Mendoza de Amazonas, Chachapoyas, Peru
- 2Facultad de Ingeniería de Industrias Alimentarias, Universidad Nacional de Jaén, Cajamarca, Peru
Climate change and population growth have heavily impacted the ecosystem’s water resources, essential for anthropogenic activities. These also apply to the Andean city of Chachapoyas, located in the north of Peru, which has gone through a substantial population increase in recent years, therefore increasing its water demand. This research aimed to assess dry and wet events from 1981 to 2019 that have taken place in Chachapoyas, by applying the Standardized Precipitation Index (SPI), and the Standardized Precipitation Evapotranspiration Index (SPEI). These events were periodically characterized, and the index relationship was determined at different timescales. The SPI and SPEI indices were calculated at the city’s only weather station for timescales of 3, 6, 12, and 24 months using climatic data. The indices showed a remarkably consistent behavior for timescales of 12 and 24 months detecting an extreme drought event in 1993, while for timescales of 3 and 6 months a severe drought event was detected in the same year. Contrastingly, there has been an increase in extreme wet events in the last decade, hence Chachapoyas is categorized between "moderate drought" and “moderate wet”. It should be noted that the indices have a high correlation between them when calculated for the same timescale. The results were statistically significant (p < 0.05). Considering the results obtained related to dry and wet events and their relation with economic activities such as environmental management, we can conclude that the SPI and SPEI indices are useful and valuable tools for local and regional governments.
Introduction
Climate change, a potentially destructive event with catastrophic consequences for humanity and ecosystems (Lin and Chan, 2015), affects precipitation, temperature, humidity, and winds. Thus, strongly impacting agriculture, agricultural communities, food sovereignty, and the sustainability of the world's population at risk, especially in developing countries (Nicholls and Altieri, 2019). Several studies carried out in Latin America, demonstrate that crop yields will significantly decrease, hence severely affecting the availability of food (Jones and Thornton, 2003; Jat et al., 2016; Altieri and Nicholls, 2017; Sá et al., 2017).
Rainfall variability in dry and wet events is entirely subjective depending on where in the world they happen. (Van Loon and Laaha, 2015). For example, extreme droughts in sub-Saharan countries are not the same as in the tropical Andes. Nevertheless, droughts are defined as natural weather events, where there is a significant precipitation deficit over a relatively long period of time (Cerón et al., 2015). The prediction of these events is complex as they depend on the study area (Sánchez-Montoya et al., 2018). Furthermore, these events are usually poorly characterized, due to the difficulty of quantifying their severity, magnitude, and extent (Quintana-Seguí et al., 2016).
Droughts can be classified into four categories: meteorological, agricultural, hydrological, and socioeconomic. Meteorological drought is a consequence of a rainfall deficit. Agricultural drought implies low soil moisture that causes a decline in crop growth and production. Hydrological drought refers to low levels of surface and groundwater. Socioeconomic drought is associated with the supply and demand of water needed for economic good and is affected by the combination with some of the other droughts (Wilhite and Glantz, 1985; Dai, 2011; Van Loon and Laaha, 2015; Zhang L. et al., 2017; Zarei, 2019). However, meteorological drought can be considered the leading cause of a drought. In contrast, other droughts represent the impacts generated by a prolonged deficit of precipitation in certain compartments, such as soil moisture, surface water levels, or economic sectors (Stojanovic et al., 2017). Meteorological droughts are defined as intervals of time during which a specific area’s humidity consistently drops below what is climatologically expected (Huang et al., 2017). Droughts are characterized by indices, which are indirect indicators that rely on meteorological information to quantify these phenomena and assess their effects (Hao et al., 2016). In recent decades, several indices have been developed for drought characterization (Zhang L. et al., 2017). The most superficial indices use only precipitation data, while the most complex use parameters such as temperature, evapotranspiration or loss of soil humidity, etc. (Liu et al., 2018). The most recognized indices are the Standardized Precipitation Index (SPI), the Palmer Drought Severity Index (PDSI), the Standardized Precipitation Evapotranspiration Index (SPEI), the Crop Moisture Index (CMI), the Rainfall Anomaly Index (RAI), and the Effective Drought Index (EDI) (Bohn et al., 2007; Ahmad et al., 2016; Aybar-Camacho et al., 2017; Balbo et al., 2019). The most used indices are SPI and SPEI due to their lower complexity (Anshuka et al., 2019), however, they exhibit advantages and disadvantages for their application in the characterization of dry and wet events (Hayes et al., 1996; Tsakiris and Vangelis, 2004; Zhang Y. et al., 2017). Among their advantages are straightforward calculations, and the ability to identify different types of dry or wet events by having multiscale criteria. Being the scales of 1, 3, and 6 months relevant for agricultural drought impacts; the 12 months scale is especially relevant for hydrological drought impacts; the 24 months scale is relevant for socioeconomic drought impacts (Tan et al., 2015). Conversely, their major disadvantage is the tendency to underestimate or overestimate dry and wet events when applied to shorter timescales (Anshuka et al., 2019).
Droughts in South America are of particular interest due to their effects on agriculture, livestock, soil degradation, water management, economy, and society. The study of dry events in this area, whether by evaluating the variables implicated or by applying indices, has been carried out to find out their relationship with the El Niño phenomenon (Espinoza et al., 2011; Sobral et al., 2019; Mohammadi et al., 2020), their connection with climate change (Vicente-Serrano et al., 2015) or their effect on vegetation (Feldpausch et al., 2016).
The city of Chachapoyas is located in the northern Andes of Peru. It is an area of great importance, not only because it is the Amazonas region’s capital, but because it is a city that economically depends on livestock and agriculture. The effects of dry and wet events have been thoroughly studied in central and south Ecuador, a predominately Andean region. Studies in this area have concluded that Quito is a good indicator of drought in this region. It was also found that climate change will affect the drought’s characteristics, such as magnitude and duration, with a drastic decrease in future scenarios in this area (Domínguez-Castro et al., 2017; Zhiña et al., 2019). However, there are very few studies that report reliable data from remote areas of the Peruvian Andes. In Peru’s Central Andes, it has been found that there is a 2% decrease in rainfall per decade. Meanwhile, in the southern Andes of Peru, the most intense droughts between 1981 and 2016 occurred during the El Niño events of that period. It is worth mentioning the elaboration of a precipitation danger map for the Peruvian Andes in terms of the intensity and duration of droughts, being entirely satisfactory considering that it is based on a low-density meteorological network (Silva et al., 2008; Domínguez-Castro et al., 2018; Imfeld et al., 2019).
Most of the antecedents mentioned earlier are at medium or large scale, without having a regional scale. Therefore, it is necessary to study dry and wet events at a local scale, especially in an Andean city in northern Peru, to increase and improve water resources management knowledge. Therefore, the dry and wet events that occurred from 1981 to 2019 in the city of Chachapoyas are analyzed. At the same time, the main climatological parameters were analyzed descriptively. In addition, the SPI and SPEI indices were applied and compared, to identify temporarily dry and wet events. Finally, the relation of the indices throughout different time scales was analyzed. All this will help to have a better understanding of water availability in the area.
Materials and Methods
Study Area
The city of Chachapoyas is located in the northern Peruvian Andes (Figure 1), at 2,338 m.a.s.l. with an average annual precipitation of about 800 mm and an average temperature of 15.6°C. The annual temperature oscillation is very low, with 1°C on average monthly temperatures. The lowest minimum monthly temperature values are reported between June and August (Figure 2A), while the highest maximum monthly temperature values happen from August to December (Figure 2B). As in other Andean regions, rainfall is seasonal, with a wet season from October to March, and a dry season from April to September (Figure 2C) (Rascón et al., 2020). In respect to the water resources of the city of Chachapoyas, they are in the form of rainwater and surface water. Within the superficial waters, emphasizing the Tialacancha River, that supplies potable water to the city, and lops Santa Lucia, Villohuayco, and Jatunsacha streams, which serve to supply to the cattle ranch and agriculture of the zone (Chávez Ortiz et al., 2016; Salas et al., 2018). Although, as in most Andean cities, very few climate studies are available due to the absence of reliable weather station networks. Chachapoyas possesses only one meteorological station (LAT -6.2083, LONG -77.8671, ELEV 2442), which belongs to the meteorological stations’s network of the National Meteorology and Hydrology Service of Peru (SENAMHI). However, this station presents substantial gaps in its data, especially in past readings. That is why the PISCO (Peruvian Interpolated data of the SENAMHI’S Climatological and hydrological Observation) data grid was used.
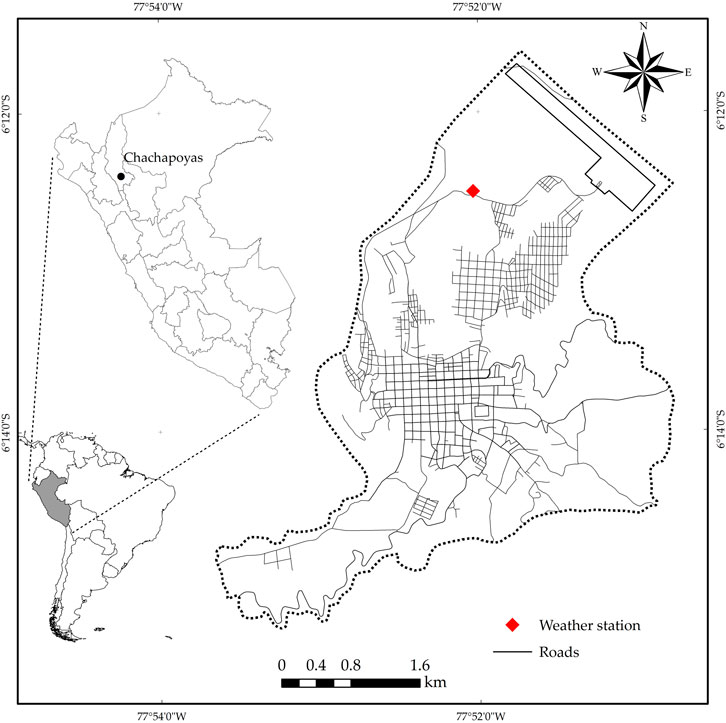
FIGURE 1. Geographic localization of study area.
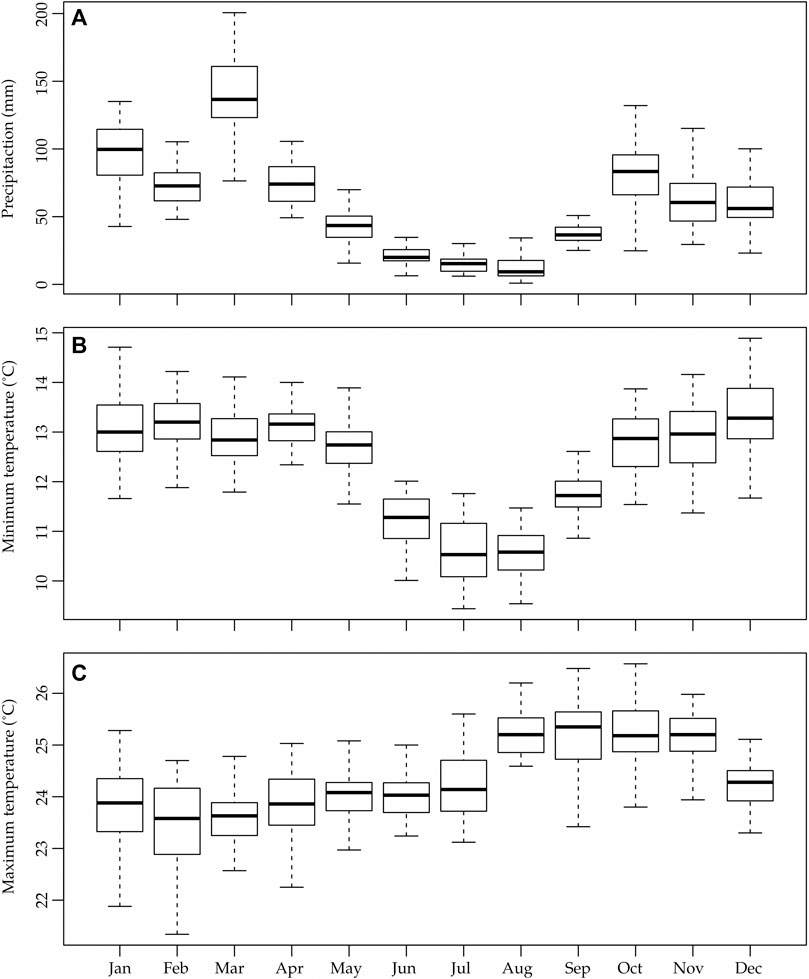
FIGURE 2. Annual behavior of rainfall (A), minimum temperature (B) and maximum temperature (C) in the city of Chachapoyas. The upper whisker of each boxplot indicates the maximum value of each parameter in each month, while the lower whisker indicates the minimum value of each parameter in each month, for the entire data series from January 1981 to December 2019.
Weather Data
Climatological data was obtained from the National Meteorological and Hydrological Service of Peru (SENAMHI), specifically, from the spatial database for monthly precipitation at a grid resolution of 0.05° for a series starting in January 1981 to the present, called PISCO, both for monthly precipitation, minimum and maximum monthly temperature. This grid was created using terrestrial observations from the SENAMHI meteorological stations’ network, together with data from the global base of the CHIRPS project (Climate Hazards InfraRed Precipitation with Station data) (Aybar et al., 2019).
The generation of the PISCO climate data grid encountered several limitations, such as the low-density of stations in areas with complex geography, the low quality of the station data, and the biases inherent in satellite data. Therefore, PISCO was generated based on the integration of CHIRP data, serially complete gauge datasets, radar-based climatologies, and geostatistical and deterministic interpolation methods (Aybar et al., 2019). For the quality control of the grid, automatic control was applied, evaluating the data of each station, the god ranges, the temporal and spatial coherence. In this way, they eliminated outliers in the data that exceeded the established limits. Later, through data visualization they inspected the breaks evident in the time series and eliminated the non-homogeneous segments, filling in the gaps by using the modified CUTOFF algorithm and quantum maps. As a result, there is a high correlation between the grid data and the stations (0.75–0.99), with the higher the correlation, when there is a station closer (Aybar-Camacho et al., 2017). PISCO data are available free of charge on the following website: http://iridl.ldeo.columbia.edu/SOURCES/.SENAMHI/.HSR/.PISCO/. Therefore, they were processed with the statistical software R version 3.6.3, through the “raster” and “ncdf4” libraries (Pierce, 2019; Hijmans, 2020; R Core Team, 2020). Monthly data from the Chachapoya’s weather station were obtained for the 1981–2019 period for precipitation, minimum and maximum temperatures.
Drought Indices
Drought indices were developed to provide a quantitative assessment of the characteristics of each drought event. The most simple indices solely use average rainfall data, while other more sophisticated indices use other parameters such as temperature, evapotranspiration, loss of soil moisture, and prior soil moisture (Zhang et al., 2019).
The SPI, developed by Mckee et al. (1993) quantifies precipitation deficit to evaluate droughts. This method is highly recommended by the World Meteorological Organization (WMO) for drought characterization (Kostopoulou et al., 2017). SPI is calculated by adjusting a gamma probability distribution to a standardized normal distribution (with a mean equal to zero and variance equal to one), thus calculating the final SPI value (Mineo et al., 2019). It was determined that the gamma distribution was the distribution that best fitted the precipitation data, because of its good adjustment. This distribution provides good models to describe precipitation events, and besides, it has been frequently used in previous investigations carried out in Andean zones (González and Dominguez, 2012; González, 2015; Zambrano et al., 2017; Endara et al., 2019; Cerón et al., 2020). First, the SPI adjusts the gamma probability density function (PDF) of the precipitation record for each weather station. Then, the adjusted values are transformed to the normal PDF, which represents the SPI value. For periods of time greater than 1 month, the initial basic procedure for SPI estimation is to use moving sums. By having a long and reliable series (30 years or more) it is possible to calculate the SPI for any previously registered month (i months). The SPI enables researchers to determine the rareness of a drought or an anomalous wet event at a particular timescale for any place in the world. It is important to mention that, for this study, the SPI was carried out for timescales of 3, 6, 12, and 24 months.
In contrast to the SPI, which solely uses precipitation data; the SPEI, developed by Vicente-Serrano et al. (2010), is a new and more comprehensive multiscale index. This index integrates precipitation data, temperature data, and variables like evapotranspiration. It is noted that several formulae, such as the Thornthwaite, Hargreaves, and Penman-Monteith equations are utilized to determine evapotranspiration values in order to calculate SPEI (Stagge et al., 2014). Furthermore, tools that provide objective and quantitative assessments of drought severity can be developed from the aforementioned indices (Vicente-Serrano et al., 2012). Hence, generating a valid and accurate database that enables constant monitoring of event conditions through early warnings (Avilés et al., 2015). From these, adaptation and mitigation strategies can be formulated or implemented in order to alleviate the impacts of these hazards (Cortez et al., 2018). The calculation procedure is similar to that of the SPI; however, the SPEI uses the differences between monthly precipitation and evapotranspiration values, which represents a simple climate water balance. This difference is then adjusted to a logistic distribution, which is then transformed to a standard normal distribution with a zero mean and one variance (Vicente-Serrano et al., 2010).
It should be emphasized that for their estimation, SPI and SPEI when using distributions adjusted to a normal distribution, will make the mean value of SPI and SPEI close to zero (Mckee et al., 1993; Vicente-Serrano et al., 2010).
The SPI and SPEI indices use the same classification for drought or humidity events. This classification divides the events into different categories, determined by index values (Table 1). To determine the occurrence of dry and wet events, a threshold was established between 1 and −1. These thresholds are those recommended by the WMO guidelines for SPI droughts (Zargar et al., 2011; World Meteorological Organization, 2012). They also correspond to a probability of occurrence of 0.159 (Agnew, 2000).
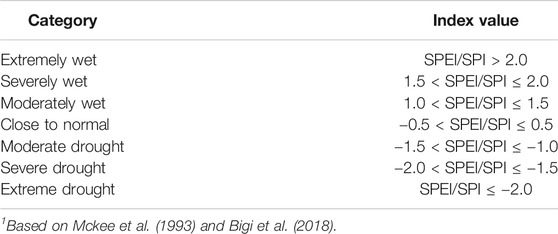
TABLE 1. SPI and SPEI classification and categories1.
Data Analysis
Firstly, a descriptive variable analysis was made from box plots, followed by a graphical comparison of indices for each timescale. Hence, defining the intensity, duration, and timescales of the most important dry and wet events. Subsequently, SPI and SPEI values were obtained through the use of the R software (version 3.6.3), the “SPEI” package for equivalent timescale (3, 6, 12, and 24 months), using precipitation data, minimum and maximum temperature, and the station’s latitude (Beguería and Vicente-Serrano, 2017; R Core Team, 2020). Although the best method for calculating evapotranspiration is the Penman-Monteith, there are several limitations to it due to the difficulty of obtaining meteorological parameters such as air humidity, wind speed, radiation, and atmospheric pressure. For this reason, the method proposed by Hargreaves (1994) was selected. In addition, some studies show a great correlation between the Penman-Monteith method and the Hargreaves method (Beguería et al., 2014).
Then, with SPI and SPEI values in different scales, the temporal analysis was made to know the evolution of the dry and wet events. For this, moderate, severe, and extreme dry and wet events were identified, comparing the index values with the classification determined in Table 1. On the other hand, using the indices as indicators, a drought or wet event for a time scale i, is defined as the period during which the index reaches values below -1 (drought) or above 1 (wet), ending when it reaches values between −1 and 1. With this, the duration and approximate timescale of such events is determined, being the intensity the value given by the indices. Simultaneously, using data previously obtained through descriptive statistics (average, maximum, minimum SPI and SPEI values at different scales, as well as their standard deviation), a temporal analysis was carried out in order to assess the behavior of the dry and wet events. Finally, because the higher timescales of the indices did not comply with the Smirnov-Kolmogorov assumption of normality (Wei and Simko, 2017; R Core Team, 2020), the Spearman rank-order correlation coefficient (p < 0.05) was calculated using the R software (version 3.6.3) with the “corrplot” package, to measure the level of correlation and direction that exists between the SPI and SPEI indices across timescales.
Results and Discussion
Historical Behavior of Climate Variables
Figure 3 shows that the highest average monthly precipitation data were collected from 1990 to 1999, followed by a decrease in 2000–2009, however recuperating in the current decade. Nevertheless, in the period 2010–2019, there was a drop in these temperatures. The climate water balance remained more or less constant during the first three decades, while in the last decade there were the conditions of lower deficit of the period studied, something ordinary, taking into account that rainfall in this decade has a rebound. The minimum monthly average temperatures have had a small increase during the first three decades. The maximum average monthly temperatures have behaved differently, with an increase from 1981–1989 to 1990–1999, and then a decrease in the following two decades. Additionally, the average monthly minimum and maximum temperatures have decreased by almost 0.5 °C compared to the 1990s. This behavior reflects that no important climatic events, such as El Niño, have taken place throughout the last decade (2001–2010) (OMM, 2012). El Niño is generally related to global warming, which causes temperatures to rise in the upper layers of the Pacific Ocean (Todd et al., 2018). However, until 2006, La Niña, decreasing temperatures of the Pacific Ocean’s surface, and neutral events were predominant. The aforementioned events were followed by a short-lived El Niño event, indicating that climate change’s long-term effects may have been masked by this natural variability (Castillo-Castillo et al., 2017).
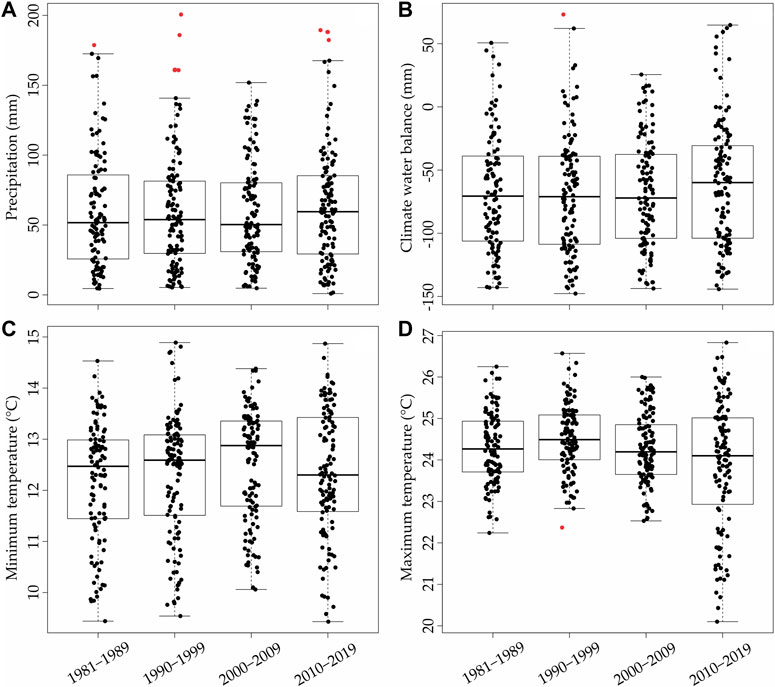
FIGURE 3. Historical precipitation behavior from 1981 to 2019 (A), climate water balance (B), minimum temperature (C) and maximum temperature (D), variables used for SPI and SPEI calculation. Red dots are outliers. Black dots correspond to the data for each parameter for the entire series studied.
SPI and SPEI Indices
SPI and SPEI results for the city of Chachapoyas were calculated for the time scales of 3, 6, 12, and 24 months. On a three month scale, the series shows high frequency oscillation (Figure 4), due to the short time in which the variables are taken into account, thus changes are assimilated at great speed (Kimaru et al., 2019). The behavior of both indices is quite similar. In general, values range from −3.0 to 2.0, with severe to moderate wet events being more frequent in the SPEI (Figure 4B). On the contrary, according to the SPI (Figure 4A), severe dry events intersperse with moderately wet events. In particular and according to the SPI values, the city of Chachapoyas experienced four extreme droughts (2001, 2005, 2010, and 2018). However, only one extreme event was reported by the SPEI (2010). Most of these detected dry events coincided with the years with the highest number of forest fires in the area of Chachapoyas, being the years of 2005, 2010, and 2018, the ones with more fires (Manríquez Zapata, 2019; Castillo et al., 2020). Therefore, the occurrence of fires could be associated with extreme dry events. Moreover, the SPI (2006, 2012, and 2018) reported, three extremely wet events although only one was noted by the SPEI (2018). It should be noted that there is a disparity between SPI and SPEI results from 2017 to 2019, where the SPEI indicates the occurrence of only wet events This disparity between the indices occurs because of the increase in precipitation, the only variable that the SPI index takes into account, occurs before the decrease in temperature, a variable that the SPEI requires to calculate the climate water balance(Stojanovic et al., 2020).
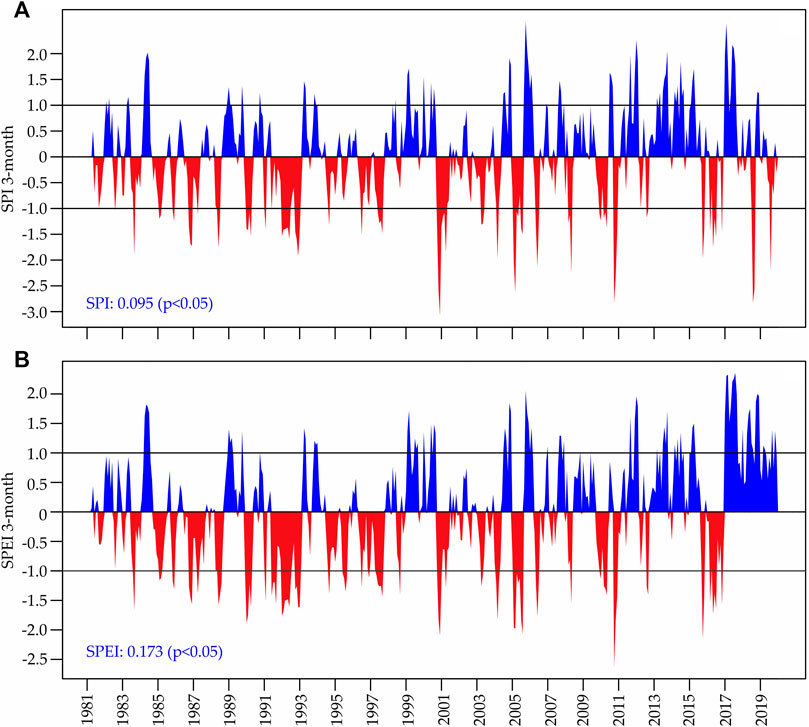
FIGURE 4. SPI 3-months (A) and SPEI 3-months (B) for the 1981–2019 period with wet, normal and drought bands. The amount of change (including the statistical significance) for each index is shown at the left bottom of each subgraphic.
The SPI and SPEI values on a 6-month time scale oscillate between −2.5 and 2.0 (Figure 5). Both dry and wet events were of lower intensity and longer duration, which is normal when the time scale is increased (Vicente-Serrano et al., 2010; Kimaru et al., 2019). In this scale, the SPI (Figure 5A), is the only one that indicated that two extreme droughts took place in 2001 and 2005, in contrast to SPEI (Figure 5B), which classifies the same droughts as severe. On this scale, both indices continue to show disparity from 2017 to 2019.
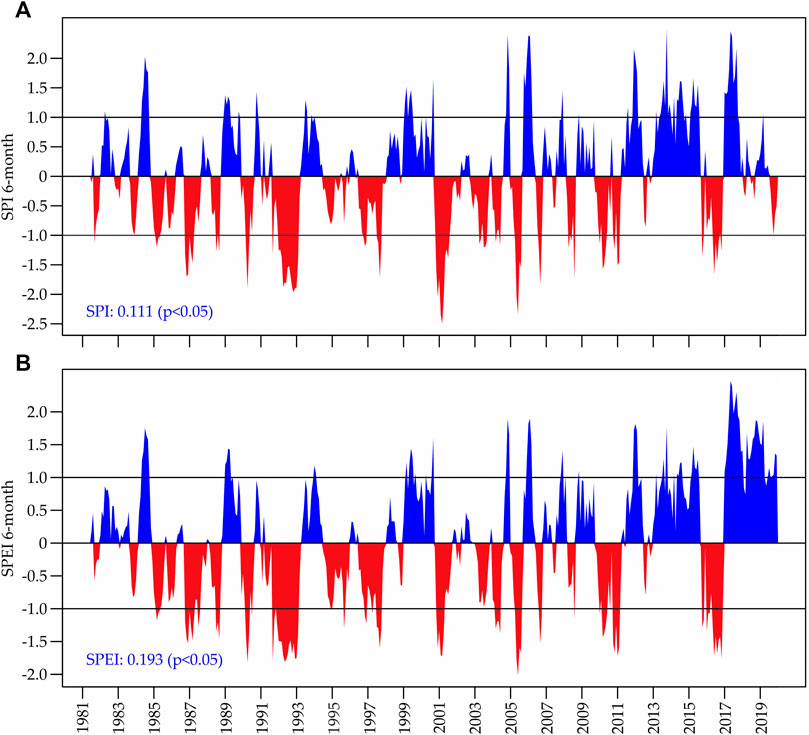
FIGURE 5. SPI 6-months (A) and SPEI 6-months (B) for the 1981–2019 period with wet, normal and drought bands. The amount of change (including the statistical significance) for each index is shown at the left bottom of each subgraphic.
According to the three and six-month, SPI and SPEI timescales dry and wet events intensify from the middle of the 1981–2019 period, specifically in the year 2017 for wet events. At the same time, the SPI classified wet events as more intensive than the SPEI. It is important to highlight, that indices at small time scales have greater variability, causing dry or wet events to be very frequent and of very short duration. On the other hand, on larger time scales, this variability decreases, and as a result, dry or wet events are less frequent but have a longer duration (Mckee et al., 1993; Avilés et al., 2015).
The 12-months SPI and SPEI indices are more stable (Figure 6). As previously mentioned, dry and wet events are less frequent but of more duration due to slower index value fluctuation. Both the SPI and SPEI, show greater intensity in dry events at the initial phase and greater intensity towards the final phase in wet events. Overall, both indices oscillate between −2.5 and 2.0, evidencing an extreme drought in 1993, and an extremely wet event in 2017. It is to be noted that the extreme drought event of 1993, is detected by the 3 and 6 months SPI and the SPEI, as a severe drought event. This is mainly due to the indices’ behavior. In small timescales (3 or 6-months), the indices behavior is very variable due to their fast response to precipitation and temperature changes. In contrast, when the timescales are longer (12 or 24 months), the indices respond more slowly to changes in climate variables. This makes the events less frequent but more long-lasting and, in some cases, more intense (Castillo-Castillo et al., 2017).
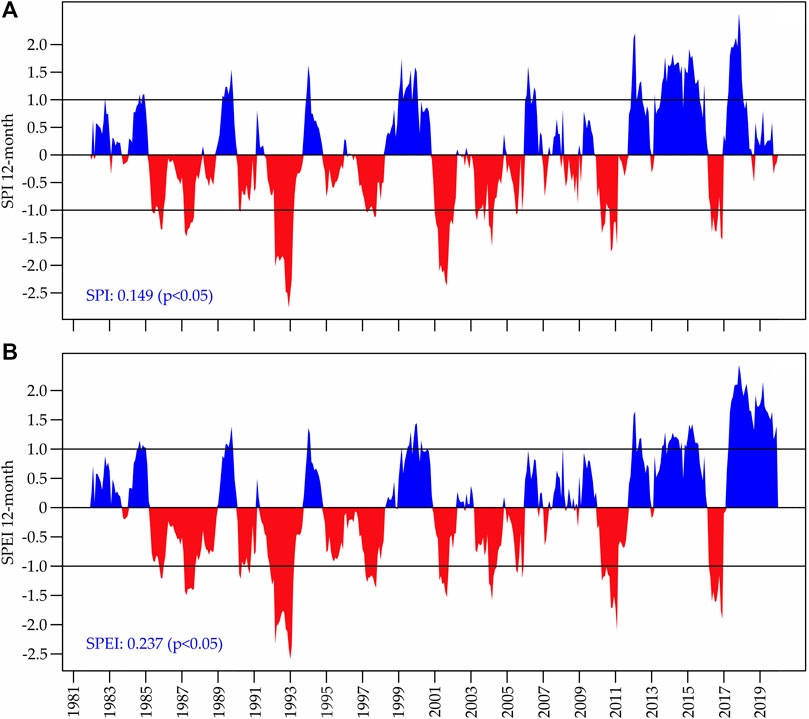
FIGURE 6. SPI 12-months (A) and SPEI 12-month (B) for the 1981–2019 period with wet, normal and drought bands. The amount of change (including the statistical significance) for each index is shown at the left bottom of each subgraphic.
Finally, according to the 24-months scale, both SPI and SPEI show more considerable differences regarding the intensity and occurrence of dry and wet events (Figure 7). The time disparity towards the end of both indices is now less than in short time scales. The SPEI values indicate more significant humidity surplus than the SPI, not only because of an increase in precipitation over the last decade but also because of a reduction in maximum and minimum temperatures (Figure 3). As a result, severe and extreme wet events have occurred since 2011. Additionally, the 12- and 24-months SPI and SPEI indices indicate a drought of great duration and intensity from 1991 to 1994, as well as two wet events of equivalent duration and intensity from 2012–2016 to 2017–2019. This variation in intensity is due to the fact that precipitation data has a seasonal component since both SPI and SPEI depend on the area’s rainfall (Ahmad et al., 2016). It should be noted that although the SPEI values generally oscillated between −3.0 and 2.0, the 24-months SPEI is the only one that has presented values close to −3.0 (Figure 7A), in comparison to other SPEI values at smaller scales. This may suggest that the importance of temperature and evapotranspiration is greater for longer time scales (Stojanovic et al., 2020).
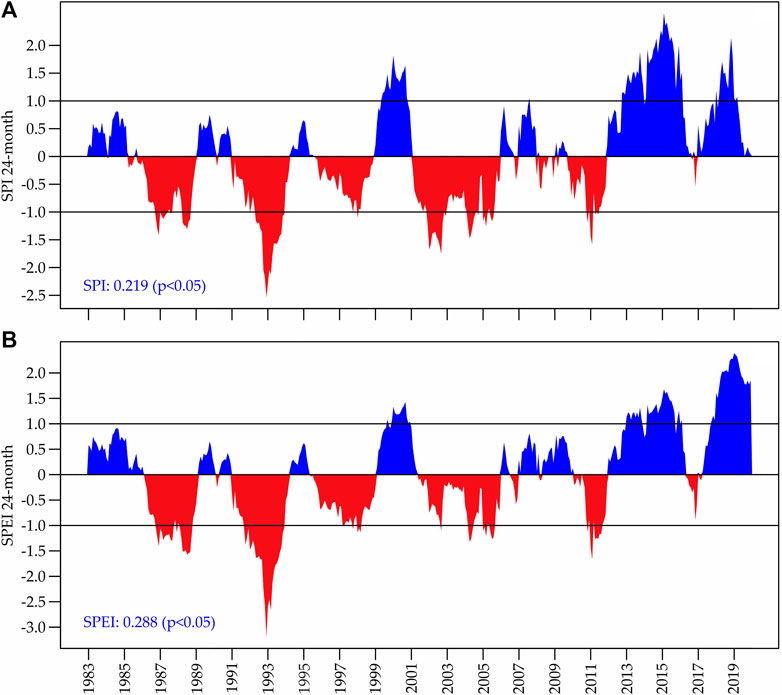
FIGURE 7. SPI 24-months (A) and SPEI 24-months (B) for the 1981–2019 period with wet, normal and drought bands. The amount of change (including the statistical significance) for each index is shown at the left bottom of each subgraphic.
The highest occurrence of wet events started in 1999. This can be observed on all time scales for both indices. Specifically, from 1999–2001, 2012–2016, to 2017–2019, where three intense periods of wet events were identified.
These results coincide with those reported by Imfeld et al. (2019) on the droughts in the southern Peruvian Andes. Imfeld et al. (2019) points out that in this area, the wet period from 2012 to 2016 ended up coinciding with El Niño, which took place in 2014/2016. Similarly, Vicente-Serrano et al. (2017) reported one of the wettest events in the Ecuadorian Andes in 1999, which ended in 2001. They used the SPEI index with a time scale of 12 months.
Studies in other parts of the world report on different behaviors. In several locations within the interior valleys of the central Cordillera de la Costa in Venezuela, several droughts were determined using the SPI for a 1 month time scale (1973–1974, 1982–1983, 1997–1998, 2002–2003, 2009–2010, 2013–2014), some of which coincide with the wet events in Chachapoyas (Cortez et al., 2018). Furthermore, Cunha et al. (2019), in their study on extreme droughts in Brazil from 1964 to 2019, registered an increase in extreme droughts during the last two decades in central and northern Brazil by using the 12-months SPI metric. Similarly, results reported by Stojanovic et al. (2018), from their assessment of droughts from 1980 to 2015 in Central Europe and their association with the moisture contribution from the Mediterranean Sea, indicate an increasing trend of extreme droughts, identified with the one-month SPEI index.
Temporal Characterization
The indices descriptive statistics on different time scales in the city of Chachapoyas have averages close to zero, something expected by the way they are calculated. (Table 2).
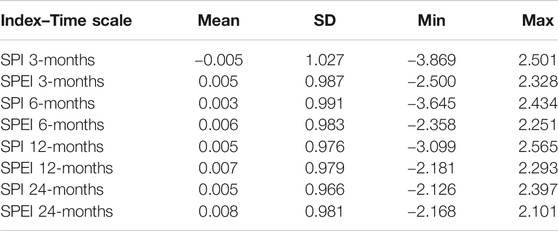
TABLE 2. Statistical summary of the SPI and SPEI indices at different time scales.
After assessing results for each index and time scale, the maximum intensity of a wet event, with a value of 2.565, was obtained from the 12-months SPI, while the maximum intensity of a drought was obtained from the 3-months SPI, with a value of −3,869. Likewise, the standard deviation oscillates between 0.966 and 1.027. Hence, the values mentioned above indicate that the city of Chachapoyas stays between the “moderate drought” and “moderately wet” categories. As previously noted, the intensity of dry and wet events is higher within shorter time scales. The SPI is an index that only takes into account rainfall, which is why the events of dry and moisture are more intense (Liu and Liu, 2019). Likewise, the SPEI, also takes into account the evapotranspiration, which generates that this index does not show the same intensities as the SPI for the same dry and wet events (Lee et al., 2017). In the case of Chachapoyas, there are several differences in the number of dry and wet events according to both indices, generally finding more events with the SPI than with the SPEI. This difference is mainly due to the evapotranspiration parameter, which depends on temperature (Vicente-Serrano et al., 2010, 2014). Therefore, including this parameter causes differences in the intensity and quantity of dry and wet events detected by indices (Vicente-Serrano et al., 2014; Vicente-Serrano et al., 2015; Lee et al., 2017; Páscoa et al., 2017). In addition, SPEI usually represents dry and wet events better than SPI in both arid and humid climates (Beguería et al., 2014), something which is not happening in the city of Chachapoyas, which stands out for its seasonal rainfall and mild temperatures (Rascón et al., 2020).
Relationship Between Indices at Different Time Scales
Precipitation is the parameter that regulates dry and wet events, either its deficit or surplus in a given period. At the same time, it is the main parameter used for the elaboration of both indices. That is why the correlation between the SPI and the SPEI is so high on the same timescale. However, the indices’ correlation decreases when the timescales differ and more when comparing short and long timescales. This difference may be due to the decrease in temperatures, affecting evapotranspiration during the entire time series studied (Vicente-Serrano et al., 2010; Stagge et al., 2014). It must also be taken into account that evapotranspiration is a very important parameter in this area of the Andes, due to its relationship with climate water balance and the high seasonality of rainfall in this Andean region.(Carrillo-Rojas et al., 2019) (Figure 8).
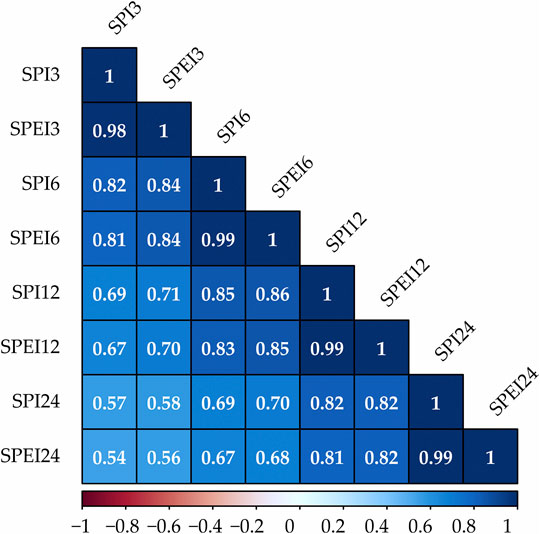
FIGURE 8. Correlation between SPI and SPEI indices at different time scales. All correlations are statistically significant at p < 0.05.
A correlation coefficient of 0.98 and 0.99 indicates that the periodic evolution of SPI and SPEI at the same temporal scale is similar. These results coincide with those obtained by Stojanovic et al. (2018), who determined a correlation value of 0.96 between the SPI and the SPEI at a 1 month scale when assessing droughts in central Europe. It should be noted that verifying if the inclusion of evapotranspiration data causes significant variations in SPEI values with respect to SPI values is important (Stagge et al., 2015). In the case of the city of Chachapoyas, the range of correlation between SPEI and SPI values varies from 0.54 to 0.99. These results are slightly lower, however akin to those reported by Stagge et al. (2014) for SPI and SPEI values in Europe.
Conclusion
This study analyzed the dry and humid events, as well as the main climatological parameters of the city of Chachapoyas in the period from 1981 to 2019, through the application of the drought indices SPI and SPEI and simple statistical analysis. After applying the SPI and SPEI indices in the city of Chachapoyas, it can be stated that wet events are predominant, compared to droughts. The most critical drought took place in the 1990s, while the most crucial wet events have occurred in the last 10 years. This finding is astounding because other studies that have been mentioned above found an inverse behavior to that of Chachapoyas. The SPEI, when including temperatures, shows an upward trend in the intensity, severity, and duration of wet events concerning the SPI. Considering that the SPEI is linked to changes in temperature, it allows researchers to assess better the beginning and end of dry and wet events at any time scale in comparison to the SPI. In the case of Chachapoyas, the indices have a high correlation between them regarding the same timescale.
Considering the tremendous impact of dry and wet events in production processes such as agriculture or livestock, or their relationship with forest fires or water availability for the population, both the SPI, based exclusively on precipitation and the SPEI, sensitive to temperature changes, are positioned as a valuable analysis tool. Therefore, local and regional governments can use this tool to develop prevention, monitoring and mitigation plans for dry and wet events or to improve impact management plans.
Data Availability Statement
The original contributions presented in the study are included in the article/Supplementary Material, further inquiries can be directed to the corresponding author.
Author Contributions
JR, WA, MO, and MB conceived the ideas. JR and LQ collected the data. JR and LQ analysed the data. JR, WA, MO, and MB wrote the manuscript. All authors contributed to the article and approved the submitted version.
Funding
This work was funded by the SNIP project Nor. 352431 “Creation of the services of the research center in climatology and alternative energies at the Toribio Rodríguez de Mendoza National University, Amazonas region” -PROCICEA, which was financed by the Peruvian Economy and Finance Ministry’s (MEF’s) National System of Public Investment (SNIP).
Conflict of Interest
The authors declare that the research was conducted in the absence of any commercial or financial relationships that could be construed as a potential conflict of interest.
Acknowledgments
The authors express gratitude for the support given by the Research Institute for Sustainable Development of the Jungle Brow (INDES-CES) of the Toribio Rodriguez of Mendoza National University (UNTRM).
References
Ahmad, L., Parvaze, S., Majid, M., and Kanth, R. H. (2016). Analysis of historical rainfall data for drought investigation using standard precipitation index (SPI) under temperate conditions of Srinagar Kashmir. Pakistan J. Meteorol. 13, 29–38.
Altieri, M. A., and Nicholls, C. I. (2017). The adaptation and mitigation potential of traditional agriculture in a changing climate. Clim. Change 140, 33–45. doi:10.1007/s10584-013-0909-y
Anshuka, A., van Ogtrop, F. F., and Willem Vervoort, R. (2019). Drought forecasting through statistical models using standardised precipitation index: a systematic review and meta-regression analysis. Nat. Hazards 97, 955–977. doi:10.1007/s11069-019-03665-6
Avilés, A., Célleri, R., Paredes, J., and Solera, A. (2015). Evaluation of Markov chain based drought forecasts in an Andean regulated river basin using the skill scores RPS and GMSS. Water Resour. Manag. 29, 1949–1963. doi:10.1007/s11269-015-0921-2
Aybar, C., Fernández, C., Huerta, A., Lavado, W., Vega, F., and Felipe-Obando, O. (2019). Construction of a high-resolution gridded rainfall dataset for Peru from 1981 to the present day. Hydrol. Sci. J. 65, 770–785. doi:10.1080/02626667.2019.1649411
Aybar-Camacho, C., Lavado-Casimiro, W., Huerta, A., Fernández, C., Vega, F., Sabino, E., et al. (2017). Uso del producto grillado “PISCO” de precipitación en estudios, investigaciones y sistemas operacionales de monitoreo y pronóstico hidrometeorológico. Informe Técnico.
Balbo, F., Wulandari, R. A., Nugraha, M. R. R., Dwiandani, A., Syahputra, M. R., and Suwarman, R. (2019). The evaluation of drought indices: standard precipitation index, standard precipitation evapotranspiration index, and palmer drought severity index in cilacap-central java. IOP Conf. Series Earth Environ. Sci. 303, 012012, . doi:10.1088/1755-1315/303/1/012012
Beguería, S., and Vicente-Serrano, S. M. (2017). SPEI: calculation of the standardised precipitation-evapotranspiration index. Available at: https://cran.r-project.org/package=SPEI (Accessed June 5, 2020).
Beguería, S., Vicente-Serrano, S. M., Reig, F., and Latorre, B. (2014). Standardized precipitation evapotranspiration index (SPEI) revisited: parameter fitting, evapotranspiration models, tools, datasets and drought monitoring. Int. J. Climatol. 34, 3001–3023. doi:10.1002/joc.3887
Bigi, V., Pezzoli, A., and Rosso, M. (2018). Past and future precipitation trend analysis for the city of Niamey (Niger): an overview. Climate 6, 73. doi:10.3390/cli6030073
Bohn, V. Y., Piccolo, M. C., and Perillo, G. M. E. (2007). Aplicacion del indice estandarizado de precipitacion a la laguna unamuno. Geoacta 32, 75–81.
Carrillo-Rojas, G., Silva, B., Rollenbeck, R., Célleri, R., and Bendix, J. (2019). The breathing of the Andean highlands: net ecosystem exchange and evapotranspiration over the páramo of southern Ecuador. Agric. For. Meteorol. 265, 30–47. doi:10.1016/j.agrformet.2018.11.006
Castillo, E. B., Turpo Cayo, E. Y., De Almeida, C. M., López, R. S., Rojas Briceño, N. B., Silva López, J. O., et al. (2020). Monitoring wildfires in the northeastern peruvian amazon using landsat-8 and sentinel-2 imagery in the GEE platform. ISPRS Int. J. Geo-Inf. 9, 1–22. doi:10.3390/ijgi9100564
Castillo-Castillo, M., Ibáñez-Castillo, L. A., Valdés, J. B., Arteada-Ramírez, R., and Vázquez Peña, M. A. (2017). Análisis de sequías meteorológicas en la cuenca del río Fuerte. México. Tecnol. Cienc. Agua 8, 35–52. doi:10.24850/j-tyca-2017-01-03
Cerón, W. L., Carvajal-Escobar, Y., De Souza, R. V. A., Kayano, M. T., and López, N. G. (2020). Spatio-temporal analysis of the droughts in Cali, Colombia and their primary relationships with the El Nino-Southern Oscillation (ENSO) between 1971 and 2011. Atmosfera 33, 51–69. doi:10.20937/ATM.52639
Cerón, W. L., Escobar, Y. C., and Baquero Montoya, O. L. (2015). Índice estandarizado de precipitación (SPI) para la caracterización de sequías meteorológicas en la cuenca del río Dagua-Colombia. Estud. Geogr. 76, 557–578. doi:10.3989/estgeogr.201520
Chávez Ortiz, J., Leiva Tafur, D., and Corroto, F. (2016). Caracterización fisicoquímica y microbiológica de las aguas residuales en la ciudad de Chachapoyas. Región Amazonas. Cienc. Amaz. 6, 16–27. doi:10.22386/ca.v6i1.104
Cortez, A., Orlando Olivares, B., Mayela Parra, R., Lobo, D., Rey, J. C., and Rodríguez, M. F. (2018). Descripción de los eventos de sequía meteorológica en localidades de la Cordillera Central, Venezuela. Cienc., Ing. Apl. 1, 23–45. doi:10.22206/cyap.2018.v1i1.pp23-45
Cunha, A. P. M. A., Zeri, M., Leal, K. D., Costa, L., Cuartas, L. A., Marengo, J. A., et al. (2019). Extreme drought events over Brazil from 2011 to 2019. Atmosphere (Basel) 10, 642. doi:10.3390/atmos10110642
Dai, A. (2011). Drought under global warming: a review. Wiley Interdiscip. Rev. Clim. Chang. 2, 45–65. doi:10.1002/wcc.81
Domínguez-Castro, F., García-Herrera, R., and Vicente-Serrano, S. M. (2017). Wet and dry extremes in Quito (Ecuador) since the 17th century. Int. J. Climatol. 38, 2006–2014. doi:10.1002/joc.5312
Domínguez-Castro, F., Vicente-Serrano, S. M., López-Moreno, J. I., Correa, K., Ávalos, G., Azorin-Molina, C., et al. (2018). Mapping seasonal and annual extreme precipitation over the Peruvian Andes. Int. J. Climatol. 38, 5459–5475. doi:10.1002/joc.5739
Endara, S., Acuña, J., Vega, F., Febre, C., Correa, K., and Ávalos, G. (2019). Caracterización espacio temporal de la sequia en los departamentos altoandinos del Peru (1981–2018). Lima, Perú: Servicio Nacional de Meteorología e Hidrología del Perú (SENAMHI).
Espinoza, J. C., Ronchail, J., Guyot, J. L., Junquas, C., Vauchel, P., Lavado, W., et al. (2011). Climate variability and extreme drought in the upper Solimões River (western Amazon Basin): understanding the exceptional 2010 drought. Geophys. Res. Lett. 38, 1–6. doi:10.1029/2011GL047862
Feldpausch, T. R., Phillips, O. L., Brienen, R. J. W., Gloor, E., Lloyd, J., Malhi, Y., et al. (2016). Amazon forest response to repeated droughts. Glob. Biogeochem. Cycles 30, 964–982. doi:10.1002/2015GB005133
González, M. H. (2015). Statistical seasonal rainfall forecast in the neuquén river basin (Comahue region, Argentina). Climate 3, 349–364. doi:10.3390/cli3020349
González, M. H., and Dominguez, D. (2012). Statistical prediction of wet and dry periods in the Comahue region (Argentina). Atmos. Clim. Sci. 02, 23–31. doi:10.4236/acs.2012.21004
Hao, Z., Hao, F., Singh, V. P., Xia, Y., Ouyang, W., and Shen, X. (2016). A theoretical drought classification method for the multivariate drought index based on distribution properties of standardized drought indices. Adv. Water Resour. 92, 240–247. doi:10.1016/j.advwatres.2016.04.010
Hargreaves, G. H. (1994). Defining and using reference evapotranspiration. J. Irrig. Drain. Eng. 120, 1132–1139. doi:10.1061/(asce)0733-9437(1994)120:6(1132)
Hayes, M. J., Svodoba, M. D., Wilhite, D. A., and Vanyarkho, O. V ( (1996). Monitoring the 1996 drought using the standardized precipitation index. Bull. Am. Meteorol. Soc. 80, 429–438. doi:10.1175/1520-0477
Hijmans, R. J. (2020). Raster: geographic data analysis and modeling. Available at: https://cran.r-project.org/package=raster (Accessed January 01, 2010).
Huang, S., Li, P., Huang, Q., Leng, G., Hou, B., and Ma, L. (2017). The propagation from meteorological to hydrological drought and its potential influence factors. J. Hydrol. 17, 184–195. doi:10.1016/j.jhydrol.2017.01.041
Imfeld, N., Barreto Schuler, C., Correa Marrou, K. M., Jacques-Coper, M., Sedlmeier, K., Gubler, S., et al. (2019). Summertime precipitation deficits in the southern Peruvian highlands since 1964. Int. J. Climatol. 39, 4497–4513. doi:10.1002/joc.6087
Jat, M. L., Dagar, J. C., Sapkota, T. B., Yadvinder-Singh , , Govaerts, B., Ridaura, S. L., et al. (2016). Climate change and agriculture: adaptation strategies and mitigation opportunities for food security in South Asia and Latin America. Adv. Agron. 137, 127–235. doi:10.1016/bs.agron.2015.12.005
Jones, P. G., and Thornton, P. K. (2003). The potential impacts of climate change on maize production in Africa and Latin America in 2055. Glob. Environ. Chang. 13, 51–59. doi:10.1016/S0959-3780(02)00090-0
Kimaru, A. N., Gathenya, J. M., and Cheruiyot, C. K. (2019). The temporal variability of rainfall and streamflow into lake Nakuru, Kenya, assessed using SWAT and hydrometeorological indices. Hydrology 6, 88. doi:10.3390/hydrology6040088
Kostopoulou, E., Giannakopoulos, C., Krapsiti, D., and Karali, A. (2017). “Temporal and spatial trends of the standardized precipitation index (SPI) in Greece using observations and output from regional climate models,” in Perspectives on atmospheric sciences. Editors T. S. Karacostas, (Ginebra, Suiza: Springer Atmospheric Sciences)), 475–481. doi:10.1007/978-3-319-35095-0
Lee, S. H., Yoo, S. H., Choi, J. Y., and Bae, S. (2017). Assessment of the impact of climate change on drought characteristics in the Hwanghae Plain, North Korea using time series SPI and SPEI: 1981–2100, Water 9, 579. doi:10.3390/w9080579
Lin, I. I., and Chan, J. C. L. (2015). Recent decrease in typhoon destructive potential and global warming implications. Nat. Commun. 6, 7182. doi:10.1038/ncomms8182
Liu, W., and Liu, L. (2019). Analysis of dry/wet variations in the Poyang Lake basin using standardized precipitation evapotranspiration index based on two potential evapotranspiration algorithms. Water (Switzerland) 11, 1380. doi:10.3390/w11071380
Liu, X., Zhu, X., Pan, Y., Bai, J., and Li, S. (2018). Performance of different drought indices for agriculture drought in the North China Plain. J. Arid Land 10, 507–516. doi:10.1007/s40333-018-0005-2
Manríquez Zapata, H. M. (2019). Especies forestales afectadas en incendios ocurridos en Amazonas: un análisis de la información fiscal de los casos de Chachapoyas y Luya. Arnaldoa 26, 965–976. doi:10.22497/arnaldoa.263.26307
Mckee, T. B., Doesken, N. J., and Kleist, J. (1993). “The relationship of drought frequency and duration to time scale.” in Eighth conference on applied climatology, Anaheim, CA, January 17–22, 1993 (Boston, MA: American Meteorological Society), 179–184.
Mineo, C., Moccia, B., Lombardo, F., Russo, F., and Napolitano, F. (2019). “Preliminary analysis about the effects on the SPI values computed from different best-fit probability models in two Italian regions,” in New trends in Urban drainage modelling. Editors G. Mannina, and S Ginebra (Newyork, NY: Springer International Publishing), 958–962. doi:10.1007/978-3-319-99867-1
Mohammadi, B., Vaheddoost, B., and Danandeh Mehr, A. (2020). A spatiotemporal teleconnection study between Peruvian precipitation and oceanic oscillations. Quat. Int. 565, 1–11. doi:10.1016/j.quaint.2020.09.042
Nicholls, C. I., and Altieri, M. A. (2019). Bases agroecológicas para la adaptación de la agricultura al cambio climático. Cuad. Investig. UNED 11, S55–S61. doi:10.22458/urj.v11i1.2322
OMM (Organización Meteorológica Mundial) (2012). Índice normalizado de precipitación. Guía del usuario. Ginebra, Suiza: Organización Meteorológica Mundial.
Páscoa, P., Gouveia, C. M., Russo, A., and Trigo, R. M. (2017). Drought trends in the Iberian Peninsula over the last 112 years. Adv. Meteorol. 2017, 1–13. doi:10.1155/2017/4653126
Pierce, D. (2019). ncdf4: interface to unidata netCDF (version 4 or earlier) format data files Available at: https://cran.r-project.org/package=ncdf4.
Quintana-Seguí, P., Martin, E., Sánchez, E., Zribi, M., Vennetier, M., Vicente-Serrano, S., et al. (2016). “Drought: observed trends, future projections,” in The Mediterranean under climate change. Editor J. P. Moatti (Marserlla, Francia: IRD Editions)), 123–131.
R Core Team (2020). R: a language and environment for statistical computing Available at: https://www.r-project.org/.
Rascón, J., Angeles, W. G., Oliva, M., Quiñones, L., and Barrena Gurbillón, M. Á. (2020). Determinación de las épocas lluviosas y secas en la ciudad de Chachapoyas para el periodo de 2014–2018. Rev. Climatol. 20, 15–28.
Sá, J. C. de. M., Lal, R., Cerri, C. C., Lorenz, K., Hungria, M., and de Faccio Carvalho, P. C. (2017). Low-carbon agriculture in South America to mitigate global climate change and advance food security. Environ. Int. 98, 102–112. doi:10.1016/j.envint.2016.10.020
Salas, L. R., Barboza, C. E., Rojas, B. N. B., and Rodriguez, C. N. Y. (2018). Deforestación en el área de conservación privada Tilacancha: zona de recarga hídrica y de abastecimiento de agua para Chachapoyas. Rev. Investig. Agroproduc. Sustentable 2, 54–64. doi:10.25127/aps.20182.393
Sánchez-Montoya, M. M., von Schiller, D., Barberá, G. G., Diaz, A. M., Arce, M. I., del Campo, R., et al. (2018). Understanding the effects of predictability, duration, and spatial pattern of drying on benthic invertebrate assemblages in two contrasting intermittent streams. PLoS One 13, 1–17. doi:10.1371/journal.pone.0193933
Silva, Y., Takahashi, K., and Chávez, R. (2008). Dry and wet rainy seasons in the Mantaro river basin (Central Peruvian Andes). Adv. Geosci. 14, 261–264. doi:10.5194/adgeo-14-261-2008
Sobral, B. S., Oliveira-Júnior, J. F. de., de Gois, G., Pereira-Júnior, E. R., Terassi, P. M. de. B., Muniz-Júnior, J. G. R., et al. (2019). Drought characterization for the state of Rio de Janeiro based on the annual SPI index: trends, statistical tests and its relation with ENSO. Atmos. Res. 220, 141–154. doi:10.1016/j.atmosres.2019.01.003
Stagge, J. H., Tallaksen, L. M., Gudmundsson, L., Van Loon, A. F., and Stahl, K. (2015). Candidate distributions for climatological drought indices (SPI and SPEI). Int. J. Climatol. 35, 4027–4040. doi:10.1002/joc.4267
Stagge, J. H., Tallaksen, L. M., Xu, C. Y., and Van Lanen, H. A. J. (2014). Standardized precipitation-evapotranspiration index (SPEI): sensitivity to potential evapotranspiration model and parameters. IAHS-AISH Proc. Rep. 363, 367–373.
Stojanovic, M., Drumond, A., Nieto, R., and Gimeno, L. (2017). Moisture transport anomalies over the Danube River basin during two drought events: a Lagrangian analysis. Atmosphere (Basel) 8, 193. doi:10.3390/atmos8100193
Stojanovic, M., Drumond, A., Nieto, R., and Gimeno, L. (2018). Variations in moisture supply from the mediterranean sea during meteorological drought episodes over Central Europe. Atmosphere (Basel) 9, 278. doi:10.3390/atmos9070278
Stojanovic, M., Liberato, M. L. R., Sorí, R., Vázquez, M., Phan-van, T., Duongvan, H., et al. (2020). Trends and extremes of drought episodes in Vietnam sub-regions during 1980–2017 at different timescales. Water (Switzerland) 12, 1–13. doi:10.3390/w12030813
Tan, C., Yang, J., and Li, M. (2015). Temporal-spatial variation of drought indicated by SPI and SPEI in Ningxia Hui autonomous region, China. Atmosphere (Basel) 6, 1399–1421. doi:10.3390/atmos6101399
Todd, A., Collins, M., Lambert, F. H., and Chadwick, R. (2018). Diagnosing ENSO and global warming tropical precipitation shifts using surface relative humidity and temperature. J. Clim. 31, 1413–1433. doi:10.1175/JCLI-D-17-0354.1
Tsakiris, G., and Vangelis, H. (2004). Towards a drought watch system based on spatial SPI. Water Resour. Manag. 18, 1–12. doi:10.1023/B:WARM.0000015410.47014.a4
Van Loon, A. F., and Laaha, G. (2015). Hydrological drought severity explained by climate and catchment characteristics. J. Hydrol. 526, 3–14. doi:10.1016/j.jhydrol.2014.10.059
Vicente-Serrano, S. M., Aguilar, E., Martínez, R., Martín-Hernández, N., Azorin-Molina, C., Sanchez-Lorenzo, A., et al. (2017). The complex influence of ENSO on droughts in Ecuador. Clim. Dyn. 48, 405–427. doi:10.1007/s00382-016-3082-y
Vicente-Serrano, S. M., Beguería, S., and López-Moreno, J. I. (2010). A multiscalar drought index sensitive to global warming: the standardized precipitation evapotranspiration index. J. Clim. 23, 1696–1718. doi:10.1175/2009JCLI2909.1
Vicente-Serrano, S. M., Beguería, S., Lorenzo-Lacruz, J., Camarero, J. J., López-Moreno, J. I., Azorín-Molina, C., et al. (2012). “Análisis comparativo de diferentes índices de sequía para aplicaciones ecológicas, agrícolas e hidrológicas,” in Octavo congreso internacional de la asociación española de climatología: cambio climático extremos e impactos, Salamanca, ESP, September 25−–28, 2000, Available at: https://repositorio.aemet.es/bitstream/20.500.11765/8332/1/0066_VIII-2012-SM_VICENTE.pdf.
Vicente-Serrano, S. M., Chura, O., López-Moreno, J. I., Azorin-Molina, C., Sanchez-Lorenzo, A., Aguilar, E., et al. (2015). Spatio-temporal variability of droughts in Bolivia: 1955–2012. Int. J. Climatol. 35, 3024–3040. doi:10.1002/joc.4190
Vicente-Serrano, S. M., Lopez-Moreno, J. I., Beguería, S., Lorenzo-Lacruz, J., Sanchez-Lorenzo, A., García-Ruiz, J. M., et al. (2014). Evidence of increasing drought severity caused by temperature rise in southern Europe. Environ. Res. Lett. 9, 044001. doi:10.1088/1748-9326/9/4/044001
Wei, T., and Simko, V. (2017). R package “corrplot”: visualization of a correlation matrix. Available at: https://github.com/taiyun/corrplot.
Wilhite, D. A., and Glantz, M. H. (1985). Understanding: the drought phenomenon: the role of definitions. Water Int. 10, 111–120. doi:10.1080/02508068508686328
World Meteorological Organization (2012). Standardized precipitation index user guide. Geneva: World Meteorological Organization.
Zambrano, F., Wardlow, B., Tadesse, T., Lillo-Saavedra, M., and Lagos, O. (2017). Evaluating satellite-derived long-term historical precipitation datasets for drought monitoring in Chile. Atmos. Res. 186, 26–42. doi:10.1016/j.atmosres.2016.11.006
Zarei, A. R. (2019). Analysis of changes trend in spatial and temporal pattern of drought over south of Iran using standardized precipitation index (SPI). SN Appl. Sci. 1, 465. doi:10.1007/s42452-019-0498-0
Zargar, A., Sadiq, R., Naser, B., and Khan, F. I. (2011). A review of drought indices. Environ. Rev. 19, 333–349. doi:10.1139/a11-013
Zhang, H., Ding, M., Li, L., and Liu, L. (2019). Continuous wetting on the Tibetan plateau during 1970–2017. Water 11, doi:10.3390/w11122605
Zhang, L., Jiao, W., Zhang, H., Huang, C., and Tong, Q. (2017). Studying drought phenomena in the Continental United States in 2011 and 2012 using various drought indices. Remote Sens. Environ. 190, 96–106. doi:10.1016/j.rse.2016.12.010
Zhang, Y., Li, W., Chen, Q., Pu, X., and Xiang, L. (2017). Multi-models for SPI drought forecasting in the north of Haihe River Basin, China. Stoch. Environ. Res. Risk Assess. 31, 2471–2481. doi:10.1007/s00477-017-1437-5
Keywords: SPEI, SPI, precipitation, temperatures, Andean, Peru
Citation: Rascón J, Gosgot Angeles W, Quiñones Huatangari L, Oliva M and Barrena Gurbillón MÁ (2021) Dry and Wet Events in Andean Populations of Northern Peru: A Case Study of Chachapoyas, Peru. Front. Environ. Sci. 9:614438. doi: 10.3389/fenvs.2021.614438
Received: 06 October 2020; Accepted: 08 February 2021;
Published: 19 March 2021.
Edited by:
Raquel Nieto, University of Vigo, SpainReviewed by:
Ahmed Kenawy, Mansoura University, EgyptCélia Marina P. Gouveia, Portuguese Institute for Sea and Atmosphere (IPMA), Portugal
Copyright © 2021 Rascón, Gosgot Angeles, Quiñones Huatangari, Oliva and Barrena Gurbillón. This is an open-access article distributed under the terms of the Creative Commons Attribution License (CC BY). The use, distribution or reproduction in other forums is permitted, provided the original author(s) and the copyright owner(s) are credited and that the original publication in this journal is cited, in accordance with accepted academic practice. No use, distribution or reproduction is permitted which does not comply with these terms.
*Correspondence: Jesús Rascón, jesus.rascon@untrm.edu.pe