Identifying NOx Sources in Arequipa, Peru Using Nitrogen Isotopes in Particulate Nitrate
 Greg Michalski1*
  Adriana E. Larrea Valdivia2
  Elizabeth Olson1
  Lisa Welp1 Huan Fang1 Kento Magara-Gomez3 Lino Morales Paredes2 Juan Reyes Larico2 Jianghanyang Li1
- 1Purdue University, West Lafayette, IN, United States
- 2National University of Saint Augustine, Arequipa, Peru
- 3Universidad Pontificia Bolivariana-Bucaramanga, Bucaramanga, Colombia
We reported on the first time series of δ15N in aerosol nitrate from South America. Particulate matter less than 2.5 microns in diameter (PM2.5) was collected at four sites located in Arequipa, a major city in southern Peru. The δ 15N values for nitrate in PM2.5 ranged from -1.7–15.9‰ and averaged 5.3 ± 3.0‰, with no significant difference between the four study sites and no discernable seasonal trend. These values are significantly higher than those in aerosol nitrate from southern hemisphere marine environments and those from the northern hemisphere. We explain the elevated values using an isotope mass balance mixing model that estimates a source NOx δ15N of -8 ± 3‰, derived mainly from anthropogenic sources (vehicles, industry). An isotope enabled 0-D photochemical box model was used to estimate the isotope enrichment of nitrate relative to NOx due to kinetic, equilibrium, and photolysis isotope effects occurring during NOx oxidation. This “source plus photochemistry” approach resulted in general agreement with the observations. This suggests that if the photochemistry effect can be accounted for, nitrate δ15N can be used to assess the relative importance of NOx sources and could be a new tool to validate NOx emission inventories.
Introduction
Air quality is important because it impacts human quality of life and health, yet relative to northern hemisphere countries, there are relatively few studies that have investigated air quality in developing countries in South America, particularly Peru (Pearce et al., 2009; De La Cruz et al., 2019; Alvarez-Tolentino & Suarez-Salas, 2020; Romero, et al., 2020). According to the World Health Organization (WHO) air pollution is a leading cause of global mortality, accounting for an estimated seven million premature deaths (Lelieveld et al., 2015). Roughly 3.7 million of these deaths are partially attributed to outdoor air pollution within cities and these disproportionately impact disadvantaged populations (Hajat et al., 2015). Aerosols and some trace gases, such as nitrogen oxides (NOx = NO + NO2), SO2, and O3 are the main vectors for the adverse effects of poor air quality. Of the few studies that have been published on Peruvian air quality, most have focused on Lima, Peru’s capital city (Silva et al., 2017; Romero, et al., 2020; Romero, et al., 2020). Like many large cities in developing countries, Lima suffers from poor air quality that is associated with vehicle traffic, industry, and commerce (Romero, et al., 2020; Romero, et al., 2020). There are only a couple of published air quality studies in Peru outside of Lima (Pearce et al., 2009; De La Cruz et al., 2019; Alvarez-Tolentino & Suarez-Salas, 2020) and only recently has one been published on air quality in Arequipa, Peru’s second largest city (Valdivia et al., 2020; Olson et al., 2021). Despite their importance, ground based air quality studies of aerosols, trace gases, and other air pollutants in Arequipa are noticeably absent.
One of the main compounds found in aerosols produced in large cities such as Arequipa is atmospheric nitrate (NO3−atm), a secondary pollutant that plays a key role in atmospheric chemistry. NO3−atm is the sum of nitrate ions dissolved in rain, fog, or clouds (NO3−(aq)), gas phase nitric acid produced photochemically (HNO3(g)), and particulate nitrate (pNO3-) produced by N2O5 heterogonous reactions or by uptake of HNO3 on existing aerosols surfaces (Monks, 2005; Monks et al., 2009). NO3−atm is the reaction product of NOx, which is mainly emitted by combustion, that is then oxidized via O3 and organic radical chemistry (Seinfeld & Pandis, 1998; Pye et al., 2010) into higher nitrogen oxides (NOy = NOx + NO3−atm + all other N oxides). NOx and NO3−atm are key components of atmospheric chemistry (Monks et al., 2009), controlling the oxidation state of the troposphere (Prinn, 2003), influencing particulate matter (PM) formation (Feng & Penner, 2007), altering the pH of rainwater (Lynch et al., 2000), and facilitating the movement of nitrogen through the N cycle (Galloway et al., 2003). NOx also produces ozone (O3) either directly through NO2 photolysis, or indirectly as a catalyst when volatile organic compounds (VOCs) are present (Monks, 2005). O3 photolysis, in turn, generates OH radicals that initiates a radical chain reaction involving HO2 and organic peroxide propagators that results in the oxidation of chemically reduced compounds and the formation of secondary PM (Seinfeld & Pandis, 1998; Finlayson-Pitts & Pitts, 2000) including nitrate and sulfate aerosols (Pusede et al., 2016; Cao et al., 2017; Pan et al., 2018). Thus, understanding NOx sources and the photochemistry that converts it into NO3−atm is critical for understanding the origin poor air quality.
Despite this importance, there are numerous knowledge gaps in understanding the cycling of NOy in the atmosphere, particularly in South America. The NOx emission budget is still poorly constrained. Most emission inventories rely on fixed emission factors for some sources that may, in fact, be spatially or temporally variable. For example, power plant NOx emissions are based on assumed efficiency of catalytic converters that may not be accurate in all operating conditions (Srivastava et al., 2005; Felix et al., 2012). Soil NO emissions are highly dependent on soil moisture, redox conditions, fertilizer application rates, type, and timing making them challenging to constrain (Galloway et al., 2004; Pilegaard, 2013). There are also several unresolved issues regarding the chemistry that transforms NOx into NO3−atm. These include uncertainties in heterogeneous uptake coefficients of N2O5 (Brown et al., 2001; Brown et al., 2006; Chang et al., 2011), the formation of organic nitrates in urban forests (Kastler & Ballschmiter, 1998; Romer et al., 2016), the relative importance and mechanism of HONO formation versus HONO emissions, and reactions of NOy in the aqueous phase and mixed aerosols (Zhang et al., 2019; Guo et al., 2020; Peng et al., 2020). Further, chemical transport models (CTMs) do not accurately predict aerosol nitrate concentrations or other NOy mixing ratios (Spak & Holloway, 2009; Y.; Zhang et al., 2009) making predicting NO3−atm formation a significant challenge. Therefore, it is important that these uncertainties in NOy cycling be resolved if we aim to have accurate air quality forecasts used to try an develop quality mitigation strategies aimed at improving poor air.
It has been suggested that stable N isotopes can provide clues to the origin of NOx (Elliott et al., 2009; Felix & Elliott, 2014; Walters, Tharp, et al., 2015) and the oxidation pathways that transform into nitrate (Walters & Michalski, 2015, 2016). δ15N is defined by the relative difference between the 15N/14N ratio in a N compound and the ratio in air N2 (the arbitrary reference compound) and is typically reported in delta notation (in permil, ‰):
Isotopic measurements of NO3−atm show a wide range of δ15N values, which has been suggested to indicate variability in NOx emission sources, chemical processing, and/or a combination of these effects. A number of studies have measured the δ15N values of NOx collected from NOx sources such as power plants (Felix et al., 2012), automobiles (Walters, Goodwin, et al., 2015), biomass burning (Fibiger & Hastings, 2016), and non-road sources (Felix & Elliott, 2014). Many studies have measured the δ15N values of NO3−atm collected from the troposphere. Most of the NO3−atm δ15N data is for nitrate that has been collected on filters (PM2.5, PM10, TSP (total suspended particles)) (Moore, 1977; Savard et al., 2017), as the dissolved NO3− anion in rain (Heaton, 1987; Hastings et al., 2003; Elliott et al., 2007; Felix et al., 2015), or as gas phase HNO3 (Elliott et al., 2009; Savard et al., 2017). The range of NO3−atm δ15N values span from -50 to +15‰ but the average is ∼0‰ (Song et al., 2021).
Two hypotheses have been offered to explain these variations: source and photochemistry. The source hypothesis (Elliott et al., 2007; Hastings et al., 2013) suggests that the NO3−atm δ15N range reflects the spatial and temporal mixing of NOx sources with different δ15N values that is then converted into NO3−atm. The photochemistry hypothesis (Freyer, 1978; Freyer et al., 1993; Walters et al., 2018) suggests that the observed NO3−atm δ15N variations arise via isotope effects occurring when photochemical cycling partitions N into the myriad of NOy compounds. Recent modeling work (Fang et al., 2021), has shown that only a handful of reactions in the NOy cycle impact the δ15N of nitrate. These include NO2 photolysis (photo induced isotope effect; Miller and Yung, 2000), the kinetic isotope effect occurring during the NO + O3 reaction (Walters and Michalski, 2016), equilibrium isotope effect during the NO2 + OH (Fang et al., 2021) and NO2 + NO3 ←→N2O5 (Walters and Michalski, 2015) reactions, and isotope exchange reaction 15NO + NO2 ←→ NO + 15NO2 (Walters and Michalski, 2015; Walters, Simonini, and Michalski (2016). A full description of the relative importance of these effects can be found in Fang et al. (2021). These two hypotheses are not mutually exclusive. Indeed, it is likely to be a combination of both source and chemistry, but their relative importance likely shifts depending on environmental conditions such as a region’s NOx source diversity, plume versus dispersed chemistry, photolysis intensity, and oxidant load. In turn, the δ15N data might be a new key to reconciling some of the current uncertainties in NOx sources and chemistry, if it can be properly interpreted. Isotopic studies of NO3−atm have been primarily conducted in the northern hemisphere and polar regions and relatively few in the subtropical southern hemisphere (Song et al., 2021), particularly in South America. There have been no studies of NO3−atm isotopes in Peru nor in any urban sites in all of South America. The objective of this study is to investigate the source of NOx and the oxidation chemistry using the N isotope composition of NO3−atm collected in Arequipa, Peru.
Methods
Study Area
The city of Arequipa (Figure 1) is the second most populated city in Peru with a population of ∼1 million people located 2,350 m above sea level at 71°32′05″ W, 16°23′56″ S. Arequipa is an isolated city with the closest major urban centers being Tacna, Peru (Pop. ∼280,000) and Arica, Chile (Pop. ∼ 230,000) roughly 250 km to the SE, La Paz, Bolivia (∼770,000) 380 km to the east, and Lima located ∼800 km to the NW. Therefore, Arequipa’s air quality is not significantly impacted by regional anthropogenic N pollution from urban centers outside of the city. It sits at the base on the Andean forearc and at the foot of the active volcano Misti and extinct volcanos Chachani and Pichu. Arequipa is at the northern edge of the hyper-arid Atacama Desert, sometimes called the Sechura Desert in Peru, and the landscape is characterized by wide sandy plains and dunes and sparse vegetation except in a few river valleys (quebradas) and the Andean highlands. Arequipa’s climate is dry throughout the year with annual precipitation averaging ∼100 mm that almost exclusively occurs during a rainy season extending from January to March. The weather is mild with daily temperature averages of 15 ± 1.6°C and relative humidity averages of 42 ± 21.5% during the 2019 study year (Weatheronline.co.uk. accessed 2019). The region contributes about 5.6% of the nation’s GDP, with mining (23.9%), manufacturing (18.2%), services (17%), commerce (14.6%) and agriculture (12.6%) as the main economic activities (DIGESA, 2005). Agriculture is largely limited to a few river valleys that drain from the Andes, including one that passes through the city, and several large-scale desert irrigation projects (Figure 1).
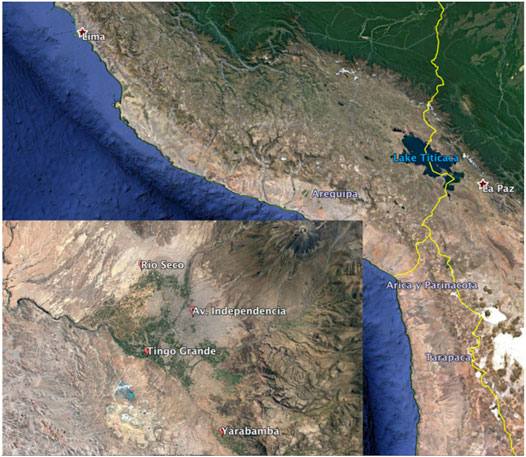
FIGURE 1. Peru-Chile-Bolivia tri-border with the study area of Arequipa in the inset marking the location of the four sampling locations. The Cerra Verde copper mine can be seen to the south of Tingo Grande and the dormant Andean volcano Misti in the upper right of the inset. Agricultural areas are visible in green on the city edge and the surrounding desert in earth-tone. Image from Google Earth.
Arequipa PM Collection Sites and Methodology
Sample collection was performed at four sites throughout Arequipa that were located in urban, industrial, suburban, and agricultural sections of the city (Figure 1). The urban site Avenida Independencia (AI), is located near the city center where vehicle congestion is very heavy during the week. The industrial site Rio Seco (RS) is located near borate pesticide manufacture plants, tanneries, brick kilns, and chicken processing plants. This district is also located near the main highway by which trucks and buses exit the city and many of the roads in this district are unpaved. Tingo Grande (TG), is a suburban development located in the western edge of the city (2,600 masl) and 6 km due north of a large open pit copper mining operation. Yarabamba (YB), is a small town located 15 km outside of the city center surrounded by rural farmland.
PM2.5 samples were collected using a high-volume air sampler (ECOTECH ECO-HVS3000). Sample collection took place periodically throughout the year 2018 by moving the sampler from one sampling site to another. After each relocation, 24 h PM2.5 aerosol samples were collected for three consecutive days before the sampler was moved to the next location. There were sampling gaps during the months of April, June, and July due to limited resources such as power outages and labor shortages. The flow rate was ∼1 m3/min and total volume as determined as a function of flow rate and time and corrected to standard temperature (273K) and pressure (101.3 kPa). The filter media was either pre-combusted quartz fiber filters (8 in × 10 in, Whatman, United States) or Teflon filters. Since filter sampling often collects both pNO3- and HNO3(g) we refer to the samples as NO3−atm. Filters were equilibrated to room temperature and relative humidity and the PM mass was determined gravimetrically. The filters were then sectioned into 10 equal width strips used for various chemical, isotopic, and optical analysis. One of the filter sections was soaked in 15 ml of Milli-Q water for 20 min to extract water soluble anions and then filtered (0.45 um Fisher Scientific, USA) and analyzed for anions, cations and nitrate isotopes.
Geochemical and Isotopic Analysis of Arequipa PM Collection
Nitrate concentrations and nitrogen isotopes were measured using standard techniques. Anion and cation concentrations were determined via standard methods using suppressed ion chromatography (Metrohm 940 Vario Professional). Anion eluent was a carbonate buffer (3.2 mM Na2CO3 and 1.0 mM NaHCO3) and cation eluent was an oxalic acid solution (3.5 mM). The detection limit was 0.01 ppm and the accuracy and precision of the analysis was less than 0.3% and 0.3 ppm, respectively, based on replicate analysis of standard solutions. Nitrogen isotopes of nitrate were measured by converting NO3− into N2O using TiCl3 reduction in 12-ml vials (Altabet et al., 2019). The N2O was extracted from the vials using a custom-made headspace cryogenic concentrator unit, purified using gas chromatography fitted with a PoraplotQ column. The gas stream is introduced into a Thermo DeltaV isotope ratio mass spectrometer through a custom-made helium flow open split and isotope ratios are determined by measured at Faraday cups tuned to detect ions with masses of 44, 45, and 46 amu. Based on standard replicates and bracketed calibrations curves the accuracy was 0.4‰ and a precision of 0.4‰. Three internal nitrate standards were used that were previously calibrated relative to international standards USGS 32, 34, and 35 (Michalski et al., 2002; Bohlke et al., 2003). Nitrate δ15N values are reported with respect to air N2 and are reported in parts per thousand (‰) with a standard error that was 0.3‰ for δ15N.
Arequipa Meteorology, Trace Gas Data, Chemistry Modeling, and Stable Isotope Approaches
Additional atmospheric data was obtained from the few available datasets in the Arequipa region. Meteorological data (temperature, relative humidity) for the sampling period was acquired from Arequipa’s Rodríguez Ballón International Airport (purchased through Weather Online Data Center, https://www.woeurope.eu/). Additional wind and air humidity data were obtained from the United States National Oceanic and Atmospheric Administration’s (NOAA) Global Data Assimilation System 0.5-degree model. There was very little ancillary trace gas data available for the study period, which highlights the limited air quality research in the region. The local Arequipa Health Ministry monitored PM, CO, SO2, NOx, and O3 during 2010–2011 (Arequipa, G.R. 2020) but these measurements were discontinued thereafter. During the study period there were 8 months of SO2 monitoring and a few months of PM measurements.
We used iNRACM (Fang et al., 2021), an isotope enabled version of the Regional Atmospheric Chemical Model (RACM), a 0-D photochemical box model (Stockwell et al., 1997) to simulate atmospheric nitrate production. Briefly, the iNRACM traces 17 stable inorganic compounds, four inorganic intermediates, 32 stable organic compounds, including four biogenic organics, and 24 organic intermediates as they are transformed by 237 chemical reactions, including 23 photolysis reactions (Atkinson, 1990; Atkinson et al., 1992). The iNRACM added 15N isotopologues for the two primary (NO, NO2) and the 11 secondary N pollutants found in the original RACM mechanism and rate constants that accounted for relevant isotope effects. iNRACM was also modified to account for heterogenous N2O5 reactions on aerosols that are known to be important for atmospheric nitrate formation. This was done by reducing N2O5 heterogeneous hydrolysis to a first order reaction with a rate constant that is a function of N2O5 molecular speed, the N2O5 uptake coefficient and the aerosol surface area density (Riemer et al., 2003).
iNRACM initial conditions and emissions were based on the limited available data. Temperature, relative humidity (RH), pressure data, and [SO2] were taken from observations during the study year. Initial CO, O3, and NOx were taken from the monthly averages of the 2010–2011 Arequipa Health Ministry data set, under the assumption that the average of these trace gases did not significantly change between 2011 and 2018. This seems justified since the population changed by less than 10% during this time frame. VOC initial concentrations were based on average urban values taken from Stockwell et al. (1997). NOx and VOC emissions rates were based the equipartition of annual VOC and NOx emissions from the 2005 DIGESA emission inventory (DIGESA, 2005), the only inventory compiled in the region, and scaled up by 20% based on the population increase between 2005 and 2018. An aerosol mass-surface area ratio of 140 μg/cm2 (Guelle et al., 2001) and the observed PM10 mass (Valdivia et al., 2020) was used to determine the aerosol surface area density used in calculating the N2O5 uptake coefficient.
Results and Discussion
Results for PM Nitrate Concentrations and δ15N Values
Aerosol nitrate δ 15N values varied throughout the year and were positive except for two of the samples. The aerosol nitrate δ 15N values ranged from a minimum of -1.8‰ to a maximum of 16‰ (outlier) and averaged 5.3 ± 3.0‰. There is no obvious seasonal or location dependence of the aerosol nitrate δ15N values, but the lower values tended cluster in the southern hemisphere summer months (Jan.—March) when sparse rains occur (Figure 2). The δ 15N values for the 3 days at any given sampling site tended to be ± 2–3‰. Nitrate and other water-soluble ions varied over the course of the year and between sites. PM nitrate concentrations ranged from a minimum of 0.17 mg/m3 to a maximum of 2.87 mg/m3 and averaged 0.90 mg/m3 and accounted for 9–12% of the ion mass. The most abundant anion was SO42- (average = 3.1 ± 1.3 mg/m3) accounting for ∼35% of the total ion mass and Cl− was less than NO3− and made up less than 8% of total ion mass. Na+ and Ca2+ were the main cations (SI Supplementary Figures S1, S2), averaging 0.96 ± 0.38 mg/m3 and 0.87 ± 0.62 mg/m3 followed by NH4+ (0.57 ± 0.28 mg/m3).

FIGURE 2. Arequipa PM2.5 nitrate δ 15N values at the four sampling sites: Avenida Independencia (AI), Rio Seco (RS) Tingo Grande (TG) and Yarabamba (YB). Precipitation events are in red and are in units of mm. Data gaps in May and June-August were due to resource limitations.
Comparison of Arequipa PM Nitrate δ15N Values With Other Studies
There are only a handful of studies investigating the δ15N of NO3−atm collected from the midlatitudes in the southern hemisphere that we can draw on to compare with our data (Song et al., 2021). Most southern hemisphere NO3−atm isotope data have been focused on polar samples from Antarctica (Jarvis et al., 2009; Berhanu et al., 2015; Savarino et al., 2016; Walters et al., 2019) that has unique NO3−atm isotope dynamics due to volatilization and photolysis of HNO3/NOx occurring in the snowpack (Jarvis et al., 2009; Berhanu et al., 2015) that makes for a poor comparison for our data. Thus, we focus our comparison on the non-polar, southern hemisphere data. NO3−atm isotopes were determined on aerosols collected along S-N transect across the Atlantic Ocean between Cape Town, South Africa, and northern France during April/May (Morin et al., 2009). Open ocean NO3−atm between 30°S and 10°N had δ15N values value were mostly negative (with respect to air N2), ranging from -7.1 to -1.6%, averaging -4 ± 2‰ and only became positive when influenced by urban/industrial plumes (Morin et al., 2009). In contrast, the Arequipa NO3−atm δ15N were almost all positive during the year and in April/May they ranged narrowly between +4 and +8‰ (excluding the +16‰ outlier). Measurements of δ15N values of NO3− collected at a coastal site in New Zealand (Li et al., 2021) were similar to the mid-Atlantic, ranging from −12‰ to +6‰. But most values were negative averaging at −4‰, and the lowest was April δ15N was around -8‰, significantly lower than those in Arequipa. In addition, in New Zealand, there was a significant seasonal variation, with higher δ15N values in the winter (range: −5‰ to +6‰; mean: 0‰) relative to summer (−12‰ to −4‰; −8‰). In contrast, the Arequipa the seasonal effect is less obvious relative to New Zealand, with the summer months (Jan-March) encompassing all of the lowest δ15N values. The δ15N of NO3−atm collected in dry deposition along a E-W transect in northern Chile were similar to our Arequipa results (Wang et al., 2014). Long-term (2 years) collection of NO3−atm in the Atacama Desert, 800 km south of Arequipa, had δ15N values ranging from +1.5 to +10.6‰, that generally decreased from δ15N highs along the coast (∼+8.5‰) and Andes (+10.5‰) to central valley values of +4.0 ± 2‰ (Wang et al., 2014). This average is similar to the annual mean in Arequipa of +5.3‰, suggesting similar NOx sources and/or photochemical oxidation pathways in both these regions. Along the inland portion of the Chile transect, the +4.0 ± 2‰ δ15N value was attributed to mobile NOx sources associated with the city of Calama, regional mining vehicles, and the Chilean central highway. Any seasonal variation associated with the transect deposition was masked by the 2-years collection period. These comparisons suggest that southern hemisphere ocean/coastal NO3−atm is either derived from unique NOx sources relative to southern hemisphere urban environments, like Arequipa, or that possibly the oxidation pathways converting NOx into NO3− atm are different in cleaner environments relative to urban systems.
Northern hemisphere NO3−atm δ15N values tend to be lower than those in Arequipa. Average Northern Hemisphere NO3−atm δ15N cluster around 0 ± 3‰ (SI Supplementary Figure S3) with urban values tending to slightly elevated relative to suburban values. East Asia values tend to be higher that North America and Europe, probably due to fewer NOx reduction systems on coal burning power plants that are prevalent in East Asia. Arequipa’s NO3−atm δ15N values appear to be generally higher than those in the northern hemisphere where NOx emissions are significantly higher than in the southern hemisphere.
Arequipa NOx Source Apportionment Using δ15N Mass Balance
In order to try and explain the δ15N values of Arequipa NO3−atm, and its variation, we first test the NOx “source hypothesis” by comparing to the measured NO3−atm δ15N values to NOx sources using an isotope mixing model. The source hypothesis claims that NOx is converted into NO3−atm relatively quickly and completely, resulting in δ15N values of the product NO3−atm identical to the source NOx. According to a 2004 regional NOx inventory (DIGESA, 2005), the two main anthropogenic sources of NOx in Arequipa are vehicles that account for 8,114 tonne NOx yr−1 and industry, contributing 1,072 tonne NOx yr−1 and roughly 80% of this is from coal combustion used during cement production. Arequipa vehicle NOx is generated primarily (DIGESA, 2005) by old trucks and buses without catalytic converters (70%) and newer automobiles with NOx reduction controls (30%). The δ15N values of vehicle NOx is mainly determined by whether the vehicle has NOx reduction technology such as 3-way catalytic converters. Gas and diesel engines without NOx reduction technology generate isotopically light NOx of around -15‰, due to the KIE of 14N reacting faster than 15N as N2 fragments in the engine cylinder during combustion (Walters et al., 2015). In contrast, newer vehicles with NOx reduction catalytic converters tend to produce NOx of around -2‰ (Walters et al., 2015; Miller et al., 2017) because for the same mechanistic reason, the KIE of 14N reacting faster than 15N as NOx is reduced by the catalytic converter (for details see Walters et al., 2015). We used a simple two component isotope mixing model to predict the δ15N from vehicles (δ15Nveh).
Where fcat and fnc are the molar fractions of NOx from vehicles with catalytic converters and without, respectively, and δ15Ncat and δ15Nnc are the δ15N values of NOx emitted by those same vehicles. This yields a vehicle NOx δ15N of approximately -11‰. Industrial NOx is primarily from coal burning during cement production and brick kiln operations that lack emission control technology. Previous research has shown that without emission controls, coal burning generates NOx with a δ15N of ∼ +14 to +18‰ (Felix et al., 2012), similar to the highest δ15N value in Arequipa NO3−atm of +12‰. Using another two-component mixing model and assuming industry (find = 0.12, δ15N = +16) and vehicles (fveh = 0.88) are the dominant anthropogenic NOx sources, isotope mass balance gives an expected anthropogenic NOx in Arequipa a δ15N of -8‰ (Figure 3). This is significantly lower than the Arequipa average (+5.3‰) or even the lowest value (−1.8‰) and would suggest that either industrial (coal burning) NOx is significantly underestimated, there is an uncounted for NOx source with high a15N/14N ratio, or that chemistry has altered the δ15N during the conversion of NOx into NO3−atm via kinetic, equilibrium, or photolysis isotope effects (Fang et al., 2021).
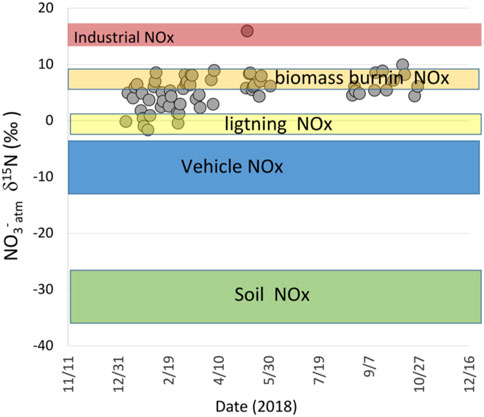
FIGURE 3. The δ15N values of possible NOx sources in Arequipa, Peru and the observed δ15N in PM2.5 collected in the city. Only major contributions of industrial or biomass burning NOx could explain the data purely from an isotope mixing model perspective and we argue this interpretation is incorrect due to 15N enrichment of NO3− relative to NOx via photochemical isotope effects.
It is unlikely that the discrepancy between the measured Arequipa NO3−atm δ15N and that expected from NOx source accounting can be resolved by assuming higher industrial emissions. Industrial emissions would need to be more than half of total NOx emissions to achieve isotope mass balance. Yet coal burning, the main industrial NOx source in the region, accounts for roughly 10% of total NOx (DIGESA, 2005) and this is from a single massive modern cement production plant (Yura S.A.) with quantified production rates and emission factors. Thus, industrial NOx emission uncertainty is low (DIGESA, 2005) and certainly not a factor of five higher than current estimates.
There is also no known natural NOx source with high a15N/14N ratio that could explain the elevated δ15N values of NO3−atm in Arequipa. Natural NOx is almost exclusively from either emission by soils during microbial nitrification and denitrification, produced by lightning, or biomass burning (natural or anthropogenic). None of these has significantly positive δ15N values to lead to elevated δ15N in PM nitrate. In fact soil NOx has the lowest δ15N (-25‰ to—40‰) of all known NOx sources (Li & Wang, 2008; Yu & Elliott, 2021). Further, soils are a considered minor source of NOx southern Peru because of the desert environment, minimal natural vegetation, and low amounts of rainfall. Indeed, a recent high resolution (0.25°lat. × 0.3125°long.) global NOx inventory (Weng et al., 2020) shows that in the Arequipa region less than 72 × 10−5 TgN yr−1 is attributed to soil emissions, less than 10% of the city anthropogenic emissions. Likewise, lightning has low δ15N values (∼0‰) and is also considered a small source of NOx in the area. Recent satellite analysis of lightening by Bond et al. (2002) found that while lightening accounted for roughly 23% of NOx in the tropics, it accounted for less that 1% over Peru west of the Andes including the Arequipa region. Thus, neither lightning nor soil NOx emissions can explain the positive δ15N value of NO3−atm observed in Arequipa.
Biomass burning derived NOx, either local or transported into the Arequipa region, is potential source, but both its δ15N values and other evidence suggest it cannot explain the observed elevated PM δ15N values. Biomass burning emissions are due to agricultural practices, forest clearing, and natural fires and the δ15N of NOx derived from biomass burning is nearly identical to the δ15N of the foliage being burned (Fibiger & Hastings, 2016). There is some local biomass burning in the Arequipa region used as means of removing crop residues and for pest management (field observations). The δ15N of crops are largely reflect a combination of the δ15N of the soil in which they grow (Hogberg, 1997) and the δ15N of applied fertilizer. Agriculture soil in the Arequipa district have δ15N of ∼2‰ (Filley, personal communication) and inorganic fertilizers are ∼0 ± 2‰ (Bateman & Kelly, 2007; Michalski, Kolanowski, & Riha, 2015). This suggests that local biomass burning NOx δ15N values would be just slightly positive and cannot significantly elevate the local NOx δ15N. Likewise, large biomass burning events that are seasonal occurrences in the Amazon Basin east of the Andes burn biomass with average δ15N of only +5‰ (Ometto et al., 2006). Some of these aerosols are known to be transported over the Andes by advected air masses (Bourgeois et al., 2015) yet the vast majority are removed by deposition and cloud chemistry as they pass through the planetary boundary layer (PBL) into the free troposphere as they surmount the Andes. After reaching the western side of the Andes they are diluted as they mix across the Pacific over a lifetime of 7–8 days and are quite slow to mix back into the PBL (Bourgeois et al., 2015). Amazon biomass burning occurs predominately in the dry season from June to November (Reddington et al., 2019), but our δ15N of PM NO3− in April-May is not significantly different relative to the biomass burning months of August-November. In addition, biomass burning aerosols are predominately organic carbon and the sum of Cl−, NO3−, and NH4+ make up less than 5% of the aerosol mass (Reddington et al., 2019).
Back trajectory analysis and ion data also suggest biomass burning (local or distant) in a minor NOx source in Arequipa. 48-h HYSPLIT back trajectory ensemble runs show that the origin of most air masses reaching Arequipa are from the ocean (43%) and the northern desert (34%), and only 18% of air masses are derived from the Andean highlands or Amazon (SI Supplementary Figure S4). The δ15N of NO3−atm in PM derived from the eastern air masses (8‰) is no different from the average. Potassium cations (K+) are a geochemical tracer of biomass burning (Andreae, 1983). PM2.5 K+ concentrations in Arequipa were 0.42 ± 0.19 mg/m3 and were not significantly higher in the biomass burning season (SI Supplementary Figure S2). Further K+ is best correlated with Na+ (R2 = 0.45) suggesting dust derived from local desert surface is the main K+ source (Olson et al., 2021; Li et al., 2021). We conclude that based on the small positive δ15N value of biomass NOx, the limited transport from biomass burning regions, and the lack of significant potassium variations that biomass burn can be considered a negligible NOx source and cannot account for the elevated δ15N values of NO3−atm observed throughout the year in Arequipa. Thus, the δ15N of Arequipa NO3−atm is difficult to reconcile from the perspective of NOx sources controlling the δ15N values.
A two NO3−atm source mixture to explain elevated values (or the annual δ15N variation) is also not supported by an isotope Keeling plot. In a two source system, regressing δ15N values versus 1/[NO3−N] should yield a correlation with a y-intercept that defines the δ15N of one of the sources, in this case an unknown source(s) with elevated δ15N (Keeling, 1961). The Keeling plot for Arequipa δ15N vs. 1/[NO3−] showed no correlation with an R2 of 0.07. This indicates that there is not an unknown 15N enriched NOx source (or combination of enriched sources) mixing with the combined known local NOx sources. These considerations suggest that the elevated δ15N of NO3−atm in Arequipa PM2.5 is due, in part, to kinetic, equilibrium, and photolysis isotope effects occurring during the oxidation of NOx in NO3−atm.
Calculations of isotope equilibrium suggest that during the oxidation of NOx, NOy compounds, including NO3−atm, should decome isotopcally enriched relative to the initial NOx, which qualitatively explains the elevated δ15N values for NO3−atm in Arequipa relative to other southern hemisphere locatiosn. At equilibrium, N compounds tend to incorporate 15N preferentially into molecules with stronger bonds, which is usually a function of the compound’s oxidation state. For example, calculated isotope fractionation factors (15α) of nitrogen oxides at 298 K (Walters and Michalski, 2015) increase (relative to NO) as the N oxidation state increases (Figure 4) from 2 (NO) to 5 (HNO3, N2O5, and HNO4). Here, the isotope enrichment is defined as δ15N = (α-1) x 1,000. The result would be the δ15N of NO3−atm would be elevated relative to the emission source, leaving behind NOx with lower δ15N that could be transported away from the source area. This isotope photochemistry effect would explain elevated NO3−atm δ15N values near emission sources (Arequipa) and low NO3−atm δ15N values in remote ocean regions (Morin et al., 2009; Li et al., 2021) since it would form from the residual NOx transported from the continents. This is analogous to water vapor isotopes becoming depleted as a function of the rainout fraction and depositing isotopically light rain as a function of distance or altitude (Gat, 1996).
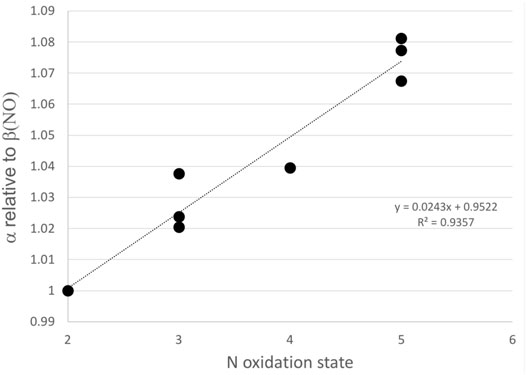
FIGURE 4. The isotope fractionation factors for 15N in nitrogen oxides with different oxidation states. The 15α were calculated as βNOy/βNO where βNO and βNOy are the calculated values using coefficients from Table 1 in Walters and Michalski (2015) for NO and NO2, NO2−, HONO, N2O3, HNO3, N2O5, and HNO4 at 298 K, respectively.
Quantifying the Influence of Photochemical Isotope Effects on Nitrate PM δ15N Using iNRACM
We quantitatively explored the photochemistry effect in Arequipa using the isotope enabled iNRACM photochemical box model (Fang et al., 2021). Briefly, the model accounts for kinetic isotope effects associated with bimolecular reactions such as NO + O3 → NO2 + O2 (Walters and Michalski (2016), equilibrium isotope effects such as NOx isotope exchange (Walters et al., 2016), and photolysis isotope effects, mainly NO2 → NO + O (Fang et al., 2021). In addition, the model accounts for the amount of NOx converted to nitrate, and has demonstrated that when conversion reaches 100%, the NO3−atm δ15N is the same as the NOx source but that isotope fractionation is greatest when conversion fractions are small, similar to more simplistic Rayleigh models. The iNRACM model predicts that the NO3−atm δ15N values are elevated by 10–20‰ relative to the NOx source, while the residual NOx becomes 15N depleted (Figure 5). There is a seasonality to the δ15N values, with the southern hemisphere late fall months (May) having higher values and the Summer/Spring months with lower values (Figure 5). This is driven primarily by differences in daylight hours and thus the isotope sensitivity of photolysis reactions. When the initial NOx source is shifted to -8‰, based on our isotope mass balance mixing model of known NOx sources (discussion above) the iNRACM model does a fair job of replicating the data (Figure 6). For example, the spread in NO3−atm δ15N values observed in the May and Aug–Oct. (±3‰) is captured by the iNRACM model though the modeled values in May are shifted upward by about six‰ relative to the observed values. The iNRACM model tends to under predict the observed δ15N values during the summer months (Jan-Mar.), nor does it capture the roughly ±4‰ spread in the values during this period. The root mean square error (RMSE) between the model and data assuming a 0‰ source is 8.9‰, but and improves to 3.7‰ when the source is assumed to be -8‰ based on our isotope mass balance mixing model (Figure 3). The accuracy of the iNRACM model on a day-by-day comparison is less robust, with a model versus observed R2 = 0.14.
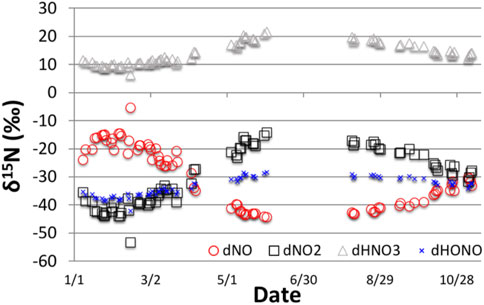
FIGURE 5. The δ15N values of NO3− (HNO3), NO, NO2 and HONO predicted by iNRACM for Arequipa conditions for a NOx defined as 0‰. δ15N shifts between NO and NO2 is due to NO-NO2 isotope exchange (Walters et al., 2016). The enrichment of NO3−atm is due kinetic, equilibrium and photolysis isotope effects as discussed in Fang et al., 2021)
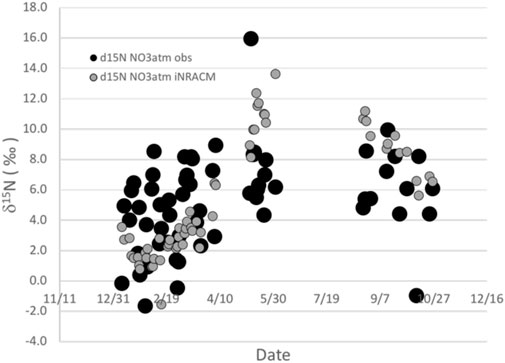
FIGURE 6. The δ15N values measured in NO3−atm from PM2.5 collected in Arequipa, Peru (solid circle) vs those predicted by the iNRACM. Size of the solid circle is based on the uncertainty in the δ15N analysis.
The inability of the iNRACM model to accurately predict the day by day NO3−atm δ15N values is not surprising given the assumptions in the model. The main limitation of the iNRACM model is the assumption that the daily NOx source mixture δ15N is single valued. This is clearly not the case when considering the main NOx source, based on the local emission inventory, of vehicle NOx. We defined the NOx from vehicles without catalyzed NOx reduction technologies as a single value (-15‰), when in fact this is only an average and that individual vehicles can range from -7‰ to -19‰. This range believed to be caused is cause by kinetic isotope effects occurring in the Zeldovich mechanism during fuel combustion in the engine cylinder (Walters et al., 2015). The kinetics and subsequent isotope effect is thus a function of the engine efficiency and running conditions. Likewise, NOx from vehicles with catalyzed NOx reduction technology also exhibit a significant range (-19‰ to +10‰). This is caused by the NOx reduction efficiency of the catalytic converter which in turn is a function of the converter temperature and drive time, with the NOx δ15N values becoming less negative and even going positive as NOx reduction is maximized (Walters et al., 2015). Likewise, other known NOx sources (industry, biomass burning) and natural sources (soil, lightening) are temporally variable. Thus, some of the ±3‰ spread in the observed δ15N values not captured the iNRACM model could simply be due to variations in NOx sources with time. Regular and reliable trace gas monitoring (NOx, O3, CO) in Arequipa would help resolve this uncertainty in future studies.
Another limitation of the iNRACM model’s ability to accurately predict the day by day NO3−atm δ15N values is that it neither accounts for atmospheric transport nor NO3−atm removal. Atmospheric transport is important in that the PM sampled may have derived from outside the city and transported in or under low wind conditions be primarily of city origin. If there were a clear difference between non-urban and urban NO3−atm δ15N values, then this difference should be evident in the Keeling isotope plot (Figure 4) if the two sources are well mixed, which it is not. However, transport cannot be conclusively ruled out. Deposition of NO3−atm is important because it minimizes (maximizes) what can be viewed as an isotope steady state. For example, under stagnant winds and dry conditions urban NOx would be emitted and converted into NO3−atm and the longer those conditions prevail the closer the δ15N value of NO3−atm would be to those of the emitted NOx via isotope mass balance, which is the steady state condition (Fang et al., 2021). In contrast, after a rainstorm that removes most NO3−atm by wet deposition, the system will reset and the δ15N value of NO3−atm would become a function of not only the NOx δ15N but also the isotope effects that occur during the initial partitioning into the NOy reservoirs (Fang et al., 2021). This may partially explain the greater range of δ15N values during the rainy season. In other words, the relative importance of the “source” versus “chemistry” isotope effects is a function of NO3−atm residence time. Since neither transport nor removal are in the iNRACM model it cannot capture this residence time effect. A more accurate modeling system would be a 3-D chemical transport model that incorporates both temporal/spatial NOx emission rates and their δ15N values, 3-D mixing via pressure/temperature gradients, and N isotope effects incorporated into its chemical mechanism. Unfortunately, such a model does not yet exist.
Conclusion
We report on the first time series of δ15N in aerosol nitrate (PM2.5) from South America. PM2.5 was collected at four sites located in Arequipa, a major city in southern Peru. PM2.5 nitrate concentrations ranged from a minimum of 0.17 mg/m3 to a maximum of 2.87 mg/m3 and averaged 0.90 mg/m3 and accounted for 9–12% of the ion mass. Nitrate δ15N values ranged from −1.7–15.9‰ and averaged 5.3 ± 3.0‰, with no significant difference between the four study sites and no discernable seasonal trend, but this lack of a seasonal trend may be an artifact of gaps in the data and the movement of the sampler between the sampler over the course of a year. These δ15N values are significantly higher than those in aerosol nitrate from southern hemisphere marine environments and those from the northern hemisphere. An isotope enabled 0-D photochemical box model (inRACM; Fang et al., 2021) was used to estimate the isotope enrichment of nitrate relative to NOx due to kinetic, equilibrium, and photolysis isotope effects occurring during NOx oxidation. After correcting for the photochemical isotope effect, we estimated a NOx sources with δ15N of -8 ± 3‰. Using an isotope mass balance mixing model that utilized known NOx source δ15N it was determined that NOx in Arequipa is derived mainly from anthropogenic sources (vehicles and some industry), in general agreement a recent emission inventory. Without the photochemical isotopes effect correction, the data indicates a NOx source with a significantly positive δ15N value, possibly coal burning or biomass burning, which is unlikely given the sparse vegetation in the region. This suggests that the photochemical isotope effect must be accounted for if nitrate δ15N values are to be used to accurately constrain NOx sources. If it is accounted, then measurements PM nitrate δ15N values could be a new tool to validate NOx emission inventories in other locations. This is of particular relevance in regions where detailed NOx emissions inventories are lacking, such as South America and Africa. Further, the “photochemistry + source” hypothesis can be further tested in regions where NOx sources are more varied and the NOx inventories are the thought to be more accurate (US, Europe) by measuring PM nitrate δ15N at high temporal and spatial scales.
Data Availability Statement
The original contributions presented in the study are included in the article/Supplementary Materials, further inquiries can be directed to the corresponding author.
Author Contributions
GM is the PI, analyzed the data, and wrote the manuscript. AE and JR collected the PM samples and conducted the gravimetric analysis. HF and JL conducted the modeling and isotope analysis. EO prepared the samples for analysis and conducted ion analysis. LW is Co-Pi and assisted in preparing the manuscript and training students.
Funding
For this work provided by the Arequipa Nexus Institute for Food, Energy, Water, and the Environment through the Universidad Nacional de San Agustin (UNSA), Arequipa Peru. A cooperation between UNSA and Purdue University, United States of America. Funding was also provided by the Purdue Climate Change Research Center (PCCRC) and the National Science Foundation NSF P2C2 program.
Conflict of Interest
The authors declare that the research was conducted in the absence of any commercial or financial relationships that could be construed as a potential conflict of interest.
Publisher’s Note
All claims expressed in this article are solely those of the authors and do not necessarily represent those of their affiliated organizations, or those of the publisher, the editors and the reviewers. Any product that may be evaluated in this article, or claim that may be made by its manufacturer, is not guaranteed or endorsed by the publisher.
Supplementary Material
The Supplementary Material for this article can be found online at: https://www.frontiersin.org/articles/10.3389/fenvs.2022.916738/full#supplementary-material
References
Altabet, M. A., Wassenaar, L. I., Douence, C., and Roy, R. (2019). A Ti(III) Reduction Method for One‐step Conversion of Seawater and Freshwater Nitrate into N 2 O for Stable Isotopic Analysis of 15 N/14 N, 18 O/16 O and 17 O/16 O. Rapid Commun. Mass Spectrom. 33 (15), 1227–1239. doi:10.1002/rcm.8454
Álvarez-Tolentino, D., and Suárez-Salas, L. (2020). Aporte Cuantitativo De Las Fuentes De Pm10 Y Pm2.5 En Sitios Urbanos Del Valle Del Mantaro, Perú. Rica 36 (4), 875–892. doi:10.20937/rica.53473
Andreae, M. O., and Crutzen, P. J. (1997). Atmospheric Aerosols: Biogeochemical Sources and Role in Atmospheric Chemistry. Science 276 (5315), 1052–1058. doi:10.1126/science.276.5315.1052
Andreae, M. O. (1983). Soot Carbon and Excess Fine Potassium: Long-Range Transport of Combustion-Derived Aerosols. Science 220, 1148–1151. doi:10.1126/science.220.4602.1148
Arequipa, G. R. de. (2020). Salud Arequipa. Retrieved from Available at: http://www.saludarequipa.gob.pe/unidades-organicas-3/dir-ejec-de-salud-ambiental/ecologia-proteccion-del-ambiente-y-salud-ocupacional/vigilancia-de-la-calidad-del-aire/.
Atkinson, R., Baulch, D. L., Cox, R. A., Hampson, R. F., Kerr, J. A., and Troe, J. (1992). Evaluated Kinetic and Photochemical Data for Atmospheric Chemistry: Supplement IV. IUPAC Subcommittee on Gas Kinetic Data Evaluation for Atmospheric Chemistry. J. Phys. Chem. Reference Data 21 (6), 1125–1568. doi:10.1063/1.555918
Atkinson, R. (1990). Gas-phase Tropospheric Chemistry of Organic Compounds: A Review. Atmos. Environ. Part A. General Top. 24 (1), 1–41. doi:10.1016/0960-1686(90)90438-s
Bateman, A. S., and Kelly, S. D. (2007). Fertilizer Nitrogen Isotope Signatures. Isotopes Environ. Health Stud. 43 (3), 237–247. doi:10.1080/10256010701550732
Berhanu, T. A., Savarino, J., Erbland, J., Vicars, W. C., Preunkert, S., Martins, J. F., et al. (2015). Isotopic Effects of Nitrate Photochemistry in Snow: a Field Study at Dome C, Antarctica. Atmos. Chem. Phys. 15 (19), 11243–11256. doi:10.5194/acp-15-11243-2015
Böhlke, J. K., Mroczkowski, S. J., and Coplen, T. B. (2003). Oxygen Isotopes in Nitrate: New Reference Materials for18O:17O:16O Measurements and Observations on Nitrate-Water Equilibration. Rapid Commun. Mass Spectrom. 17, 1835–1846. doi:10.1002/rcm.1123
Bond, D. W., Steiger, S., Zhang, R., Tie, X., and Orville, R. E. (2002). The Importance of NOx Production by Lightning in the Tropics. Atmos. Environ. 36 (9), 1509–1519. doi:10.1016/s1352-2310(01)00553-2
Boon, R. G. J., Alexaki, A., and Becerra, E. H. (2001). The Ilo Clean Air Project: a Local Response to Industrial Pollution Control in Peru. Environ. Urbanization 13 (2), 215–232. doi:10.1177/095624780101300217
Brown, S. S., Burkholder, J. B., Talukdar, R. K., and Ravishankara, A. R. (2001). Reaction of Hydroxyl Radical with Nitric Acid: Insights into its Mechanism. J. Phys. Chem. A 105 (9), 1605–1614. doi:10.1021/jp002394m
Brown, S. S., Ryerson, T. B., Wollny, A. G., Brock, C. A., Peltier, R., Sullivan, A. P., et al. (2006). Variability in Nocturnal Nitrogen Oxide Processing and its Role in Regional Air Quality. Science 311 (5757), 67–70. doi:10.1126/science.1120120
Bruningfann, C. S., and Kaneene, J. B. (1993). The Effects of Nitrate, Nitrite and N-Nitroso Compounds on Human Health - A Review. Veterinary Hum. Toxicol. 35 (6), 521–538.
Cao, Z., Zhou, X., Ma, Y., Wang, L., Wu, R., Chen, B., et al. (2017). The Concentrations, Formations, Relationships and Modeling of Sulfate, Nitrate and Ammonium (SNA) Aerosols over China. Aerosol Air Qual. Res. 17 (1), 84–97. doi:10.4209/aaqr.2016.01.0020
Carn, S. A., Krueger, A. J., Krotkov, N. A., Yang, K., and Levelt, P. F. (2007). Sulfur Dioxide Emissions from Peruvian Copper Smelters Detected by the Ozone Monitoring Instrument. Geophys. Res. Lett. 34 (9). doi:10.1029/2006gl029020
Chang, W. L., Bhave, P. V., Brown, S. S., Riemer, N., Stutz, J., and Dabdub, D. (2011). Heterogeneous Atmospheric Chemistry, Ambient Measurements, and Model Calculations of N2O5: A Review. Aerosol Sci. Technol. 45 (6), 665–695. doi:10.1080/02786826.2010.551672
Charlson, R. J., Schwartz, S. E., Hales, J. M., Cess, R. D., Coakley, J. A., Hansen, J. E., et al. (1992). Climate Forcing by Anthropogenic Aerosols. Science 255 (5043), 423–430. doi:10.1126/science.255.5043.423
Chen, W. T., Liao, H., and Seinfeld, J. H. (2007). Future Climate Impacts of Direct Radiative Forcing of Anthropogenic Aerosols, Tropospheric Ozone, and Long-Lived Greenhouse Gases. J. Geophys. Research-Atmospheres 112 (D14). doi:10.1029/2006jd008051
Digesa (2005). Inventario de emisiones cuenca atmosferica de la ciudad de Arequipa. Available at: http://www.digesa.minsa.gob.pe.
Elliott, E. M., Kendall, C., Boyer, E. W., Burns, D. A., Lear, G. G., Golden, H. E., et al. (2009). Dual Nitrate Isotopes in Dry Deposition: Utility for Partitioning NOx Source Contributions to Landscape Nitrogen Deposition. J. Geophys. Research-Biogeosciences 114. doi:10.1029/2008jg000889
Elliott, E. M., Kendall, C., Wankel, S. D., Burns, D. A., Boyer, E. W., Harlin, K., et al. (2007). Nitrogen Isotopes as Indicators of NOx Source Contributions to Atmospheric Nitrate Deposition across the Midwestern and Northeastern United States. Environ. Sci. Technol. 41 (22), 7661–7667. doi:10.1021/es070898t
Elliott, E. M., Rose, L., and Felix, J. (2007). New Insights about the Influence of Reactive Nitrogen Deposition on Ecosystem Processes.
Felix, J. D., Elliott, E. M., Avery, G. B., Kieber, R. J., Mead, R. N., Willey, J. D., et al. (2015). Isotopic Composition of Nitrate in Sequential Hurricane Irene Precipitation Samples: Implications for Changing NOx Sources. Atmos. Environ. 106, 191–195. doi:10.1016/j.atmosenv.2015.01.075
Felix, J. D., and Elliott, E. M. (2014). Isotopic Composition of Passively Collected Nitrogen Dioxide Emissions: Vehicle, Soil and Livestock Source Signatures. Atmos. Environ. 92, 359–366. doi:10.1016/j.atmosenv.2014.04.005
Felix, J. D., Elliott, E. M., and Shaw, S. L. (2012). Nitrogen Isotopic Composition of Coal-Fired Power Plant NOx: Influence of Emission Controls and Implications for Global Emission Inventories. Environ. Sci. Technol. 46 (6), 3528–3535. doi:10.1021/es203355v
Feng, Y., and Penner, J. E. (2007). Global Modeling of Nitrate and Ammonium: Interaction of Aerosols and Tropospheric Chemistry. J. Geophys. Research-Atmospheres 112 (D1). doi:10.1029/2005jd006404
Fibiger, D. L., and Hastings, M. G. (2016). First Measurements of the Nitrogen Isotopic Composition of NOx from Biomass Burning. Environ. Sci. Technol. 50 (21), 11569–11574. doi:10.1021/acs.est.6b03510
Finlayson-Pitts, B. J., and Pitts, J. N. (2000). Chemistry of the Upper and Lower Atmosphere. San Diego: Academic Press.
Freyer, H. D., Kley, D., Volz-Thomas, A., and Kobel, K. (1993). On the Interaction of Isotopic Exchange Processes with Photochemical Reactions in Atmospheric Oxides of Nitrogen. J. Geophys. Res. 98 (D8), 14791–14796. doi:10.1029/93jd00874
Freyer, H. D. (1978). Seasonal Trends of NH+4 and NO-3 Nitrogen Isotope Composition in Rain Collected at Jülich, Germany. Tellus 30 (1), 83–92. doi:10.3402/tellusa.v30i1.10319
Galloway, J. N., Aber, J. D., Erisman, J. W., Seitzinger, S. P., Howarth, R. W., Cowling, E. B., et al. (2003). The Nitrogen Cascade. Bioscience 53 (4), 341–356. doi:10.1641/0006-3568(2003)053[0341:tnc]2.0.co;2
Galloway, J. N., Dentener, F. J., Capone, D. G., Boyer, E. W., Howarth, R. W., Seitzinger, S. P., et al. (2004). Nitrogen Cycles: Past, Present, and Future. Biogeochemistry 70 (2), 153–226. doi:10.1007/s10533-004-0370-0
Gat, J. R. (1996). Oxygen and Hydrogen Isotopes in the Hydrologic Cycle. Annu. Rev. Earth Planet. Sci. 24, 225–262. doi:10.1146/annurev.earth.24.1.225
Guelle, W., Schulz, M., Balkanski, Y., and Dentener, F. (2001). Influence of the Source Formulation on Modeling the Atmospheric Global Distribution of Sea Salt Aerosol. J. Geophys. Res. 106 (D21), 27509–27524. doi:10.1029/2001jd900249
Guo, Y., Zhang, J., An, J., Qu, Y., Liu, X., Sun, Y., et al. (2020). Effect of Vertical Parameterization of a Missing Daytime Source of HONO on Concentrations of HONO, O3 and Secondary Organic Aerosols in Eastern China. Atmos. Environ. 226, 117208. doi:10.1016/j.atmosenv.2019.117208
Hajat, A., Hsia, C., and O’Neill, M. S. (2015). Socioeconomic Disparities and Air Pollution Exposure: a Global Review. Curr. Envir Health Rpt 2 (4), 440–450. doi:10.1007/s40572-015-0069-5
Hall, J. V., Winer, A. M., Kleinman, M. T., Lurmann, F. W., Brajer, V., and Colome, S. D. (1992). Valuing the Health Benefits of Clean Air. Science 255, 812–817. doi:10.1126/science.1536006
Hastings, M. G., Casciotti, K. L., and Elliott, E. M. (2013). Stable Isotopes as Tracers of Anthropogenic Nitrogen Sources, Deposition, and Impacts. Elements 9 (5), 339–344. doi:10.2113/gselements.9.5.339
Hastings, M. G., Sigman, D. M., and Lipschultz, F. (2003). Isotopic Evidence for Source Changes of Nitrate in Rain at Bermuda. J. Geophys. Research-Atmospheres 108 (D24). doi:10.1029/2003jd003789
Heaton, T. H. E. (1987). Ratios of Nitrate and Ammonium in Rain at Pretoria, South Africa. Atmos. Environ. (1967) 21 (4), 843–852. doi:10.1016/0004-6981(87)90080-1
Högberg, P. (1997). Tansley Review No. 95 15 N Natural Abundance in Soil‐plant Systems. New Phytol. 137 (2), 179–203. doi:10.1046/j.1469-8137.1997.00808.x
Huamán De La Cruz, A., Bendezu Roca, Y., Suarez-Salas, L., Pomalaya, J., Alvarez Tolentino, D., and Gioda, A. (2019). Chemical Characterization of PM2.5 at Rural and Urban Sites Around the Metropolitan Area of Huancayo (Central Andes of Peru). Atmosphere 10 (1), 21. doi:10.3390/atmos10010021
Jarvis, J. C., Hastings, M. G., Steig, E. J., and Kunasek, S. A. (2009). Isotopic Ratios in Gas-phase HNO3and Snow Nitrate at Summit, Greenland. J. Geophys. Res. 114. doi:10.1029/2009jd012134
Kastler, J., and Ballschmiter, K. (1998). Bifunctional Alkyl Nitrates. Trace Constituents of the Atmosphere. Fresenius' J. Anal. Chem. 360 (7-8), 812–816. doi:10.1007/s002160050815
Keeling, C. D. (1961). The Concentration and Isotopic Abundances of Carbon Dioxide in Rural and Marine Air. Geochimica Cosmochimica Acta 24 (3-4), 277–298. doi:10.1016/0016-7037(61)90023-0
Lajtha, K., and Jones, J. (2013). Trends in Cation, Nitrogen, Sulfate and Hydrogen Ion Concentrations in Precipitation in the United States and Europe from 1978 to 2010: a New Look at an Old Problem. Biogeochemistry 116 (1-3), 303–334. doi:10.1007/s10533-013-9860-2
Larrea Valdivia, A. E., Reyes Larico, J. A., Salcedo Peña, J., and Wannaz, E. D. (2020). Health Risk Assessment of Polycyclic Aromatic Hydrocarbons (PAHs) Adsorbed in PM2.5 and PM10 in a Region of Arequipa, Peru. Environ. Sci. Pollut. Res. 27 (3), 3065–3075. doi:10.1007/s11356-019-07185-5
Lelieveld, J., Evans, J. S., Fnais, M., Giannadaki, D., and Pozzer, A. (2015). The Contribution of Outdoor Air Pollution Sources to Premature Mortality on a Global Scale. Nature, 525(7569), 367, 371-+. doi:10.1038/nature15371
Li, D., and Wang, X. (2008). Nitrogen Isotopic Signature of Soil-Released Nitric Oxide (NO) after Fertilizer Application. Atmos. Environ. 42 (19), 4747–4754. doi:10.1016/j.atmosenv.2008.01.042
Li, J., Davy, P., Harvey, M., Katzman, T., Mitchell, T., and Michalski, G. (2021). Nitrogen Isotopes in Nitrate Aerosols Collected in the Remote Marine Boundary Layer: Implications for Nitrogen Isotopic Fractionations Among Atmospheric Reactive Nitrogen Species. Atmos. Environ. 245, 118028. doi:10.1016/j.atmosenv.2020.118028
Li, J., Wang, F., Michalski, G., and Wilkins, B. (2019). Atmospheric Deposition across the Atacama Desert, Chile: Compositions, Source Distributions, and Interannual Comparisons. Chem. Geol. 525, 435–446. doi:10.1016/j.chemgeo.2019.07.037
Lynch, J. A., Bowersox, V. C., and Grimm, J. W. (2000). Acid Rain Reduced in Eastern United States. Environ. Sci. Technol. 34 (6), 940–949. doi:10.1021/es9901258
Michalski, G., Kolanowski, M., and Riha, K. M. (2015). Oxygen and Nitrogen Isotopic Composition of Nitrate in Commercial Fertilizers, Nitric Acid, and Reagent Salts. Isotopes Environ. Health Stud. 51 (3), 382–391. doi:10.1080/10256016.2015.1054821
Michalski, G., Savarino, J., Böhlke, J. K., and Thiemens, M. (2002). Determination of the Total Oxygen Isotopic Composition of Nitrate and the Calibration of a Δ17Ο Nitrate Reference Material. Anal. Chem. 74 (19), 4989–4993. doi:10.1021/ac0256282
Miller, C. E., and Yung, Y. L. (2000). Photo-induced Isotopic Fractionation. J. Geophys. Res. 105 (D23), 29039–29051. doi:10.1029/2000jd900388
Miller, D. J., Wojtal, P. K., Clark, S. C., and Hastings, M. G. (2017). Vehicle NO X Emission Plume Isotopic Signatures: Spatial Variability across the Eastern United States. J. Geophys. Res. Atmos. 122, 4698–4717. doi:10.1002/2016JD025877
Monks, P. S. (2005). Gas-phase Radical Chemistry in the Troposphere. Chem. Soc. Rev. 34 (5), 376–395. doi:10.1039/b307982c
Monks, P. S., Granier, C., Fuzzi, S., Stohl, A., Williams, M. L., Akimoto, H., et al. (2009). Atmospheric Composition Change - Global and Regional Air Quality. Atmos. Environ. 43 (33), 5268–5350. doi:10.1016/j.atmosenv.2009.08.021
Moore, H. (1977). The Isotopic Composition of Ammonia, Nitrogen Dioxide and Nitrate in the Atmosphere. Atmos. Environ. (1967) 11 (12), 1239–1243. doi:10.1016/0004-6981(77)90102-0
Morin, S., Savarino, J., Frey, M. M., Domine, F., Jacobi, H.-W., Kaleschke, L., et al. (2009). Comprehensive Isotopic Composition of Atmospheric Nitrate in the Atlantic Ocean Boundary Layer from 65°S to 79°N. J. Geophys. Res. 114, D05303. doi:10.1029/2008jd010696
Ometto, J. P. H. B., Ehleringer, J. R., Domingues, T. F., Berry, J. A., Ishida, F. Y., Mazzi, E., et al. (2006). The Stable Carbon and Nitrogen Isotopic Composition of Vegetation in Tropical Forests of the Amazon Basin, Brazil. Biogeochemistry 79 (1-2), 251–274. doi:10.1007/s10533-006-9008-8
Pan, Y., Tian, S., Liu, D., Fang, Y., Zhu, X., Gao, M., et al. (2018). Source Apportionment of Aerosol Ammonium in an Ammonia-Rich Atmosphere: An Isotopic Study of Summer Clean and Hazy Days in Urban Beijing. J. Geophys. Res. Atmos. 123 (10), 5681–5689. doi:10.1029/2017jd028095
Pearce, J. L., Rathbun, S. L., Aguilar-Villalobos, M., and Naeher, L. P. (2009). Characterizing the Spatiotemporal Variability of PM2.5 in Cusco, Peru Using Kriging with External Drift. Atmos. Environ. 43 (12), 2060–2069. doi:10.1016/j.atmosenv.2008.10.060
Peng, Q., Palm, B. B., Melander, K. E., Lee, B. H., Hall, S. R., Ullmann, K., et al. (2020). HONO Emissions from Western U.S. Wildfires Provide Dominant Radical Source in Fresh Wildfire Smoke. Environ. Sci. Technol. 54 (10), 5954–5963. doi:10.1021/acs.est.0c00126
Pilegaard, K. (2013). Processes Regulating Nitric Oxide Emissions from Soils. Philos. Trans. R. Soc. Lond B Biol. Sci. 368 (1621), 20130126. doi:10.1098/rstb.2013.0126
Prinn, R. G. (2003). The Cleansing Capacity of the Atmosphere. Annu. Rev. Environ. Resour. 28, 29–57. doi:10.1146/annurev.energy.28.011503.163425
Pusede, S. E., Duffey, K. C., Shusterman, A. A., Saleh, A., Laughner, J. L., Wooldridge, P. J., et al. (2016). On the Effectiveness of Nitrogen Oxide Reductions as a Control over Ammonium Nitrate Aerosol. Atmos. Chem. Phys. 16 (4), 2575–2596. doi:10.5194/acp-16-2575-2016
Pye, H. O. T., Chan, A. W. H., Barkley, M. P., and Seinfeld, J. H. (2010). Global Modeling of Organic Aerosol: the Importance of Reactive Nitrogen (NO<sub>x</sub> and NO<sub>3</sub>). Atmos. Chem. Phys. 10 (22), 11261–11276. doi:10.5194/acp-10-11261-2010
Reddington, C. L., Morgan, W. T., Darbyshire, E., Brito, J., Coe, H., Artaxo, P., et al. (2019). Biomass Burning Aerosol over the Amazon: Analysis of Aircraft, Surface and Satellite Observations Using a Global Aerosol Model. Atmos. Chem. Phys. 19 (14), 9125–9152. doi:10.5194/acp-19-9125-2019
Riemer, N., Vogel, H., Vogel, B., Schell, B., Ackermann, I., Kessler, C., et al. (2003). Impact of the Heterogeneous Hydrolysis of N2O5on Chemistry and Nitrate Aerosol Formation in the Lower Troposphere under Photosmog Conditions. J. Geophys. Res. 108 (D4), 4144. doi:10.1029/2002JD002436
Romer, P. S., Duffey, K. C., Wooldridge, P. J., Allen, H. M., Ayres, B. R., Brown, S. S., et al. (2016). The Lifetime of Nitrogen Oxides in an Isoprene-Dominated Forest. Atmos. Chem. Phys. 16 (12), 7623–7637. doi:10.5194/acp-16-7623-2016
Romero, Y., Chicchon, N., Duarte, F., Noel, J., Ratti, C., and Nyhan, M. (2020). Quantifying and Spatial Disaggregation of Air Pollution Emissions from Ground Transportation in a Developing Country Context: Case Study for the Lima Metropolitan Area in Peru. Sci. Total Environ. 698, 134313. doi:10.1016/j.scitotenv.2019.134313
Romero, Y., Diaz, C., Meldrum, I., Arias Velasquez, R., and Noel, J. (2020). Temporal and Spatial Analysis of Traffic - Related Pollutant under the Influence of the Seasonality and Meteorological Variables over an Urban City in Peru. Heliyon 6 (6), e04029. doi:10.1016/j.heliyon.2020.e04029
Savard, M. M., Cole, A., Smirnoff, A., and Vet, R. (2017). δ 15 N Values of Atmospheric N Species Simultaneously Collected Using Sector-Based Samplers Distant from Sources - Isotopic Inheritance and Fractionation. Atmos. Environ. 162, 11–22. doi:10.1016/j.atmosenv.2017.05.010
Savarino, J., Vicars, W. C., Legrand, M., Preunkert, S., Jourdain, B., Frey, M. M., et al. (2016). Oxygen Isotope Mass Balance of Atmospheric Nitrate at Dome C, East Antarctica, during the OPALE Campaign. Atmos. Chem. Phys. 16 (4), 2659–2673. doi:10.5194/acp-16-2659-2016
Seinfeld, J. H., and Pandis, S. N. (1998). Atmospheric Chemistry and Physics : From Air Pollution to Climate Change. 1 ed. New York: Wiley.
Silva, J., Rojas, J., Norabuena, M., Molina, C., Toro, R. A., and Leiva-Guzmán, M. A. (2017). Particulate Matter Levels in a South American Megacity: the Metropolitan Area of Lima-Callao, Peru. Environ. Monit. Assess. 189 (12). doi:10.1007/s10661-017-6327-2
Song, W., Liu, X.-Y., Hu, C.-C., Chen, G.-Y., Liu, X.-J., Walters, W. W., et al. (2021). Important Contributions of Non-fossil Fuel Nitrogen Oxides Emissions. Nat. Commun. 12 (1), 243. doi:10.1038/s41467-020-20356-0
Spak, S. N., and Holloway, T. (2009). Seasonality of Speciated Aerosol Transport over the Great Lakes Region. J. Geophys. Research-Atmospheres 114. doi:10.1029/2008jd010598
Srivastava, R. K., Hall, R. E., Khan, S., Culligan, K., and Lani, B. W. (2005). Nitrogen Oxides Emission Control Options for Coal-Fired Electric Utility Boilers. J. Air & Waste Manag. Assoc. 55 (9), 1367–1388. doi:10.1080/10473289.2005.10464736
Stein, A. F., Draxler, R. R., Rolph, G. D., Stunder, B. J. B., Cohen, M. D., and Ngan, F. (2015). NOAA's HYSPLIT Atmospheric Transport and Dispersion Modeling System. Bull. Am. Meteorological Soc. 96 (12), 2059–2077. doi:10.1175/bams-d-14-00110.1
Walters, W. W., Fang, H., and Michalski, G. (2018). Summertime Diurnal Variations in the Isotopic Composition of Atmospheric Nitrogen Dioxide at a Small Midwestern United States City. Atmos. Environ. 179, 1–11. doi:10.1016/j.atmosenv.2018.01.047
Walters, W. W., Goodwin, S. R., and Michalski, G. (2015). Nitrogen Stable Isotope Composition (δ15N) of Vehicle-Emitted NOx. Environ. Sci. Technol. 49 (4), 2278–2285. doi:10.1021/es505580v
Walters, W. W., and Michalski, G. (2016). Ab Initiostudy of Nitrogen and Position-specific Oxygen Kinetic Isotope Effects in the NO + O3reaction. J. Chem. Phys. 145 (22), 224311. doi:10.1063/1.4968562
Walters, W. W., Michalski, G., Böhlke, J. K., Alexander, B., Savarino, J., and Thiemens, M. H. (2019). Assessing the Seasonal Dynamics of Nitrate and Sulfate Aerosols at the South Pole Utilizing Stable Isotopes. J. Geophys. Res. Atmos. 124 (14), 8161–8177. doi:10.1029/2019jd030517
Walters, W. W., and Michalski, G. (2015). Theoretical Calculation of Nitrogen Isotope Equilibrium Exchange Fractionation Factors for Various NO Y Molecules. Geochimica Cosmochimica Acta 164, 284–297. doi:10.1016/j.gca.2015.05.029
Walters, W. W., Simonini, D. S., and Michalski, G. (2016). Nitrogen Isotope Exchange between NO and NO 2 and its Implications for δ 15 N Variations in Tropospheric NO X and Atmospheric Nitrate. Geophys. Res. Lett. 43, 440–448. doi:10.1002/2015gl066438
Walters, W. W., Tharp, B. D., Fang, H., Kozak, B. J., and Michalski, G. (2015). Nitrogen Isotope Composition of Thermally Produced NOx from Various Fossil-Fuel Combustion Sources. Environ. Sci. Technol. 49 (19), 11363–11371. doi:10.1021/acs.est.5b02769
Wang, F., Michalski, G., Seo, J.-h., and Ge, W. (2014). Geochemical, Isotopic, and Mineralogical Constraints on Atmospheric Deposition in the Hyper-Arid Atacama Desert, Chile. Geochimica Cosmochimica Acta 135, 29–48. doi:10.1016/j.gca.2014.03.017
Weng, H., Lin, J., Martin, R., Millet, D. B., Jaeglé, L., Ridley, D., et al. (2020). Global High-Resolution Emissions of Soil NOx, Sea Salt Aerosols, and Biogenic Volatile Organic Compounds. Sci. Data 7 (1). doi:10.1038/s41597-020-0488-5
Yu, Z., and Elliott, E. M. (2021). Nitrogen Isotopic Fractionations during Nitric Oxide Production in an Agricultural Soil. Biogeosciences 18 (3), 805–829. doi:10.5194/bg-18-805-2021
Zhang, J., Chen, J., Xue, C., Chen, H., Zhang, Q., Liu, X., et al. (2019). Impacts of Six Potential HONO Sources on HOx Budgets and SOA Formation during a Wintertime Heavy Haze Period in the North China Plain. Sci. Total Environ. 681, 110–123. doi:10.1016/j.scitotenv.2019.05.100
Zhang, Y., Vijayaraghavan, K., Wen, X. Y., Snell, H. E., and Jacobson, M. Z. (2009). Probing into Regional Ozone and Particulate Matter Pollution in the United States: 1. A 1 Year CMAQ Simulation and Evaluation Using Surface and Satellite Data. J. Geophys. Research-Atmospheres 114. doi:10.1029/2009jd011898
Keywords: isotope N 15, aerosol, Peru, NOx—oxdies of nitrogen, air quality (AirQ)
Citation: Michalski G, E. Larrea Valdivia A, Olson E, Welp L, Fang H, Magara-Gomez K, Morales Paredes L, Reyes Larico J and Li J (2022) Identifying NOx Sources in Arequipa, Peru Using Nitrogen Isotopes in Particulate Nitrate. Front. Environ. Sci. 10:916738. doi: 10.3389/fenvs.2022.916738
Received: 09 April 2022; Accepted: 26 May 2022;
Published: 28 June 2022.
Edited by:
David Widory, Université du Québec à Montréal, CanadaReviewed by:
Sanjeev Dasari, UMR5001 Institut des Géosciences de l'Environnement (IGE), FranceZhiyuan Cong, Institute of Tibetan Plateau Research (CAS), China
Yunting Fang, Institute of Applied Ecology (CAS), China
Copyright © 2022 Michalski, E. Larrea Valdivia, Olson, Welp, Fang, Magara-Gomez, Morales Paredes, Reyes Larico and Li. This is an open-access article distributed under the terms of the Creative Commons Attribution License (CC BY). The use, distribution or reproduction in other forums is permitted, provided the original author(s) and the copyright owner(s) are credited and that the original publication in this journal is cited, in accordance with accepted academic practice. No use, distribution or reproduction is permitted which does not comply with these terms.
*Correspondence: Greg Michalski, gmichals@purdue.edu