 Felipe Avila
 James R. Mickelson
 Robert J. Schaefer
 Molly E. McCue
- 1Department of Veterinary Population Medicine, College of Veterinary Medicine, University of Minnesota, St. Paul, MN, United States
- 2Department of Veterinary and Biomedical Sciences, College of Veterinary Medicine, University of Minnesota, St. Paul, MN, United States
Selective breeding for athletic performance in various disciplines has resulted in population stratification within the American Quarter Horse (QH) breed. The goals of this study were to utilize high density genotype data to: (1) identify genomic regions undergoing positive selection within and among QH subpopulations; (2) investigate haplotype structure within each QH subpopulation; and (3) identify candidate genes within genomic regions of interest (ROI), as well as biological pathways, predicted to play a role in elite performance in each group. For that, 65K SNP genotyping data on 143 elite individuals from 6 QH subpopulations (cutting, halter, racing, reining, western pleasure, and working cow) were imputed to 2M SNPs. Signatures of selection were identified using FST-based (di) and haplotype-based (hapFLK) analyses, accompanied by identification of local haplotype structure and sharing within subpopulations (hapQTL). Regions undergoing positive selection were identified on all 31 autosomes, and ROI on 2 chromosomes were identified by all 3 methods combined. Genes within each ROI were retrieved and used to identify pathways and genes that might contribute to performance in each subpopulation. These included, among others, candidate genes associated with skeletal muscle development, metabolism, and central nervous system development. This work improves our understanding of equine breed development, and provides breeders with a better understanding of how selective breeding impacts the performance of QH populations.
Introduction
The American Quarter Horse is the most common horse breed in the United States, with approximately 2.5 million registered individuals (2016 AQHA Annual Report)1 representing one third of the country's equine population. When accounting for the international equine population, the worldwide number of Quarter Horses (QH) reaches close to 3 million registered individuals (2016 AQHA Annual Report). Formally recognized as a breed with the establishment of the American Quarter Horse Association (AQHA) in 1940, the QH is a versatile and rugged breed that has been increasingly bred for performance in various disciplines. This versatility translates into profitability for the US equine industry: in 2015, over 130 million dollars were paid in awards or purses in AQHA-approved shows and races (2015 AQHA Annual Report)2.
Previous studies have shown that genetic diversity within the QH is high when compared to other horse breeds (McCue et al., 2012; Petersen et al., 2013a,b), which can be attributed to factors including genetic influence from other breeds (such as the Thoroughbred), as well as rapid and continuous population expansion (Petersen et al., 2014). Petersen et al. (2014) used both pedigree analysis and SNP genotyping data to determine if genetic differences exist across the QH breed itself by examining elite individuals from 6 performance groups (cutting, halter, racing, reining, western pleasure, and working cow). This work demonstrated that, with the exception of the working cow and cutting horse subpopulations, each performance group constitutes a genetically distinct subpopulation, a result of increased inbreeding over the past 75 years. Moreover, these data demonstrated that the QH subpopulations are genetically distinct due to the use of different breeding programs and different sire lines among different performance groups (Petersen et al., 2014).
Selection for a trait, accomplished through selective breeding practices, results in increased frequency of haplotype(s) containing the gene(s) and functional allele(s) conferring that phenotype at a rate greater than that expected under the null model of neutral evolution. This concept, termed a “selective sweep,” was first proposed by Smith and Haigh (1974). Genomic studies aiming at the identification of signatures of selection for phenotypes of interest, particularly performance traits, are being conducted in many livestock and domestic animal species; for example, cattle (Druet et al., 2014; Gutiérrez-Gil et al., 2015; Boitard et al., 2016; Randhawa et al., 2016), pigs (Li et al., 2014; Yang et al., 2014; Ma et al., 2015), sheep (Moradi et al., 2012; Fariello et al., 2013, 2014; Kijas, 2014), cats (Montague et al., 2014; Bertolini et al., 2016), and dogs (Akey et al., 2010; Boyko et al., 2010; Axelsson et al., 2013; Cagan and Blass, 2016). These studies have typically used a single method, such as the fixation index (FST), extended haplotype homozygosity (EHH) or runs of homozygosity (ROH), to identify from several to hundreds of loci potentially under positive selection. Although some studies were able to identify functional alleles that are potentially driving selective sweeps, the use of complementary approaches such as the composite selection signals (CSS) method to aid in corroboration and prioritization of the identified ROI has been suggested (Randhawa et al., 2014, 2015).
Signatures of selection have also been identified in the horse genome. Petersen et al. (2013b) used Equine SNP50 BeadChip (Illumina, San Diego, CA, USA) data on 744 horses from 33 breeds, coupled with di, a modified FST statistic (Akey et al., 2010), to identify and confirm loci associated with skeletal muscle fiber types in the QH (ECA18, MSTN gene), ability to perform alternative gaits in many breeds (ECA23, DMRT3 gene), and size in draft breeds and the Miniature horse (ECA11:23.4Mb). Numerous other highly significant ROI identified in that study require further investigation to define candidate genes and propose putative functional alleles. Frischknecht et al. (2016) identified a selection signature on ECA1, containing the IFF1R and ADAMTS17 genes, that is putatively associated with height in Shetland ponies, while Kader et al. (2015) reported genomic regions harboring candidate genes for height as undergoing positive selection in the Chinese Debao pony, including a region on ECA6 containing the height-associated HMGA2 gene in many pony breeds (Frischknecht et al., 2015). Moon et al. (2015) collected whole genome sequence (WGS) data from Thoroughbred stallions and, using FST analysis between the Thoroughbred and the Jeju pony (an ancestral-type population), identified 12 regions putatively undergoing directional selection in the Thoroughbred. And, McCoy et al. (2014) found evidence of historical positive selection around the GYS1 gene in Belgian horses, likely due to selection for enhanced glycogen deposition conferred by a gain of function mutation in glycogen synthase. Lastly, putative signatures of selection have been identified in racing and cutting QH subpopulations through relative extended haplotype homozygosity (REHH) analysis, combined with FST statistics (Meira et al., 2014; Beltrán et al., 2015). A total of 27 and 36 putative signatures of selection were identified in the racing and cutting lines, respectively, and putative candidate genes related to muscle, skeletal, cardiovascular, respiratory and nervous systems, vision, hearing, and cognition were identified (Meira et al., 2014; Beltrán et al., 2015).
In this study, we hypothesized that selective breeding within 6 QH subpopulations has increased the frequency of alleles responsible for elite performance, resulting in selective sweeps within each subpopulation. Based on this hypothesis, and relying on the principal of genetic hitchhiking, we used a combination of three approaches to identify genomic regions undergoing selection in elite QH performers that are likely to harbor alleles underlying performance traits. Within each of these regions, we identified genes and biological pathways predicted to play an important role in performance, which warrant further investigation to identify the underlying functional alleles.
Materials and Methods
Sample Collection and Genotyping
The individuals and Equine SNP70 genotyping data used in this study have been previously described (Petersen et al., 2014) and are publically available (animalgenome.org)3 Briefly, all horses included in this study were among the 200 top performers of each of the 6 subpopulations (cutting, halter, racing, reining, western pleasure, and working cow) as determined by money or points earned in 2009 and 2010 according to the AQHA, after eliminating full and half-sibships. Primary performance characteristics of these populations are provided in Table 1.
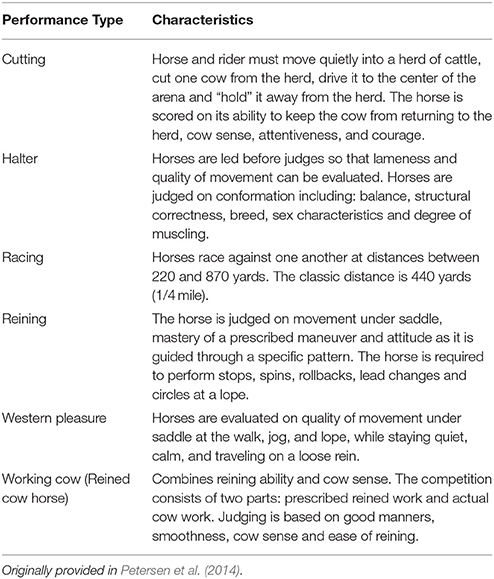
Table 1. Primary characteristics of the six QH performance groups evaluated in this study, as described by the American Quarter Horse Association.
DNA was isolated from hair root samples of 143 elite individuals (24 individuals each from the cutting, halter, racing, reining, and working cow subpopulations, and 23 from the western pleasure group). These samples were genotyped on the Illumina Equine SNP70 BeadChip (Petersen et al., 2014) that contains approximately 65,000 SNP markers. For the current study, a subset of 47 individuals (16 from the halter, 15 from the racing, 9 from the western pleasure, and 7 from the working cow subpopulations), were also genotyped using the custom MNEc2M SNP array, which contains approximately 2 million SNPs (Schaefer et al., 2017).
Genotype Imputation
The Beagle 4.0 software (Browning and Browning, 2007) was used to impute the original 65,000 SNP genotyping data to approximately 2 million SNPs for all 143 individuals included in this study, on a per chromosome basis using default settings. Genotypes were imputed using a reference panel consisting of 1,934,984 SNPs and 485 individuals from 24 different breeds encompassing wide genetic diversity (Petersen et al., 2013a; Schaefer et al., 2017). The average genotype concordance across all chromosomes, measured by dividing the number of accurate calls (best-guess genotypes that matched the true genotype for a particular individual in the reference panel) by the total number of genotype calls, was 99.5% (Schaefer et al., 2017).
SNP Pruning
Because sex chromosomes are subjected to different selective pressures, have different effective population sizes and undergo more drift than autosomes (Heyer and Segurel, 2010), only autosomal SNPs were used in this study. After imputation, SNPs with genotyping call rates lower than 95% and minor allele frequency (MAF) of less than 0.05 across all individuals were removed (PLINK, Purcell et al., 2007). After quality control, a total of 1,928,388 SNPs remained for further analysis.
Analysis Using the di Statistic
Locus-specific divergence in allele frequencies for each QH subpopulation was calculated within non-overlapping 10 kb windows across the 31 autosomes using the di statistic, as previously described (Akey et al., 2010; Petersen et al., 2013b). For each genomic window, di, or the locus-specific divergence of allele frequency for a given subpopulation compared to the genome-wide average of pair-wise FST values for that subpopulation relative to all other subpopulations (expected divergence), was computed (Schaefer, 2018). In other words, this statistic detects locus-specific deviation in allele frequencies for each subpopulation relative to the genome-wide average of pairwise FST values summed across all 6 subpopulations. This method was chosen for calculation because normalizing the standard FST statistic reduces the incidence of false positive tests that are driven by evolutionary relationships between populations rather than by selective pressures. Further, unlike single marker tests, the computing of FST across haplotype windows helps to control for stochastic variation and SNP ascertainment bias. The mean number of SNPs per 10kb window was 8.2 (± 3.2), and the total number of windows analyzed per subpopulation was 217,806. Significant di windows were considered as those corresponding to the top 0.1% of the empirical distribution (approximately 218 windows per subpopulation) and were considered putative signatures of selection. Two or more significant di windows located within 500 kb of each other were considered as a single ROI for analysis purposes.
Analysis Using hapFLK
The hapFLK is a haplotype-based approach applied to unphased genotypic data. The hapFLK 1.3.0 program version (https://forge-dga.jouy.inra.fr/projects/hapflk) was used to detect signatures of selection through haplotype differentiation among hierarchically structured populations, as described by Fariello et al. (2013). Briefly, FLK is an extension of the Lewontin and Krakauer (LK) test for the heterogeneity of the inbreeding coefficient, which uses phylogenetically estimated relationships between the subpopulations, overcoming limitations to the LK test due to highly correlated allele frequencies between subpopulations. HapFLK uses local haplotype data, the differences in haplotype allele frequencies between populations, and the hierarchical structure of subpopulations to identify genomic regions undergoing selection. The software was run on a per chromosome basis using a kinship matrix, constructed from population-based Reynolds distances, and the genotypes (*.PED and *.MAP files) for each population. For this study, no outgroups were defined, 10 clusters (-K 10) were used for the fastPHASE model, and the hapFLK statistic was computed for 20 EM runs to fit the LD model (–nfit = 20). Then, p-values were computed for each SNP-specific value using a Python script provided with the hapFLK program, and values were considered significant ROI if –log10 (p-value) > 4, as applied previously (Fariello et al., 2013).
Analysis Using hapQTL
Local haplotype sharing within each subpopulation was calculated with hapQTL (http://www.haplotype.org) using default settings (Xu and Guan, 2014). This approach relies on a statistical model for linkage disequilibrium (LD) to infer ancestral haplotypes and their frequencies at each SNP marker for each individual within a population. In hapQTL, each SNP is used as a core marker to calculate the extent of local haplotype sharing (LHS)—or the probability of two individuals descending from the same ancestral haplotypes—within each subpopulation. For each analysis 1 EM run was used with 50 steps (-w 50), 3 upper clusters (-C 3), 10 lower clusters (-c 10), and with a prior LD length of 0.5 centimorgan (-mg 200). Clusters of SNPs with –log10 (Bayes Factor) > 5 were considered significant ROI, and orphan signals were removed from the analysis due to the fact that these do not constitute haplotypes.
Candidate Gene Identification and Prioritization
Candidate genes within the ROI identified by di and hapFLK were retrieved with the Ensembl BioMart tool (www.ensembl.org), using the EquCab2 dataset for each subpopulation. To refine the list of candidate genes in ROI and further understand their association with phenotypes of interest for each subpopulation based on their biological features, functionalities, and biological pathways, a list of seed genes based on hypothesized tissue and metabolic pathways of interest was generated using the PolySearch2.0 algorithm (Liu et al., 2015). The resultant list of seed genes was retrieved from PolySearch2.0 for skeletal muscle development, metabolism, and nervous system development (Supplementary Table 1). This list was further curated manually by analyzing relevant literature using PubMed (https://www.ncbi.nlm.nih.gov/pubmed) for candidate genes associated with phenotypes or pathways of interest for each subpopulation. The number of seed genes chosen for each phenotype was based on work described by Liu et al. (2015). Candidate gene prioritization within the ROI was then performed using Endeavor-GW (https://endeavour.esat.kuleuven.be/Endeavour.aspx) (Tranchevent et al., 2016).
Pathway and Functional Analysis
Functional classification, statistical overrepresentation and pathway analyses of candidate genes for each subpopulation were conducted using PANTHER 11.1 (http://pantherdb.org/) (Mi et al., 2017), and FunRich3.0 (http://funrich.org/index.html) (Pathan et al., 2015), using default parameters. Specifically, fold enrichment analyses were included for: cellular component, molecular function, biological process, biological pathway, protein domain, site of expression, transcription factor, clinical phenotype associated with human homologs, their expression sites in humans, and results from the statistical overrepresentation analysis.
Results
Identifying Signatures of Selection Using the di Statistic
To identify population-specific loci under positive selection in the 6 QH subpopulations, we calculated the di value (Akey et al., 2010; Petersen et al., 2014) for approximately 218,000 non-overlapping 10 kb windows along the genome (Figure 1). Each subpopulation had several clearly defined ROI comprising contiguous windows with significant di values, in addition to numerous ROI comprising a single or just a few windows. The number of ROI identified per subpopulation varied from 39 in the western pleasure subpopulation to 77 in the racing subpopulation, for a total of 346 ROI, with sizes ranging from 10 kb to 1.8 Mb (Table 2). The number of annotated genes located within these ROI ranged from 78 in the working cow subpopulation to 171 in the racing group, with an average of 105 genes identified per subpopulation. Across all 6 QH performance groups a total of 635 genes were situated within these putative signatures of selection. A complete list of the significant di windows (top 0.1% of the empirical distribution) for each subpopulation is provided in Supplementary Table 2.
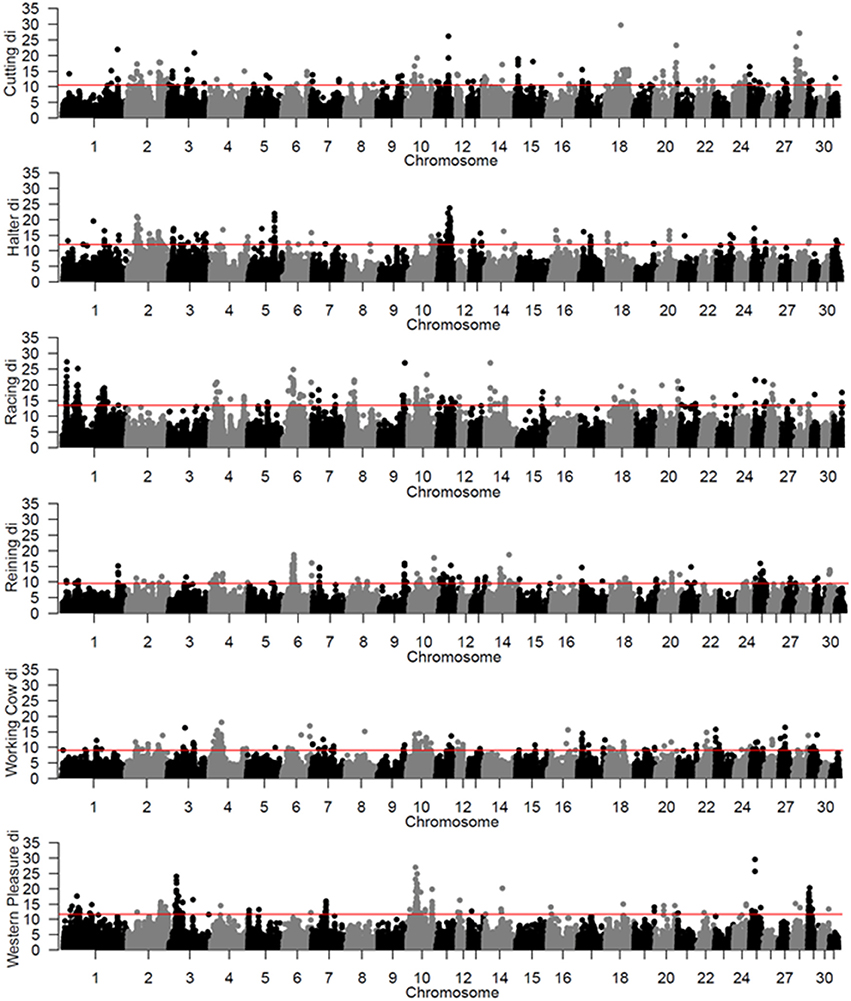
Figure 1. Genome-wide di values for the 6 QH subpopulations. Each di value is plotted on the y axis and each autosome is shown on the x axis in alternating colors. Each point represents a 10 kb window. The red horizontal line represents the top 0.1% of the empirical distribution of difor each QH subpopulation.
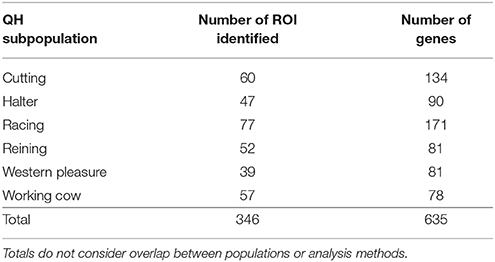
Table 2. ROI identified by di analysis in the 6 QH subpopulations.
A total of 56 di windows were found to be shared between 2 or more subpopulations; of those, 50 were shared by 2 performance groups, 5 by 3 performance groups and 1 was shared by 4 performance groups (Table 3). The subpopulations with the most shared signatures of selection identified by distatistics were racing and reining (14), and halter and reining (9). Interestingly, no significant di windows were shared between the racing and cutting subpopulations, nor between the racing and the western pleasure subpopulations. No diwindows were shared by all six subpopulations.
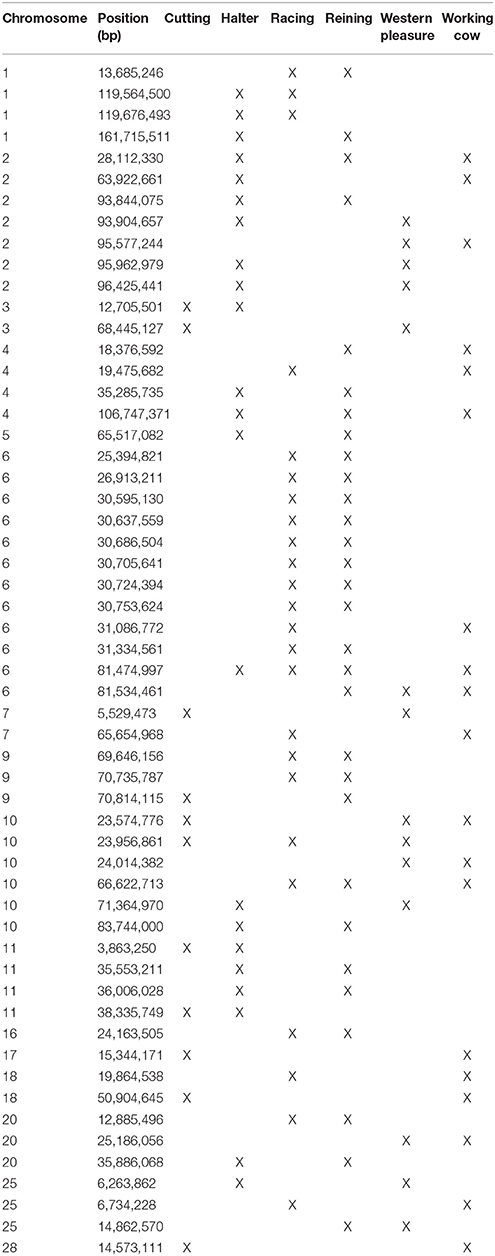
Table 3. ROI identified by di analysis that are shared by two or more QH subpopulations.
Identifying Signatures of Selection Using hapFLK
Per chromosome hapFLK values were computed for all 6 subpopulations combined (total of 143 individuals), p-values were calculated from the null distribution of empirical values, and the negative log of p-values was plotted against the genomic position for each chromosome (Figure 2). A total of 6 ROI containing at least one significant peak [–log10 [p-value] > 4] in the hapFLK scan were identified on 5 different autosomes (Table 4). These regions, located on ECA1, 7, 9, 15, and 21 (with two nearby regions), harbor a total of 7 genes putatively undergoing selection.
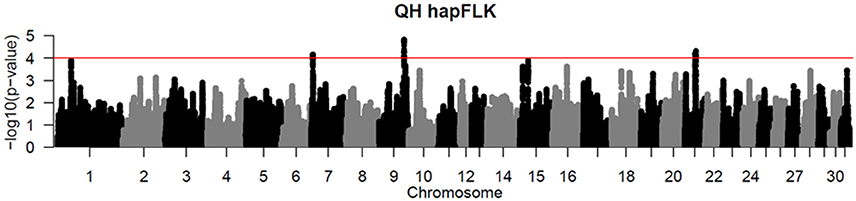
Figure 2. Haplotype-based hapFLK results for all 6 QH subpopulations. Chromosome number and statistical significance ([–log10] p-values) are plotted in the x and y axes, respectively. The genome-wide significance threshold corresponding to P < 0.0001 is shown as a horizontal red line.
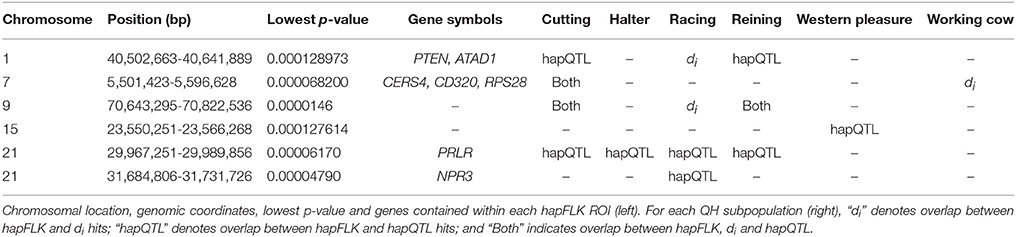
Table 4. ROI identified by hapFLK and their overlap with ROI identified by di and hapQTL.
Identifying Haplotype Structure Using hapQTL
Local haplotype sharing (LHS) within subpopulations was delineated by analyses using hapQTL (Xu and Guan, 2014). Clusters of contiguous significant SNP markers with –log (Bayes Factor) > 5 were considered as ROI as they most likely represent putative ancestral haplotypes shared by individuals from each subpopulation. Genome-wide hapQTL results for each QH subpopulation are shown in Figure 3, where shared ancestral haplotypes are shown as peaks containing contiguous significant SNPs. Each subpopulation displays numerous significant ROI, typically many on each chromosome, and spread across the entire genome. This approach was used to further validate the signatures of selection detected by the previously described methods, as such regions are most likely found in locally conserved haplotypes that are fixed or nearly fixed within each subpopulation. The number of significant SNPs varies widely across the 6 populations, from < 4,000 in the cutting and reining groups, to > 100,000 in the halter, racing, western pleasure, and working cow subpopulations. A complete list of all SNPs with significant hapQTL values for each subpopulation is provided in Supplementary Table 3.
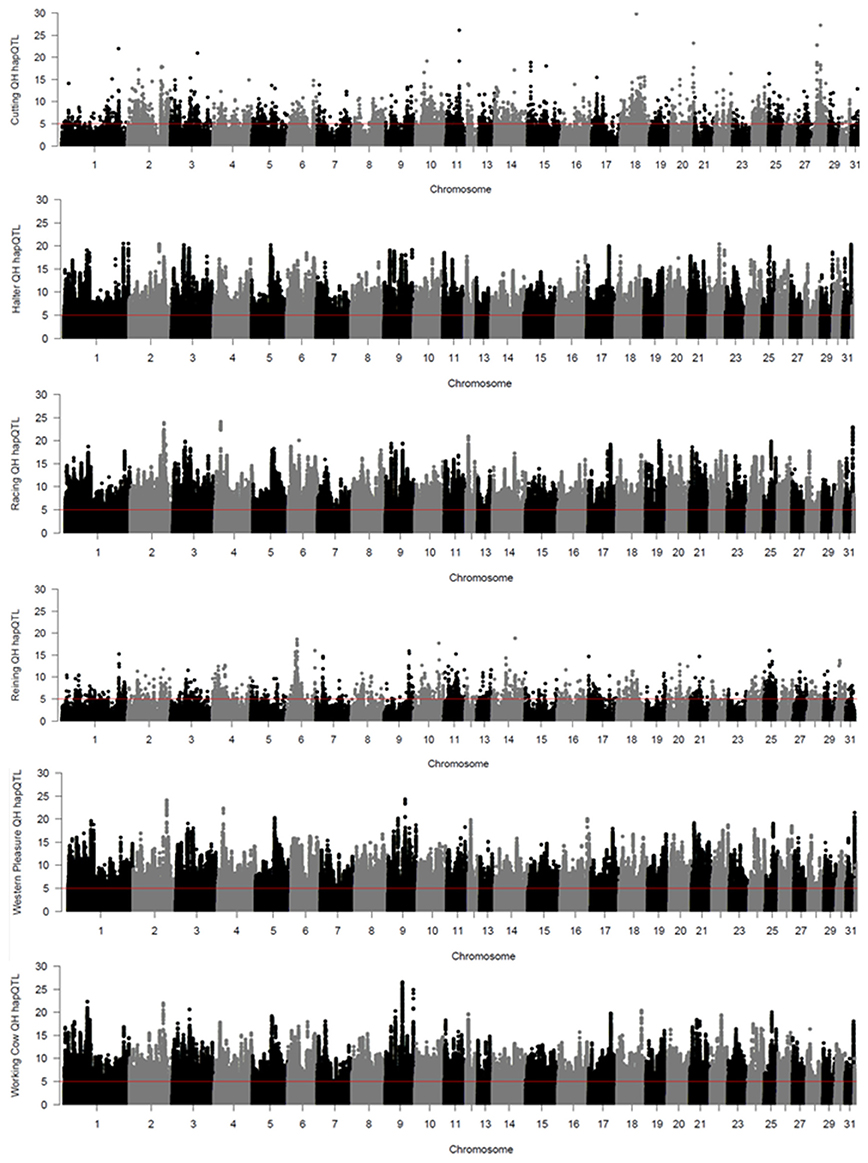
Figure 3. Genome-wide hapQTL values for the 6 QH subpopulations. Bayes factor values for each SNP are plotted on the y axis and each autosome is shown on the x axis in alternating colors.
Summation and Overlap Among Selection Signature Detection Methods
Genome-wide overlap in significant ROI identified by each of the three methods was assessed in each subpopulation (Figure 4; Supplementary Figures 1–6). Approximately 90% of significant di windows were contained within shared ancestral haplotypes identified by hapQTL, with little variation in the percent overlap between di and hapQTL ROI among the subpopulations. The observed overlap ranged from 178 shared hits (81% of significant di windows) in the reining subpopulation, to 206 common ROI (94% of significant di windows) in the racing subpopulation (Supplementary Figures 1–6). In addition, all 6 ROI identified by hapFLK were also found to be significant by the distatistic, hapQTL or both methods (Table 4).
Figure 4. Circos plot showing genome-wide significant di values (red layer), hapQTL values (orange layer), and hapFLK values (blue layer) across all 31 autosomes for the reining QH subpopulation.
Candidate Gene Prioritization
All annotated genes contained within ROI were retrieved using Ensembl BioMart (complete list provided in Supplementary Table 4). After retrieving annotated equine genes within ROI, PolySearch 2.0 (http://polysearch.ca) was used to generate a list of seed genes associated with traits of interest for improved performance (metabolism, skeletal muscle development, central nervous system). A manual curation of each list was performed using literature obtained from PubMed (https://www.ncbi.nlm.nih.gov/pubmed/) for their association with the aforementioned phenotypes. The resultant list of 33 seed genes: 11 using “skeletal muscle” as seed, 11 using “central nervous system” as seed, and 11 using “metabolism” as seed, is shown in Supplementary Table 1. These seed lists were used to prioritize candidate genes retrieved for each subpopulation based on phenotypes of interest using Endeavor-GW. Thus, in addition to the original seed genes, the output resulted in a total of 78–171 ranked genes for each subpopulation based on the phenotypes of interest: 635 across all subpopulations (602 unique, and 33 shared between 2 or more subpopulations) for use in pathway analysis (Supplementary Tables 5–7). Supplementary Table 8 lists the top 3 candidate genes per subpopulation, chosen according to possible associations with the desired performance characteristics based on their biological pathways and/or functions. Table 5 lists the 33 genes putatively undergoing selection in 2 or more subpopulations.
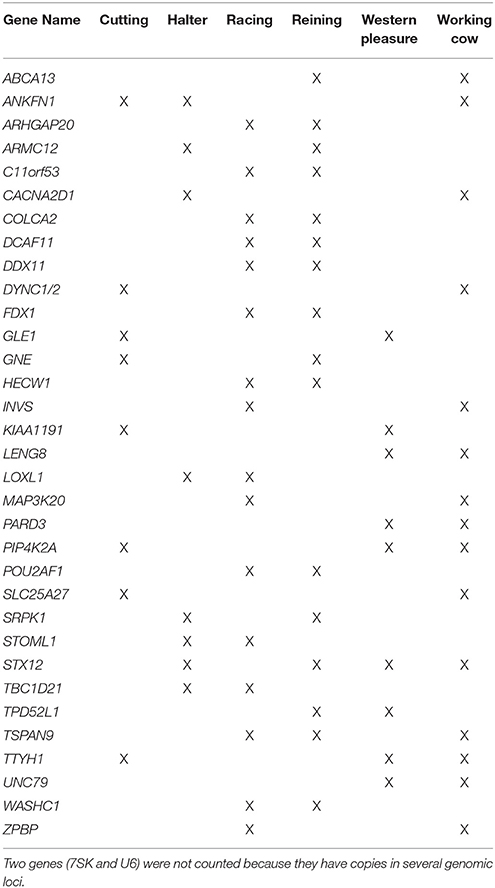
Table 5. Genes undergoing selection in 2 or more subpopulations.
Pathway and Functional Analysis
The biological functions and pathways in which genes from ROI are involved were assessed using PANTHER 11.1 (Mi et al., 2017) and FunRich3.0 (http://funrich.org/index.html) (Pathan et al., 2015). Supplementary Tables 9–14 provide PANTHER 11.1 and FunRich3.0 analysis reports for each QH subpopulation. These analyses provided information on the common features and shared functions of the genes putatively undergoing genomic selection in different QH performance groups, according to the expected performance profile of elite individuals in each category.
Discussion
Our approach to detecting genome-wide signatures of selection in the QH subpopulations combines different methods to increase efficiency, reliability, and scope. This study revealed that there are hundreds of loci likely undergoing selection, of which many are almost certainly contributing to desired specialized phenotypes, in each subpopulation. Overlap between statistical methods to detect selection (namely di and hapFLK) assisted in pinpointing ROI that most likely constituted true signatures of selection within each subpopulation. Furthermore, the use of hapQTL to confirm that the vast majority of genomic regions undergoing selection constituted shared haplotypes within each subpopulation increased the robustness of our analysis. Although hapQTL was not designed specifically to identify genomic signatures of selection per se, it has been used to infer ancestral haplotype associations among individuals with similar phenotype (Xu and Guan, 2014). Therefore, combined with ROI identified by di and hapFLK, this approach allowed for a more confident interpretation of the association between candidate genes found within such ROI and the unique phenotypic features of each QH subpopulation. This work also reveals the many types of biological mechanisms that can contribute to the complex muscle, nervous system and metabolic phenotypes, as well as the difficulties likely inherent in attempting to identify the functional alleles associated with them.
Among the 27 signatures of selection identified by Meira et al. (2014) for the racing QH via REHH and FST, a total of 14 overlap with the ROI identified by the present study: 6 of those were identified by di statistics, and 8 were highlighted by hapQTL. Of those, 4 were identified by both di statistics and hapQTL analysis. In addition, when comparing the 36 signatures of selection identified by Beltrán et al. (2015) in the cutting QH to those detected for this subpopulation in the present study, a total of 11 overlap: 2 identified by both diand hapQTL, and 9 identified exclusively by hapQTL. A summary of these comparisons is shown in Supplementary Table 15. Overlap across studies for these ROI in these two subpopulations is encouraging, making them a top priority in attempting to identify the putative functional alleles associated with performance phenotypes. Nevertheless, our study also benefitted from a higher SNP density, utilizing different methods of detection, and the specific inclusion of only elite performers from 6 different QH subpopulations. This enabled us to define more, and likely highly important, signatures of selection. Moreover, our functional, network, and pathway analyses in the different populations show different populations of genes undergoing selection with different functions and interactions in each QH subpopulation. Several examples from each subpopulation are discussed below.
The Cutting Subpopulation
Pathway analysis shows an approximate 30-fold enrichment in genes associated with formation of the pyruvate dehydrogenase (PDH) mitochondrial complex and with pyruvate metabolism (DLAT, PDHX; p-value = 0.001) in this subpopulation (Supplementary Table 9). Besides being involved in glucose metabolism, human studies suggest that variants in these genes are associated with neuromuscular disorders and neuronal function (Barnerias et al., 2010). Candidate gene prioritization for skeletal muscle development (Supplementary Table 5) and metabolism (Supplementary Table 7) confirms these findings by assigning high ranks for the aforementioned genes.
The Halter Subpopulation
In the halter subpopulation, pathways associated with lipid metabolism and function, such as digestion of dietary lipid (59-fold enrichment; p-value = 0.016) and platelet sensitization by LDL (58-fold enrichment; p-value = 0.0004) were identified. It can be hypothesized that the selective breeding for lean and muscular phenotypes in this subpopulation may have led to the selection of genes involved in such metabolic pathways. On the other hand, we found no evidence for a signature of selection near the SCN4A gene locus on chromosome 11 (ECA11:15 Mb) in the halter horse subpopulation. It has been widely assumed that a combination of extensive breeding to a halter horse stallion carrying a SCN4A mutation responsible for the neuromuscular disorder hyperkalemic periodic paralysis (HYPP) (Rudolph et al., 1992), as well as resultant epistatic effects of this mutation on muscle contractility, was responsible for the perceived increase in muscling desired in this population. Our data suggests that SCN4A locus itself is not driving selection for the muscling in this halter horse line. On the other hand there is an ROI located 20 Mb upstream from SCN4A (ECA11:34–36 Mb) identified both by diand hapQTL analyses, containing a total of 13 genes (Supplementary Table 4), that are potentially worth investigating for the presence of variants associated with skeletal muscle development in halter horses, such as MYO19 (ECA11:35.7 Mb), associated with mitochondrial transport during mitosis.
The Racing Subpopulation
Our di analysis identified four ROI on ECA1 (ECA1:12,256,704-14,342,963; ECA1:40,505,469-41,555,488; ECA1:45,034,220-46,901,028; ECA1:115,914,274-122,185,069) that are found exclusively in the racing QH subpopulation, were found to constitute ancestral shared haplotypes by hapQTL, and were not identified by Meira et al. (2014). Together, these “racing” ROI contain 99 genes, or approximately 58% of all genes undergoing selection in this subpopulation (see Supplementary Table 11). After prioritization, top candidate genes located in these and other loci showing association with the racing phenotype were also identified. One of the top candidate genes for racing ability is BAG3 (BCL2-associated athanogene 3, ECA1:12.8 Mb); variants and/or deletions in this gene have been associated with myopathies, neuropathies and cardiomyopathies in various human subpopulations (Franaszczyk et al., 2014; Kostera-Pruszczyk et al., 2015), suggesting a potential involvement of this gene in skeletal muscle and heart function, essential phenotypes for individuals with increased racing ability. Another example is PRKCA (Protein kinase C alpha, ECA11:13.4 Mb), a member of the of serine- and threonine-specific protein kinase family. Knockout studies in mice suggest that this kinase may be a fundamental regulator of cardiac contractility and calcium handling in myocytes (Braz et al., 2004). Future studies of putative selection in Thoroughbreds and Standardbreds, breeds that have historically been selected for racing performance, will help validate and possibly expand this list of putative candidate genes for racing ability on ECA1 and elsewhere across the genome. Finally, pathway analysis showed a ten-fold enrichment in genes associated with netrin-1 signaling (p-value = 0.00054). These genes play an important role in axon guidance, on the structural integrity, and on the regulation of the transmission of the nervous stimulus through neuronal axons (Supplementary Table 7; Koticha et al., 2006). Regulation of such physiological functions is essential for improved athletic performance in racehorses.
The Reining Subpopulation
Elite reining performers must possess skills that allow them to move effortlessly around the arena, quickly reacting to subtle hand and foot cues from the rider in order to execute movements such as loping, galloping, circling, spinning, and stopping. Therefore, reining horses must possess improved athleticism and intellectual abilities in order to excel in the sport. Analysis of genomic regions undergoing selection within this subpopulation reveals genes associated with such traits. Examples include RDX (ECA7:18.9 Mb), which plays a role in the binding of the barbed end of actin filaments to the plasma membrane and has been associated with skeletal muscle as well as behavior/neurological phenotypes in humans; KIF1A (ECA6:26.1 Mb), involved in axonal transport of synaptic vesicle precursors, and BACE1 (ECA7:25.2 Mb), both associated with different neurological phenotypes in humans. It is worth noting that highly significant signals were detected using all 3 statistical approaches on a ~300 kb region of the genome in the reining QH subpopulation (ECA9:70.6 Mb−70.9 Mb; see Table 3, Supplementary Tables 2–3). Interestingly, this region does not contain any annotated genes in EquCab2, which might indicate that another genomic feature such as a regulatory sequence, non-coding RNA, or transposable element for example, might be driving selection in this region but cannot yet be identified due to the current state of the equine genome annotation.
The Western Pleasure Subpopulation
In the western pleasure subpopulation, candidate genes located on ECA7 are also of interest when considering selection for the phenotype exhibited by individuals from this group. Western pleasure is a performance style in which horses need to show a relaxed and collected disposition during competition. In this event, animals are asked by their riders to walk, trot and lope in both directions of the arena, as well as to gently come to a stop and to stand still at command. In order to excel in western pleasure, individuals need to have a calm and quiet temperament and smooth, controlled movements. Moreover, elite athletes are expected to possess cognitive and decision-making skills that are not exclusively dependent on the rider in order to excel in competitions. Genomic selection analyses show a collection of 24 genes located within ROI on ECA7 (see Supplementary Table 13). Interestingly, half (12) of these ECA7 genes are associated with cognition, behavior and nervous system phenotypes, including AARS, GRIK4, NTM, PGLS, and SORL1.
The Working Cow Subpopulation
Working cow horses, also known as reined cow horses, perform in events in which they are asked by the rider to work a single cow in an arena, performing specific maneuvers that include circling the cow, directing it in specific patterns, and performing a reining routine. This sport is similar to cutting because horses are also required to work alongside a cow, and for that they must possess “cow sense.” Genes associated with these phenotypes were identified within genomic signatures of selection in the working cow subpopulation, such as DRD2 (ECA7:21.8 Mb) and GRID2 (ECA3:44.7 Mb), associated with cognitive and behavioral traits in humans. The APP gene (ECA26:23.5 Mb), one of the top candidate genes for central nervous system and skeletal muscle development in this subpopulation, is involved in neural growth and maturation during brain development, and has been associated with the pathology of Alzheimer's disease in humans (Coronel et al., 2018).
Across all the subpopulations, approximately 90% of significant di windows were also observed by hapQTL as ancestral haplotypes; further, all 6 ROI identified by hapFLK were also significant either by distatistics or hapQTL analysis. These results corroborate the efficacy of the methods utilized in this study, and show that the use of a combination of different methods to detect genomic selection, coupled with hapQTL, increases the chances of confidently identifying a larger spectrum of regions undergoing selection. It is also interesting to note that the hapFLK analysis identified far fewer selection signatures in the present study than di. hapFLK is expected to be more stringent than di, which typically suffers from selection bias and false positives; this is because hapFLK accounts for haplotype structure of each subpopulation for the significance calculation (Fariello et al., 2013). Moreover, these statistical tests can capture different selection signals: hapFLK is not as powerful for detection of more ancient signatures of selection, whereas di may fail to detect signatures of selection when SNPs within a window are not in high LD with the causative variant (Kijas et al., 2012; Fariello et al., 2013). Therefore, only the top 0.1% of di windows was considered for this analysis, which is consistent with studies in other species using similar approaches (Kijas et al., 2012; McRae et al., 2014; Zhao et al., 2015; Purfield et al., 2017).
Limitations to our study include the fact that several of the significant ROI identified did not contain protein-coding genes annotated in the current equine genome assembly (EquCab2). We hypothesize that this is due to limitations in the current equine genome annotation for regulatory regions, non-coding RNAs and sequence motifs, which might be driving selection in some of the identified ROI but are not identified as such in EquCab2. However, there are 20,449 protein coding genes annotated in EquCab2, so pathway analysis still constitutes a useful tool to predict putative functionality of candidate genes within ROI. Another potential limitation to the approach used in this study is that population differentiation at the genome level is not always a product of selective sweeps; it can also arise due to inversions and random genetic drift, for example. This can be tested with functional studies, which are not part of the scope of this work. Other limitations include arbitrary significance thresholds utilized in different detection methods for genomic selection (which might hinder the ability to detect ROI just below said threshold), and the possibility of false positives stemming from each statistical method used. Also, the close genetic relatedness among the performance groups used in this study hinder the ability to detect signatures of selection due to the occurrence of a high number of shared ancestral haplotypes among subpopulations. These subpopulations are comprised of individuals belonging to the same breed, that have been selectively bred for only approximately 60 years; thus, a high level of genetic similarity between different subpopulations is to be expected. Finally, pathways analyzed for gene prioritization were limited to skeletal muscle development, CNS and metabolism, while selection may also be occurring for other less obvious phenotypes of interest for each subpopulation.
As shown by previous work (Petersen et al., 2013b), signatures of selection are evident in all major breeds of horse, and understanding the alleles and functional bases for their phenotypic effects will greatly expand our understanding of equine biology. The aforementioned work (Petersen et al., 2013b) utilized 744 individuals from 33 breeds, and a low-density 54K SNP genotyping array, to identify breed-specific signatures of selection using di statistics calculated in 500-kb windows. di windows falling into the 99th percentile of the empirical distribution (a total of 33 for each breed) were considered significant. Among the top 33 di windows identified for the Quarter Horse, 4 are shared with the top 218 dihits in this study: ECA2:95.7 Mb (shared by the cutting, western pleasure and working cow subpopulations), ECA3:26.5 Mb (found in the western pleasure subpopulation), ECA4:19.4 Mb (shared by the racing and working cow subpopulations), and ECA18:65.2 Mb (found in the cutting group). While none of the significant signatures of selection identified by hapFLK in this study were found in the work performed by Petersen et al. (2013b), a total of 18 of the 33 top dihits found in that study were also significant by hapQTL analysis in the present work, constituting shared ancestral haplotypes between individuals of one or more QH subpopulations. Among those, one of particular interest is the ROI located on ECA18:66.3 Mb which contains the myostatin (MSTN) gene, where a SINE insertion allele in the promoter region is associated with an increased gluteal muscle type 2A fiber proportion and contributes to the outstanding sprinting ability of this breed (Petersen et al., 2013b). A common 780.7 kb haplotype encompassing MSTN was shared by 91.3% of Quarter Horses used in the study (Petersen et al., 2013b), in agreement with the hapQTL results presented herein, where this genomic region constitutes an ancestral haplotype shared by all 6 QH subpopulations (Supplementary Table 3). The use of 2 million SNP markers and the comparison of subpopulations within the QH breed, as opposed to comparing the breed as a whole to other horse breeds, likely contribute to differences between the results of this study and that of Petersen et al. (2013b).
Our work represents a more thorough study of selection in horse breeding by leveraging high-density SNP data within a single breed to demonstrate that there are many regions of selection ongoing within each of the performance categories of the American Quarter Horse. Moreover, the use of a combination of different statistical and haplotype analysis methods in this study has allowed for a broader range of detection of selection signatures. Although at present we cannot assess issues of false positives, and gene missingness due to incorrect/incomplete genome annotation, we consider this an excellent start. We expect that future high-density analyses will be forthcoming across racing breeds and again across a wide diversity of other breeds, and that from this collection key haplotypes and functional alleles underlying selection will be discovered and used to further select and hopefully improve the populations.
Author Contributions
FA: performed the signatures of selection, candidate gene, and pathway analyses; RS: managed the data pipeline and performed the imputation; MM, FA, and JM: designed the study; FA, JM, and MM: wrote the manuscript; RS: edited the manuscript. All authors have read and approved the final version.
Conflict of Interest Statement
The authors declare that the research was conducted in the absence of any commercial or financial relationships that could be construed as a potential conflict of interest.
Acknowledgments
This work was supported by: The American Quarter Horse Association, USDA 2012-67015-19432, and USDA 2008-35205-18766, Morris Animal Foundation D07EQ-500, and Minnesota Agricultural Experiment Station AES0063049. Partial support to MM was also provided by NIH NIAMS 1K01AR055713-01A2. The funders had no role in study design, data collection and analysis, decision to publish, or preparation of the manuscript.
Supplementary Material
The Supplementary Material for this article can be found online at: https://www.frontiersin.org/articles/10.3389/fgene.2018.00249/full#supplementary-material
Supplementary Figures 1–6. Circos plots showing genome-wide di values (red layer), hapQTL values (orange layer), and hapFLK values (blue layer) across all 31 autosomes for all 6 QH subpopulations.
Supplementary Table 1. List of seed genes obtained using the PolySearch 2.0 algorithm based on skeletal muscle development, central nervous system development and metabolism.
Supplementary Table 2. Significant di windows in all 6 QH subpopulations.
Supplementary Table 3. Significant hapQTL windows in all 6 QH subpopulations.
Supplementary Table 4. Unprioritized list of genes retrieved for all 6 QH subpopulations.
Supplementary Table 5. Genes identified by Endeavor using the skeletal muscle seed gene list in all 6 QH subpopulations ranked by p-value. Each column on the table corresponds to a human-based data source used by Endeavor-GW to rank the provided list of genes based on the seed genes. These are: gene and protein function, chemical information, biomolecular pathways, phenotypic information, interaction networks, expression profiles, expression ontologies, and sequence-based features.
Supplementary Table 6. Genes identified by Endeavor using the central nervous system seed gene list in all 6 QH subpopulations ranked by p-value. Each column on the table corresponds to a human-based data source used by Endeavor-GW to rank the provided list of genes based on the seed genes. These are: gene and protein function, chemical information, biomolecular pathways, phenotypic information, interaction networks, expression profiles, expression ontologies, and sequence-based features.
Supplementary Table 7. Genes identified by Endeavor using the metabolism seed gene list in all 6 QH subpopulations ranked by p-value. Each column on the table corresponds to a human-based data source used by Endeavor-GW to rank the provided list of genes based on the seed genes. These are: gene and protein function, chemical information, biomolecular pathways, phenotypic information, interaction networks, expression profiles, expression ontologies, and sequence-based features.
Supplementary Table 8. Examples of candidate genes for phenotypic traits of interest with their respective functions for each QH subpopulation.
Supplementary Table 9. FunRich3.0 functional enrichment and pathway analysis results for the cutting QH subpopulation.
Supplementary Table 10. FunRich3.0 functional enrichment and pathway analysis results for the halter QH subpopulation.
Supplementary Table 11. FunRich3.0 functional enrichment and pathway analysis results for the racing QH subpopulation.
Supplementary Table 12. FunRich3.0 functional enrichment and pathway analysis results for the reining QH subpopulation.
Supplementary Table 13. FunRich3.0 functional enrichment and pathway analysis results for the western pleasure QH subpopulation.
Supplementary Table 14. ROI identified by both the current and previous studies.
Supplementary Table 15. FunRich3.0 functional enrichment and pathway analysis results for the working cow QH subpopulation.
Footnotes
1. ^ Available online at https://www.aqha.com/media/17914/2016-annual-report.pdf. (Accessed 21 January 2018).
2. ^ Available online at https://www.aqha.com/media/17917/2015-annual-report.pdf. (Accessed 21 January 2018).
3. ^ animalgenome.org. https://www.animalgenome.org/repository/horse/.
References
Akey, J. M., Ruhe, A. L., Akey, D. T., Wong, A. K., Connelly, C. F., Madeoy, J., et al. (2010). Tracking footprints of artificial selection in the dog genome. Proc. Natl. Acad. Sci. U.S.A. 107, 1160–1165. doi: 10.1073/pnas.0909918107
Axelsson, E., Ratnakumar, A., Arendt, M. L., Maqbool, K., Webster, M. T., Perloski, M., et al. (2013). The genomic signature of dog domestication reveals adaptation to a starch-rich diet. Nature 495, 360–364. doi: 10.1038/nature11837
Barnerias, C., Saudubray, J. M., Touati, G., De Lonlay, P., Dulac, O., Ponsot, G., et al. (2010). Pyruvate dehydrogenase complex deficiency: four neurological phenotypes with differing pathogenesis. Dev. Med. Child Neurol. 52, 1–9. doi: 10.1111/j.1469-8749.2009.03541.x
Beltrán, N. A. R., Meira, C. T., de Oliveira, H. N., Pereira, G. L., Silva, J. A. V., da Mota, M. D. S., et al. (2015). Prospection of genomic regions divergently selected in cutting line of Quarter Horses in relation to racing line. Livest. Sci. 174, 1–9. doi: 10.1016/j.livsci.2015.01.011
Bertolini, F., Gandolfi, B., Kim, E. S., Haase, B., Lyons, L. A., and Rothschild, M. F. (2016). Evidence of selection signatures that shape the Persian cat breed. Mamm. Genome 27, 144–155. doi: 10.1007/s00335-016-9623-1
Boitard, S., Boussaha, M., Capitan, A., Rocha, D., and Servin, B. (2016). Uncovering adaptation from sequence data: lessons from genome resequencing of four cattle breeds. Genetics 203, 433–450. doi: 10.1534/genetics.115.181594
Boyko, A. R., Quignon, P., Li, L., Schoenebeck, J. J., Degenhardt, J. D., Lohmueller, K. E., et al. (2010). A simple genetic architecture underlies morphological variation in dogs. PLoS Biol. 8:e1000451. doi: 10.1371/journal.pbio.1000451
Braz, J. C., Gregory, K., Pathak, A., Zhao, W., Sahin, B., Klevitsky, R., et al. (2004). PKC-alpha regulates cardiac contractility and propensity toward heart failure. Nat. Med. 10, 248–254. doi: 10.1038/nm1000
Browning, S. R., and Browning, B. L. (2007). Rapid and accurate haplotype phasing and missing-data inference for whole-genome association studies by use of localized haplotype clustering. Am. J. Hum. Genet. 81, 1084–1097. doi: 10.1086/521987
Cagan, A., and Blass, T. (2016). Identification of genomic variants putatively targeted by selection during dog domestication. BMC Evol. Biol. 16:10. doi: 10.1186/s12862-015-0579-7
Coronel, R., Bernabeu-Zornoza, A., Palmer, C., Muñiz-Moreno, M., Zambrano, A., Cano, E., et al. (2018). Role of amyloid precursor protein (APP) and Its derivatives in the biology and cell fate specification of neural stem cells. Mol. Neurobiol. doi: 10.1007/s12035-018-0914-2. [Epub ahead of print].
Druet, T., Ahariz, N., Cambisano, N., Tamma, N., Michaux, C., Coppieters, W., et al. (2014). Selection in action: dissecting the molecular underpinnings of the increasing muscle mass of Belgian Blue Cattle. BMC Genomics 15:796. doi: 10.1186/1471-2164-15-796
Fariello, M. I., Boitard, S., Naya, H., SanCristobal, M., and Servin, B. (2013). Detecting signatures of selection through haplotype differentiation among hierarchically structured populations. Genetics 193, 929–941. doi: 10.1534/genetics.112.147231
Fariello, M. I., Servin, B., Tosser-Klopp, G., Rupp, R., Moreno, C., et al. (2014). Selection signatures in worldwide sheep populations. PLoS ONE 9:e103813. doi: 10.1371/journal.pone.0103813
Franaszczyk, M., Bilinska, Z. T., Sobieszczanska-Małek, M., Michalak, E., Sleszycka, J., Sioma, A., et al. (2014). The BAG3 gene variants in Polish patients with dilated cardiomyopathy: four novel mutations and a genotype-phenotype correlation. J. Transl. Med. 12:192. doi: 10.1186/1479-5876-12-192
Frischknecht, M., Flury, C., Leeb, T., Rieder, S., and Neuditschko, M. (2016). Selection signatures in Shetland ponies. Anim. Genet. 47, 370–372. doi: 10.1111/age.12416
Frischknecht, M., Jagannathan, V., Plattet, P., Neuditschko, M., Signer-Hasler, H., Bachmann, I., et al. (2015). A non-synonymous HMGA2 variant decreases height in shetland ponies and other small horses. PLoS ONE 10:e0140749. doi: 10.1371/journal.pone.0140749
Gutiérrez-Gil, B., Arranz, J. J., and Wiener, P. (2015). An interpretive review of selective sweep studies in Bos taurus cattle populations: identification of unique and shared selection signals across breeds. Front. Genet. 6:167. doi: 10.3389/fgene.2015.00167
Heyer, E., and Segurel, L. (2010). Looking for signatures of sex-specific demography and local adaptation on the X chromosome. Genome Biol. 11:203. doi: 10.1186/gb-2010-11-1-203
Kader, A., Li, Y., Dong, K., Irwin, D. M., Zhao, Q., He, X., et al. (2015). Population variation reveals independent selection toward small body size in Chinese Debao Pony. Genome Biol. Evol. 8, 42–50. doi: 10.1093/gbe/evv245
Kijas, J. W. (2014). Haplotype-based analysis of selective sweeps in sheep. Genome 57, 433–437. doi: 10.1139/gen-2014-0049
Kijas, J. W., Lenstra, J. A., Hayes, B., Boitard, S., Porto Neto, L. R., San Cristobal, M., et al. (2012). International Sheep Genomics Consortium Members. Genome-wide analysis of the world's sheep breeds reveals high levels of historic mixture and strong recent selection. PLoS Biol. 10:e1001258. doi: 10.1371/journal.pbio.1001258
Kostera-Pruszczyk, A., Suszek, M., Płoski, R., Franaszczyk, M., Potulska-Chromik, A., Pruszczyk, P., et al. (2015). BAG3-related myopathy, polyneuropathy and cardiomyopathy with long QT syndrome. J. Muscle Res. Cell Motil. 36, 423–432. doi: 10.1007/s10974-015-9431-3
Koticha, D., Maurel, P., Zanazzi, G., Kane-Goldsmith, N., Basak, S., Babiarz, J., et al. (2006). Neurofascin interactions play a critical role in clustering sodium channels, ankyrin G and beta IV spectrin at peripheral nodes of Ranvier. Dev. Biol. 293, 1–12. doi: 10.1016/j.ydbio.2005.05.028
Li, X., Yang, S., Tang, Z., Li, K., Rothschild, M. F., Liu, B., et al. (2014). Genome-wide scans to detect positive selection in Large White and Tongcheng pigs. Anim. Genet. 45, 329–339. doi: 10.1111/age.12128
Liu, Y., Liang, Y., and Wishart, D. (2015). PolySearch2: a significantly improved text-mining system for discovering associations between human diseases, genes, drugs, metabolites, toxins and more. Nucleic Acids Res. 43, W535–W542. doi: 10.1093/nar/gkv383
Ma, Y., Wei, J., Zhang, Q., Chen, L., Wang, J., Liu, J., et al. (2015). A genome scan for selection signatures in pigs. PLoS ONE 10:e0116850. doi: 10.1371/journal.pone.0116850
McCoy, A. M., Schaefer, R., Petersen, J. L., Morrell, P. L., Slamka, M. A., Mickelson, J. R., et al. (2014).Evidence of positive selection for the GYS1 mutation in domestic horse populations. J. Hered. 105, 163–172. doi: 10.1093/jhered/est075
McCue, M. E., Bannasch, D. L., Petersen, J. L., Gurr, J., Bailey, E., Binns, M. M., et al. (2012). A high density SNP array for the domestic horse and extant Perissodactyla: utility for association mapping, genetic diversity, and phylogeny studies. PLoS Genet. 8:e1002451. doi: 10.1371/journal.pgen.1002451
McRae, K. M., McEwan, J. C., Dodds, K. G., and Gemmell, N. J. (2014). Signatures of selection in sheep bred for resistance or susceptibility to gastrointestinal nematodes. BMC Genomics 15:637. doi: 10.1186/1471-2164-15-637
Meira, C. T., Curi, R. A., Farah, M. M., de Oliveira, H. N., Béltran, N. A., Silva, J. A. 2nd, et al. (2014). Prospection of genomic regions divergently selected in racing line of Quarter Horses in relation to cutting line. Animal 8, 1754–1764. doi: 10.1017/S1751731114001761
Mi, H., Huang, X., Muruganujan, A., Tang, H., Mills, C., Kang, D., et al. (2017). PANTHER version 11: expanded annotation data from gene ontology and reactome pathways, and data analysis tool enhancements. Nucleic Acids Res. 45, D183–D189. doi: 10.1093/nar/gkw1138
Montague, M. J., Li, G., Gandolfi, B., Khan, R., Aken, B. L., Searle, S. M., et al. (2014). Comparative analysis of the domestic cat genome reveals genetic signatures underlying feline biology and domestication. Proc. Natl. Acad. Sci. U.S.A. 111, 17230–17235. doi: 10.1073/pnas.1410083111
Moon, S., Lee, J. W., Shin, D., Shin, K. Y., Kim, J., Choi, I. Y., et al. (2015). A genome-wide scan for selective sweeps in racing horses. Asian-Australas. J. Anim. Sci. 28, 1525–1531. doi: 10.5713/ajas.14.0696
Moradi, M. H., Nejati-Javaremi, A., Moradi-Shahrbabak, M., Dodds, K. G., and McEwan, J. C. (2012). Genomic scan of selective sweeps in thin and fat tail sheep breeds for identifying of candidate regions associated with fat deposition. BMC Genet. 13:10. doi: 10.1186/1471-2156-13-10
Pathan, M., Keerthikumar, S., Ang, C. S., Gangoda, L., Quek, C. Y., Williamson, N. A., et al. (2015). FunRich: an open access standalone functional enrichment and interaction network analysis tool. Proteomics 15, 2597–2601. doi: 10.1002/pmic.201400515
Petersen, J. L., Mickelson, J. R., Cleary, K. D., and McCue, M. E. (2014). The American quarter horse: population structure and relationship to the thoroughbred. J. Hered. 105, 148–162. doi: 10.1093/jhered/est079
Petersen, J. L., Mickelson, J. R., Cothran, E. G., Andersson, L. S., Axelsson, J., Bailey, E., et al. (2013a). Genetic diversity in the modern horse illustrated from genome-wide SNP data. PLoS ONE 8:e54997. doi: 10.1371/journal.pone.0054997
Petersen, J. L., Mickelson, J. R., Rendahl, A. K., Valberg, S. J., Andersson, L. S., Axelsson, J., et al. (2013b). McCue ME. Genome-wide analysis reveals selection for important traits in domestic horse breeds. PLoS Genet. 9:e1003211. doi: 10.1371/journal.pgen.1003211
Purcell, S., Neale, B., Todd-Brown, K., Thomas, L., Ferreira, M. A., Bender, D., et al. (2007). PLINK: a tool set for whole-genome association and population-based linkage analyses. Am. J. Hum. Genet. 81, 559–575. doi: 10.1086/519795
Purfield, D. C., McParland, S., Wall, E., and Berry, D. P. (2017). The distribution of runs of homozygosity and selection signatures in six commercial meat sheep breeds. PLoS ONE 12:e0176780. doi: 10.1371/journal.pone.0176780
Randhawa, I. A., Khatkar, M. S., Thomson, P. C., and Raadsma, H. W. (2014). Composite selection signals can localize the trait specific genomic regions in multi-breed populations of cattle and sheep. BMC Genet. 15:34. doi: 10.1186/1471-2156-15-34
Randhawa, I. A., Khatkar, M. S., Thomson, P. C., and Raadsma, H. W. (2015). Composite selection signals for complex traits exemplified through bovine stature using multibreed cohorts of European and African Bos taurus. G3 5, 1391–1401. doi: 10.1534/g3.115.017772
Randhawa, I. A., Khatkar, M. S., Thomson, P. C., and Raadsma, H. W. (2016). A meta-assembly of selection signatures in cattle. PLoS ONE 11:e0153013. doi: 10.1371/journal.pone.0153013
Rudolph, J. A., Spier, S. J., Byrns, G., Rojas, C. V., Bernoco, D., and Hoffman, E. P. (1992). Periodic paralysis in quarter horses: a sodium channel mutation disseminated by selective breeding. Nat. Genet. 2, 144–147. doi: 10.1038/ng1092-144
Schaefer, R. J. (2018). schae234/PonyTools: v0.2.0 (Version v0.2.0). Zenodo. Available online at: http://doi.org/10.5281/zenodo.1201460
Schaefer, R. J., Schubert, M., Bailey, E., Bannasch, D. L., Barrey, E., Bar-Gal, G. K., et al. (2017). Developing a 670k genotyping array to tag ~2M SNPs across 24 horse breeds. BMC Genomics 18:565. doi: 10.1186/s12864-017-3943-8
Smith, J. M., and Haigh, J. (1974)The hitch-hiking effect of a favourable gene. Genet. Res. 23, 23–35.
Tranchevent, L. C., Ardeshirdavani, A., ElShal, S., Alcaide, D., Aerts, J., Auboeuf, D., et al. (2016). Candidate gene prioritization with Endeavour. Nucleic Acids Res. 44, W117–W121. doi: 10.1093/nar/gkw365
Xu, H., and Guan, Y. (2014). Detecting local haplotype sharing and haplotype association. Genetics 197, 823–838. doi: 10.1534/genetics.114.164814
Yang, S., Li, X., Li, K., Fan, B., and Tang, Z. (2014). A genome-wide scan for signatures of selection in Chinese indigenous and commercial pig breeds. BMC Genet. 15:7. doi: 10.1186/1471-2156-15-7
Keywords: selection signatures, SNP, genotyping, horse, ancestral haplotypes, imputation
Citation: Avila F, Mickelson JR, Schaefer RJ and McCue ME (2018) Genome-Wide Signatures of Selection Reveal Genes Associated With Performance in American Quarter Horse Subpopulations. Front. Genet. 9:249. doi: 10.3389/fgene.2018.00249
Received: 02 April 2018; Accepted: 22 June 2018;
Published: 19 July 2018.
Edited by:
Martien Groenen, Wageningen University and Research, NetherlandsReviewed by:
Göran Andersson, Swedish University of Agricultural Sciences, SwedenFabyano Fonseca Silva, Universidade Federal de Viçosa, Brazil
Copyright © 2018 Avila, Mickelson, Schaefer and McCue. This is an open-access article distributed under the terms of the Creative Commons Attribution License (CC BY). The use, distribution or reproduction in other forums is permitted, provided the original author(s) and the copyright owner(s) are credited and that the original publication in this journal is cited, in accordance with accepted academic practice. No use, distribution or reproduction is permitted which does not comply with these terms.
*Correspondence: Felipe Avila, favila@umn.edu