Effects of Scale and Input Data on Assessing the Future Impacts of Coastal Flooding: An Application of DIVA for the Emilia-Romagna Coast
 Claudia Wolff
 Athanasios T. Vafeidis
 Daniel Lincke
 Christian Marasmi
 Jochen Hinkel
- 1Coastal Risks and Sea-Level Rise Research Group, Department of Geography, Christian-Albrechts-University Kiel, Kiel, Germany
- 2Global Climate Forum, Berlin, Germany
- 3Directorate General Environment, Soil and Coast Protection, Bologna, Italy
- 4Berlin Workshop in Institutional Analysis of Social-Ecological Systems, Humboldt-University, Berlin, Germany
This paper assesses sea-level rise related coastal flood impacts for Emilia-Romagna (Italy) using the Dynamic Interactive Vulnerability Assessment (DIVA) modeling framework and investigate the sensitivity of the model to four uncertainty dimensions, namely (1) elevation, (2) population, (3) vertical land movement, (4) scale and resolution of assessment. A one-driver-at-a-time sensitivity approach is used in order to explore and quantify the effects of uncertainties in input data and assessment scale on model outputs. Of particular interest is the sensitivity of flood risk estimates when using datasets of different resolution. The change in assessment scale is implemented through the use of a more detailed digital coastline and input data for the coastline segmentation process. This change leads to a 35-fold increase in the number of coastal segments and in a more realistic spatial representation of coastal flood impacts for the Emilia-Romagna coast. Furthermore, the coastline length increases by 43%, considerably influencing adaptation costs (construction of dikes). With respect to input data our results show that by the end of the century coastal flood impacts are more sensitive to variations in elevation and vertical land movement data than to variations in population data in the study area. The inclusion of local information on human induced subsidence rates increases the relative sea-level by 60 cm in 2100, resulting in coastal flood impacts that are up to 25% higher compared to those generated with the global DIVA values, which mainly account for natural processes. The choice of one elevation model over another can result in differences of ~45% of the coastal floodplain extent and up to 50% in flood damages by 2100. Our results emphasize that the scale of assessment and resolution of the input data can have significant implications for the results of coastal flood impact assessments. Understanding and communicating these implications is essential for effectively supporting decision makers in developing long-term robust and flexible adaptation plans for future changes of highly uncertain scale and direction.
Introduction
Coastal flooding constitutes a major risk for coastal regions throughout the world and this risk is expected to worsen considerably during the twenty-first century with rising sea-levels and as future societal development increases the number of people and value of assets in the coastal floodplain (Hinkel et al., 2014). Therefore, there is a growing need of coastal communities and decision makers to access information on current and future risks as well as on strategies for managing and reducing risks. For instance, national and regional Mediterranean Coastal Administrations have expressed needs for improved methods to evaluate flood risk in Mediterranean coastal areas and to identify comprehensive plans to reduce these risks in recent years (Lupino et al., 2014).
Evaluating and managing coastal flood risk under climate change, as well as climate risk in general, requires to consider uncertainty about present and future risks as comprehensively as possible, because not considering uncertainty may only partially lead to maladaptation (Jones et al., 2014; Hinkel et al., 2015). For coastal flooding, uncertainty relates not only to the amount or rate of sea-level rise (SLR) and socio-economic development, but also to the input data used in the analysis. While scenario uncertainty is generally explored in coastal impact assessments, data uncertainty has not received as much attention in the literature (Le Cozannet et al., 2015). Initial work carried out (Lichter et al., 2011; Mondal and Tatem, 2012) has shown that variations in estimates of area and population exposure are highly dependent on the input datasets. Hinkel et al. (2014) found that coastal flood impacts are much more sensitive to elevation data uncertainty than to, e.g., sea-level rise uncertainty stemming from the choice of climate model. Generally, a significant limitation of flood impact analysis on all scales is the unavailability of free high-accuracy datasets (Gesch, 2009; Mondal and Tatem, 2012; Neumann et al., 2015).
To our knowledge, there is, however, no study that has explored the uncertainty of coastal flood risk assessment with regard to the spatial scale of analysis and spatial resolution of input data. Scale is bound to be an essential parameter in flood risk analysis (de Moel et al., 2015) because different kinds of population, elevation and vertical land movement input data sets are available at different scales. Of particular interest thereby is the sensitivity of flood risk when switching from data sets with global coverage to local, high resolution ones, because the latter are more accurate but only available for few regions. Comparing flood risk attained between global and local datasets thus helps to understand how accurate flood risk assessments are in regions where local high resolution data are not available.
This paper contributes to improve our understanding of the above uncertainties in the context of global coastal flood risk assessment. We do this by taking the Dynamic Interactive Vulnerability Assessment (DIVA) flood risk module from Hinkel et al. (2014) and applying it to the Emilia-Romagna region in Italy using two scales of analysis: (i) a low resolution one based on the global coastline segmentation of Vafeidis et al. (2008) also used by Hinkel et al. (2014); and (ii) a newly developed high-resolution segmentation of the Emilia-Romagna region. The exercise is directly related to a policy process taking place within the EU-funded “Coastal Governance and Adaptation Policies in the Mediterranean” (COASTGAP) project aiming at providing policy-relevant guidance on local coastal flood impacts of climate change.
Specifically, our research objectives are the following:
(1) Explore the sensitivity of coastal flood risk estimates to the effects of different coastlines and segmentations
(2) Explore the sensitivity of coastal flood risk estimates to different population and higher resolution elevation and vertical land movement input datasets
The remainder of this paper is structured as follows. Section Study Area, Methods, and Data provides an overview of the study area, the coastal flood impact model, the segmentation process as well as the sensitivity analysis approach used in this paper. Furthermore, the underlying datasets as well as future climate and socio-economic scenarios will be described. Section Results presents the sensitivity analysis from a selected number of simulation outputs of impacts due to different input datasets and segmentations. Finally, key findings are evaluated and discussed in the Discussion Section.
Study Area, Methods, and Data
Overview
The determination of the effects of scale and sensitivity of impacts to different segmentations and input data follows a multi-level step procedure. The first step was the downscaling process of the assessment units using a more detailed coastline and segmentation process in order to create a data structure that enables the model to run and to be able to quantify the improvements of a more detailed coastline and segmentation. The second step was the calculation of exposure using different vertical land movement, elevation and population datasets, leading to the six datasets of various combinations of four uncertainty dimensions shown in Table 1. In a final step, the DIVA coastal flood module was used to assess potential flood impacts in terms of the following three parameters:
(1) Potential floodplain extent of the 1-in-100-year extreme water level [in km2]
(2) The average number of people flooded annually through extreme water level events [people/year]
(3) The average annual damage caused by coastal flooding [in million US$]
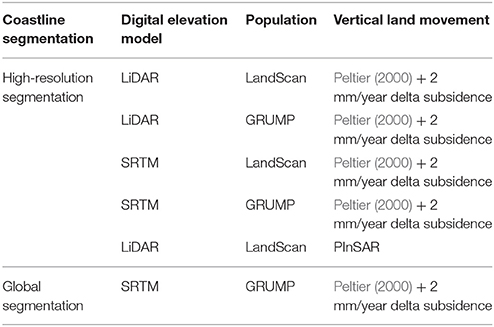
Table 1. Datasets used to investigate the sensitivity of coastal impacts to the four uncertainty dimensions (coastline segmentation, elevation, population, and vertical land movement).
These model outputs are used in order to determine the sensitivity of the model.
Study Area
Emilia-Romagna is situated in the southern part of the Po basin in northern Italy (see Figure 1). It is inhabited by 4.4 million people and covers an area of 22,124 km2. The gross domestic product (GDP) per capita in Emilia-Romagna is 24,396 Euro (Istat, 2009), which is higher than the national average (20,043 Euro). The coastal strip is often higher in elevation than the hinterland, of which more than 100,000 ha are below sea-level (Preti et al., 2009). The low-lying coastal strip is characterized by different levels of human modification and development. The level of modification is ranging from natural to urbanized areas (93 km of the coast or 71% are urbanized). The coastline of urbanized regions has remained relatively stable due to human intervention such as hard shoreline protections or beach nourishment (Armaroli et al., 2012). Hard shore protection, mainly offshore breakwaters, protects 60% of the coastline from flooding and erosion (Nordstrom et al., 2015). The entire region is currently experiencing a sediment deficit which is a result of decreasing fluvial sediment transport caused by stabilization of slopes and hydraulic works along the river bed. Furthermore, there is a current interruption of long-shore sediment transport due to shore protection structures. More than 10 million m3 of sediment was replenished to the beach of Emilia-Romagna between 1983 and 2012 (Montanari and Marasmi, 2014). The dominant coastal type is considered to be sandy beach with an average width of 70 m (emerged beach). Wave energies are normally low in Emilia-Romagna. The wave height is generally below 1.25 m (91%), but storms from the south/southeast (Scirocco) and northeast (Bora) result in high waves and storm surge levels. According to Houtenbos et al. (2005), the relative sea-level rise is higher in Emilia-Romagna than the global eustatic component due to subsidence. Along the Emilia-Romagna coastal area, the degree of subsidence due to natural causes entails a few millimeters per year, while the anthropogenic subsidence has reached high speeds of 50 mm/year in the 80's. Main drivers to cause anthropogenic subsidence include underground extraction of water and natural gas. The Integrated Coastal Zone Management (ICZM) effort in the Emilia-Romagna region started in 2002 and ended with the emanation of ICZM Guidelines approved by the Regional council in the beginning of 2005. They represent the tool to address all coastal activities toward economic, social and environmental sustainability, in compliance with EU Recommendation of the 30th May 2002. According to Preti et al. (2009), the touristic use dominates nearly 85 km of the coast. With more than 36 million overnight stays per year, Emilia-Romagna is one of Italy's most attractive tourist destinations.
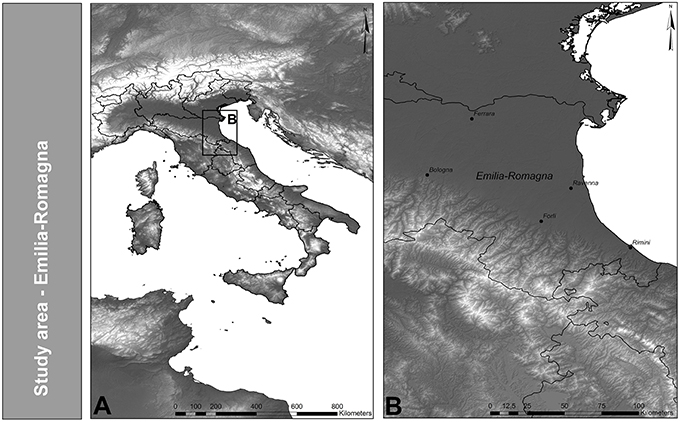
Figure 1. Study area—Emilia-Romagna. (A) Italy (B) Emilia-Romagna.
Methods
Calculating Flood Risk
We used the DIVA (Dynamic Interactive Vulnerability Assessment) coastal flood module (Version 5.0.0) as presented in Hinkel et al. (2014) in order to calculate coastal flood impacts over the next century. The DIVA model operates on data attributed to coastline segments. Global applications of DIVA used a segmented coastline of the world, which comprises 12,148 units of variable length (average of 70 km) based on Vafeidis et al. (2008). Every segment represents a uniform response to SLR within the coastal system. More than 80 physical, ecological and socioeconomic parameters (e.g., uplift/subsidence in mm/year or coastal population) of the world's coastal zone (excluding Antarctica) are spatially referenced to these units. DIVA is driven by climatic and socioeconomic scenarios which will be described in chapter Sea-Level Rise Scenarios and Socio-Economic Scenarios. One important innovation introduced by DIVA is the explicit incorporation of a range of adaptation options, as impacts do not only depend on the selected climatic and socio-economic scenarios but also on the selected adaptation strategy. Possible adaptation strategies in the DIVA modeling framework in order to reduce coastal flood risk are the construction of dikes.
DIVA's flooding module uses a cumulative people and asset exposure function in order to estimate the potential socio-economic impacts of coastal flooding. In order to get the potential number of people living below a certain elevation level and therefore prone to flooding, a digital elevation model (DEM) was combined with a spatial population dataset (a more detailed description of the calculation can be found in Section Exposure Data). Based on extreme water levels given for different return periods in the DIVA database (Vafeidis et al., 2008) the potential exposed area and number of people living in these areas is calculated using a bathtub approach. The extreme water levels within the DIVA database were calculated based on the methodology described in Hoozemans et al. (1993). Relative sea-level rise is then added to the current extreme water level probability distribution, leading to shorter average return periods of flood levels. Hinkel et al. (2014) compute the number of people flooded by only making the binary distinction between flooded and not flooded. The estimation of the value of assets on a given elevation is done by multiplying the number of people with the GDP per capita times an empirically estimated GDP-to-assets ratio of 2.8 taken from Hallegatte et al. (2013). The amount of damage depends on the depth by which the asset is flooded. Hinkel et al. (2014) uses a depth-damage function in order to calculate the fraction of assets that will be damaged when flooded by a certain depth. The depth-damage function reflects the fact that the damage rate decreases with increasing water levels. It is assumed that a flood depth of 1 m destroys 50% of the assets. According to Hinkel et al. (2014), this assumption is a good indication based on the information available to date. If dikes are present, a damage of 0 is assumed for floods lower than the actual dike height. By default, a dike is constructed if at least 1 person per km2 lives on the coast. The dike height is calculated based on a demand for safety function, which depends on the GDP per capita and population density. Following this function, dikes are built and upgraded for each coastline segment in each time step (5 years) until 2100. Future exposure is attained by applying national population and GDP growth rates of the socio-economic scenarios (Hinkel et al., 2014). A more detailed description of the coastal flood module used in this study can be found in Hinkel et al. (2014).
Coastline Segmentation
In order to downscale the assessment scale of DIVA it was necessary to refine the existing coastline and segmentation. The segmentation is an essential step in order to generate a data structure that enables the model to run, and it defines the scale of assessment. The original DIVA segmentation was based on a digital global coastline data set (ESRI, 2002), with a cartographic scale of 1: 3,000,000. As this level of scale is too general for the purpose of a sub-national study due to the loss of important coastal features, a more detailed digital coastline was employed (see Section Coastline Segmentation Data). This coastline was then segmented into units, based on the original concept of McFadden et al. (2007) and using the following parameters relevant for coastal-flood risk assessment and management (1) administrative boundaries, (2) the geomorphic structure of the coastal environment, (3) the expected morphological development of the coast given sea-level rise, and (4) population density. We extended those parameter to also include (5) river mouths as these often have a much greater RSLR due to subsidence than other areas.
Sensitivity Analysis
A sensitivity analysis aims at exploring how much model outputs are affected by changes in input data (Saltelli et al., 2000). We used a simple One-Driver-At-a-Time (OAT) approach. This single factor approach is undertaken by modifying one input variable, e.g., the elevation data, while keeping all remaining inputs consistent. This enables us to explore and to systematically quantify the impacts of different assumptions on the calculated flood impacts. Sensitivity is calculated as the difference between the impacts in 2100. It is a useful method in order to identify key drivers which strengthen the understanding and interpretation of the DIVA modeling framework. In this study we do not quantify how interactions between input factors affect the variability of the model results, as the generation of input data for each point in the uncertainty space considered is computation and labor intensive. For each data point a large number of processing steps is required as the coastline needs to be segmented and the database needs to be populated with e.g., population, vertical land movement, and elevation data. Therefore, deriving more data points for conducting a general sensitivity analysis was not possible within the scope of this study.
Data
Sea-Level Rise Scenarios
We uses regional SLR scenarios of Hinkel et al. (2014), which are based on the Representative Concentration Pathways (RCP) 2.6, 4.5, and 8.5 and comprise the following two main components:
(1) The steric contribution, produced by the Hadley Global Environment Model2—Earth System (HadGEM2-ES; Collins et al., 2008).
(2) Land ice contribution consisting in the mass contribution of glaciers and ice caps, based on Marzeion et al. (2012). The mass contribution of the Greenland ice sheet and peripheral ice caps taken from Fettweis et al. (2013) and the mass contribution from the Antarctic based on Levermann et al. (2012). By combing the three mass contributions a low (5th percentile), medium (50th percentile), and high (95th percentile) land-ice scenario was created (see Table 2). These scenarios also consider gravitational, rotational, and local land uplift effects that results from changes in ice masses and ocean circulations. To implement these effects, the model of Bamber and Riva (2010) was used which considers a uniform mass reduction over the ice sheets.
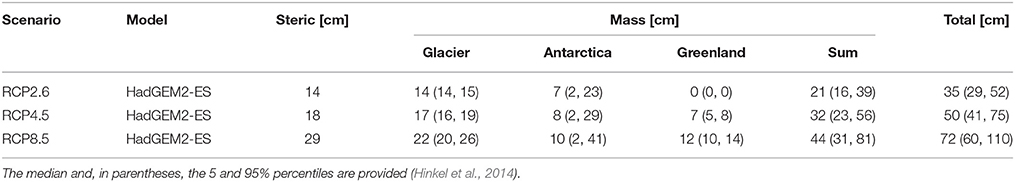
Table 2. Global mean sea-level rise in 2100 with respect to 1985–2005.
For this study, we use three SLR scenarios that sample the full uncertainty space covered by Hinkel et al. (2014). A lower bound scenario (RCP2.6 combined with the 5% quantile of ice-melting projections), hereafter referred to as low SLR, a medium scenario (RCP 4.5 combined with the median), referred to as medium SLR, and an upper bound scenario (RCP8.5 combined with the 95% quantile), referred to as high SLR. The sea-level scenarios for Italy vary between 31 (low SLR scenario) and 122 cm (high SLR scenario) by the end of the twenty-first century (see Figure 2). For every coastline segment, the relative sea-level rise is generated by linking the regional sea-level rise values with the vertical land movement.
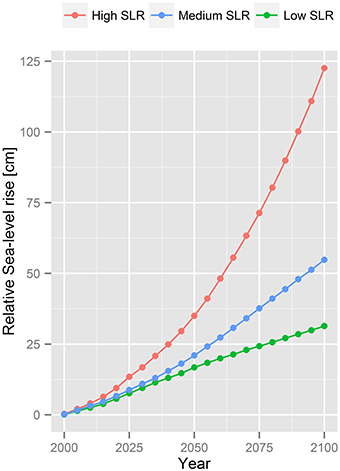
Figure 2. The average relative sea-level rise for Emilia-Romagna under all sea-level rise scenarios.
Socio-Economic Scenarios
Three socio-economic scenarios have been used, based on the IPCC Shared Socio–economic Pathways (SSP) storylines (O'Neill et al., 2014), to present a range of potential future development directions in the Emilia-Romagna region. The SSP3 storyline assumes a high population growth and a slow economic development and represents a fragmented world. In this storyline the world is separated into extreme poverty, moderate wealth and a bulk of regions that struggle to maintain living standards for a rapid growing population. The SSP5 represents a conventional development which is oriented toward economic growth. The population growth is generally low. SSP2 assumes medium growth in socio-economic development worldwide.
The amount of assets and people that will be located in the coastal zone determines the future exposure to coastal flooding. In DIVA the two variables population growth and GDP growth are the main drivers to determine future socio-economic development. The total population of Italy ranges between 22.8 and 75.4 million (see Figure 3) and the GDP per capita between 27,716 and 160,602 US dollar by 2100 (see Figure 4) following the SSP storylines. Those growth rates are applied to the exposure data in order to estimate future coastal flood impacts. According to the global flood risk assessment conducted by Hinkel et al. (2014), the flood costs are highest for SSP5 (economic growth) and lowest for SSP3 (security), reflecting the socio-economic growth rates developed by Kc and Lutz (2014). In order to cover the full range of uncertainty and future pathways, SSP3 and SSP5 have been chosen as well as SSP2 which reflects a world with medium assumptions.
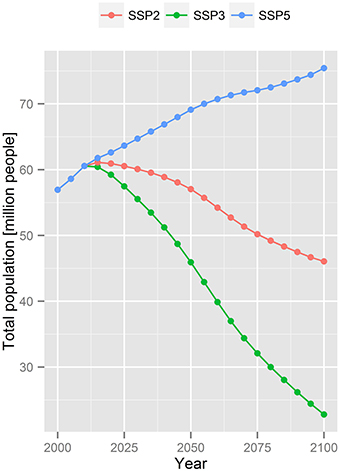
Figure 3. Total population of Italy for each storyline used in this study.
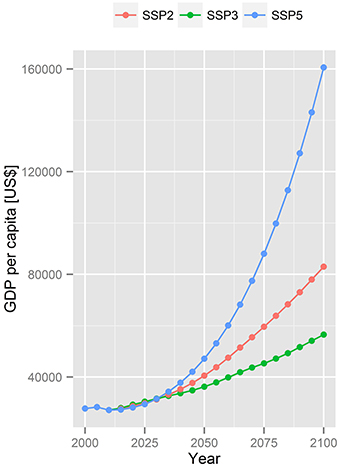
Figure 4. GDP per capita in Italy for each storyline used in this study.
Coastline Segmentation Data
For this study the coast has been resegmented using a more detailed digital coastline (see Supplementary Figure 1 for a comparison between the global and detailed coastline) and data. We selected the Global Administrative Areas (GADM, http://www.gadm.org/) level 01 coastline and corrected artifacts related to the format (e.g., “pixelization” of coastline) using a smoothing algorithm (polynomial approximation) and a tolerance of 100 m.
The availability of consistent datasets on coastal morphology and characteristics is a common limitation for global-, regional-, and national-scale impact assessments. Due to the lack of consistent coastal morphologies and geological characteristics data for the Emilia-Romagna region, an independent consistent data set was generated with Google earth. Google earth provides free satellite images and aerial pictures (Chang et al., 2009) for the whole study area. Based on the concept described in Scheffers et al. (2012), seven different classes [(i) sandy, (ii) unerodible, (iii) pebble, (iv) rocky with pocket beaches, (v) sandy with wave-breakers, (vi) muddy, and (vii) fortified coast—see Figure 5] have been classified based on visual interpretations of Google Earth imagery and location-tagged photographs from the web-service Panoramio which offers geographically tagged photographs from users. The coastline was split every time the type of coast changed. The coastal plain characteristics were segmented with the help of the geomorphic structure data developed by McGill (1958). The parameter provides information about the geomorphology and elevation of the coast. The third biophysical parameter is the river mouth layer. This layer was created with the help of Google earth as well. The population density information splits the coast into two classes, (i) urban/human settlements and (ii) rural (see Figure 5). This indicates variations in the population distribution of the Emilia-Romagna coast which is essential for the assessment of vulnerability to SLR, as e.g., dikes are only build where people are actually living. This spatial dataset was derived with the help of satellite image from Google earth. Furthermore, according to McFadden et al. (2007), institutional and governmental arrangements play an important role in defining the response of coastal systems to an accelerated sea-level. The inclusion of the political system (GADM level 03) is therefore important as different political and administrative controls react differently to SLR in terms of adaptation strategies. Finally, the created layers, described before, were overlaid in order to create segments that represent a uniform response to sea-level forcing.
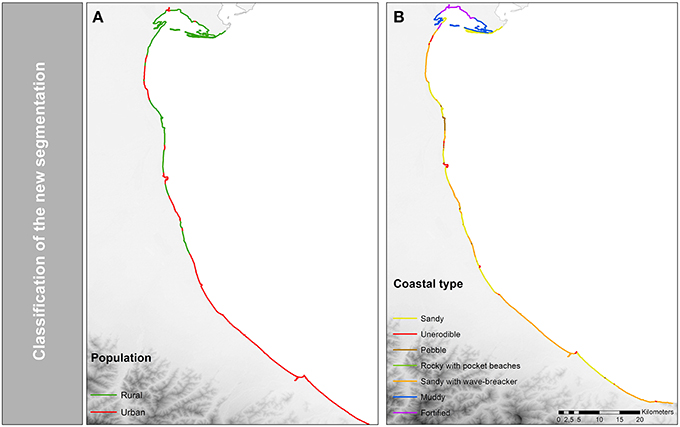
Figure 5. Results of the high-resolution segmentation model. (A) Coastal settlements. (B) Coastal typology classification.
Exposure Data
The segmentation creates units for the analysis (data structure) to which information (e.g., elevation or population data) is attached. Hence, after the segmentation the DIVA database was populated and updated with the help of the data provided from the COASTGAP partners or with the DIVA data. Topography or elevation is one of the main parameters that determine the vulnerability of coastal zones to sea-level rise. In order to assess areas exposed to inundation, two different digital elevation models were used. First, the freely available (1) Shuttle Radar Terrain Mission (SRTM) digital elevation model (Jarvis et al., 2008). It has a vertical resolution of 1 m and spatial resolution of 03 arc seconds (~90 m at the equator). The SRTM (datum wgs84) employs an imaging radar system. It is important to note that the elevation represents the height of the first reflective surface. In open terrain, the SRTM elevation will represent the ground elevation, but in vegetated or urban areas the ground-elevation might be overestimated. According to Gesch (2009), this mix of ground elevation and non-bare ground elevation in SRTM data could be a source of error in inundation mapping in vegetated and urban areas (Baugh et al., 2013; Lewis et al., 2013; Griffin et al., 2015). The second data set used is the (2) Light detection and ranging (LiDAR) digital elevation model (datum wgs84) with a spatial resolution of 5 m and a vertical accuracy of (±)20 cm which was provided by the Emilia-Romagna region. LiDAR employs the airborne laser scanning technique which can resolve a point density of 2 points per m2. Both the 90 and 5 m-resolution data have been used in order to calculate the exposure of areas. A simple “bathtub approach” in which a grid cell becomes flooded if it is below a certain elevation has been used. In order to reflect surface flow connections, an eight-side-rule has been used, where the grid cell becomes a flooded grid cell if the cardinal and diagonal directions are connected. Following this approach, a mask that represents areas hydrologically connected to the sea was created. Afterwards, buffer zones per coastline segment have been produced in order to calculate the number of pixel flooded per segment. The zones also extend seaward, in order to ensure the inclusion of population mismatching which is important in order to calculate exposure of people. As local population data was unavailable, two different global population data sets have been used in order to calculate the exposure of people. The population count datasets of LandScan (2006) (Bright et al., 2007) and the Global Rural Urban Mapping Project (GRUMP 2000) (Center for International Earth Science Information Network - Ciesin - Columbia University et al., 2011) were obtained. Both have a spatial resolution of 30 arc seconds and are based on census population counts. The main differences are the base year, administrative levels of input data and the modeling approach used to allocate and disaggregate these data (Mondal and Tatem, 2012). The total global population between those two population datasets varies by around 8% (Lichter et al., 2011), mainly due to the different base years. In this study, this deviation has been recalculated afterwards to the common base year 1995, using the growth rates of the SSP scenarios. The LandScan global population project allocated annual midyear population estimates, usually at province level, based on weightings derived from land cover, roads, slope, urban areas, and high resolution imagery analysis. It represents an “ambient” population distribution and hence, presents a highly modeled population distribution. In contrast to that, GRUMP was produced by population census data from administrative units and was originally developed in order to reallocate census population counts to urban and rural areas. People were not only redistributed based on areal weighting, but urban populations were also reallocated based on night-time light as GRUMP defines population distribution according to where people actually live (Mondal and Tatem, 2012). Exposure was calculated by combining the information on elevation data with the population distribution data. The number of people at risk was calculated by summarizing population per elevation per increment, per coastline segment. Those values were stored as attributes to the coastline segment.
Vertical Land Movement Data
Vertical land movement is a downward (subsidence) or upward movement (uplift) of the land relative to sea level. Subsidence often occurs in regions associated with alluvial sediments, such as deltas (Ericson et al., 2006) as in the case of the study area, Emilia-Romagna. In this study we compare the vertical land movement of global modeled datasets, which are often used in flood risk assessment, with higher resolution local datasets, which are often not available for flood risk assessments because they are expensive to generate. In particular we consider a global model of glacial isostatic adjustment of Peltier (2000) together with an estimated 2 mm/year subsidence for delta regions as used by Hinkel et al. (2014). Human-induced subsidence rates were not considered. However, it is an important parameter for regions such as Emilia-Romagna where human-induced subsidence due to extraction of water, oil, and gas (Armaroli et al., 2012) is an issue. Data that include both natural and human-induced subsidence were available for this study through the COASTGAP partners. The data were generated from the Permanent Scatter Interferometric Synthetic Aperture Radar (PSInSAR). According to Ferretti et al. (2001), the PSInSAR is a surface displacement observation technique based on conventional radar interferometry. The data was provided by the Emilia-Romagna region in a raster format with a spatial resolution of 100 m. The coastal vertical land movement was calculated by combining the area below 3 m with the PSInSAR data. The coastal vertical land movement was calculated by averaging the rates per zone. Afterwards, the values were joined to the coastline segment. Table 3 shows the Peltier (2000) + 2 mm/year delta subsidence and PSInSAR values used in this study.
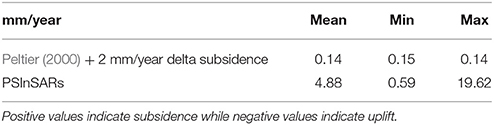
Table 3. Comparison between mean, maximum and minimum values of the globally modeled and locally measured vertical land movement data for the study area.
Results
Segmentation
For the Emilia-Romagna coastline the global segmentation produced three segments with an average segment length of 40 km (minimum length 5.5 km, maximum length 98.8 km, total: 121.5 km). In comparison, the high-resolution segmentation generated 113 segments with an average length of 1.5 km (minimum length is 0.03 km, maximum length is 11.2 km, total: 174.6 km). Thus, the coastline length increased by 43% (53.1 km). The high-resolution segmentation has a 28-fold increase compared to the global DIVA assessment scale referring to the average length of segments. In the global DIVA database the entire coast of Emilia-Romagna was characterized by a sandy coastal morphology and urban settlements while in the new version a more detailed distinction (e.g., 57 segments or 86 km represents coastal settlements, 55 km are classified as sandy plus 59 km as sandy with wave breaker—see Figure 5) was made. The comparison of the different segmentation models indicates that the new segmentation approach increased not only the length of the coast but also the spatial representation of impacts in the Emilia-Romagna region (see Figure 7).
Sensitivity to Segmentation
Using the high-resolution segmentation, the 100-year floodplain has an extent of 3309 km2 (using the SRTM elevation model), assuming a high SLR, in 2100. That covers 15% of the entire area of Emilia-Romagna. The potential flood area extent differs by 789 km2 depending on the scale and resolution of assessment in 2100 (see Table 4). This situation shows that even if the underlying data (SRTM) remains the same, the total local values deviate due to the different scale of analysis. The main reason for that is the creation of buffer zones (see Supplementary Figure 2) which were used in order to calculate the exposure statistics per increment. The average number of people potentially flooded annually through extreme water level events is presented in Figure 6 and in Supplementary Table 1. The results depend on the coastal topography, population, and adaptation strategy, as well as sea-level rise and socio-economic developments. Assuming that there are no protection measures in place, the number of people flooded varies between 90,909 and 511,198 people in 2100, using different assessment scales.
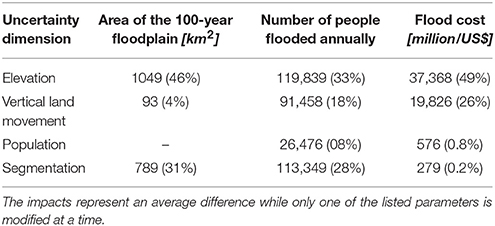
Table 4. Sensitivity of coastal flood impacts to the four uncertainty parameters in 2100 (SSP5, high SLR).
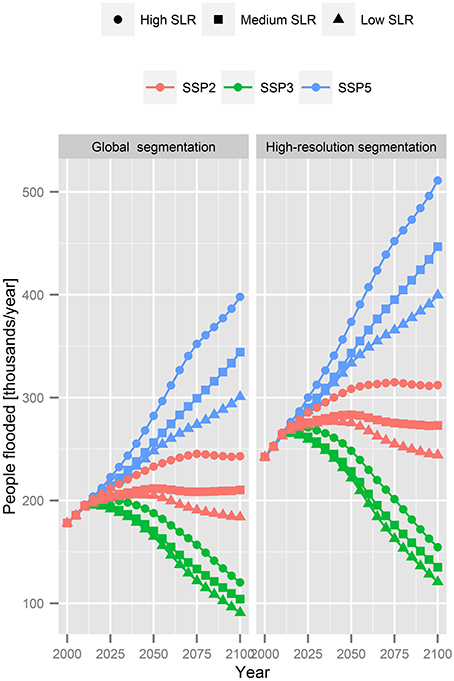
Figure 6. Average annual people flooded from 2000 to 2100 under all SLR scenarios.
In the worst case, the choice of one particular assessment scale over another can result in an additional difference of 2.6% concerning the total population of Emilia-Romagna at risk. The spatial distribution of the people at risk per coastline segment for both assessments scales is presented in Figure 7. The detailed coastline represents the spatial distribution of people at risk more realistically, due to the more refined assessment scale and the increase of units.
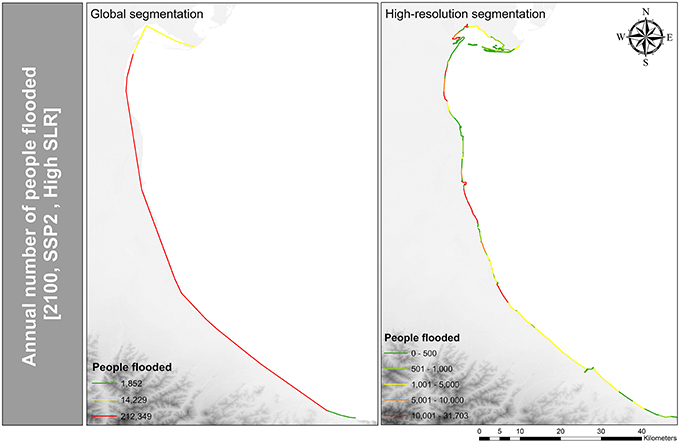
Figure 7. Comparison of the spatial distribution of the expected number of people flooded annually using the global and high-resolution segmentation in 2100 (SSP2, High SLR).
Impacts are also very sensitive to population density threshold that determines when dike building starts. Setting this threshold is a normative decision depending on the risk preferences of coastal societies. If this threshold is set to 1 person per km2, the entire coastline of the Emilia-Romagna is protected by dikes for both assessment scales (see Table 5). Considering a dike construction threshold of 10 people per km2, 94% of the coast will be protected via dikes using the high-resolution segmentation assuming a medium SLR in 2100. In contrast, no change in the protection length was observed in the study area using the global assessment units. A threshold of 100 people per km2 decreased the dike length by 36% using the detailed coastline and by 14% using the global coastline segmentation. The flood cost varies up to 279 million US dollar due to the change in the assessment scales. To conclude, the change in assessment scale, namely the increase of segments and length, showed a high sensitivity in this study (see Table 4 and Supplementary Table 2).
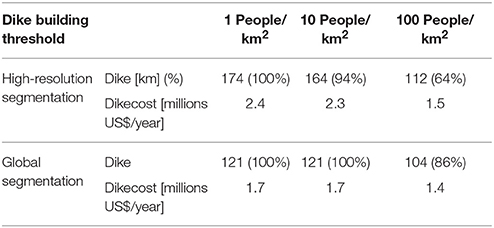
Table 5. Protected coastline length and cost of dikes for different dike construction thresholds using two different assessment scales in 2100 (medium SLR).
Sensitivity to Elevation Data
The coastal flood impact calculation showed the highest sensitivity to the change in the elevation data in this study (see Table 4 and Supplementary Table 3). The estimated areas exposed to coastal flooding are smaller with LiDAR DEM than those calculated with the SRTM DEM. This leads to an increase in the exposed area and potential coastal flood impacts. The choice of one particular elevation model over another can translate to a difference of more than 1049 km2 of the current potential 100-year floodplain (see Table 6). The floodplain increases by 4–26% in 2100 (referring to 2015), depending on the elevation model and sea-level rise scenario chosen (see Supplementary Table 4). The differences of potential impacts using different digital elevation models decrease toward the end of the century when using a higher SLR scenario. This situation occurs due to the large differences between two elevation models in the area below 5 m. Those low-lying areas mainly influence the extent of the 100-year floodplain. Hence, the influence of the data sets used is higher under a low sea-level rise due to the fact that the elevation data differs the most at low elevations, as illustrated in Figure 8.
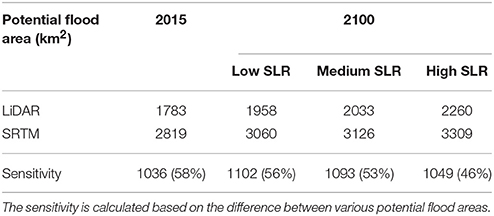
Table 6. 100-year floodplain under three different SLR scenarios using LiDAR and SRTM (today and in 2100).
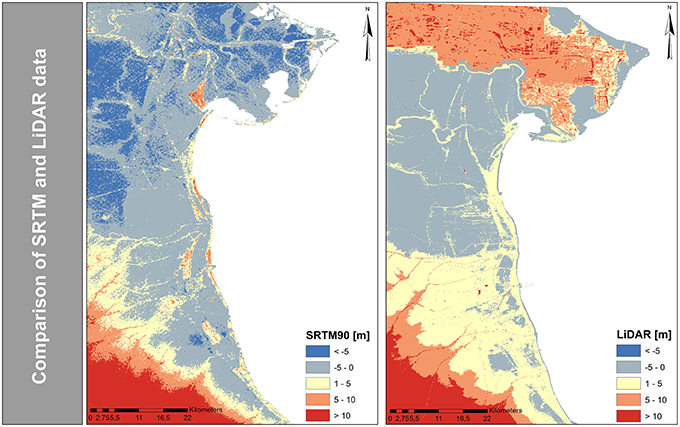
Figure 8. Comparison of the SRTM90 and LiDAR digital elevation data for the Emilia-Romagna region.
The potential of people exposed to annual coastal flooding and the average of annual damage caused by coastal flooding showed a high sensitivity to the change in elevation data (see Table 4). The potential impacts of coastal flooding are higher using the SRTM elevation model due to increasing areas at risk of coastal flooding (as shown in Table 6). The difference of 33% in the potential flood area leads to an increase of 49% in flood costs and to a 46% higher amount of people at risk compared to the impacts calculated with the LiDAR elevation model.
Sensitivity to Vertical Land Movement Data
The inclusion of measured data on human induced subsidence rates in the vertical land movement data led to an increase of relative sea-level rise (see Table 7). In 2100, an additional relative sea-level rise of 60 cm is reached, using the PSInSAR data which has a higher influence than the low and medium sea-level rise scenarios used in this study. This leads to a significant increase in the potential impacts as it increases the exposure of people and area to coastal flooding due to the landward displacement of the flood extent.
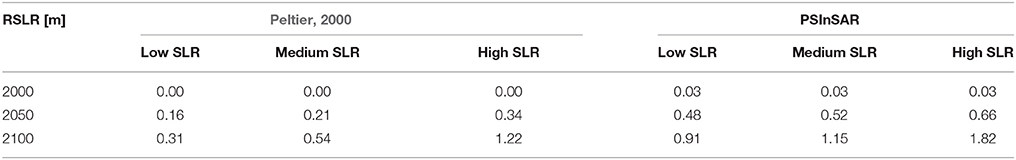
Table 7. Comparison of relative sea-level rise values using the old DIVA and the PSInSAR values.
The expected annual number of people flooded is highest using the PSInSAR vertical land movement data under SSP5, reflecting the highest population numbers, and a high SLR. The influence of the change in data is highest under the low SLR scenario and lowest under the high SLR scenario in 2100. Impacts intensify throughout the century under all socio-economic scenarios. Using the PSInSAR vertical land movement data, including human induced subsidence, impacts are up to 25% higher (e.g., flood cost) than those estimated using the DIVA values, which only account for natural processes.
Sensitivity to Population Data
Model outputs were least sensitive to variations of population data (see Table 4). The estimated number of exposed people using GRUMP is smaller than those calculated with LandScan. The total amount of population for Emilia-Romagna using the LandScan dataset is 0.7% higher than using the GRUMP (total population of Emilia-Romagna using GRUMP: 4016951 and LandScan: 4046404). Due to the different reallocation methods and administrative levels of input data (explained in Section Coastline Segmentation Data) the number of estimated people exposed to coastal flooding differs with respect to the two datasets. In an area of around 15%, which represents the potential 100-year flood plain of Emilia-Romagna using the SRTM elevation model, ~10% of the total population of Emilia-Romagna is living in the flood plain and therefore is potentially at risk to the 100 year surge. The expected number of people annually flooded due to the switch in datasets differs by 26,476 people (8%) in 2100. The potential coastal flood cost differs by 576 million US dollar (0.8%; see Table 4).
Discussion
Effects of Different Coastlines and Segmentations to Coastal Flood Impact Assessment
Within the framework of the COASTGAP project and for the purpose of the current analysis, the DIVA assessment scale has been downscaled to be applicable at a sub-national scale. The distribution of features along the coast, the scale of the coastline and the defined classes for each parameter as well as available data used in order to segment the coast, determines the number of segments that were produced. The main effect due to the change in scale of the coastline was the increase in coastal length which influences adaptation cost (construction of dikes) considerably. The change in assessment units (segmentation), namely the increase of segments and the decrease of segment average length led to a high sensitivity of model outputs in this study. The main difference results from the creation of buffer zones which depend on the shape of the coast and segment (see Section Coastline Segmentation Data and Supplementary Figure 2) that was used in order to calculate the exposure per segment. Using the global segmentation model and buffer zones, parts of the flood extent are potentially added to the neighboring administrative unit as the segments are quite large. Hence, one main improvement of the refined segmentation is the increased spatial accuracy of impacts on a sub-national scale as the number of segments and zones increase (see Figure 7). Thus, impacts are more concentrated and spatially accurate than before. This improves the assessment by making future predictions more realistic than before and suggests that the refined segmentation is more appropriate to be used when more detailed data (e.g., population) become available or underlying normative assumptions, such as dike building computation, are adopted for more detailed application. Thus, even if the underlying data improve, model algorithms/assumptions may also need to be adjusted to represent sub-national to local processes more realistically.
The aim of the COASTGAP project was to develop adaptation policies to reduce risk along the coast and to create new common tools and opportunities for coastal zone development in the Mediterranean. The developed approach can be used to support this development as it would enable consistent and comparable coastal flood impact assessments for local policy makers with limited data availability. The approach can also be useful for the implementation of the provisions of EC Directive 2007/60 in the assessment and management of flood risks which entered into force in 2007 (2007/60/EC). In particular, the Directive now requires Member States to assess if all water courses and coastlines are at risk from flooding, to map the flood extent, assets, humans at risk in these areas and to take adequate and coordinated measures to reduce this flood risk. These requirements can be realized by applying the DIVA modeling framework for the respective calculations. On a more refined scale it is more realistic to identify hot spots, for instance where people are at risk of coastal flooding (see comparison Figure 7) or calculate adaptation needs. This simplifies the identification of priority regions that are highly vulnerable to SLR and need further research effort. Future work could be a scoping study in the Mediterranean using a downscaled version of the DIVA model in order to serve the need for basic information to politicians and decision-makers on the overall risk situation in the coastal zone and pinpoint hot spots. Finding the appropriate spatial scale which is most relevant for the objective of the research question or decision makers is highly important as vulnerability to SLR in the coastal zone is scale-dependent (Sterr, 2008; Fekete et al., 2010). It is important to keep in mind that a more detailed method to calculate coastal flood impacts requires more effort per unit of an area. The developed approach could be a starting point to close the gap and assess impacts and risk at an intermediate scale using a global coastal flood impact model. Furthermore, the link between different spatial scales could be a promising future research area as it would enable rapid coastal flood impact assessments with limited data and enable consistent and comparable coastal flood impact assessments worldwide (de Moel et al., 2015).
Model Sensitivity to Input Data
Results of the study showed a high sensitivity to the change in elevation input data, which is consistent with previous studies (e.g., Poulter and Halpin, 2008; Lichter et al., 2011; Hinkel et al., 2014). Nevertheless, it is difficult to compare those studies as the estimates of area and population exposure in the coastal zone vary depending on the scale (global to local), input datasets (e.g., SRTM, Globe, Aster, LiDAR), methods (e.g., hydrological connectivity rule) and objectives of the study. According to Gesch (2009), the identification of areas exposed to a certain sea-level rise scenario improves considerably when higher-resolution and -accuracy data, such as LiDAR data, are used. He found the inundation area to be two times higher when the vertical accuracy of coarser elevation datasets, such as GTOPO30, is considered in the calculation of area exposure. In contrast to that, the LiDAR-based exposure calculation increases by only 14% when the accuracy of the elevation model is considered. Previous coastal impact studies have primarily used SRTM data due to the fact that these cover nearly the entire world and are freely available. The results of the present study showed a significant difference between the LiDAR (high resolution data) and SRTM digital elevation model. The SRTM data produced a much larger potential coastal floodplain than the LiDAR DEM, contrary to what was initially anticipated as the SRTM digital elevation model is a surface model and the elevation represents the height of the first reflective surface. In contrast to that van De Sande et al. (2012) reported a four times smaller coastal floodplain using STRM data instead of LiDAR in a delta region in Nigeria (Lagos State and Lagos City). Therefore, it is important to evaluate and quantify data differences in order to improve our understanding of global digital elevation datasets and how these influence flood risk assessments.
If one compares the SRTM with land use data, such as the CORINE land use cover (see Figure 9), it becomes obvious that low elevation values occur over agricultural and low-vegetation areas, while high-elevation values occur in forests and cities. This effect can be accounted for in local studies by, for example, reducing the elevation values of SRTM by the average height of vegetation derived on the basis of field measurements (Kaiser et al., 2011) or other sources of spatially distributed vegetation height data (Baugh et al., 2013). However, additional factors may also influence the elevation values of the model. Although the overestimation of elevation values, for instance in urban areas or vegetated terrain, is well documented in the literature (e.g., Hofton et al., 2006; Rodríguez et al., 2006), some studies have found SRTM to underestimate elevation values (Jarvis et al., 2004). For example, in a study conducted in two vegetation-free areas in Iowa and North Dakota (USA) Kellndorfer et al. (2004) reported absolute errors of −4.0 and −1.1 m, respectively. Notably, most studies express the vertical accuracy in absolute values (e.g., Gorokhovich and Voustianiouk, 2006; Berry et al., 2007) and do not specify an over- or under-estimation of SRTM values. In this study, an overestimation of the potential coastal floodplain is observed using the SRTM elevation data, suggesting a negative bias in the data, which leads to much higher potential impacts. Understanding the effects of the use of elevation models of different resolution and accuracy would be of high value for coastal flood impact assessments as the choice of the digital elevation model can significantly influence the assessment of coastal flood impacts, as shown in this study. Importantly, high-resolution and -accuracy data cannot be employed for global or regional studies due to computational constraints and lack of such data.
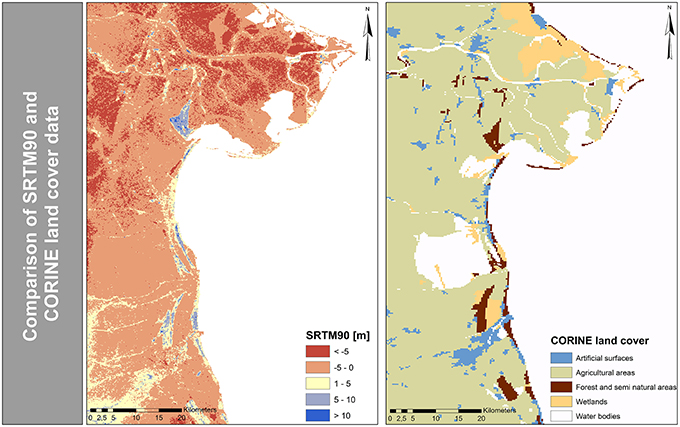
Figure 9. Comparison of the SRTM90 digital elevation data and CORINE land cover data in Emilia-Romagna.
Human-induced subsidence which leads to higher relative sea-level rates is a major source of uncertainty in coastal flood impact assessment as data is hardly available. The results indicate that the flood risk estimates for the region considered here have a moderate sensitivity to vertical land movement input data, as these can significantly influence the relative sea-level rise. In our study relative sea-level rise increased on average by 5 mm/year using data that include human-induced subsidence (PSInSAR data). This is in line with the study conducted by Syvitski et al. (2009), who estimated a relative sea-level rise of 4–60 mm/year, for the Po delta (the Po delta is the northern boundary of the study area). Furthermore, Taramelli et al. (2015) estimated coastal subsidence of 7–9 mm/year in the Ravenna coastal area and Bevano River. This study was undertaken in regions where there is intensive mining activity (freshwater or hydrocarbon) and the subsidence rates can be higher than a meter per century. This increase in relative sea-level rise leads to a significant increase in exposure of people and areas to coastal flooding due to the landward displacement of the flood extent, and thus in the exacerbation of potential impacts. This study indicates that the global results of Hinkel et al. (2014) using global vertical land movement data underestimates impacts due to the non-consideration of human induced subsidence even in non-delta regions like Emilia-Romagna.
In order to calculate potential coastal flood impacts a further uncertainty source is the distribution of people (and assets) along the coastline. Flood risk estimates showed a relevant but small sensitivity to changes in population input data. A similar trend was observed at global scale by Hinkel et al. (2014). Nevertheless, relative flood impact can differ substantially per segment, administrative unit or country, even if the total numbers do not differ significantly. The GRUMP model distributes people much more uniformly than the Landscan model. Figure 10 shows the comparison between the GRUMP and LandScan difference grid in comparison with the urban areas of the MODIS land cover data. Here, it can be seen that LandScan allocates higher population values in urban areas and human settlements. This explains why LandScan distributes more people to the coast than GRUMP in this study as popular tourist resorts, such as Ravenna and Rimini, are part of the floodplain. Thus, in order to interpret the flood risk estimates correctly it is important to keep the different representations/ assumptions of population distributions in mind. However, both population models seem to be useful in order to calculate coastal flood impact trends. For a more robust evaluation of the global datasets high-resolution data would be necessary.
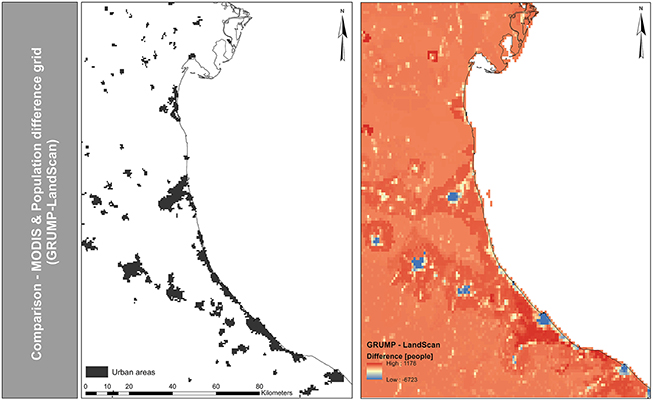
Figure 10. Comparison of the GRUMP-LandScan difference grid to the urban areas of the MODIS land cover data.
Overall, the largest uncertainty when looking at the present day situation is the elevation data, as shown in previous work (Lichter et al., 2011; Hinkel et al., 2014). Different elevation datasets can have substantial effects, increasing or decreasing the floodplain area by factor 2–3. Our analysis confirms these findings. In our case study the DEM is the most important factor for assessing current exposure and risk. For assessing the future impacts of coastal flooding, sea-level rise is the most important factor, which is also in accordance with Hinkel et al. (2014). Nevertheless, in our case study sea-level rise is strongly influenced by human induced subsidence, which, as shown by previous work (Nicholls, 1995), is usually a local phenomenon often occurring in megacities. Thus, a further insight from our study is that exposure and risk are increasing in the heavily subsiding broader Emilia-Romagna region, although no major city is located in this region.
Conclusion
This study presented an assessment of sea-level rise impacts on the coastal region of Emilia-Romagna using different input datasets and assessment scales. The first objective of the study was to explore the potential benefits of the use of a more refined coastline and segmentation. The high-resolution segmentation improves the potential coastal flood impact representation as future predictions are more concentrated and spatially explicit. This study is a first approach to downscale the DIVA assessment scale and data for sub-national applications and refines the existing segmentation model and database; and a first step to downscale global coastal flood impact assessments for specific areas. Downscaling global coastal flood impact models could be a promising future research area as it would enable rapid coastal flood impact assessments for local policy makers with limited data and resource availability. Furthermore, identifying links between spatial scales can enable consistent and comparable coastal flood impact assessments and would constitute a useful tool for global actors (e.g., Re-insurers, European flood directive, World Bank).
The second objective of the study was to explore the model sensitivity to different input data on elevation, population, and vertical land movement when assessing coastal flood impacts. This study indicates that the lack of high-accuracy elevation and vertical land movement data remains a significant constraint in global coastal flood impact analysis. We must also note that coastal flood impact assessment also includes other sources of uncertainties that should be investigated in future work, such as the spatial (Lewis et al., 2013) and temporal variability (Quinn et al., 2014) of extreme water levels and their implications in coastal flood impact assessment. Understanding the whole range of uncertainties and communicating their implications is essential for the development of long-term robust and flexible adaptation plans for future changes of highly uncertain scale and direction. Further work aims to assess the sensitivity of different input datasets and scale of analysis in different regions, in order to gain a more complete understanding of the use of global datasets in flood-impact modeling and the sensitivity of the DIVA flooding module to input data and scale.
Author Contributions
CW, AV, JH, DL designed research. CW and DL set up the model. CW and CM collected the data. CW, AV, DL, CM, and JH analyzed the results. CW wrote the paper with contributions from AV, DL, CM, and JH. All authors read and approved the final manuscript.
Conflict of Interest Statement
The authors declare that the research was conducted in the absence of any commercial or financial relationships that could be construed as a potential conflict of interest.
Acknowledgments
CW, AV, and CM were supported by the COASTGAP project (1CAP-MED012-08) which was co-financed by the European Regional Development Fund (ERDF). DL and JH have been supported by the EU-funded projects, RISES-AM (Grant Nr: 603396) and GREEN-WIN (Grant Nr: 642018). The authors would also like to thank Dr. Eva Papaioannou who assisted in the implementation of the coastline segmentation.
Supplementary Material
The Supplementary Material for this article can be found online at: https://www.frontiersin.org/article/10.3389/fmars.2016.00041
References
Armaroli, C., Ciavola, P., Perini, L., Calabrese, L., Lorito, S., Valentini, A., et al. (2012). Critical storm thresholds for significant morphological changes and damage along the Emilia-Romagna coastline, Italy. Geomorphology 143–144, 34–51. doi: 10.1016/j.geomorph.2011.09.006
Bamber, J., and Riva, R. (2010). The sea level fingerprint of recent ice mass fluxes. Cryosphere 4, 621–627. doi: 10.5194/tc-4-621-2010
Baugh, C. A., Bates, P. D., Schumann, G., and Trigg, M. A. (2013). SRTM vegetation removal and hydrodynamic modeling accuracy. Water Resour. Res. 49, 5276–5289. doi: 10.1002/wrcr.20412
Berry, P. A. M., Garlick, J. D., and Smith, R. G. (2007). Near-global validation of the SRTM DEM using satellite radar altimetry. Remote Sensing Environ. 106, 17–27. doi: 10.1016/j.rse.2006.07.011
Bright, E. A., Coleman, P. R., and King, A. L. (2007). LandScan 2006. Oak Ridge, TN: Oak Ridge National Laboratory.
Center for International Earth Science Information Network - Ciesin - Columbia University, International Food Policy Research Institute - Ifpri, The World Bank, Centro Internacional De Agricultura Tropical - Ciat (2011). Global Rural-Urban Mapping Project, Version 1 (GRUMPv1): Population Density Grid. Palisades, NY: NASA Socioeconomic Data and Applications Center (SEDAC).
Chang, A. Y., Parrales, M. E., Jimenez, J., Sobieszczyk, M. E., Hammer, S. M., Copenhaver, D. J., et al. (2009). Combining Google earth and GIS mapping technologies in a dengue surveillance system for developing countries. Int. J. Health Geogr. 8, 49. doi: 10.1186/1476-072X-8-49
Collins, W. J., Bellouin, N., Doutriaux-Boucher, M., Gedney, N., Hinton, T., Jones, C. D., et al. (2008). Evaluation of the HadGEM2 Model. Met Office Hadley Centre Technical Note no. HCTN 74.
de Moel, H., Jongman, B., Kreibich, H., Merz, B., Penning-Rowsell, E., and Ward, P. J. (2015). Flood risk assessments at different spatial scales. Mitigation Adapt. Strateg. Glob. Chang. 20, 865–890. doi: 10.1007/s11027-015-9654-z
Ericson, J. P., Vorosmarty, C. J., Dingman, S. L., Ward, L. G., and Meybeck, M. (2006). Effective sea-level rise and deltas: causes of change and human dimension implications. Glob. Planet. Change 50, 63–82. doi: 10.1016/j.gloplacha.2005.07.004
Fekete, A., Damm, M., and Birkmann, J. (2010). Scales as a challenge for vulnerability assessment. Nat. Hazards 55, 729–747. doi: 10.1007/s11069-009-9445-5
Ferretti, A., Prati, C., and Rocca, F. (2001). Permanent scatterers in SAR interferometry. IEEE Trans. Geosci. Remote Sens. 39, 8–20. doi: 10.1109/36.898661
Fettweis, X., Franco, B., Tedesco, M., Van Angelen, J. H., Lenaerts, J. T. M., Van Den Broeke, M. R., et al. (2013). Estimating the Greenland ice sheet surface mass balance contribution to future sea level rise using the regional atmospheric climate model MAR. Cryosphere 7, 469–489. doi: 10.5194/tc-7-469-2013
Gesch, D. B. (2009). Analysis of lidar elevation data for improved identification and delineation of lands vulnerable to sea-level rise. J. Coas. Res. 10053, 49–58. doi: 10.2112/SI53-006.1
Gorokhovich, Y., and Voustianiouk, A. (2006). Accuracy assessment of the processed SRTM-based elevation data by CGIAR using field data from USA and Thailand and its relation to the terrain characteristics. Remote Sensing Environ. 104, 409–415. doi: 10.1016/j.rse.2006.05.012
Griffin, J., Latief, H., Kongko, W., Harig, S., Horspool, N., Hanung, R., et al. (2015). An evaluation of onshore digital elevation models for modelling tsunami inundation zones. Front. Earth Sci. 3:32. doi: 10.3389/feart.2015.00032
Hallegatte, S., Green, C., Nicholls, R. J., and Corfee-Morlot, J. (2013). Future flood losses in major coastal cities. Nat. Clim. Change 3, 802–806. doi: 10.1038/nclimate1979
Hinkel, J., Jaeger, C., Nicholls, R. J., Lowe, J., Renn, O., and Peijun, S. (2015). Sea-level rise scenarios and coastal risk management. Nat. Clim. Change 5, 188–190. doi: 10.1038/nclimate2505
Hinkel, J., Lincke, D., Vafeidis, A. T., Perrette, M., Nicholls, R. J., Tol, R. S. J., et al. (2014). Coastal flood damage and adaptation costs under 21st century sea-level rise. Proc. Natl. Acad. Sci. U.S.A. 111, 3292–3297. doi: 10.1073/pnas.1222469111
Hofton, M., Dubayah, R., Blair, B., and Rabine, D. (2006). Validation of SRTM elevations over vegetated and non-vegetated terrain using medium footprint lidar. Photogram. Eng. Remote Sens. 2006, 279–285. doi: 10.14358/PERS.72.3.279
Hoozemans, F. M. J., Marchand, M., and Pennekamp, H. A. (1993). Sea Level Rise: A Global Vulnerability Assessment Vulnerability Assessments for Population, Coastal Wetlands and Rice Production on a Global Scale. Delft: Delft Hydraulics.
Houtenbos, A. P. E. M., Hounjet, M. W. A., and Barends, B. J. (2005). “Subsidence from geodetic measurements in the Ravenna area,” in Proceedings of the 7th International Symposium on Land Subsidence (Shanghai: Deltares (WL)), 79–99.
Istat (2009). Pil Pro Capite Per Regione. Available online at: http://noi-italia2012.istat.it/fileadmin/user_upload/allegati/91.pdf
Jarvis, A., Reuter, H. I., Nelson, A., and Guevara, E. (2008). Hole-Filled SRTM for the Globe Version 4. Available online at: http://srtm.csi.cgiar.org/
Jarvis, A., Rubiano, J., Nelson, A., Farrow, A., and Mulligan, M. (2004). Practical Use of SRTM Data in the Tropics: Comparisons with Digital Elevation Models Generated from Cartographic Data. Working Document No. 198. Cali: International Center for Tropical Agriculture (CIAT) and the International Plant Genetic Resources Institute (IPGRI).
Jones, N., Koukoulas, S., Clark, J. R. A., Evangelinos, K. I., Dimitrakopoulos, P. G., Eftihidou, M. O., et al. (2014). Social capital and citizen perceptions of coastal management for tackling climate change impacts in Greece. Reg. Environ. Change 14, 1083–1093. doi: 10.1007/s10113-013-0540-5
Kaiser, G., Scheele, L., Kortenhaus, A., Løvholt, F., Römer, H., and Leschka, S. (2011). The influence of land cover roughness on the results of high resolution tsunami inundation modeling. Nat. Hazards Earth Syst. Sci. 11, 2521–2540. doi: 10.5194/nhess-11-2521-2011
Kc, S., and Lutz, W. (2014). The human core of the shared socioeconomic pathways: population scenarios by age, sex and level of education for all countries to 2100. Glob. Environ. Change. doi: 10.1016/j.gloenvcha.2014.06.004. Available online at: http://www.sciencedirect.com/science/article/pii/S0959378014001095#FCANote
Kellndorfer, J., Walker, W., Pierce, L., Dobson, C., Fites, J. A., Hunsaker, C., et al. (2004). Vegetation height estimation from shuttle radar topography mission and national elevation datasets. Remote Sens. Environ. 93, 339–358. doi: 10.1016/j.rse.2004.07.017
Le Cozannet, G., Rohmer, J., Cazenave, A., Idier, D., Van De Wal, R., De Winter, R., et al. (2015). Evaluating uncertainties of future marine flooding occurrence as sea-level rises. Environ. Modell. Softw. 73, 44–56. doi: 10.1016/j.envsoft.2015.07.021
Levermann, A., Albrecht, T., Winkelmann, R., Martin, M. A., Haseloff, M., and Joughin, I. (2012). Kinematic first-order calving law implies potential for abrupt ice-shelf retreat. Cryosphere 6, 273–286. doi: 10.5194/tc-6-273-2012
Lewis, M., Bates, P., Horsburgh, K., Neal, J., and Schumann, G. (2013). A storm surge inundation model of the northern Bay of Bengal using publicly available data. Q. J. R. Meteorol. Soc. 139, 358–369. doi: 10.1002/qj.2040
Lichter, M., Vafeidis, A. T., Nicholls, R. J., and Kaiser, G. (2011). Exploring data-related uncertainties in analyses of land area and population in the “low-elevation coastal zone” (LECZ). J. Coast. Res. 274, 757–768. doi: 10.2112/JCOASTRES-D-10-00072.1
Lupino, P., Bellacicco, S., Di Cosimo, M., Scaloni, P., Pedetta Peccia, S., Montanari, R., et al. (2014). Practical Guide to COASTGAP MED Capitalisation Initiative. Rome: Regione Lazio.
Marzeion, B., Jarosch, A. H., and Hofer, M. (2012). Past and future sea-level change from the surface mass balance of glaciers. Cryosphere 6, 1295–1322. doi: 10.5194/tc-6-1295-2012
McFadden, L., Nicholls, R. J., Vafeidis, A., and Tol, R. S. J. (2007). A Methodology for modeling coastal space for global assessment. J. Coast. Res. 234, 911–920. doi: 10.2112/04-0365.1
McGill, J. T. (1958). Map of coastal landforms of the world. Geogr. Rev. 48, 402–405. doi: 10.2307/212259
Mondal, P., and Tatem, A. J. (2012). Uncertainties in measuring populations potentially impacted by sea level rise and coastal flooding. PLoS ONE 7:e48191. doi: 10.1371/journal.pone.0048191
Montanari, R., and Marasmi, C. (2014). Il Sistema Gestionale Delle Celle Litoranee SICELL in Aggiornamento 2006-2012. Regione Emilia-Romagna. Servizio Difesa del Suolo, della Costa e Bonifica.
Neumann, B., Vafeidis, A. T., Zimmermann, J., and Nicholls, R. J. (2015). Future coastal population growth and exposure to sea-level rise and coastal flooding-a global assessment (vol 10, e0118571, 2015). PLoS ONE 10:e0118571. doi: 10.1371/journal.pone.0118571
Nicholls, R. J. (1995). Coastal megacities and climate change. GeoJournal 37, 369–379. doi: 10.1007/BF00814018
Nordstrom, K. F., Armaroli, C., Jackson, N. L., and Ciavola, P. (2015). Opportunities and constraints for managed retreat on exposed sandy shores: examples from Emilia-Romagna, Italy. Ocean Coast. Manag. 104, 11–21. doi: 10.1016/j.ocecoaman.2014.11.010
O'Neill, B. C., Kriegler, E., Riahi, K., Ebi, K. L., Hallegatte, S., Carter, T. R., et al. (2014). A new scenario framework for climate change research: the concept of shared socioeconomic pathways. Clim. Change 122, 387–400. doi: 10.1007/s10584-013-0905-2
Peltier, W. (2000). ICE4g (VM2) Glacial Isostatic Adjustment Correction on Sea Level Rise, History and Consequences. San Diego, CA: Academic Press. International Geophysics Series 75.
Poulter, B., and Halpin, P. N. (2008). Raster modelling of coastal flooding from sea-level rise. Int. J. Geogr. Inf. Sci. 22, 167–182. doi: 10.1080/13658810701371858
Preti, M., De Nigris, N., Morelli, M., Monti, M., Bonsignore, F., and Aguzzi, M. (2009). Stato del Litorale Emiliano-Romagnolo ALL'ANNO 2007 e Piano Decennale di Gestione. Ravenna: Regione Emilia-Romagna.
Quinn, N., Lewis, M., Wadey, M. P., and Haigh, I. D. (2014). Assessing the temporal variability in extreme storm-tide time series for coastal flood risk assessment. J. Geophys. Res. Oceans 119, 4983–4998. doi: 10.1002/2014JC010197
Rodríguez, E., Morris, C. S., and Belz, J. E. (2006). A global assessment of the SRTM performance. Photogrammetric Eng. Remote Sensing 72, 249–260. doi: 10.14358/PERS.72.3.249
Saltelli, A., Tarantola, S., and Campolongo, F. (2000). Sensitivity analysis as an ingredient of modeling. Stat. Sci. 15, 377–395. doi: 10.1214/ss/1009213004
Scheffers, A. M., Scheffers, S. R., and Kelletat, D. H. (2012). The Coastlines of the World with Google Earth. Dordrecht: Springer.
Sterr, H. (2008). Assessment of vulnerability and adaptation to sea-level rise for the coastal zone of Germany. J. Coast. Res. 242, 380–393. doi: 10.2112/07A-0011.1
Syvitski, J. P. M., Kettner, A. J., Overeem, I., Hutton, E. W. H., Hannon, M. T., Brakenridge, G. R., et al. (2009). Sinking deltas due to human activities. Nat. Geosci. 2, 681–686. doi: 10.1038/ngeo629
Taramelli, A., Di Matteo, L., Ciavola, P., Guadagnano, F., and Tolomei, C. (2015). Temporal evolution of patterns and processes related to subsidence of the coastal area surrounding the Bevano River mouth (Northern Adriatic) – Italy. Ocean Coast. Manage. 108, 74–88. doi: 10.1016/j.ocecoaman.2014.06.021
Vafeidis, A. T., Nicholls, R. J., McFadden, L., Tol, R. S. J., Hinkel, J., Spencer, T., et al. (2008). A new global coastal database for impact and vulnerability analysis to sea-level rise. J. Coast. Res. 244, 917–924. doi: 10.2112/06-0725.1
Keywords: coastal flooding, impact assessment, sensitivity analysis, scale and resolution, sea-level rise
Citation: Wolff C, Vafeidis AT, Lincke D, Marasmi C and Hinkel J (2016) Effects of Scale and Input Data on Assessing the Future Impacts of Coastal Flooding: An Application of DIVA for the Emilia-Romagna Coast. Front. Mar. Sci. 3:41. doi: 10.3389/fmars.2016.00041
Received: 02 December 2015; Accepted: 15 March 2016;
Published: 05 April 2016.
Edited by:
Ivan David Haigh, University of Southampton, UKCopyright © 2016 Wolff, Vafeidis, Lincke, Marasmi and Hinkel. This is an open-access article distributed under the terms of the Creative Commons Attribution License (CC BY). The use, distribution or reproduction in other forums is permitted, provided the original author(s) or licensor are credited and that the original publication in this journal is cited, in accordance with accepted academic practice. No use, distribution or reproduction is permitted which does not comply with these terms.
*Correspondence: Claudia Wolff, wolff@geographie.uni-kiel.de