A Mitigation Hierarchy Approach for Managing Sea Turtle Captures in Small-Scale Fisheries
 William N. S. Arlidge1,2*
  Dale Squires3
  Joanna Alfaro-Shigueto4,5,6
  Hollie Booth1
  Jeffrey C. Mangel4,5 E. J. Milner-Gulland1
- 1Department of Zoology, Division of Mathematical, Physical and Life Sciences, University of Oxford, Oxford, United Kingdom
- 2Pembroke College, University of Oxford, Oxford, United Kingdom
- 3NOAA Fisheries, Southwest Fisheries Science Center, La Jolla, CA, United States
- 4ProDelphinus, Lima, Peru
- 5Centre for Ecology and Conservation, College of Life and Environmental Sciences, University of Exeter, Penryn Campus, Penryn, Cornwall, United Kingdom
- 6Facultad de Biología Marina, Universidad Científica del Sur, Lima, Peru
The mitigation hierarchy has been proposed as an overarching framework for managing fisheries and reducing marine megafauna bycatch, but requires empirical application to show its practical utility. Focusing on a small-scale fishing community in Peru as a case study system, we test how the mitigation hierarchy can support efforts to reduce captures of sea turtles in gillnets and link these actions to broader goals for biodiversity. We evaluate three management scenarios by drawing on ecological risk assessment (ERA) and qualitative management strategy evaluation to assess trade-offs between biological, economic, and social considerations. The turtle species of management focus include leatherback turtle Dermochelys coriacea, green turtle Chelonia mydas, and olive ridley turtle Lepidochelys olivacea. Adopting a mixed-methods iterative approach to data collection, we undertook a literature review to collate secondary data on the fishery and the species of turtles captured. We then collected primary data to fill the knowledge gaps identified, including establishing the spatial extent of the fishery and calculating turtle capture rates for the fishery. We identified and evaluated the potential risk that the fishery poses to each turtle species within Pacific East regional management units using a qualitative ERA. Finally, we evaluated potential management strategies to reduce turtle captures, incorporating stakeholder preference from questionnaire-based surveys and considering preliminary estimates of trends across a range of performance indicators. We illustrate how the proposed framework can integrate existing knowledge on an issue of marine megafauna captures, and incorporate established decision-making processes to help identify data gaps. This supports a holistic assessment of management strategies toward biodiversity goals standardized across fisheries and scales.
Introduction
Fisheries often seek to achieve “triple-bottom-line” outcomes that entail trade-offs between economic returns, social welfare, and biodiversity conservation (Halpern et al., 2013; Costello et al., 2016). Managing the recovery of depleted populations of marine megafauna species, which are defined as large-bodied, ocean dwellers like sea turtles, seabirds, marine mammals, and sharks, often sits in the middle of this nexus and persists as one of the major challenges in achieving ecologically and socioeconomically sustainable fisheries (Hall et al., 2000; Gray and Kennelly, 2018; Lewison et al., 2018). The complex and dynamic nature of attempting to target catch while minimizing the impact on non-target species means that fisheries management requires integrative processes to identify and mitigate the negative ecological impacts of fisheries while examining economic and social considerations on a fishery-by-fishery basis.
A variety of risk-based decision-making processes to assess the ecological impacts of fishing have been developed—also commonly known as ecological risk assessment (ERA; Lackey, 1994; Hobday et al., 2011). Management strategy evaluation (MSE) is a complementary simulation-based process for assessing trade-offs in potential management strategy performance (Smith, 1993, 1994; Fulton et al., 2014). While these and other structured decision-making processes are vital for fisheries management. There remains a need to further integrate fishery-specific management into national and international goals for biodiversity conservation. For example, those specified by multilateral agreements like the Convention on Biological Diversity (CBD). Since the 1992 adoption of the CBD (United Nations, 1992), the Food and Agriculture Organization (FAO) and regional fisheries management organizations (RFMOs) have made substantial progress in mainstreaming biodiversity conservation into fisheries management processes through frameworks, policies, and practices aimed at promoting more sustainable fishing practices (Friedman et al., 2018). But it is necessary to further support integrated partnerships between fisheries and the wider environmental sector, particularly in low- and middle-income countries, to ensure beneficial biodiversity conservation outcomes across fisheries at scale (Karr et al., 2017).
The mitigation hierarchy is a conceptual framework that can support integrating fisheries management with biodiversity conservation objectives (e.g. a scalable framework for linking actions to reduce sources of anthropogenic mortality over a species life cycle, migratory range, and habitat). In terrestrial and coastal ecosystems, the mitigation hierarchy is widely used as part of the decision-making process of environmental impact assessment (EIA; Council on Environmental Quality [CEQ], 2000) to identify and manage the negative impacts of human economic activities on biodiversity—most commonly applied to infrastructure development projects (e.g. roads, mining sites, wind farms; Bennett et al., 2017; Shumway et al., 2018). If implemented effectively, the framework can help to guide actions toward mitigating the negative impact on biodiversity following a traditionally damaging or extractive activity (Zu Ermgassen et al., 2019). Following widespread application in terrestrial and coastal development projects (Maron et al., 2016; Shumway et al., 2018), the mitigation hierarchy was proposed as an overarching framework for mitigating marine megafauna bycatch in fisheries (Milner-Gulland et al., 2018; Squires et al., 2018), and more broadly, for all human impacts on biodiversity (Arlidge et al., 2018).
A key benefit of the mitigation hierarchy is that it begins by setting a desired end-goal that can support the summation of multiple positive and negative impacts into a net, scalable, outcome (Bull et al., 2019). This goal is conventionally a no net loss or a net gain of biodiversity (Rainey et al., 2015). In a fishery setting, goals such as population recovery when managing protected species, or Maximum Sustainable Yield Biomass (Bmsy) when managing stocks of target catch, are equally feasible (Wolf et al., 2015; Squires and Garcia, 2018). The chosen goal is then measured using a quantitative target and metric(s) with reference to a baseline of biodiversity. Following goal-setting, the framework follows a step-wise decision-making process to identify a suite of measures for mitigating the negative impacts of human activity on biodiversity to achieve the specified goal. The mitigation hierarchy progresses in four sequential stages. The first three—avoid, minimize, and remediate—take place at the impact site (i.e. at sea where fishing is taking place). Then if any residual negative impacts remain, off-site compensatory measures such as biodiversity offsetting can be implemented (Council on Environmental Quality [CEQ], 2000; Bonneuil, 2015). All actions may not be applicable in all management scenarios (e.g. in-kind offsetting actions are not feasible for deep-sea trawl impacts on seamounts; Niner et al., 2018). Rather, the broad steps of the mitigation hierarchy act as a guide, with enough flexibility to achieve the integration of diverse fisheries management approaches toward a unified biodiversity goal that translates across scales (Milner-Gulland et al., 2018; Squires et al., 2018). Yet despite its theoretical attractiveness, there remains a need to empirically evaluate how the mitigation hierarchy can support fisheries management and bycatch mitigation in practice.
Peru’s small-scale fisheries total more than 16,000 fishing vessels, with an estimated 44,161 fishers and 12,398 ship owners (Guevara-Carrasco and Bertrand, 2017). Of these vessels, approximately 4800 fish primarily with gillnets (Estrella and Swartzman, 2010). In Peru, the capture of sea turtles in coastal gillnets is a major conservation issue in the nation’s northern fishing ports and landing sites (Alfaro-Shigueto et al., 2011, 2018). Gillnet fishing also plays an important role in food security, local employment, and social identity throughout Peru’s coastal communities (Christensen et al., 2014). We explore the applicability of the mitigation hierarchy as an overarching framework for managing the population recovery of depleted sea turtle populations, by integrating multiple sources of data, highlighting uncertainties, and supporting management decisions that consider biological, social, and economic conditions in the coastal gillnet fishery. Throughout our investigation, we focus our attention on integrating the established decision-making processes of ERA and MSE with the mitigation hierarchy.
We draw on qualitative ERA (consequence × likelihood) theory to consider risks and associated impacts on multiple turtle species captured in our case study fishery (Fletcher, 2014). We then consider the integration of a qualitative MSE assessment with the mitigation hierarchy to measure the performance of management options aiming to reduce turtle captures and consider how they trade-off against economic and social considerations (Smith et al., 2004; Dichmont and Brown, 2010). The management objectives sought through both ERA, and MSE assessments, are typically fishery or management-region specific (Fulton et al., 2011b; Fletcher, 2014). Objectives typically focus on achieving economic efficiency and ensuring that exploitation is consistent with the principles of ecologically sustainable development, and the exercise of the precautionary principle. The mitigation hierarchy’s goals, by contrast, are often specifically chosen to be translatable between global, management-region, national, and fishery scales. Goals and targets at the fishery level may vary depending on the biodiversity component assessed, as well as data availability and capacity while combining to achieve the overarching goal at higher levels (Milner-Gulland et al., 2018). The mitigation hierarchy framing, therefore, constitutes a shift in approach to objective-setting at an individual fishery level toward the summation of positive and negative impacts into a net, scalable, outcome (Bull et al., 2019). Economic and social management benchmarks could also be set using a mitigation hierarchy framework. An economically focused goal may seek to maximize net economic returns to the community within a fisheries management region, measured by summing fishery-related profits and losses against a predetermined baseline. A social goal may seek to ensure that the community within the fisheries management region is no worse off, or preferably better off, in terms of their well-being as a result of fishery management (Griffiths et al., 2018).
In this study, we explore the potential of the mitigation hierarchy for integrating fisheries management and biodiversity conservation processes, with a focus on achieving population recovery goals for captured sea turtles: a taxon primarily threatened by negative fisheries impacts (Wallace et al., 2010b). The mitigation hierarchy builds on ERA and MSE in two ways: First, it requires a clear definition of management benchmarks (a biodiversity goal and associated targets measured against a baseline of biodiversity) that are generalizable across fisheries and scales (Milner-Gulland et al., 2018). Second, its consideration of a broad suite of purely technical conservation actions and market-based mechanisms for environmental conservation (avoidance, minimization, remediation, offsetting)—rather than the common focus on at-sea minimization and remediation—encourages a more holistic recovery strategy for marine megafauna species that integrates measures to reduce anthropogenic mortality over a species life cycle, migratory range, and habitat into the management process (Dutton and Squires, 2008; Squires et al., 2018). The mitigation hierarchy can also help to identify key uncertainties and knowledge gaps, as well as difficult trade-offs between biodiversity conservation goals, different management strategies, and other socio-economic objectives of fishers and fisheries.
We implemented the mitigation hierarchy in an iterative process; collating existing data to characterize the fishery and the turtle capture problem, identified areas of uncertainty, and gathered primary data to address key knowledge gaps. We then integrated all existing and gathered data under the mitigation hierarchy framework to assess risk, using methods taken from ERA. We explored how potential management measures can be assessed by drawing on qualitative MSE methods. Finally, we discuss the potential for, and limitations of, the proposed mitigation hierarchy framework, with a focus on the need to better integrate diverse fisheries management approaches, impacts, and mitigation actions across scales.
Materials AND METHODS
Study Site
San Jose, Lambayeque, Peru (6°46’ S, 79°58’ W) is a key site for coastal gillnet fishing (Guevara-Carrasco and Bertrand, 2017). Longline, purse seine, trawl, squid jigging, handline fishers, and divers also operate from the community. Among the diverse range of fishing gears, gillnets are the most prevalent. Two distinct gillnet fleets operate from San Jose. First, the “San Jose inshore gillnet fleet” (IG) comprises a class of open-welled vessels with a capacity range from 1–8 t. Second, the “San Jose inshore-midwater gillnet fleet” (IMG) comprises a larger vessel class with small closed bridges ranging in capacity from 5–32 t. We refer to the “San Jose gillnet fishery” when referencing both fleets together. Fishers operating in the San Jose gillnet fishery use both surface driftnet and fixed demersal nets configurations, with some fishers switching between the two on a single trip (Alfaro-Shigueto et al., 2010).
We focus on a single marine megafauna taxon for our assessment of bycatch impacts—sea turtles (superfamily Chelonioidea). Three turtle species are regularly captured in the San Jose gillnet fishery (Alfaro-Shigueto et al., 2007, 2018). The global populations of all seven extant sea turtle species are Threatened under the International Union for Conservation (IUCN)—World Conservation Union’s Red List of Threatened Species (International Union for Conservation of Nature [IUCN], 2010a)—the critically endangered leatherback turtle Dermochelys coriacea, the endangered green turtle Chelonia mydas, and the vulnerable Olive ridley turtle Lepidochelys olivacea.
Peru has a history of sea turtle consumption (Aranda and Chandler, 1989), and turtles are still eaten despite protection under Peruvian law since 1995 (Morales and Vargas, 1996; Alfaro-Shigueto et al., 2018). Thus, we make a distinction between the capture of turtles in fishing gear, the targeted and non-target use of captured turtles, and bycatch (the capture and discard at sea, dead or injured to an extent where death is the result), following the definitions used in Hall (1996).
In Peru, the Peruvian Marine Research Institute IMARPE (Instituto del Mar del Peru) conducts government-managed marine research. The Peruvian Coastguard DICAPI (Dirección de Capitanías y Puertos) undertakes enforcement in most cases. Despite an IMARPE and DICAPI presence in San Jose, Peru’s current regulatory structure does little to help mitigate the capture of marine megafauna species like sea turtles. San Jose’s gillnet fishery operates as an open-access fishery—with no catch restriction [e.g. a total allowable catch (TAC)] in place for target species (Bjørndal and Conrad, 1987). In 2010, the Peruvian government implemented an effort restriction with a ban on new boats above 5 m3 gross registered tonnage (GRT) entering the nation’s small-scale fisheries (Supreme decree N° 018-2010-PE), but limited enforcement of this rule means that vessel builders still operate actively (Estrella, 2007; Christensen et al., 2014).
The fishery is predominantly beyond the reach of RFMOs, and trade measures are limited by the coastal desert environment. In San Jose, many coastal gillnetters work alternate jobs, often throughout the winter when fishing effort and catches are low because of rough weather conditions preventing fishing. Few options exist for alternate revenue streams for fishers in San Jose (e.g. “mototaxi” driver, construction worker, general store clerk). Alternate livelihoods such as these are often tied to the success of local fishing (i.e. more people will use local transport or spend money at local shops when their revenue is high from a good fishing period). With limited regulatory efficacy, not-for-profit organizations play a key role in filling data gaps and implementing conservation interventions in this data-limited, open-access fishery.
Applying the Mitigation Hierarchy
We use the mitigation hierarchy as a conceptual model and framework for structuring data and generating management recommendations toward a standardized biodiversity conservation goal. Milner-Gulland et al. (2018) present two main steps to make the mitigation hierarchy relevant to fisheries management and mitigating marine megafauna bycatch. These are (i) defining the problem (by characterizing the fishery and bycatch issue, and setting the goal, target, metric, and baseline), and (ii) exploring potential management options by systematically stepping through the mitigation hierarchy using a conceptual framing. Booth et al. (2019) explore the potential for the application of the mitigation hierarchy to shark bycatch management. These authors subdivide the two steps in Milner-Gulland et al. (2018) into five. These include (i) defining the problem, (ii) exploring potential management measures using the mitigation hierarchy, (iii) assessing the hypothetical effectiveness of management, (iv) making an overall management recommendation or decision, and (v) implementing, monitoring, and adapting implemented management measures. Here we use the steps proposed in Booth et al. (2019), in combination with data from a real-world fishery, to explore the advantages and disadvantages of the mitigation hierarchy framework. We further develop the framework by exploring its potential for integration with MSE to evaluate trade-offs between management scenarios.
Data Collection and Analysis
We adopted a mixed-methods iterative approach to data collection and analysis, drawing on primary and secondary data sources and multiple analytical methods to understand the fishery problem and explore potential management measures.
Understanding the Problem: The Fishery and Species of Concern
We collated all available information on the San Jose gillnet fishery and each of the turtle species of management concern from published and unpublished sources using a literature review and available datasets. We then collected primary data through field-based surveys to fill several key knowledge gaps.
Secondary Data
We sourced secondary data on turtle capture and bycatch in the IMG fleet from a voluntary at-sea human observer program managed by a local not-for-profit, ProDelphinus. This program has been operating with skippers and crew of IMG vessels along Peru’s coastline since 2007. Observer surveys have been undertaken in the IMG fleet since the program’s inception, but there are no site-specific turtle capture or bycatch per unit effort rates calculated. No observer data exist for the IG fleet, but we can gain insight into the turtle species captured in this fleet from existing data collected through harbor-based surveys of fishers and local government representatives (e.g. Alfaro-Shigueto et al., 2007, 2018).
We also collated relevant information on leatherback, green, and olive ridley turtles with consideration for management in our case study fishing system. We identified potential turtle capture and bycatch reduction strategies based on a literature search, which was later refined using stakeholder consultation (see section “Primary Data”).
Primary Data
To better understand the fishery impacts on sea turtles, we collected primary data to quantify the fishing seasons and geographic extents of the two gillnet fleets. To quantify local fishing seasons, we conducted key informant interviews with a local IMARPE scientist and the presidents of the two at-sea fishing groups in San Jose. To estimate the geographic extent of the gillnet fleets, we used a combination of key informant interviews and focus group discussions (FGDs). We held two FGDs, one for each gillnet fleet. The FGD estimating the IG fleet’s geographic extent had 15 participants, comprising 13 skippers of inshore gillnetting vessels, an IMARPE scientist, and a not-for-profit employee (JAS). The FGD estimating the IMG fleet’s geographic extent had five participants, comprising three gillnet skippers and two not-for-profit employees (JAS & JCM). We used simple random sampling by number generator to select gillnet skippers from lists of 150 actively fishing IG skippers, and 18 actively fishing IMG skippers. We assigned skippers fishing within each fleet to the relevant FGD. For supplementary analysis, we present a summary of demographic data (see Supplementary Material).
We asked respondents to estimate the maximum geographic range that fishing vessels from their fleet traveled from San Jose (north, south, west). Respondents’ maximum geographic extent was then averaged across each group’s participants and displayed using ArcMap (Environmental Systems Research Institute [ESRI], 2018). We gave the respondents the option to input additional information or adjust their estimates. No respondents adjusted their estimates in this final round. We collected all primary data during field surveys in San Jose from 1 July–30 September 2017. This research has Research Ethics Approval (CUREC 1A; Ref No: R52516/RE001 and R52516/RE002).
Assessing Fishery Risks
To better quantify fishery risks, we first analyzed available onboard observer records from the IMG fleet from August 2007 to March 2019. We calculated turtle captures per trip for the IMG fleet and consider the portion of mortalities and captures returned to sea injured or unharmed. We used an analysis of variance and a post hoc Tukey test to compare capture rates between species groupings. All analyses were completed using core packages in R (R Core Team, 2019).
To evaluate the risks for sea turtle populations captured in the San Jose gillnet fishery, we use the consequence–likelihood (probability) matrix methodology that originated from Australian and New Zealand Standard Risk Analysis (Standards Australia, 2000, 2004) for fisheries management (Fletcher et al., 2003; Fletcher, 2005). The methodology is widely implemented (e.g. Fletcher, 2008; Food and Agriculture Organization [FAO], 2012). Iterative updates to the ERA method have followed to ensure compliance with the revised international standards for risk management (International Organization for Standardization [ISO], 2009), and to enable consideration of ecological, economic, social, and governance risks (Fletcher, 2014).
We focused on direct risks posed to turtles captured in our case study fishery (addressing both the IG and IMG fleets) relative to each species distribution and estimated population sizes throughout their respective Pacific East regional management unit (RMU), as developed by Wallace et al. (2010a). RMUs delineate global turtle populations according to regional areas that are distinct from one another based on genetics, distribution, movement, and demography, and provide a practical management unit for assessment analogous to the IUCN—World Conservation Union’s Red List of Threatened Species subpopulation categorizations, but for all extant marine turtle species (Wallace et al., 2010a). RMUs allowed for an evaluation of the relative risk posed from the two San Jose gillnet fleets to each turtle species’ population that is directly affected by fishing activity within our case study system. The analysis assessed how the biology and distribution of each species within the Pacific East RMUs affected susceptibility to the risk from each gillnet fleet, and whether the current management arrangements in place in our case study fishery (i.e. fishing regulations and compliance therewith) were working effectively or not. Consideration was also given to the wider fishing impacts on each species throughout their respective Pacific East RMU distributions (see Supplementary Material). When implementing an ERA in full, a complete evaluation of all risks posed to all target catches, non-target catches, habitat, and social and governance structures across the focus fishery is necessary (Fletcher, 2014).
Critically, risk analysis evaluates the level of risk that a given impact (e.g. incidental capture in gillnets) poses to achieving the goals and targets set over a specified assessment period with the current management measures in place (Fletcher, 2014). We evaluated the risk posed from the IMG and IG fleets against achieving the high-level biodiversity goal of population recovery of leatherback, green, and olive ridley turtle populations (Pacific East RMUs) in the shortest time possible (in line with international biodiversity targets). The mitigation hierarchy framework specifies that goals must be operationalized through quantitative targets, for which metrics and baselines can be defined (Milner-Gulland et al., 2018). The San Jose gillnet fishery does not have management benchmarks in place to meet high-level goals of turtle population recovery. Thus, we propose a fishery-specific target of reducing turtle captures from 2020 levels by 15% every year for 5 years while maintaining total catch weight. As more data become available and population models develop, we recommend a net change in population growth rate target measured against an agreed baseline (Milner-Gulland et al., 2018).
We ranked the risk from each gillnet fleet in terms of a consequence (C) level (specifying a level of impact) the fishing fleet in question is likely to have for each turtle species assessed, using a four-point scale from minor [1] to extreme [4], and the likelihood (L) that a specific consequence level will occur, also using a four-point scale from remote [1] to likely [4] (Table 1). Sources of risk (i.e. the two San Jose gillnet fleets) were then assigned a score for each turtle species, calculated by multiplying the consequence and likelihood values (e.g. consequence level of impact x on turtle species y × the likelihood of consequence x occurring to turtle species y). The risk posed from each gillnet fleet for each turtle species were then assigned one of four levels of impact ranging from minor to extreme (Table 2). If more than one combination of consequence and likelihood was plausible, we chose the combination that generated the highest risk score (i.e. consistent with taking a precautionary approach; Fletcher, 2014).
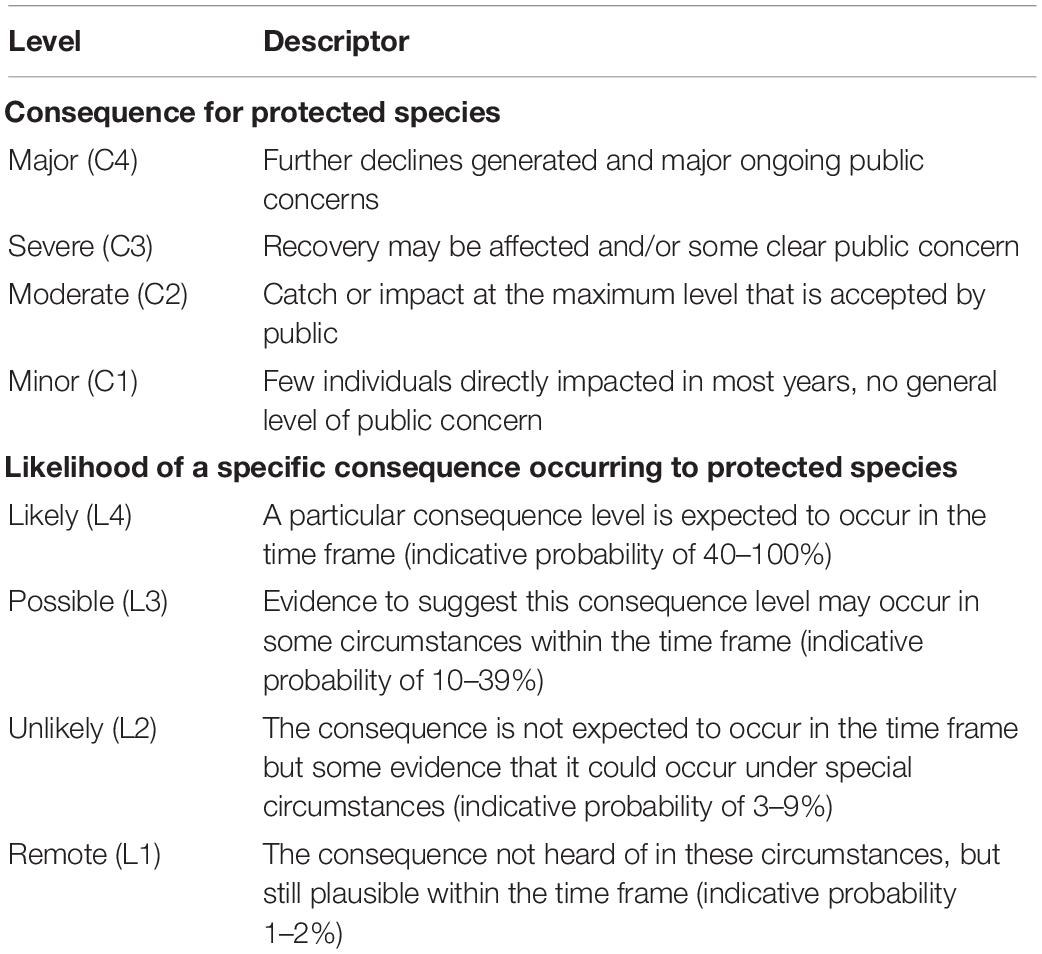
Table 1. Consequence (level of impact) and likelihood (a subjective probability) descriptors used to evaluate identified risks (following Fletcher, 2014).
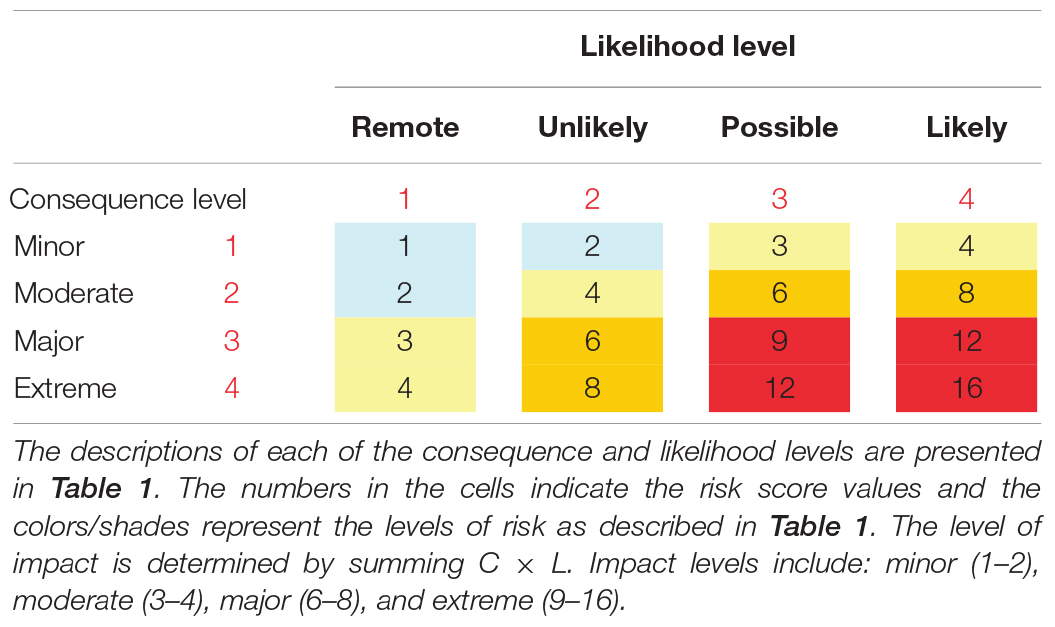
Table 2. Consequence (C) × likelihood (L) risk matrix (following Fletcher, 2014).
Exploring Management Options
Based on the quantified risks, we then used the conceptual framework for bycatch mitigation presented in Milner-Gulland et al. (2018) to consider how additional management strategies could be implemented to reduce the risk of fishing-related mortality for leatherback, green, and olive ridley turtles (Eq. 1):
In Milner-Gulland et al. (2018), the equation relates to a particular bycatch species, in which the unit (ΔλT) is the rate of change in population size as a result of bycatch and its mitigation. f(EB × BPUE) is the effect on the population growth rate of the bycatch-relevant component of fishing effort, broken down into the bycatch-relevant effort, EB, and the bycatch taken per unit of that effort, BPUE, where f() is the effect of this effort on a given species of sea turtle’s population dynamics. A reduction in EB is equivalent to a fishery avoiding bycatch of turtle population x, partially or completely. A reduction in BPUE is the result of the on-site measures encompassed in the “minimize” and “remediate” steps of the mitigation hierarchy. OT is the net effect on the population growth rate of policies aiming to improve the overall viability of turtle population x, representing the “offsetting” of any remaining residual damage caused, using compensatory measures away from where the fishing impact occurs (e.g. nesting site protection). In this data-limited case study, the relationship between BPUE and each turtle’s population growth rate [i.e. f()] is unknown. As such, we do not attempt to solve Eq. 1 for a population growth target. Rather, we use the equation as a conceptual model for evaluating how management strategies can help reduce different components of turtle bycatch risk, and for illustrating where a potential management strategy sits within the wider mitigation hierarchy. The flexibility of the model allows for components of the equation to be further deconstructed in to separate factors. For example, BPUE can represent the sum of individual turtle species x that are dead on arrival to the vessel, individuals captured and dying on the vessel, and individuals dying after live release, as follows:
where BDOA is the bycatch per unit effort that arrives at the boat dead, BOB is the bycatch per unit effort that arrives at the vessel alive, PDV is the proportion dying on the vessel, and PDR is the proportion dying after release. This decomposition can help with identifying different points for management interventions within the fishing process (Milner-Gulland et al., 2018).
To understand the feasibility of different management measures and support the selection of multi-strategy scenarios for the MSE assessment, we interviewed a subset of gillnet skippers operating in San Jose about their personal preferences for potential management options using questionnaires that gathered basic demographic information and incorporated a quantitative five-point Likert-scale assessing strong disagreement to strong agreement with each strategy proposed. We analyzed data in R version 3.6.1 (R Core Team, 2019).
Assessing the Hypothetical Effectiveness of Management Options
To assess trade-offs in potential management strategy performance, we draw on the conceptual integration of the mitigation hierarchy with MSE (Bull and Milner-Gulland, 2019) and demonstrate the implementation of the two processes in a data-limited management scenario. MSE generates simulations within an operational model such as the Atlantis model framework, adapted from the work of Fulton (2001). However, it is possible to qualitatively assess management strategy scenarios against performance indicators (e.g. area fished, catch, BPUE) derived through a process of expert judgment and stakeholder consultation (e.g. Smith et al., 2004; Dichmont and Brown, 2010).
Qualitative MSE assessments can be undertaken in data-limited management scenarios as a preliminary assessment with the intent to undertake a quantitative evaluation of management scenarios during the next iteration of the management project (Dichmont and Fulton, 2017). The evaluation phase implemented in the current study involved a project team (the authors) made up of several subject matter experts (with over 125 years of collective experience in conservation science and fisheries management research, and over 25 years of collective experience working in the case study fishery). The analysis was undertaken through an iterative web-based evaluation process, with participants drawing on their expert opinion and the collated and collected data presented in the current study (see Supplementary Material for further presentation of data used during the assessment).
Based on indicators applied in MSE analyses (Smith et al., 2004), we compiled a list of performance indicators (Table 3) to evaluate management strategy scenarios against the high-level biodiversity goal (i.e. population recovery of the Pacific East RMU population for each turtle species), and the proposed fishery-specific target (i.e. reducing turtle captures from 2020 levels by 15% every year for 5 years while maintaining total catch weight). It is assumed that managers would maintain capture rates at or below the 5 year target level going forward, or update the target at the end of this assessment period as data become available.
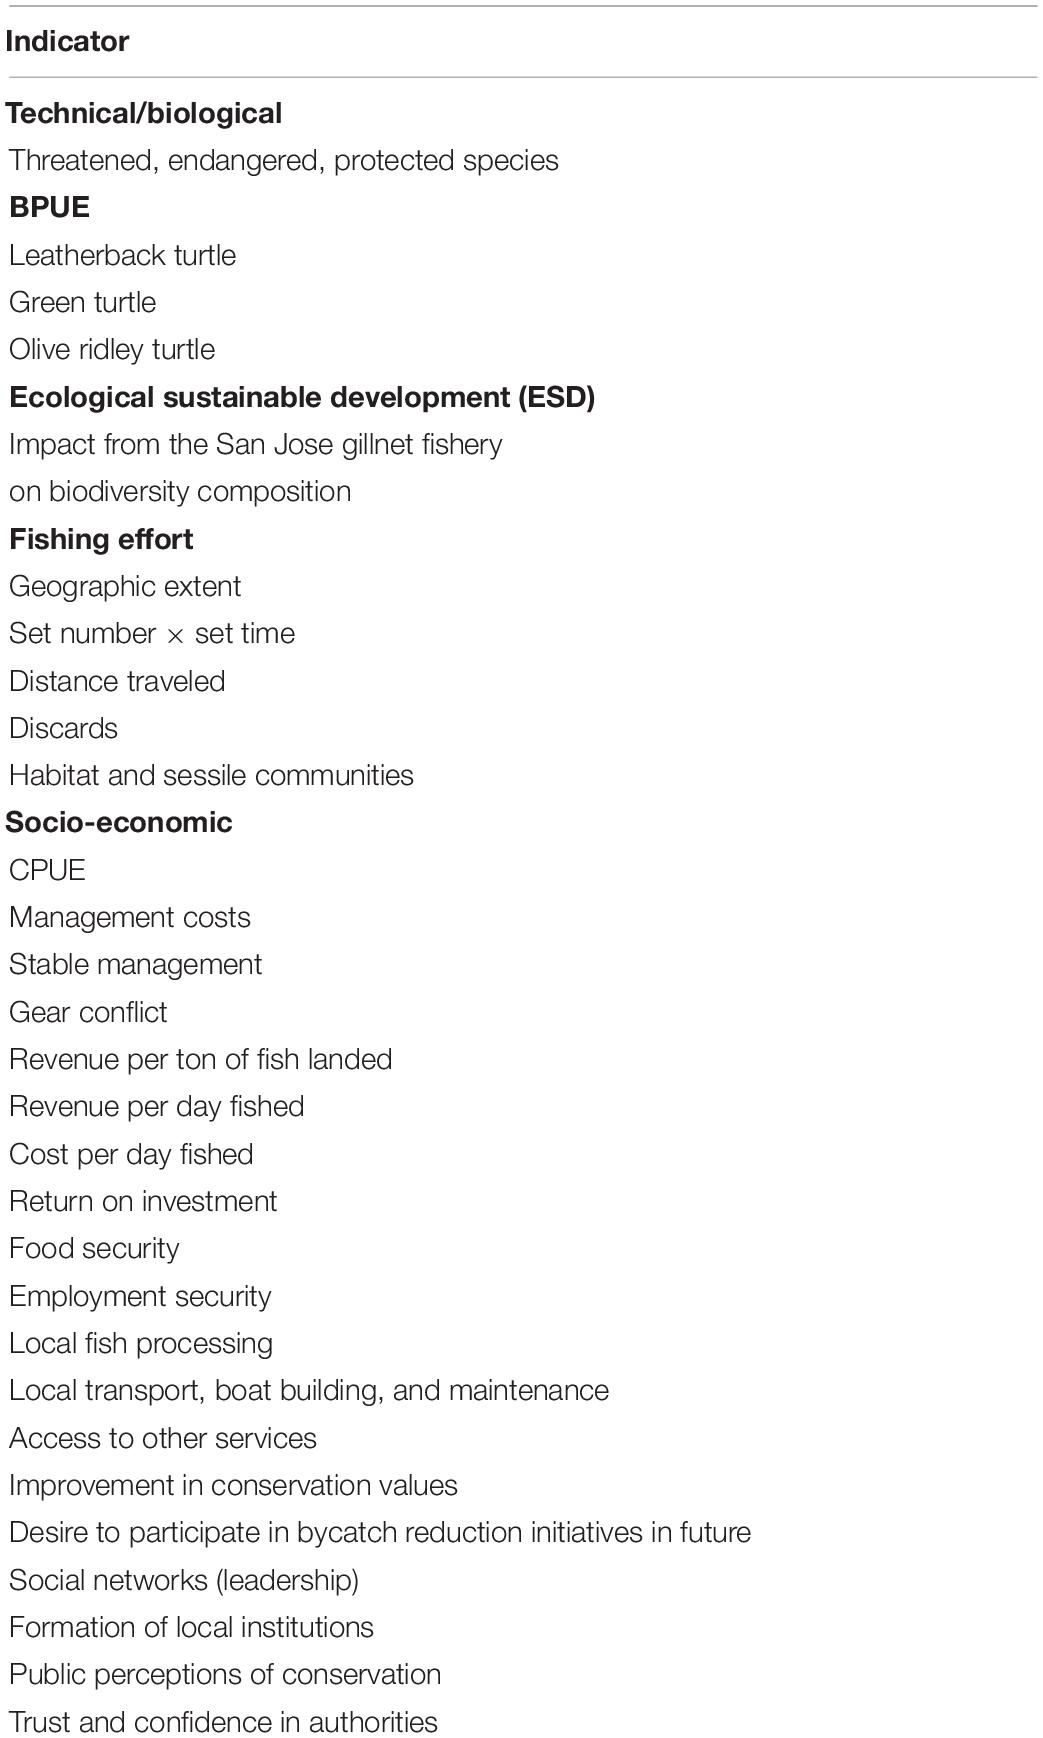
Table 3. Proposed performance indicators for assessing management scenarios against set goals, targets, and baselines for bycaught turtle species in the San Jose gillnet fishery.
The project team evaluated three management scenarios that were subjectively selected based on our fieldwork results, the compiled data, and the output of the ERA. Once we had specified the management scenarios and performance indicators (Table 3), we evaluated the consequence of each scenario by predicting how each performance indicator would change over a 10 year assessment period given the project team’s knowledge and assumptions about the system dynamics of the San Jose gillnet fishery system (Smith et al., 2004). We chose a longer assessment period for the qualitative MSE (10 years) over the ERA (5 years) to reflect a realistic timeframe for implementing potential management strategies. We present predicted trends in performance indicators. We highlight that the current qualitative MSE assessment remains preliminary. When implementing a full MSE (whether this be qualitative or quantitative), potential management scenarios should undergo a broad stakeholder consultation and engagement process during which time, stakeholders representing different sector’s interests can input ideas and submit other management strategy combinations for evaluation (as undertaken in a qualitative MSE process for Australia’s South-east Shark and Scale Fishery; Smith et al., 2004).
Results
The Fishery and Turtle Bycatch Rates
The San Jose gillnet fishery comprises two distinct gillnet fleets that fluctuate in vessel number and effort between the fishing seasons of summer and winter. The main uncertainties identified related to the geographic extent of the two gillnet fleets, fishing seasons length, and seasonal and annual fluctuations in fleet size (Table 4).
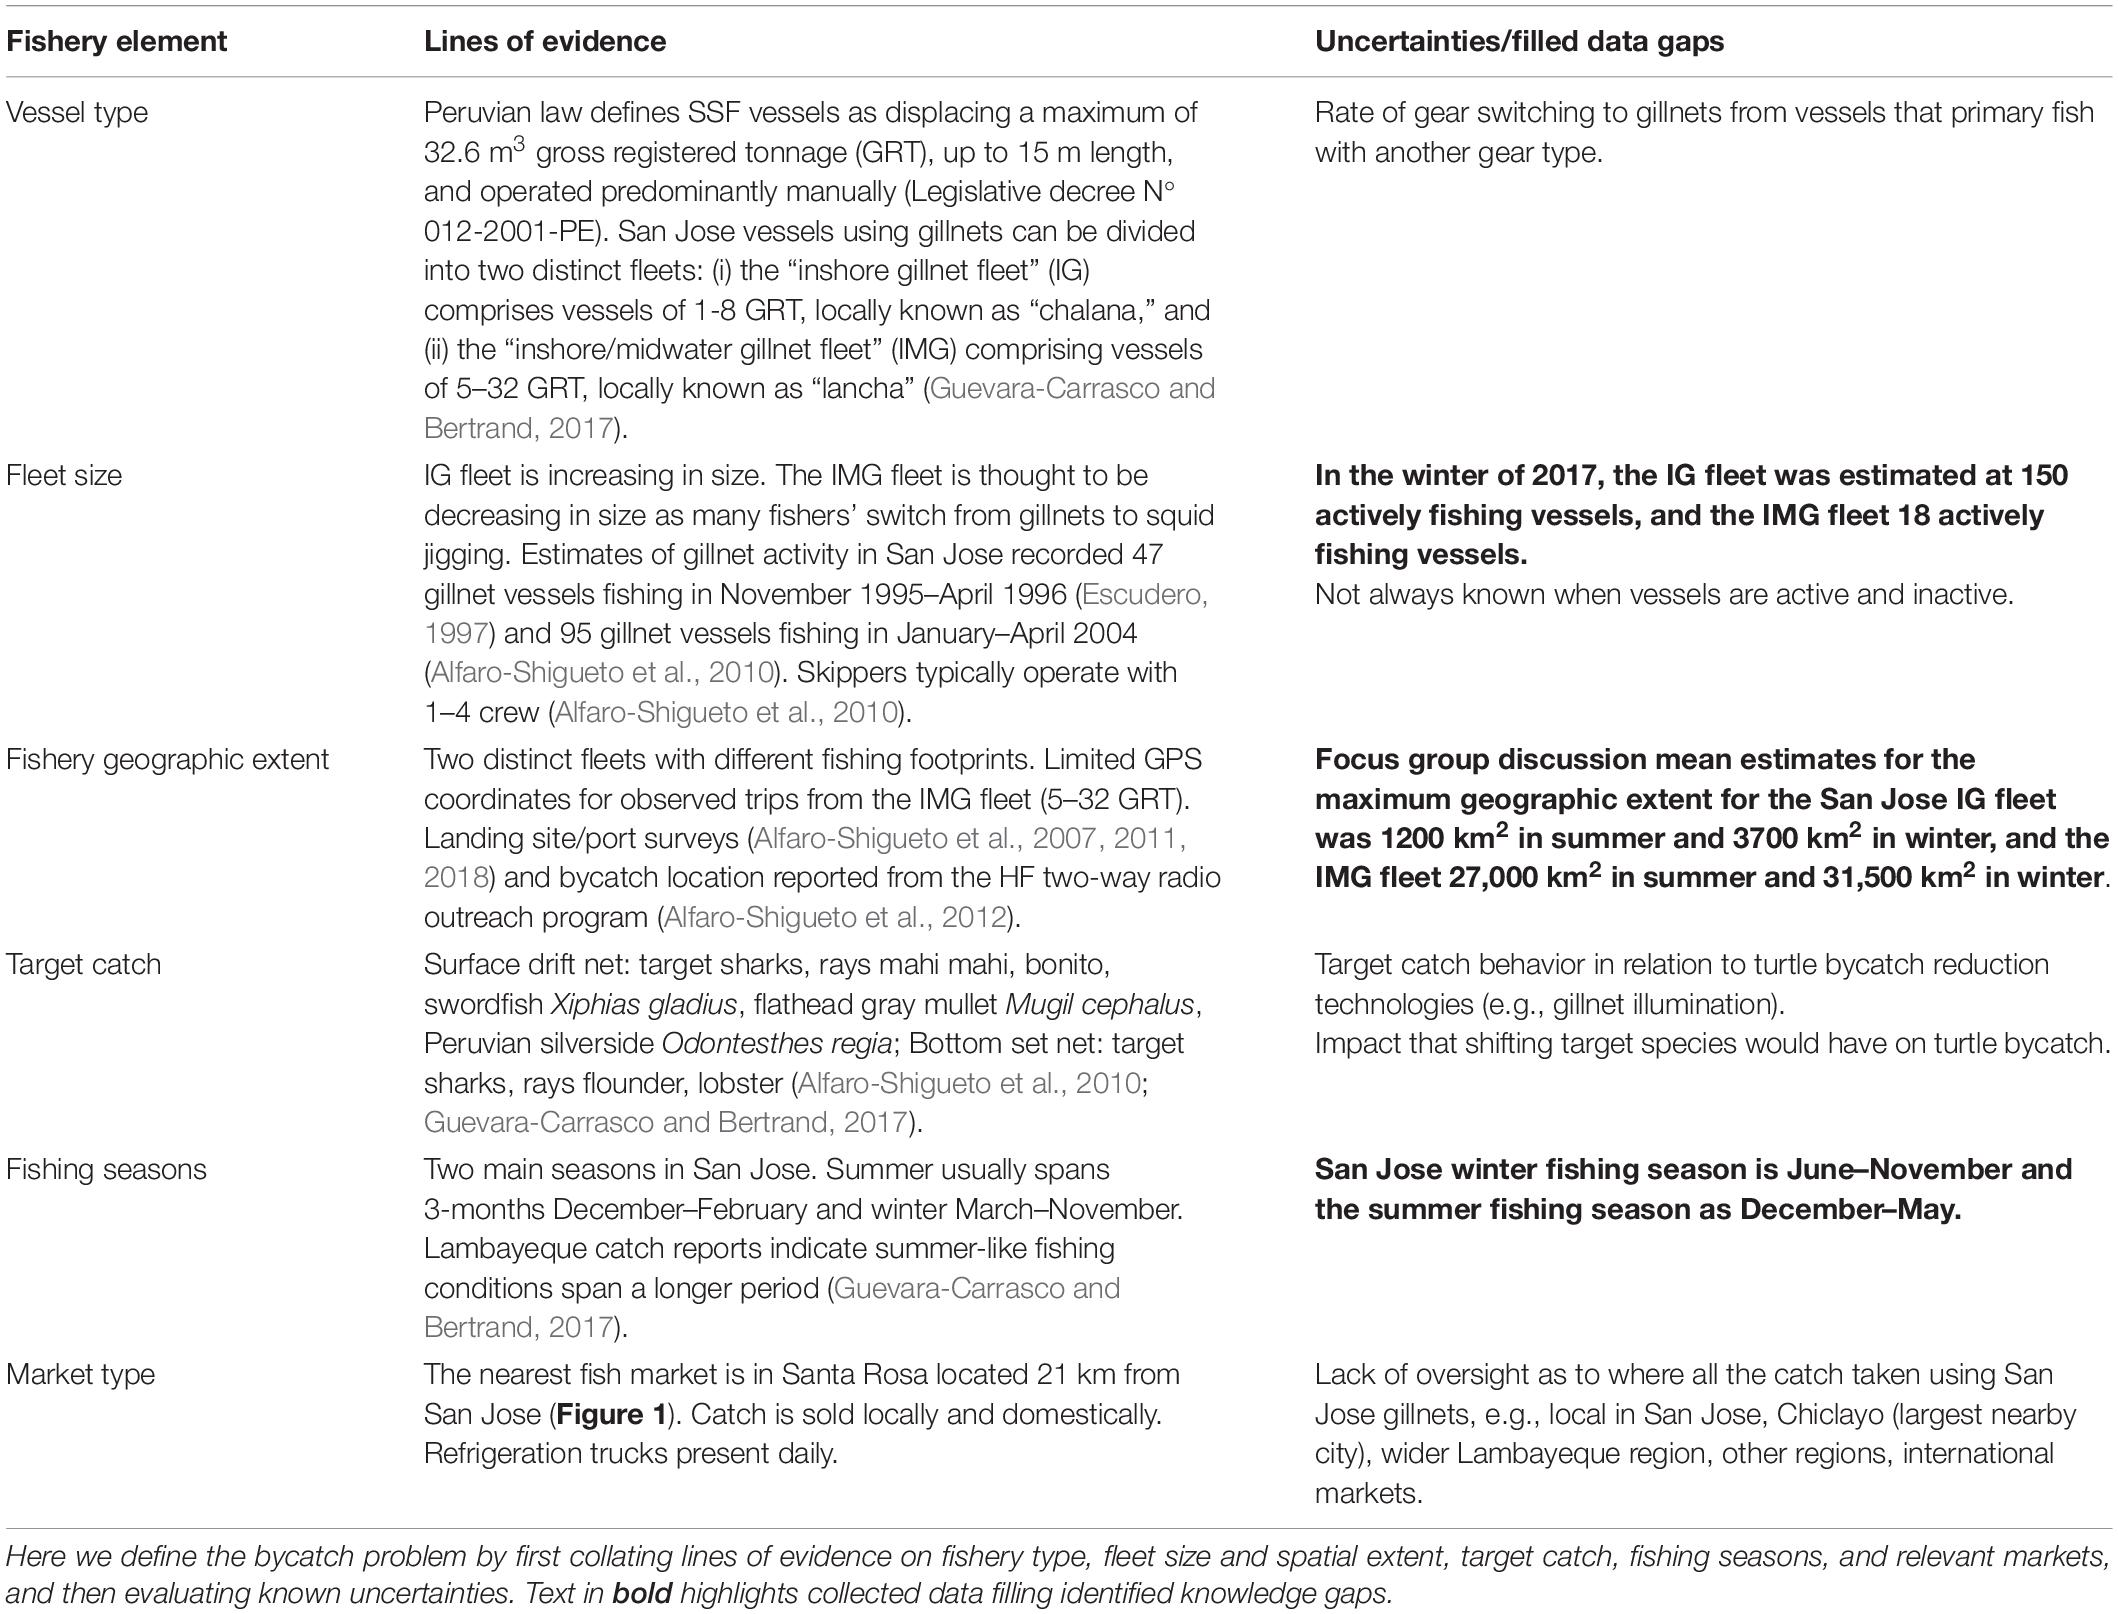
Table 4. Characteristics of the San Jose gillnet fishery, Lambayeque, Peru (6°46′ S, 79°58′ W).
Respondents in the key informant interviews identified two distinct fishing seasons, with fishing effort varying between winter and summer conditions. In the northern regions of Peru, summer is usually December–February (3 months), but the government fisheries scientist noted that summer-like fishing conditions span December–May, with this longer seasonal division supported by the presidents of the two local at-sea fishing groups, and by capture reports from the Lambayeque region (Guevara-Carrasco and Bertrand, 2017). FGDs estimated the maximum geographic extent for two fleets comprising the San Jose gillnet fishery across the defined seasonal breaks (Table 4). We then overlaid observed sea turtle captures and fishing effort data from the IMG fleet to corroborate respondents’ estimates of this fleet’s geographic extent (Figure 1).
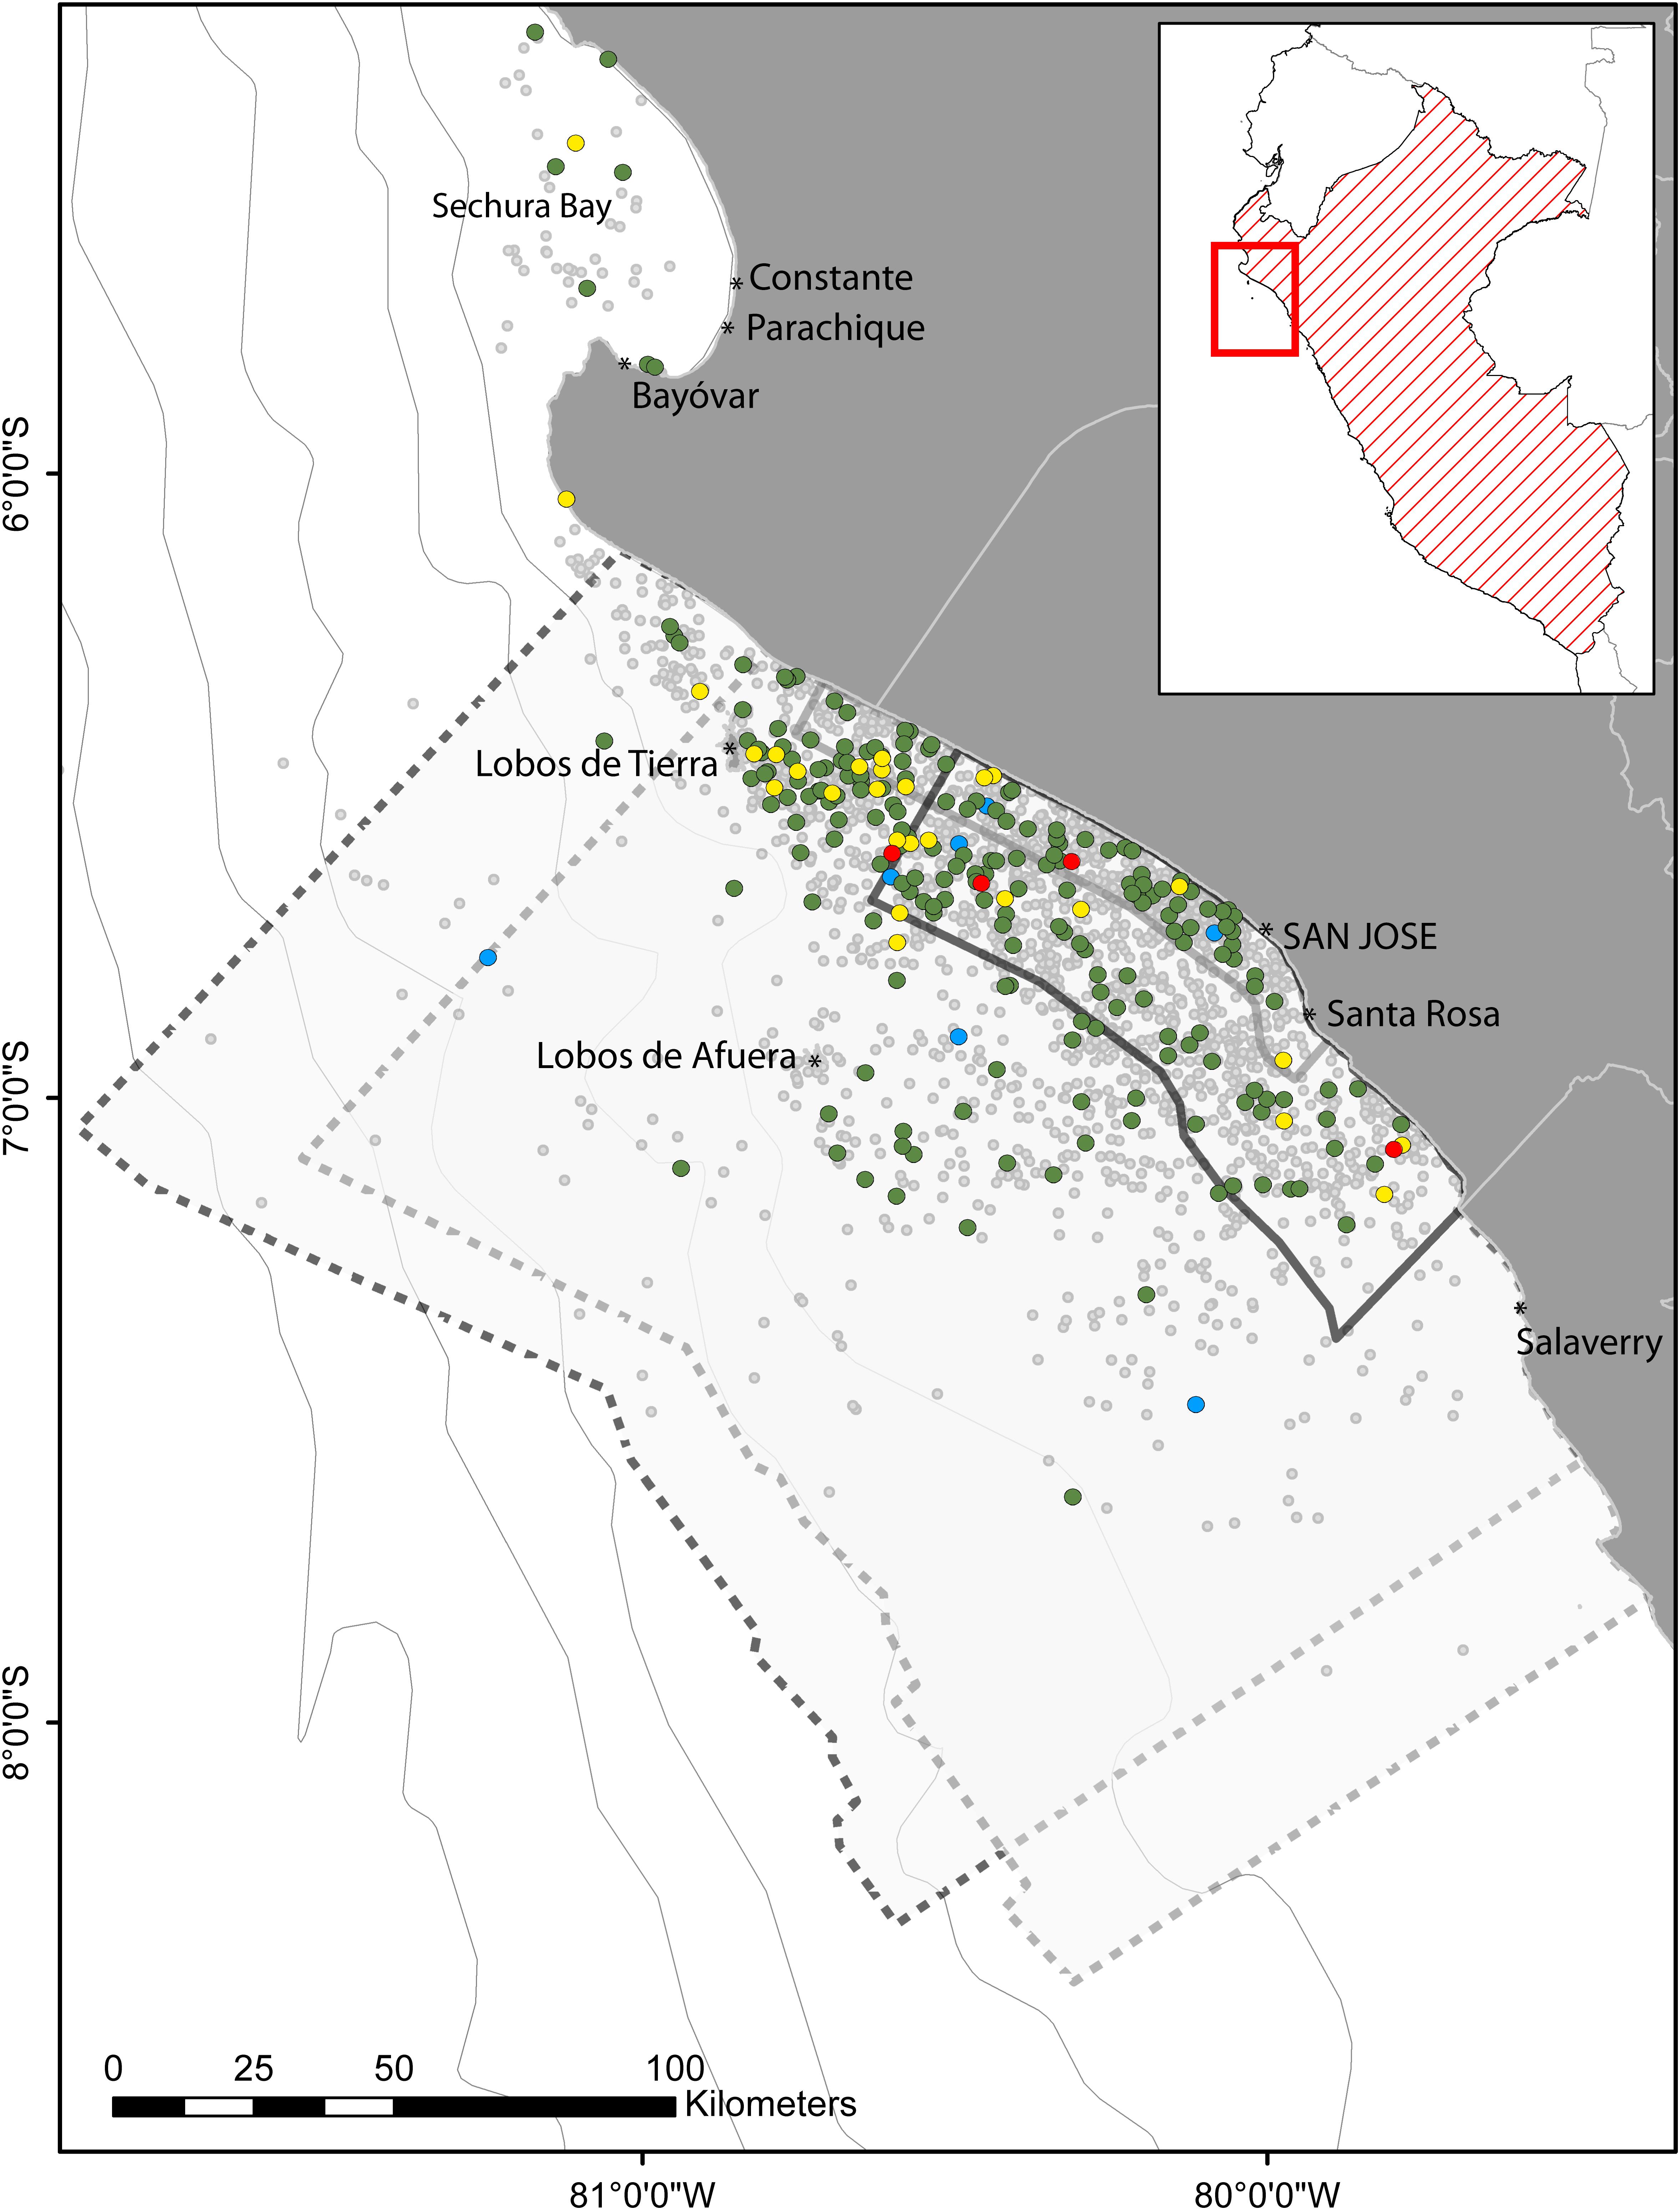
Figure 1. Estimated summer (December–March) and winter (June–November) geographic extent for the San Jose inshore-midwater gillnet (IMG) fleet, and the San Jose inshore gillnet (IG) fleet (dark gray dashed line = IMG winter, light gray dashed line = IMG summer, dark gray line = IG winter, light gray line = IG summer). The fleets’ geographic extents are overlaid by a distribution of sea turtle bycatch by species (green circles = green turtles, blue circles = leatherback turtles, yellow circles = olive ridley turtles, red circles = unidentified hardshell turtle species) relative to observed fishing effort for the San Jose IMG fleet from August 2007 to March 2019 (small gray circles). No turtle bycatch data from the inshore gillnet fleet have been recorded. Fishing areas were elicited from San Jose gillnet skippers during focus group discussions. Distances are the maximum (group mean) distance skippers estimated any skipper fishes from San Jose (north, south, west). Captures and fishing effort north of Bayóvar show trips that either left or landed from San Jose but began or concluded at the Bayóvar port.
Two shore-based surveys recorded turtle captures in San Jose (Alfaro-Shigueto et al., 2007, 2018; Table 5). From July 2000 to November 2003, a combination of shore-based- and at-sea observer surveys recorded nine leatherback turtle captures in San Jose (across gillnet and longline gear types; Alfaro-Shigueto et al., 2007). Turtle capture and bycatch rates were available for the towns of Constante, Salaverry, and Ilo (Alfaro-Shigueto et al., 2011). In Salaverry and Constante, most turtle captures in gillnets were green turtles (Alfaro-Shigueto et al., 2011; Figure 1). Turtle bycatch reports from Salaverry found leatherback turtles captured close to the coast, indicating a potential coastal foraging “hot spot”; if captured, consumption rates were high (Alfaro-Shigueto et al., 2007, 2018).
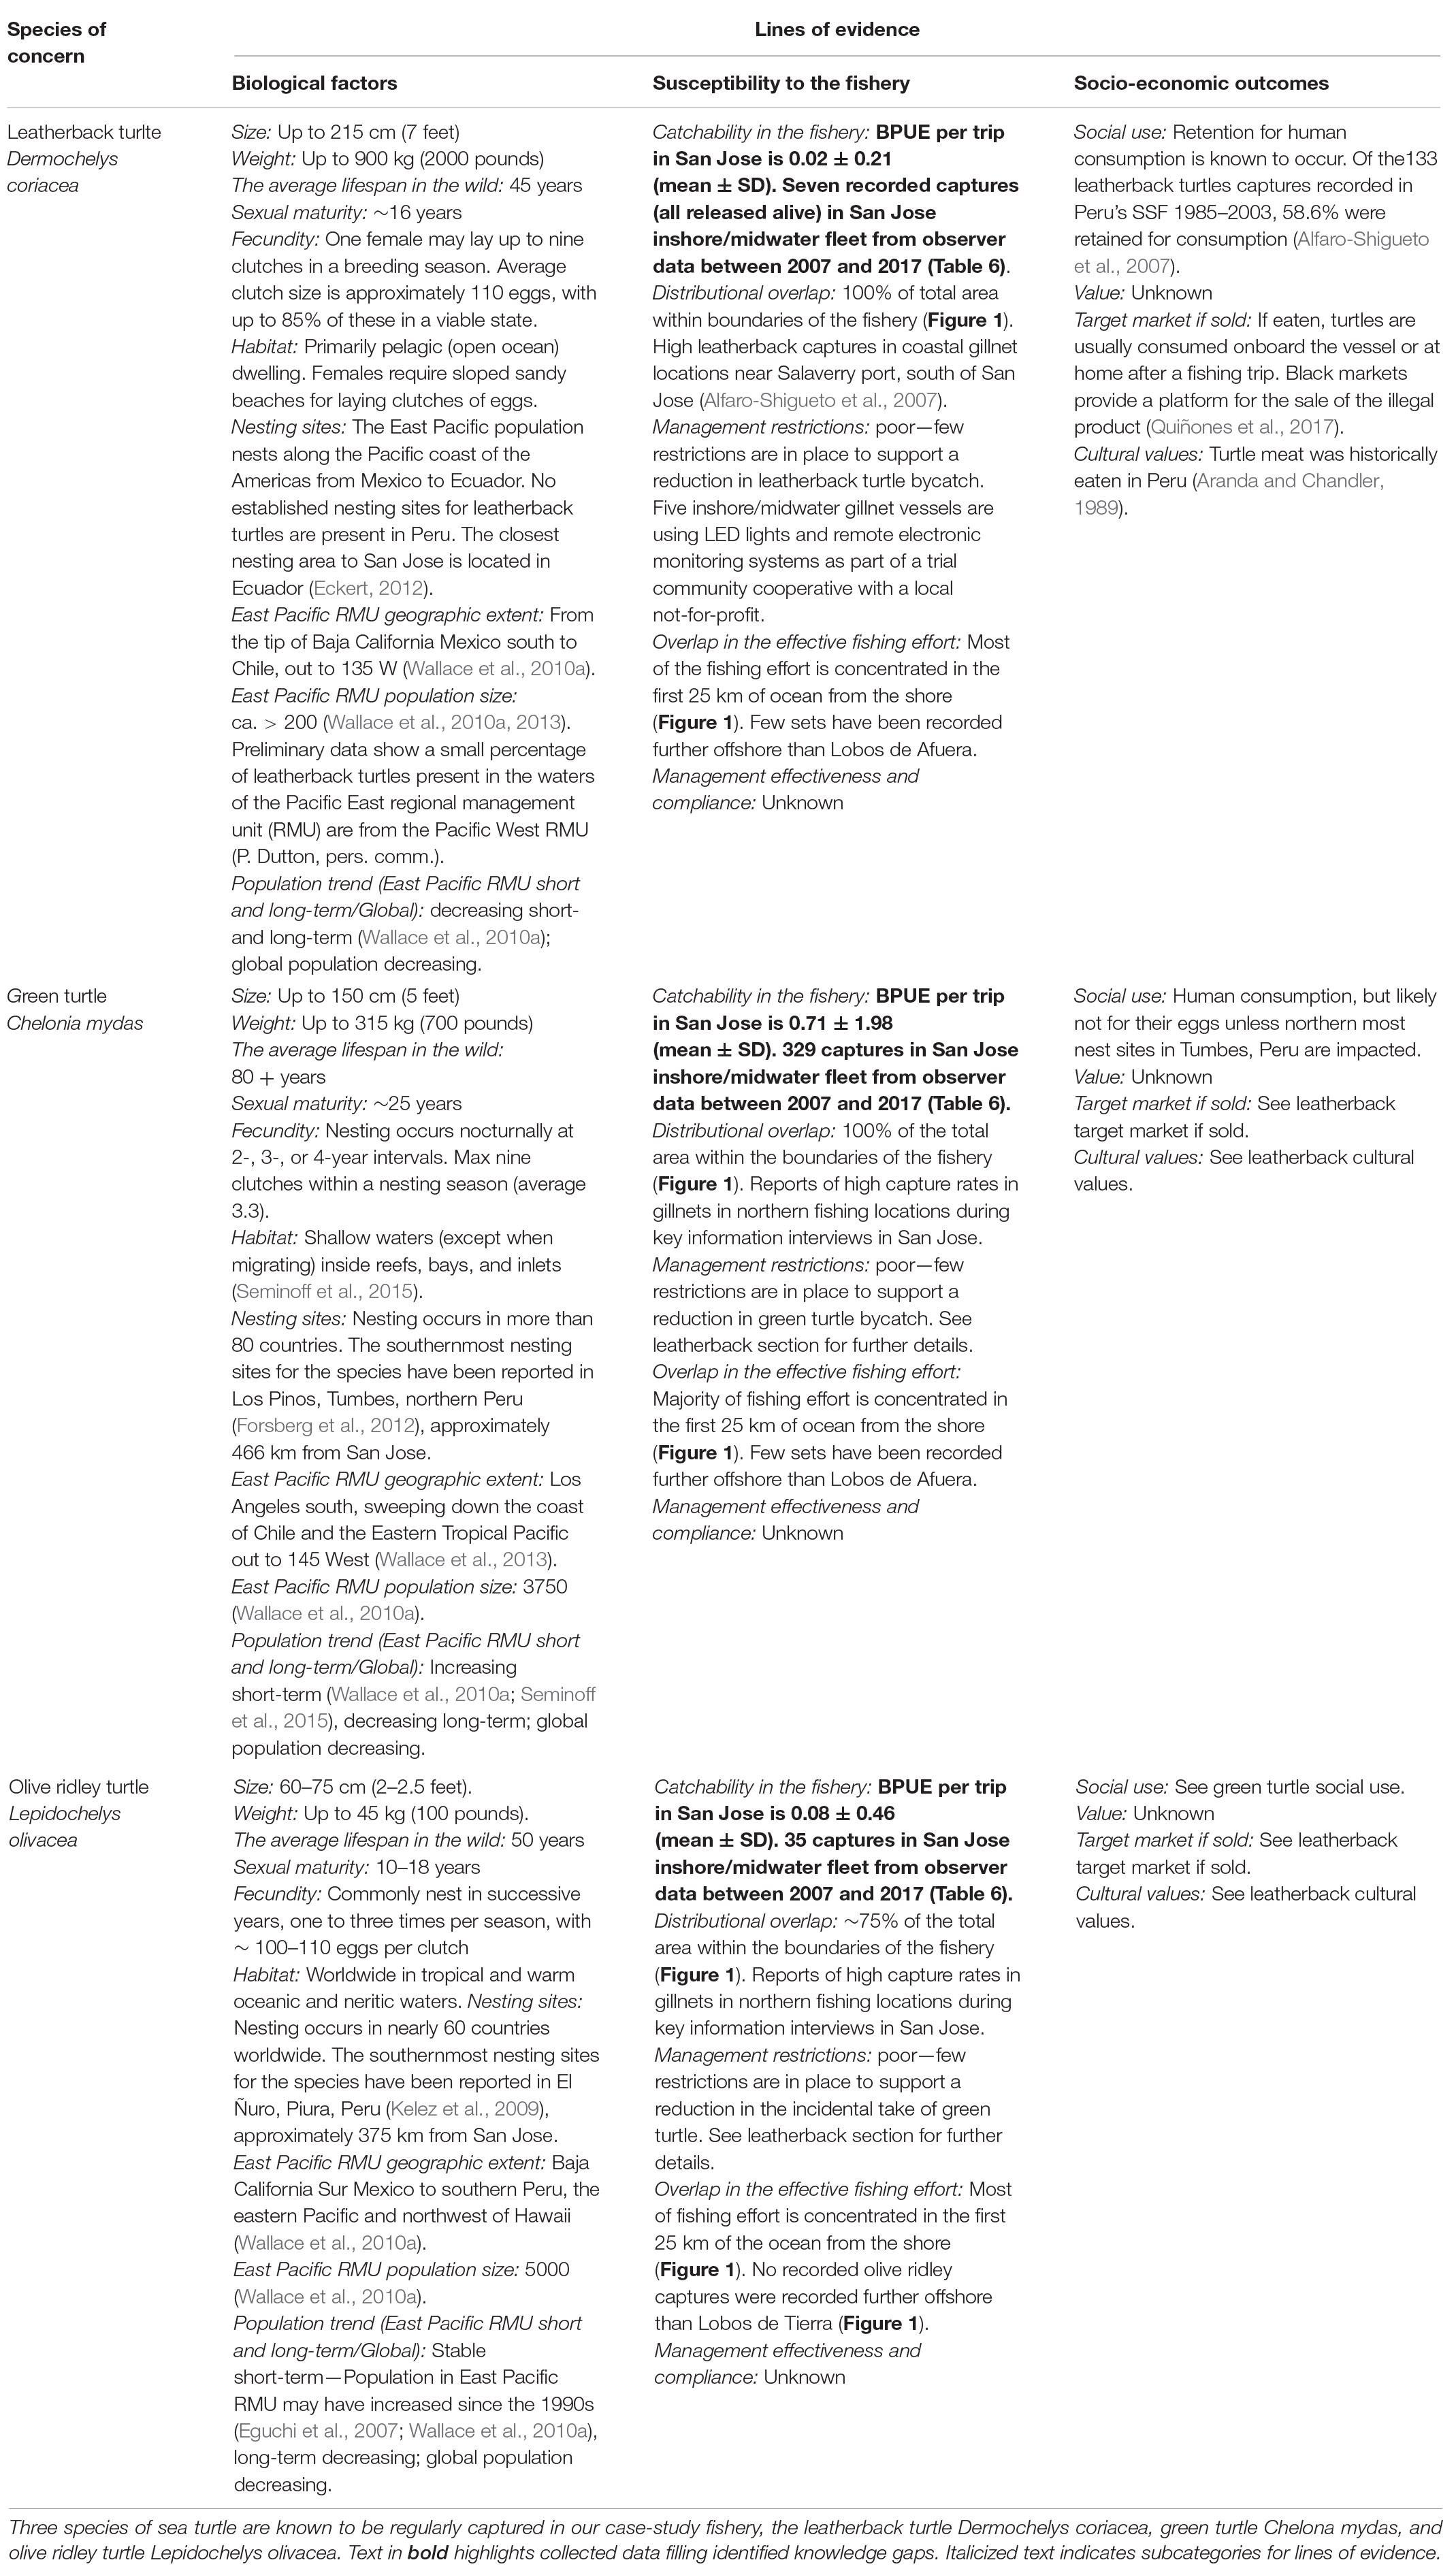
Table 5. Summary table of the information used to complete the risk assessment for turtle species captured in the San Jose gillnet fishery.
There were 461 fishing trips observed from San Jose, of which observers recorded the capture of 379 turtles in gillnets. Observer coverage for the IMG fleet is low at ∼1–4% fleet coverage spanning 11 years and 7 months. Species proportions were 86.8% green (n = 329), 9.2% olive ridley (n = 35), 1.8% leatherback (n = 7), and 2.1% unidentified hardshell turtle species (n = 8; Figure 1). Turtles released alive without visible injury made up 62% of the 379 captures. Live releases with injuries made up 28%. Mortalities 8% of captures (see Supplementary Material). Capture per unit effort across trips (n = 461) was significantly different between species [one-way analysis of variance; F(2,1380) = 49.73, p < 0.001]. Green and olive ridley turtle capture rates per trip differed significantly (p < 0.05; Tukey post hoc tests), but leatherback and olive ridley turtle capture rates were not significantly different at the trip level (Table 6).
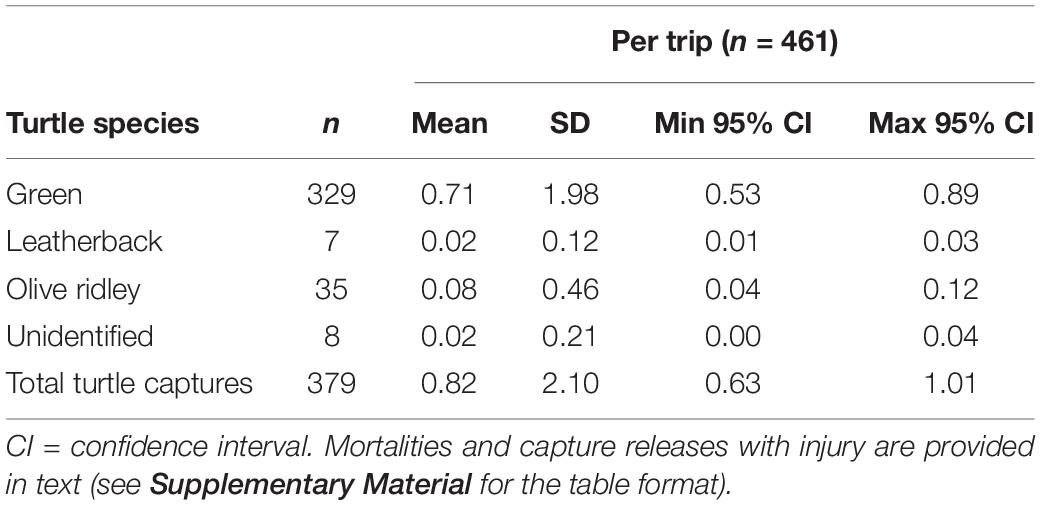
Table 6. Observed sea turtle captures per trip in the San Jose inshore-midwater gillnet fleet from August 2007–May 2019.
Risk Assessment
Inshore-Midwater Gillnet Fleet
We ranked the leatherback and green turtle RMU (Pacific East) populations as subject to an extreme risk from the San Jose IMG fleet over the next five years, and the olive ridley turtle RMU (Pacific East) as subject to a major risk given the current management measures in place (Table 7). No catch restrictions or effort limits exist, but five of the estimated 18–28 vessels comprising the IMG fleet (Table 4) were using light-emitting diodes (LEDs) on their nets—a form of at-sea minimization. This equates to illuminated nets on 27% of IMG vessels in winter and 18% of vessels in summer. In Sechura Bay, located approximately 150 km north of San Jose (Figure 1), controlled gear trials were implemented testing the turtle mitigating potential of LEDs on gillnets. The study found LEDs reduced green turtle bycatch by 64.7% with no reduction in target catch (Ortiz et al., 2016). While no fishery- or region-specific data on the effect that LEDs have on leatherback and olive ridley captures exist, anatomical, physiological, and behavioral studies show leatherback turtles also have a sensitivity to ultraviolet (UV) wavelengths (Wang et al., 2013; Wyneken et al., 2013). Over the assessment period, we assumed a 64.7% reduction in captures for each of the turtle species captured, across 27% of the IMG fleet in winter and 18% in summer. Workshops training fishers on safe handling and release of captured turtles are conducted in San Jose by the not-for-profit ProDelphinus. We estimated a small increase in post-capture survival rates of turtles based on known sea turtle survival rates following capture in gillnets (Epperly et al., 2004; Snoddy and Williard, 2010).
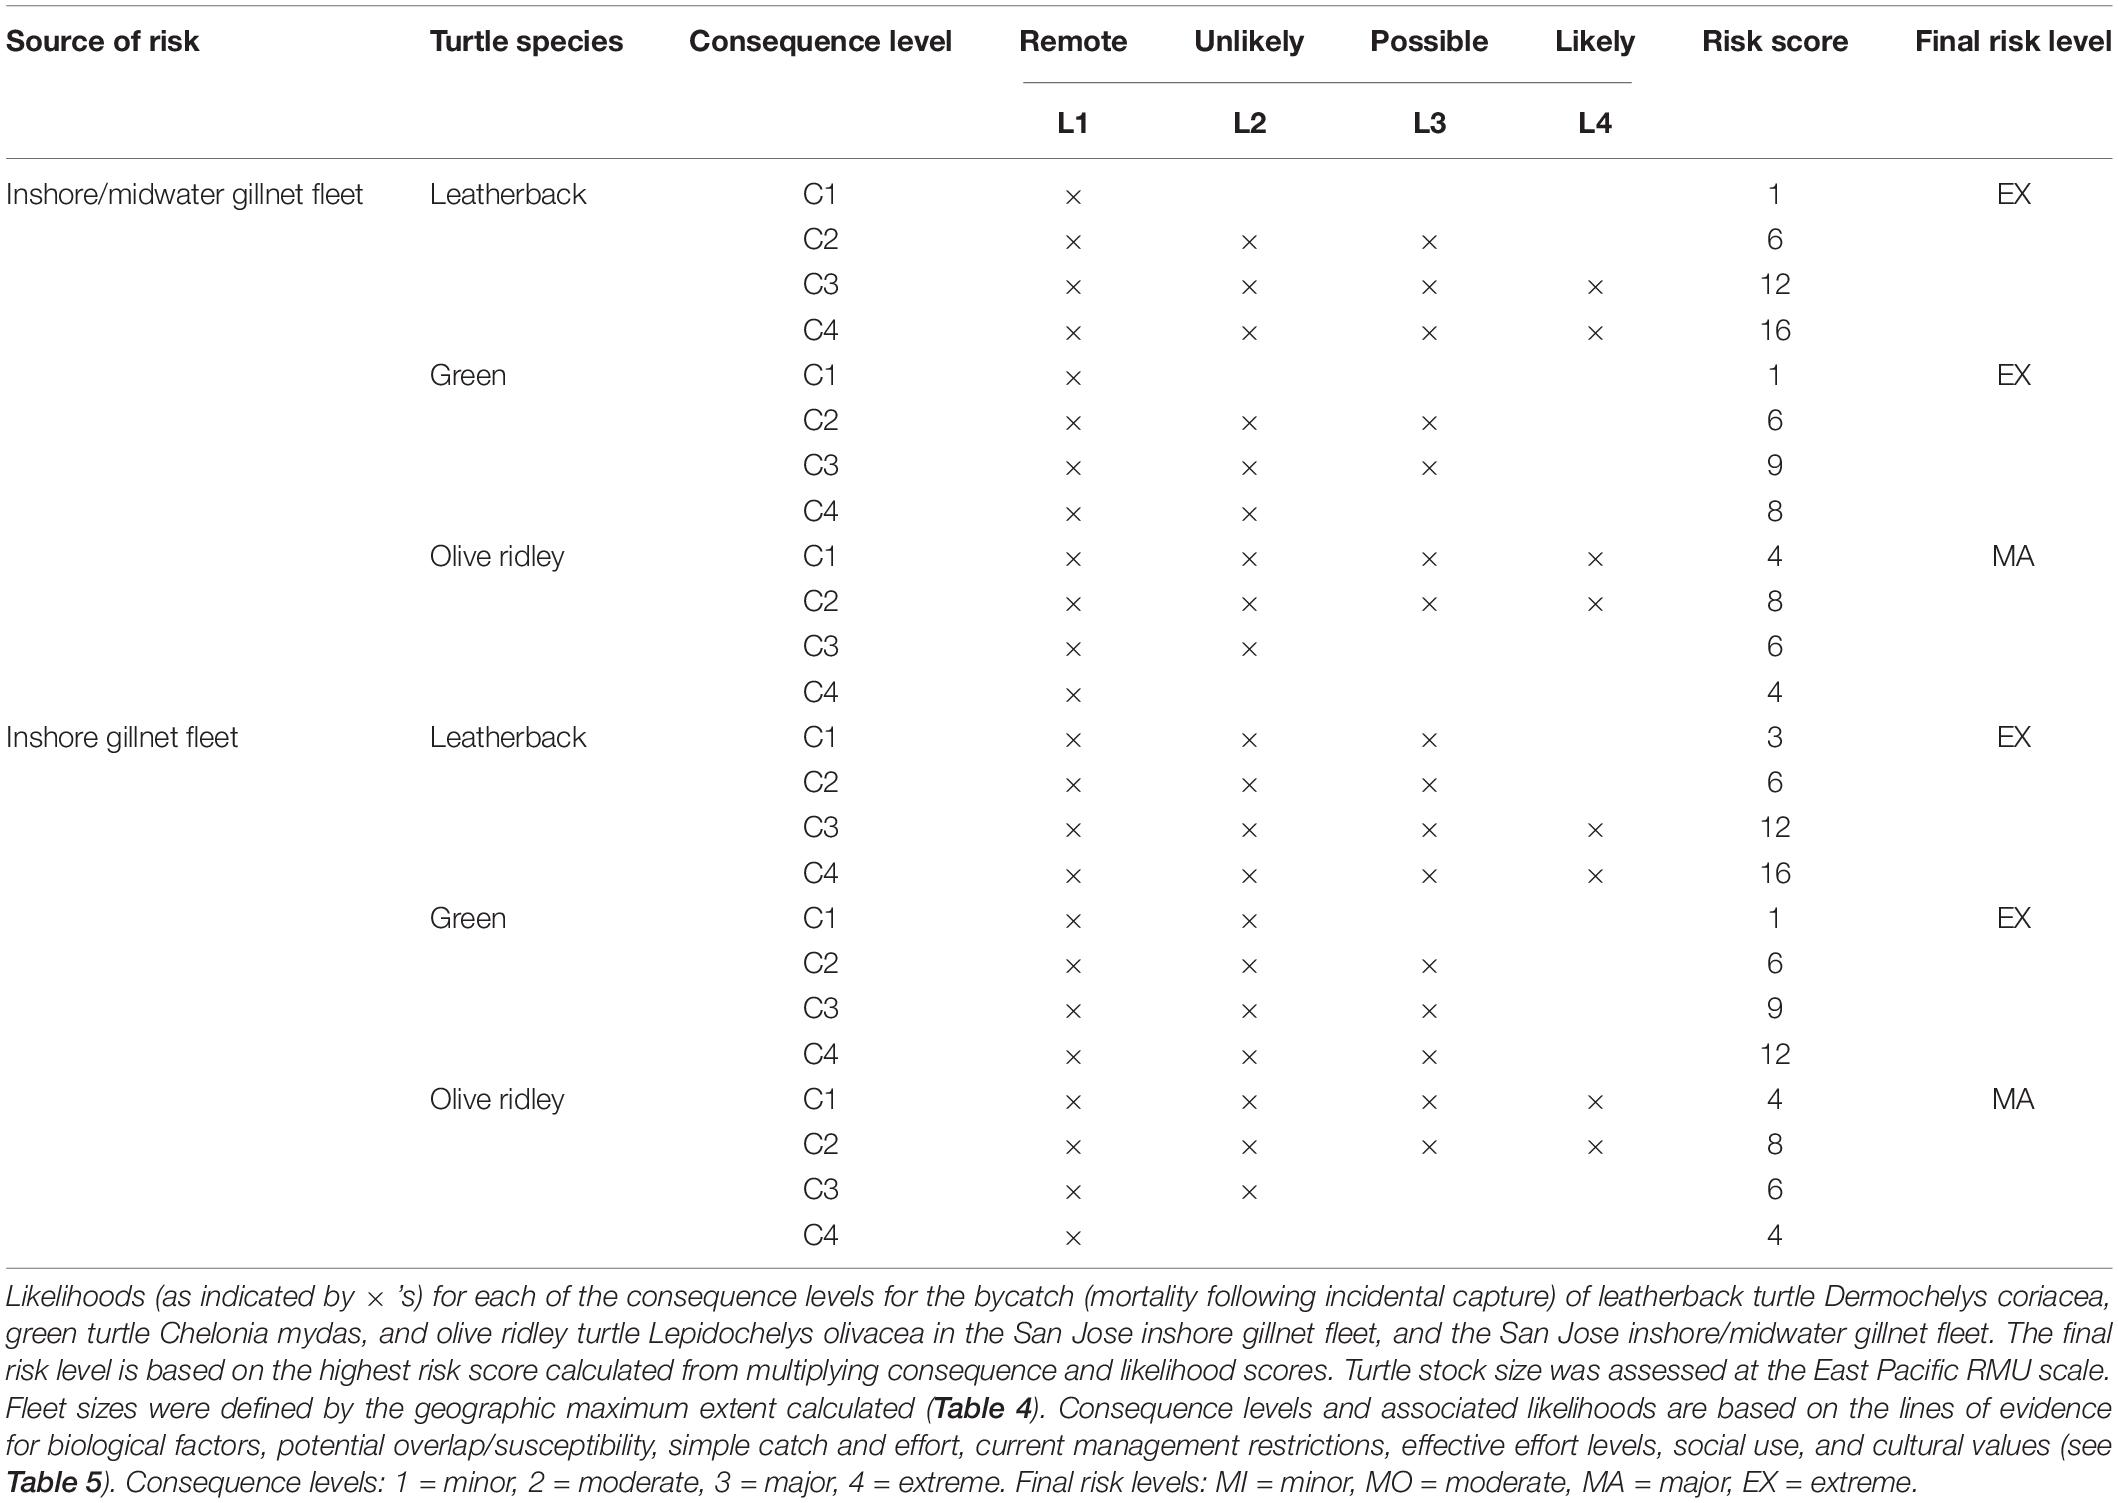
Table 7. Results of the consequence × likelihood qualitative ecological risk assessment.
The IMG fleet concentrates fishing effort nearshore between Lobos de Tierra in the north, Salaverry in the South, and west to Lobos de Afuera (Figure 1)–this shows fishing effort occurs in areas where each turtle species has a known presence. The fleet covers less than 5% of each turtle species’ Pacific East RMU distribution. Using the lines of evidence (Tables 4, 5), all four levels of consequence (i.e. some level of turtle bycatch) were plausible for each turtle species, but with different levels of likelihoods (Table 7).
The olive ridley turtle is the most abundant sea turtle in the world (Wyneken et al., 2013). The Pacific East RMU population numbers approximately 1,500,000 individuals (Eguchi et al., 2007; Wallace et al., 2010a). The population has an increasing trend in the short term but a predicted decreasing trend in the long term (Wallace et al., 2010a). The olive ridley turtle species exhibit both solitary and “arribada” nesting; the latter is a behavior unique to the Lepidochelys genus where large groups of females nest synchronously at a nesting site (Richard and Hughes, 1972; Wyneken et al., 2013). The observer data did not record any olive ridley captures further offshore than Lobos de Tierra indicating the potential for a more inshore distribution within the San Jose gillnet fishery’s geographic extent (Figure 1). Vessels number 18–28 (Table 4) and fishing trips average 7.5 days (see Supplementary Material). Drawing on the lines of evidence of fishing effort, and a capture per trip rate of 0.08 (of which mortality rates were 21%, and capture release with injury rates were 25%), the annual mortality rates of olive ridley turtles in the IMG fleet are likely in the tens rather than the hundreds. This pattern highlights a “moderate” consequence (C2) signifying the bycatch impact from the IMG fleet is at a maximum level of acceptability, is “likely” (L4) to occur during the assessed period (Table 7). The evidence does not suggest that a “severe” (C3) consequence level of impact “may occur” (L3) or is “expected” (L4).
The green turtle RMU (Pacific East) population has been estimated at 3750 individuals (Wallace et al., 2010a). The population trend is projected upward in the short-term, but downward in the long-term (Wallace et al., 2010a). We found green turtle presence was likely throughout the fleet’s geographic extent (Figure 1). Green turtle capture rates are high at 0.71 per trip (Table 6). The observed mortality rate of green turtle bycatch was 7% and captures released with injury 30% (see Supplementary Material). These data show bycatch mortality rates of green turtles may have been occurring in the tens of turtles, to low hundreds of turtles per annum in the IMG fleet (Alfaro-Shigueto et al., 2010, 2018). These patterns imply that negative fishing impact from the IMG fleet will occur to more than a few individuals in most years over the assessed period (C1). The likelihood of this consequence occurring was ranked as “remote” (L1). The capture and inferred bycatch rates could be consistent with capture or impact occurring at the maximum acceptable level (C2), or that recovery “may be affected”/“further declines are generated” (C3 or C4). The estimated short-term rising trend in the Pacific East RMU population of green turtles (Wallace et al., 2010a) in combination with existing IMG fleet management measures to mitigate turtle bycatch imply that further declines to the RMU population from this fleet (C4) were not “likely” (L4) or “possible” (L3) but “unlikely” (L2) over the assessment period. We assigned this consequence of impact an indicative probability of 3–9%. Both the consequence levels of “stock recovery impact” (C3) and the “maximum level of acceptable bycatch occurring” (C2), were “possible” (L3) as further data were not available to reduce uncertainty.
Leatherback turtle capture rates were the lowest of the turtle species assessed at 0.02 per trip (Table 6), but this BPUE could still equate to >10 leatherback turtle captures per annum. The observed mortality rate of leatherback turtle bycatches was 14% (1/7). The remaining six captures were released alive without injury (see Supplementary Material). Leatherback turtle presence was considered “possible” through the IMG geographic extent (Figure 1). The leatherback turtle’s Pacific East RMU population (ca. > 200) has an estimated decreasing mean growth rate of -0.156 (Mazaris et al., 2017). These data suggest that even a low amount of fishing-related mortality from the IMG fleet (i.e. only a few individuals per year) could “likely” (L4) result in further population declines (C4) and increase the chances of extinction of the Pacific East RMU population of leatherback turtles (Spotila et al., 2000).
Inshore Gillnet Fleet
We ranked the recovery of the leatherback, and green turtle, East Pacific RMU populations, as subject to “extreme” risk from the San Jose inshore gillnet fleet, and the olive ridley turtle East Pacific RMU as subject to “major” risk given the current management measures in place (Table 7). The IG fleet covers an area of 1200 km2 in summer and 3700 km2 in winter (Table 5). The geographic extent of the IG fleet is considerably smaller than the IMG fleet (Figure 1), but vessel numbers are higher. During our 2017 winter field season, we recorded 150 inshore gillnet vessels fishing in San Jose—this represents a tripling in fleet size since 1996 (Escudero, 1997). Unlike the IMG fleet, no fishery observer data for turtle captures exist for the IG fleet. This increased uncertainty when estimating the likelihood of consequences (Fletcher, 2014).
A significant overlap between the IMG and IG fleets exists (Figure 1). Captures of leatherback, green, and olive ridley turtles in the IMG fleet have been recorded within the geographic bounds of the IG fleet (Figure 1). These data show that turtle capture in the IG fleet is also probable. However, with only these data, the captures of sea turtles in the IG fleet remain unknown. Further insight can be gained from shore-based surveys investigating sea turtle bycatch in coastal fisheries across Ecuador, Peru, and Chile between August 2010 and March 2011 (Alfaro-Shigueto et al., 2018). San Jose, Lambayeque, Peru, was a survey site. In San Jose, 44 respondents, across both the IMG and IG fleets, acknowledged turtle bycatch in their gillnets. Of these 44 respondents, 43.2% reported green turtle bycatch, 25% leatherback turtle bycatch, and 20.5% olive ridley turtle bycatch (Alfaro-Shigueto et al., 2018). This pattern of data suggests that all the levels of consequence are “possible” for green, leatherback, and olive ridley turtle species (Table 1). While the geographic extent of the fishing fleet is small compared to each species wider East Pacific RMU distribution, the high vessel number, inshore distribution of the turtle species overlapping with the IG fleet’s geographic extent (Figure 1), and high uncertainty resulted in “possible” (L3) and “likely” (L4) likelihoods for most of the consequence rankings (Table 7).
A final risk level of extreme or major is unacceptable unless further management actions are undertaken (Fletcher, 2014). This assessment highlights the need for further management actions in the San Jose gillnet fishery if the proposed target of reducing turtle captures by 15% every year for five years while maintaining total catch weight is the be achieved—this includes adding monitoring efforts to estimate baseline BPUE rates for each turtle species captured in the IG fleet. These BPUE estimates could then be compared to potential management strategies to reduce turtle BPUE in the future. For supplementary analysis, we present summary tables of evidence for the turtle species assessed (see Supplementary Material).
Potential Management Measures Based on the Mitigation Hierarchy
Based on information obtained from a literature search, we defined a list of potential management measures and categorized them according to the steps of the mitigation hierarchy. This list was refined to 13 potential management strategies during key informant interviews and FGDs (Table 8). Management strategies included an avoidance strategy (to reduce EBof Eq. 1), eight minimization strategies (four spatial or temporal area closures and four technology or fishing behavior changes), two remediation strategies (to reduce BPUE of Eq. 1), and two biodiversity offsetting strategies (to increase OT of Eq. 1).
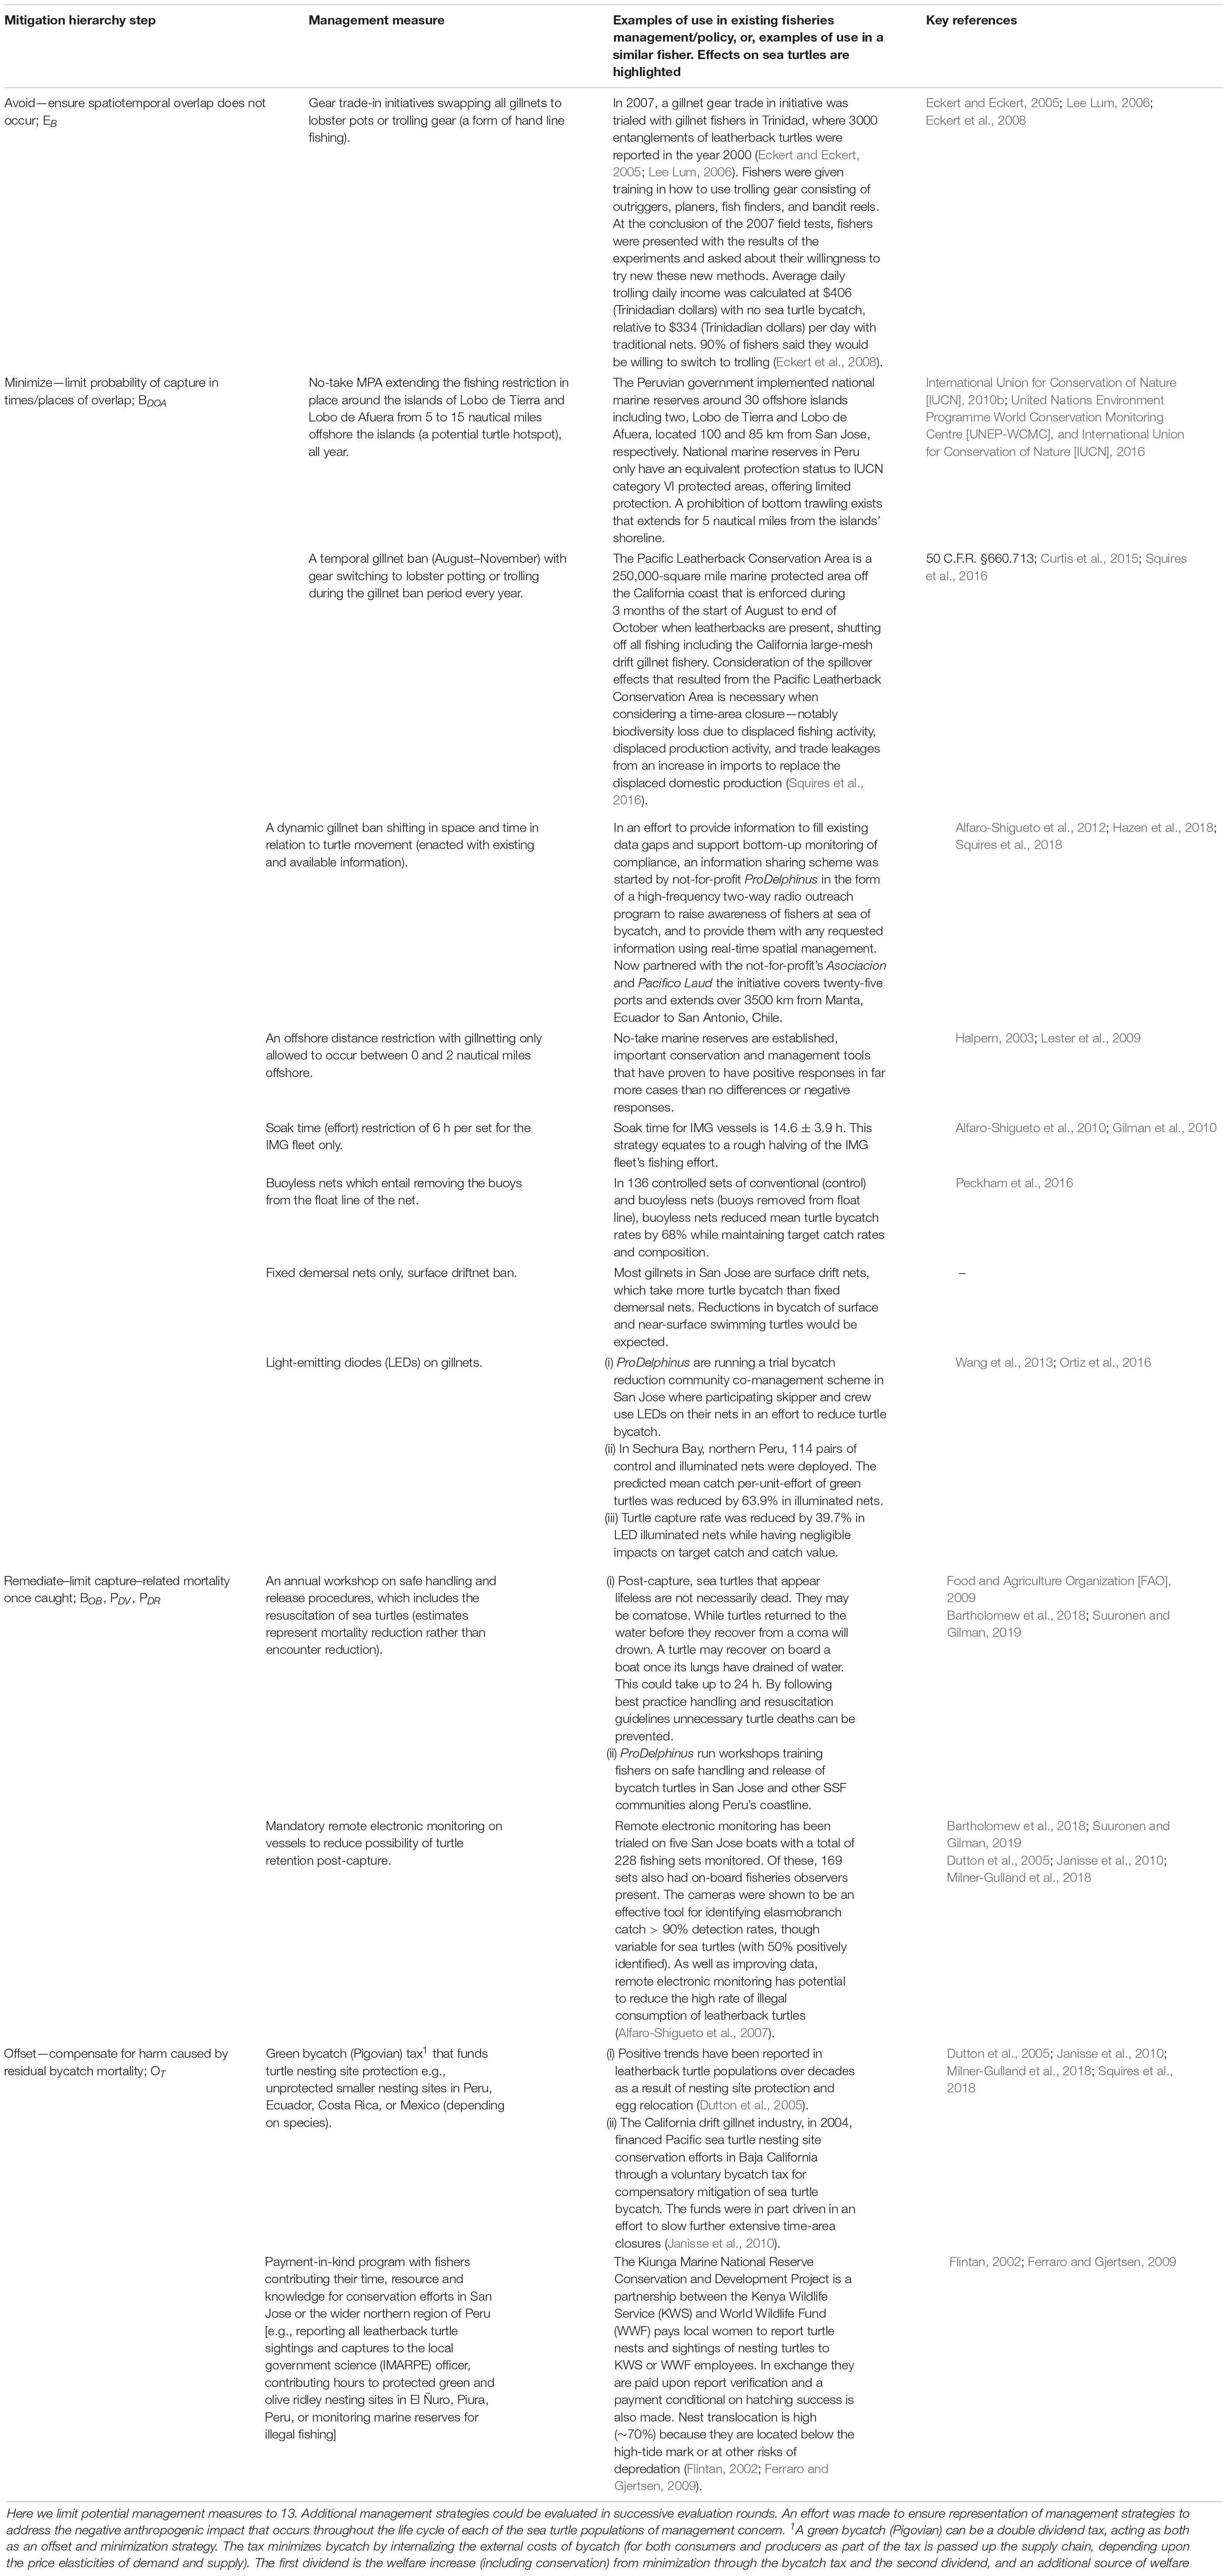
Table 8. Potential management measures for mitigating sea turtle captures/mortalities in San Jose’s small-scale gillnet fishery.
The respondents in the inshore gillnet fleet’s FGD (comprising 13 of 150 possible IG skippers, a local government scientist, and a local not-for-profit employee) disagreed with more of the potential preventative measures proposed that fell into the avoidance and minimization steps of the mitigation hierarchy and agreed with more of the compensatory actions that fell into the remediation and offsetting steps (Figure 2). The same trend is present for the IMG fleet’s FGD (comprising 3 of 18 possible IMG skippers, and two local not-for-profit employees) but responses were more mixed. Fishers were in strong disagreement with the proposed avoidance strategy of phasing out gillnets in favor of alternative fishing gear such as trolling (a form of handline fishing). The inshore group strongly disagreed with at-sea capture reduction technologies such as LEDs on nets or shifting to buoyless nets. Responses to these measures were more distributed for the IMG group. Both groups were in strong agreement with participating in training workshops teaching better handling and release practices for captured turtles and most respondents agreed with the use of remote electronic monitoring onboard their vessels (Figure 2). Off-site compensation strategies such as biodiversity offsetting received mixed responses in both FGDs (Figure 2).
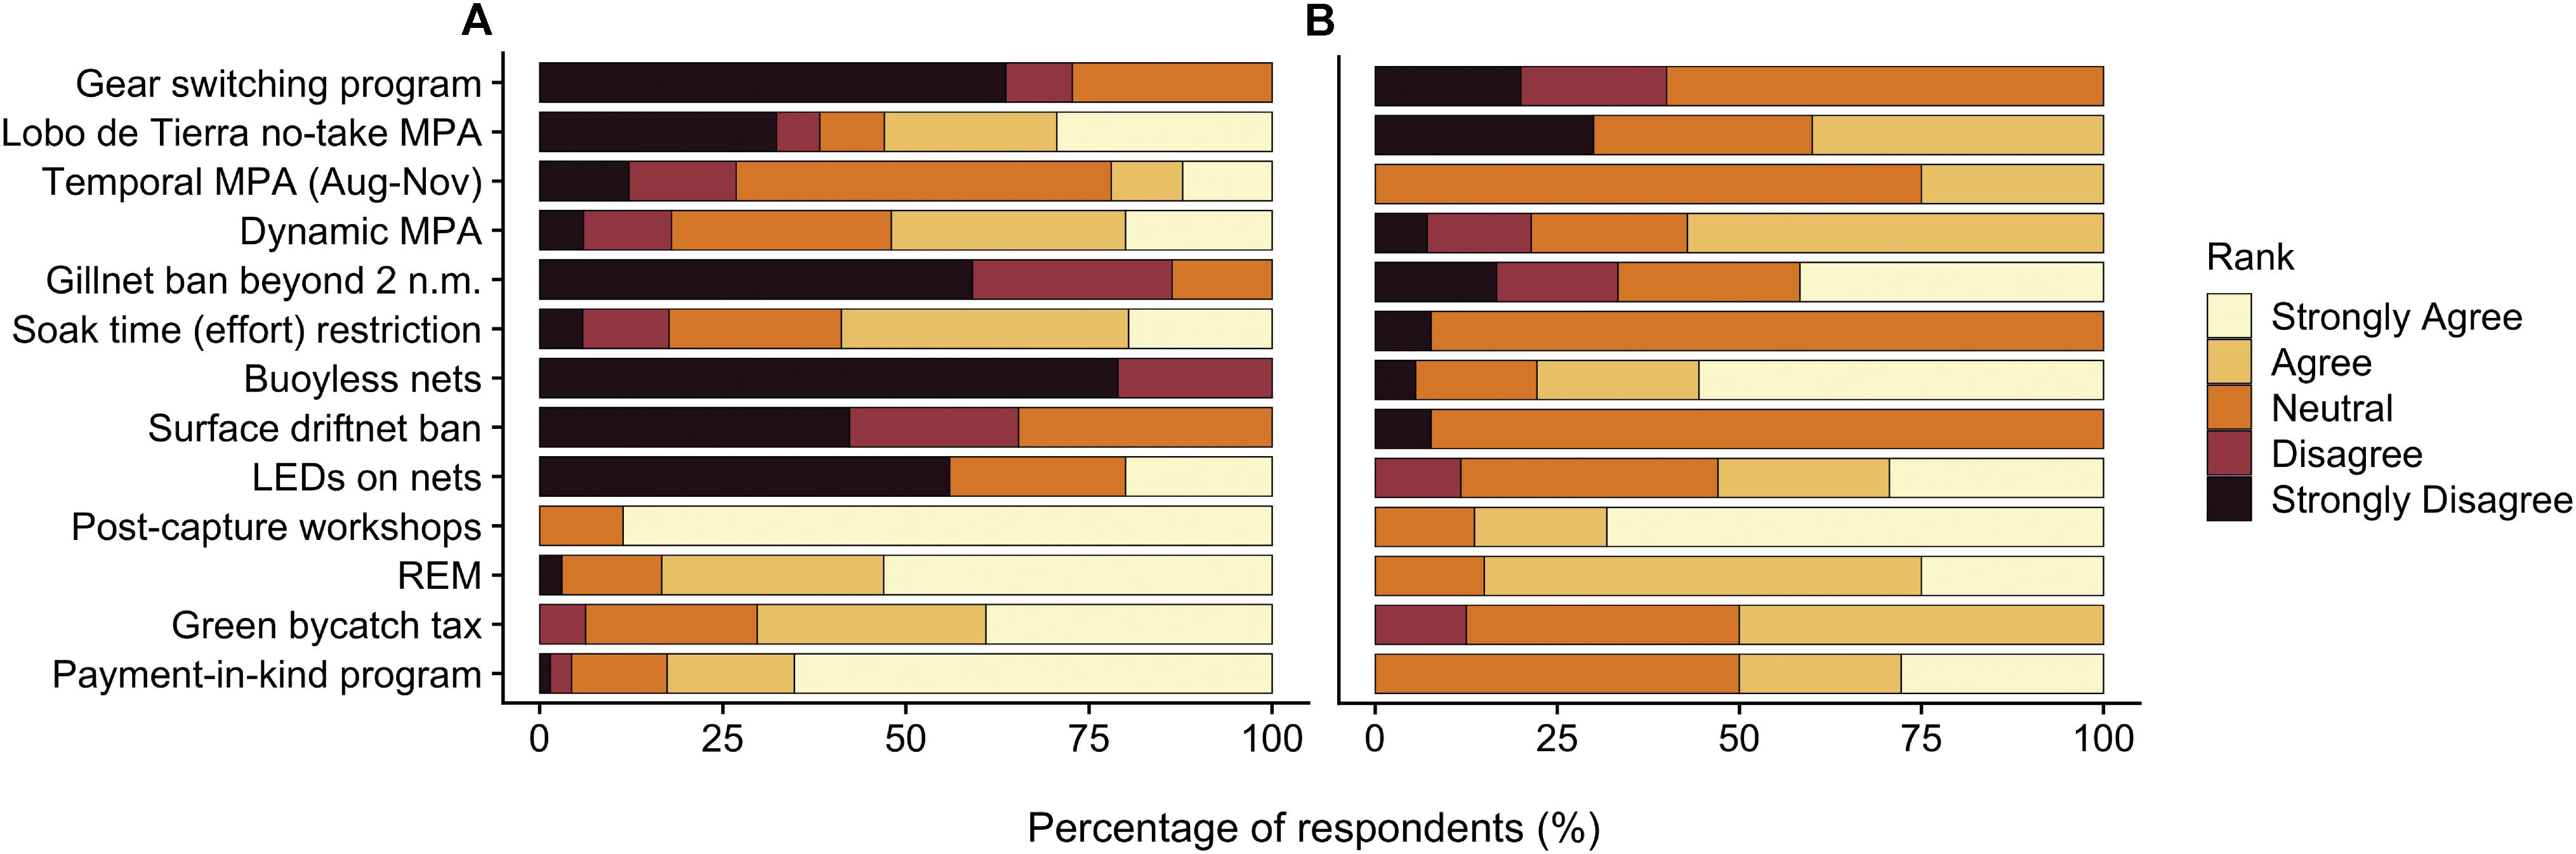
Figure 2. Stakeholder preference for the evaluated turtle bycatch reduction strategies. Two focus group discussions (FGDs) were run. FGD (A) concentrated on the inshore gillnet (IG) fleet and comprised 15 respondents, including IG skippers (n = 13), a regional government scientist (n = 1), and a not-for-profit employee (n = 1). FGD (B) focused on the inshore-midwater gillnet (IMG) fleet and comprised five respondents, including IMG skippers (n = 3) and local not-for-profit employees (n = 2). REM = remote electronic monitoring. For full strategy descriptions, refer to Table 8.
The Hypothetical Effectiveness of Management Options
In the final section of this study, we illustrate the integration of MSE and the mitigation hierarchy for use in a data-limited management scenario. We explore the performance of three “management scenarios” that each combines multiple management strategies in a preliminary and qualitative assessment to reduce the risk from the San Jose gillnet fishery posed to the recovery of leatherback, green, and olive ridley turtle populations defined by Pacific East RMUs.
Scenario Synopses
Scenario 1 considers the status quo management over 10 years between 2020 and 2030. The scenario maintains existing management strategies in the San Jose gillnet fishery and projects an expected level of expansion over 10 years. Management strategies include expanding the use of LEDs on nets (minimization) and remote electronic monitoring (remediation) from the five IMG vessels where these technologies are currently applied to all the vessels in the IMG fleet. Safe handling and release workshops held in San Jose continue (remediation). This scenario does not implement any management measures in the IG fleet (see Supplementary Material).
Scenario 2 takes a protectionist approach to sea turtles. The scenario implements a gear switching program that phases out gillnet for trolling (a form of handline fishing). A quarter of the San Jose fishery is proposed to undergo the gear switch every two and a half years (avoidance). The existing management actions in place in San Jose continue as expected in scenario 1 (e.g. LEDs on nets would be implemented on IMG vessels that continued to fish during the gillnet phase out-period).
Scenario 3 takes a more incentive-based approach, implementing multiple strategies spanning at-sea minimization, post-capture remediation, and off-site compensation actions. The scenario includes an effort restriction for all vessels operating in the IMG fleet. This limits the gillnet soak time to 6 h per set as opposed to the current 14.6 ± 3.9 h (Alfaro-Shigueto et al., 2010). This equates to an approximate halving of fishing effort across the IMG fleet (minimization). The scenario also includes a dynamic spatiotemporal marine protected area (MPA) for leatherback turtles (minimization). This will make use of a local two-way high-frequency (HF) radio program that allows fishers to receive and report real-time information on turtle sightings and captures (Alfaro-Shigueto et al., 2012). The status quo management strategies in scenario 1 are also enacted, but in this scenario, they integrate the IG fleet as well as the IMG fleet (e.g. LEDs on all nets, remote electronic monitoring systems on all vessels, and continued implementation of safe handling and release workshops across the San Jose gillnet fishery). To support further population recovery for the turtle populations impacted by our case study fishery, this scenario implements a green bycatch (Pigovian) tax as a biodiversity offset (Table 8; Squires et al., 2018). The tax applies to leatherback, green, and olive ridley turtles captured in an eastern Pacific pelagic longline fishery (e.g. Donoso and Dutton, 2010). The means to negotiate this tax in practice goes beyond the scope of the hypothetical scenario assessed here, but volunteer bycatch taxes have been implemented by large-scale commercial fishing fleets before (e.g. a turtle bycatch tax through the California Drift Gillnet Fishery funding nesting site protection implemented by the Mexican non-profit organization Asupmatoma A.C; Janisse et al., 2010). In the present scenario, funds from the tax support the monitoring of leatherback secondary nesting sites in Costa Rica, where illegal egg poaching can still occur (e.g. Ostional; Santidrián-Tomillo et al., 2017). Olive ridley turtles also nest in Ostional, Costa Rica, offering the potential for conservation actions at a single site to support the population recovery of two of the three turtle populations incidentally captured by the San Jose gillnet fishery.
Evaluation of Scenarios
Scenario 1 (“the status quo”) presents the existing management of the San Jose gillnet fishery between 2020 and 2030 (see Supplementary Material). In this scenario, the turtle bycatch issue is expected to worsen because of a lack of management measures restricting fishing effort (Figure 3). With no effective effort restriction in place (such as a TAC to reduce target fish catch per unit effort; CPUE), the incidental take of sea turtles is expected to increase as the IG fleet grows in vessel number and the San Jose gillnet fishery as a whole expands in geographic extent and fishing effort (Guevara-Carrasco and Bertrand, 2017; Castillo et al., 2018). Despite increasing fishing effort (e.g. distance traveled) and fleet number (Table 4), we projected the target fish CPUE to trend downward in line with historical catch trends for the Lambayeque region of Peru (Guevara-Carrasco and Bertrand, 2017). The expansion of existing turtle bycatch mitigation measures trialed in the fishery (LEDs on nets reduce BDOA of equation 2, and remote electronic monitoring and better handling practices reduce PDV) are expected to reduce turtle BPUE rates for individual vessels, and remote electronic monitoring is expected to improve data paucity of turtle capture, bycatch, and consumption rates. Discard rate across a fishery is strongly influenced by shifts in individual human behavior, so the uncertainty in our projected trend is high (e.g. Smith et al., 2004). We drew on data that indicates LEDs on nets have little impact on the volume of target catch (Ortiz et al., 2016). This was supported by our field observations where we noted that San Jose fishers retain all but the smallest fish species for use and sale at markets—which is supported by regional catch reports (Guevara-Carrasco and Bertrand, 2017). These data highlight that current trends in discards are likely to persist under scenario 1. As fishing effort across a larger geographic extent is expected, the impact on habitat and sessile communities is predicted to have a slight upward trend (Figure 3).
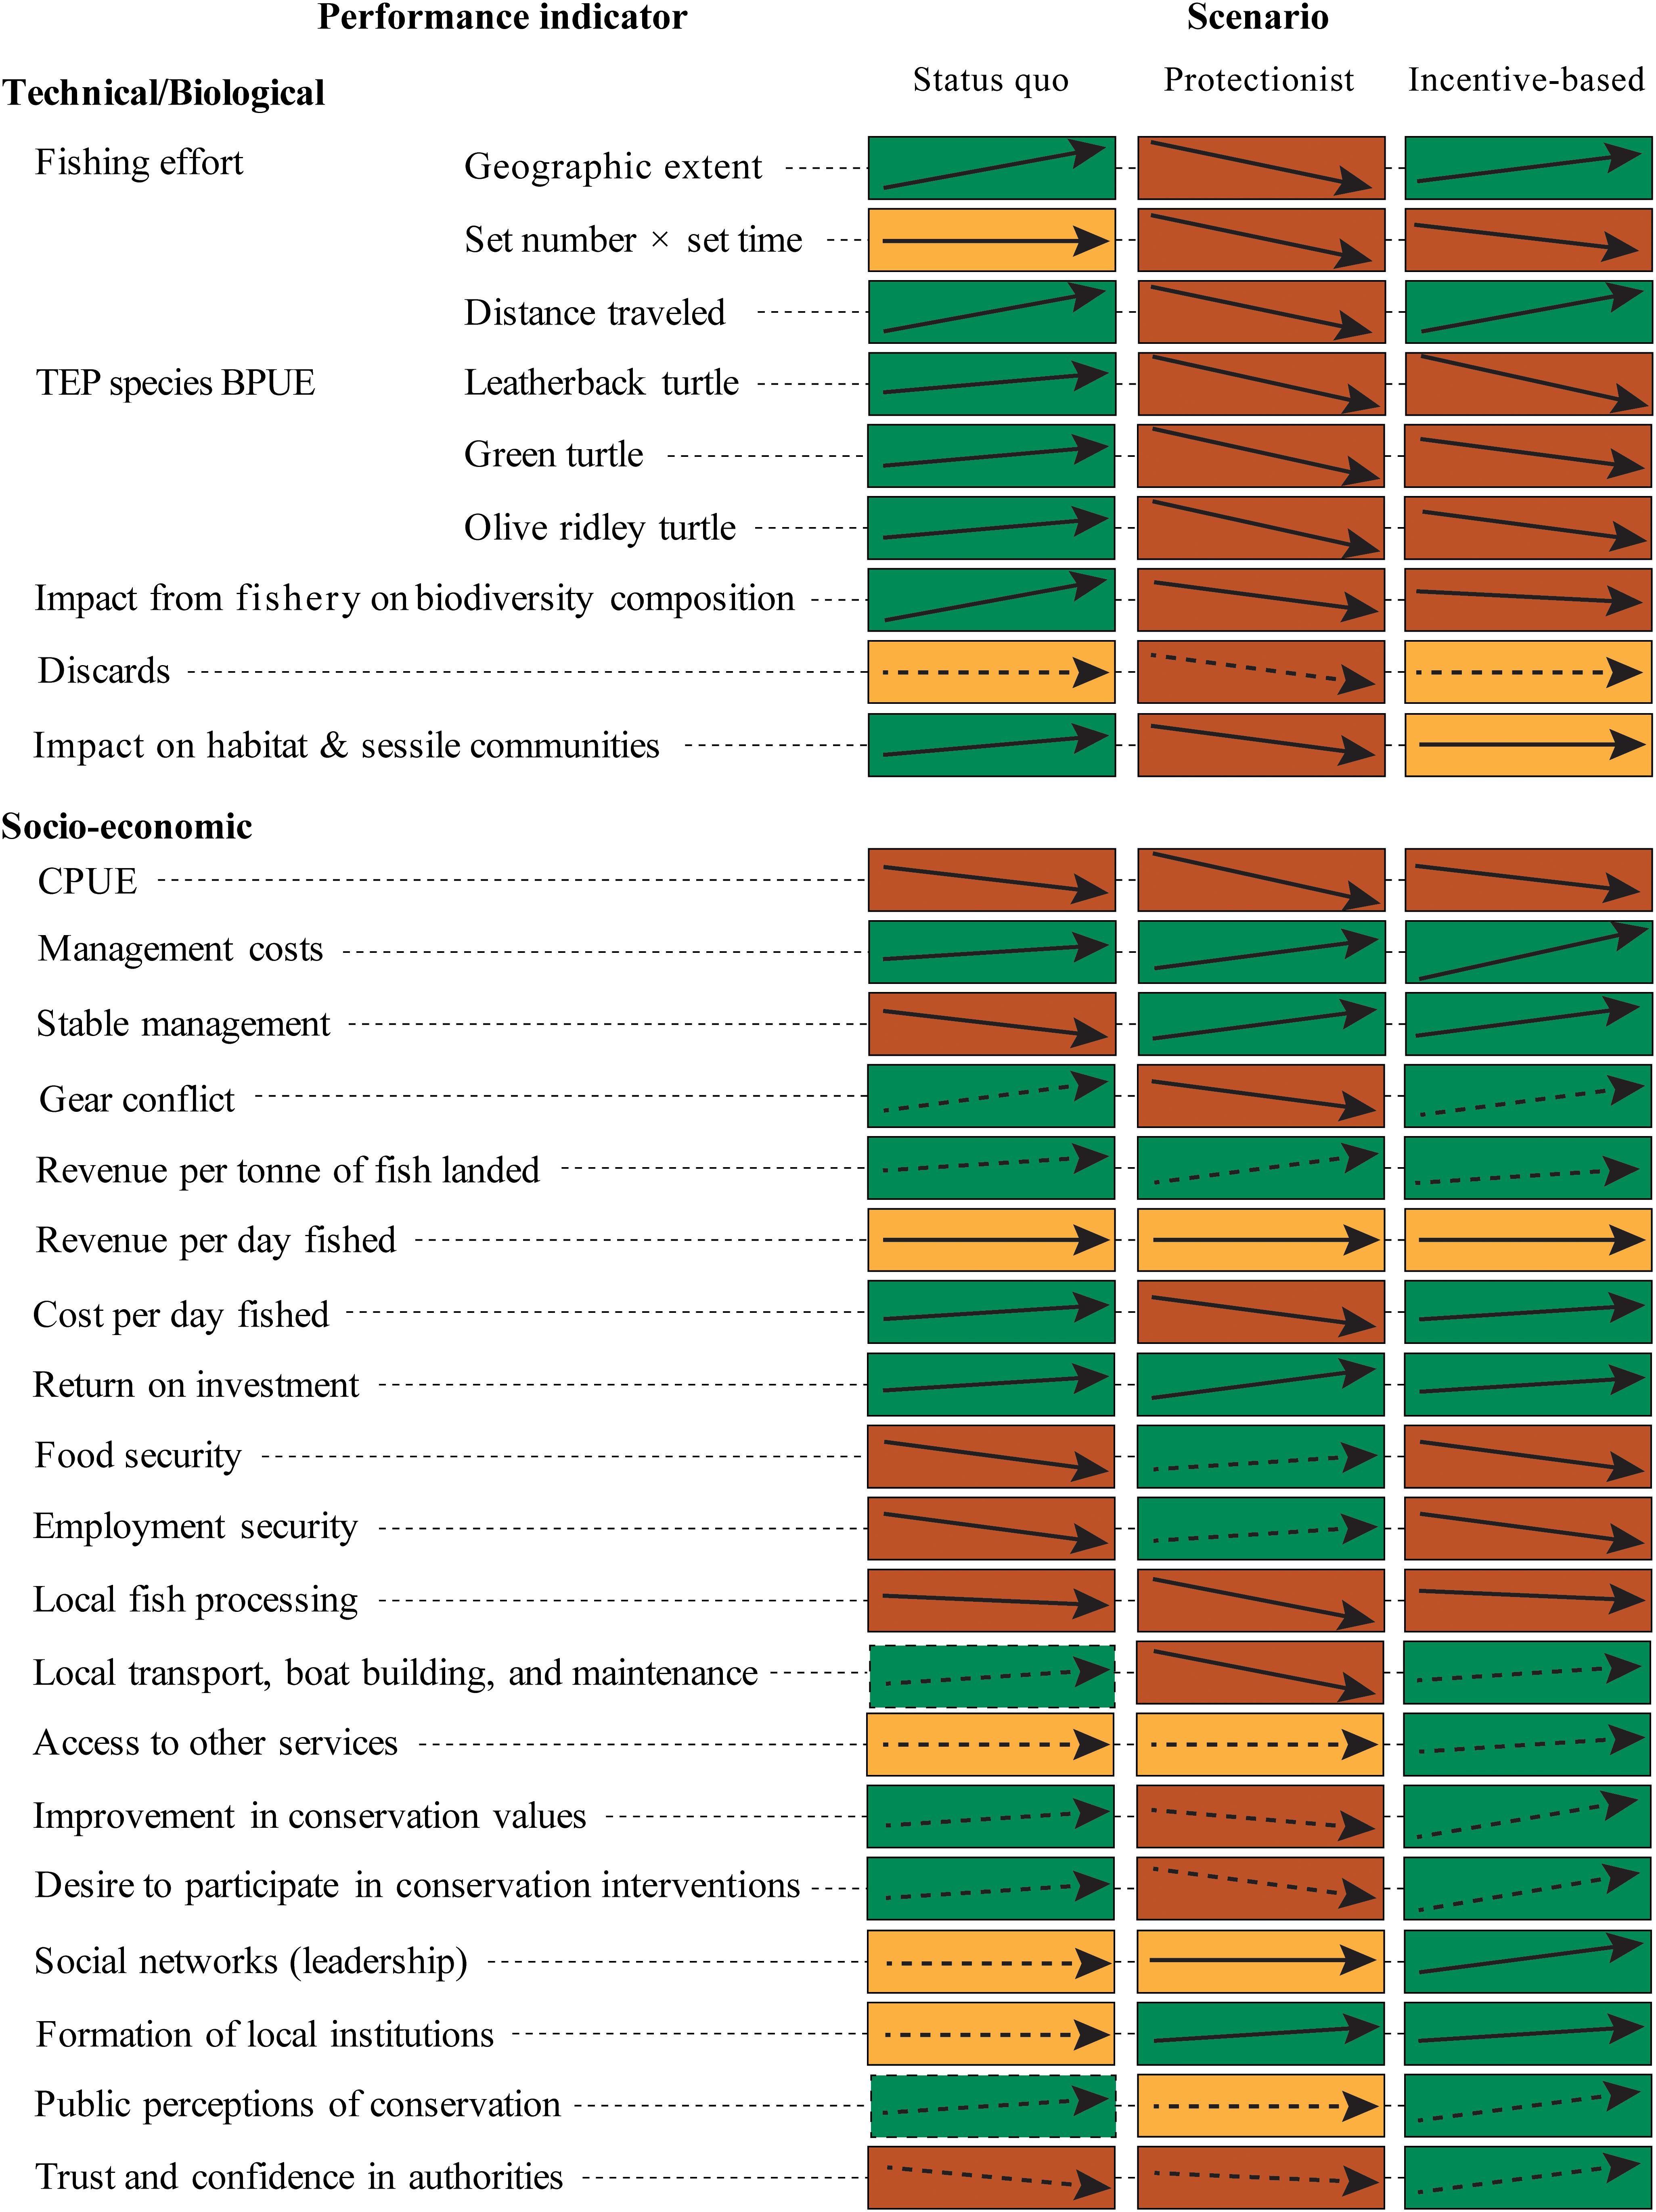
Figure 3. Trends over 10 years in indicators for each of the three management scenarios in the San Jose gillnet fishery (based on informed opinion). Green boxes indicate predicted positive trends, yellow boxes indeterminate trends, and red boxes declining trends. Dotted lines represent high levels of uncertainty in the presented trend direction. We present a management summary table with a full list of the management measures contained in each scenario (see Supplementary Material).
We predicted that the overall management cost of this scenario would follow an increasing trend because of the expansion of LEDs on nets and remote electronic monitoring across the IMG fleet (Figure 3). Costs supporting our estimate came from price estimates reported from controlled gear trials of LEDs on nets and remote electronic monitoring in the local fishing system (Ortiz et al., 2016; Bartholomew et al., 2018). The IG fleet remains for all intents and purposes, an open-access fishery (cf. Supreme decree N° 018-2010-PE). Despite the ban on new vessel builds, we expect the IG fleet to expand in line with historical trends over the assessment period (Table 4). We predicted that an expanding IG fleet will decrease the stability of management across the San Jose gillnet fishery as a whole. The cost per day fished in expected to increase as distance traveled increases, forcing a higher consumption of fuel per vessel. Declines in food, employment security, and fish processing follow declining CPUE estimates (Guevara-Carrasco and Bertrand, 2017). We predicted an increasing IG fleet will drive positive trends in local transport, boat building, and maintenance, but uncertainty remains high due to the potential to increase enforcement of the ban on new vessels. Access to other services is not well known but predicted to remain stable with high uncertainty. We predicted that the expanding conservation interventions (e.g. LEDs on nets and participatory workshops) will lead to a small improvement in local conservation values. Our survey data show IG skippers disagreed with LEDs on nets but that remote electronic monitoring and training workshops had a stronger agreement (Figure 2). We predicted perceptions to improve over time as the existing interventions in the IMG fleet expand to the other fishers in the fleet, but this trend remains highly uncertain and warrants further investigation. Local leadership, the formation of new social organizations (e.g. a new fishing collective), and trust and confidence in authorities are not well known and are predicted as indeterminate or in decline as the current scenario does little to investigate or manage the improvement of these social conditions.
Scenario 2 (“the protectionist”) reduces the negative fishing impact on sea turtles (reduced EB of Eq. 1) over the management period (Figure 3). We predicted that the area fished will increase as the gillnet fishery continues to expand in effort due to a predicted decrease in target catch following historic catch trends (Guevara-Carrasco and Bertrand, 2017). We anticipate management costs to increase as the initiative expands. We considered the possibility of an increase in the gross value of the fish product as handline caught fish can offer a more sustainable consumer choice (e.g. Eckert and Eckert, 2005; Eckert et al., 2008), but the uncertainty surrounding consumer interest and willingness to pay for a more sustainably sourced fish product in our case study fishing system remains high. We predicted that conflict between gillnet, trawl, and purse seine fisheries operating in the area will decline as gillnet are traded in. Transportation, boat building and maintenance resulted in downward trends as local fish processing and indirect income decline due to trolling bringing in a lower abundance of fish products over gillnets to process (Eckert and Eckert, 2005; Eckert et al., 2008). We expect a steady decline in turtle BPUE (reducing BDOA of Eq. 2) as trolling (handline fishing) takes no, or very little turtle bycatch. Public perception of conservation is highly uncertain. We predicted long-term economic improvement, but the decline in secondary fishery services anticipated to occur in the community over the short- to medium-term may negatively affect this predicted upward trend.
Scenario 3 (“the incentive-based”) attempts a more balanced approach to mitigating the negative fishing impact from the San Jose gillnet fishery on sea turtles (Figure 3). We predicted fishing effort to continue to increase, but not as rapidly as in scenario 1, because of the effort restriction halving the allowable set time in the IMG fleet (see Supplementary Material). We predicted that the effort restriction will lead to an initial decline in CPUE, which would rapidly level out over the remaining management period. We projected declines in turtle BPUE (through a reduction in BDOA of Eq. 2). We estimated a steeper decline for leatherback turtles over the green and olive ridley turtles because of the dynamic leatherback turtle MPA in this scenario. Our data show support from most gillnet fishers’ in San Jose for the best handling and release practice workshops so we estimated high compliance and an associated small but measurable increase in post-capture turtle survival rates contributing to the declining turtle BPUE (Figure 2; reducing PDV, and potentially PDR in Eq. 2). It was also assumed that remote electronic monitoring if expanded would result in wide uptake on gillnet vessels in San Jose (Figure 2; reducing PDV). The green bycatch tax can act as a double dividend. The first dividend comes from the tax incentivizing fishers in the large-scale pelagic fishery to change their fishing behavior in favor of mitigating turtle bycatch. The second dividend comes from the funds that the tax produces supporting nesting site protection for leatherback turtles (secondary nesting site) and olive ridley turtles (major nesting site) in Ostional, Costa Rica (Squires et al., 2018). Predicting any meaningful shift in population trends from funding the monitoring of a single nesting site in Costa Rica is difficult over the ten year assessment period (OT of Eq. 1). Additional conservation action protecting secondary nesting sites for the East Pacific population of leatherback turtles form an integral part of planning any holistic conservation and population recovery plan for this species (Santidrián-Tomillo et al., 2017). Over longer periods (e.g. 20 + years), nesting site protection has driven long-term population recovery in several sea turtle populations (e.g. Chaloupka, 2003; Balazs and Chaloupka, 2004; Dutton et al., 2005; Troëng and Rankin, 2005). We predicted that the likelihood of public perception and fishers’ desire to be part of management strategies in the future will improve, but this trend is uncertain despite scenario 3 integrating multiple strategies that fishers supported (Figure 2). These trends were strongly influenced by the expected decline in food and employment security expected in San Jose. Scenario 3 has the most diverse suite of bycatch reduction strategies, thus high management costs for this scenario were estimated (Figure 3).
Discussion
We applied the mitigation hierarchy for fisheries management and marine megafauna bycatch reduction (Milner-Gulland et al., 2018; Squires et al., 2018) to the San Jose gillnet fishery where sea turtle captures are a known conservation issue (Alfaro-Shigueto et al., 2018). Working through the proposed steps of the mitigation hierarchy framework, we characterized our case-study fishery and the species of management concern. This helped prioritize research quantifying the fishery’s geographic extent across fishing seasons. We identified gaps in fishery-specific turtle capture and bycatch rates, prompting us to calculate capture rates per trip for the turtle species regularly impacted by the IMG fleet. We then assessed the risk from the case study fishery (both IG and IMG fleets) on the turtle species of management concern based on a proposed qualitative turtle bycatch reduction target to contribute to a wider high-level population recovery goal (Fletcher, 2014). Drawing on the existing information collated and newly filled knowledge gaps, we compiled a list of 13 hypothetical management options to reduce key sources of anthropogenic-impact posed to the turtle populations of management concern. We then used fisher perceptions and a qualitative MSE framework to carry out a preliminary exploration of possible management scenarios by considering estimated trends for a range of biological, social, and economic indicators.
The wide migratory range of the turtle species assessed means that they spend much of their lives in waters or on beaches under other nations’ jurisdictions. This necessitates a wider international effort to manage transboundary externalities for this species at ecologically relevant levels (Dutton and Squires, 2008). While we focused the current study on direct fishing impacts from a single small-scale fishery, the use of the mitigation hierarchy as an overarching framework encouraged consideration of a range of potential management strategies, from precautionary avoidance and minimization measures at-sea to supporting compensatory actions that seek to mitigate negative impacts from both large-scale pelagic fisheries, and those that occur at terrestrial-based nesting sites (Table 8). The framework helped drive simultaneous consideration of biodiversity losses and gains. This, in turn, allowed us to demonstrate the integration of a diverse set of management processes and tools to achieve a specific, qualitative target. This integration demonstrates how actions that are undertaken across a wide variety of fisheries and associated management structures might be summed together to evaluate progress toward high-level population recovery goals for depleted populations of marine megafauna species.
We supplemented the ERA using the turtle capture rates calculated for the IMG fleet, and existing research investigating turtle captures in Peru’s coastal gillnet fisheries (e.g. Alfaro-Shigueto et al., 2007, 2018). Our analysis shows that the fishing impact from two gillnet fleets, which launch from a single port, could generate further declines of the Pacific East RMU populations of green and leatherback turtles (Table 7). San Jose is one of the major gillnetting ports in Peru but comprises only one of 106 landings sites or ports along the country’s coastline (Castillo et al., 2018). While this assessment remains qualitative, it highlights the immediate need for additional management action to address the risk of local extinction for the Pacific East RMU leatherback turtle population (Spotila et al., 2000; Mazaris et al., 2017).
Integrating a qualitative MSE process with the mitigation hierarchy framework allowed for a preliminary evaluation of potential management scenarios incorporating a mix of turtle bycatch reduction strategies in a data-limited fishery. The assessment of how a diverse range of biological, technical, and socio-economic indicators might change through time allows for trade-offs between management goals to be transparently assessed. The trends estimated in the predictive performance indicators demonstrated that further management action is necessary to mitigate the negative impact on sea turtle populations from the San Jose gillnet fishery. The results also demonstrated that none of the three bycatch reduction scenarios presents a straightforward management picture. We predicted a wide variety of biological, economic, and social shifts across the three management scenarios evaluated. Our results provide some insight into how a range of management measures aimed at reducing turtle captures and mortalities could impact fishers, the wider San Jose community, and indirectly on biodiversity. However, based on our available data, the uncertainty in many of the predicted trends was high, particularly concerning the social indicators (Figure 3). Our results highlight the need for further integrating natural and social science in marine ecosystem-based management research (Alexander et al., 2018).
In several instances, it was easy to predict indicator trends under one of the three management scenarios evaluated (e.g. expecting green turtle BPUE in gillnets to decrease across the San Jose gillnet fishery as vessels switched from gillnets to handline trolling—scenario 2). In most cases, predicting the trends was difficult and uncertain based on the data available. We required an iterative process where the project team (the authors) assessed conflicting inputs to come up with the best guess of the likely trends (Smith et al., 2004). The assessment combined trends across the two gillnet fleets (i.e. IMG and IG), with weightings or emphasis applied to each fleet largely based on the project team’s knowledge of the fishery and the collated and collected data. We found that emphasis on any particular input (i.e. the efficacy of the proposed dynamic spatiotemporal MPA for leatherback turtles) often had a sizeable influence on the trajectory of the trend in the indicator.
The varying experiences and personal biases each member of the project team brought to the assessment meant that several different trends in an indicator could result depending on an individual’s interpretation. We undertook an iterative evaluation process aimed to address any difference in opinion. These web-based discussions allowed team members to highlight differences in interpretation. Comprehensive face-to-face workshops guided using structured question protocols and feedback would have improved the project team’s ability to address different interpretations (Valverde, 2001; Burgman et al., 2011). The project team comprised representatives from academia, government, and a not-for-profit organization. We acknowledge additional bias in the overall experience of the group toward a conservation science and fisheries science background. Recognition that these biases may influence the qualitative assessment is vital and points to the importance of seeking a diverse range of stakeholder inputs across multiple sectors (e.g. industry, local community members, local government, not-for-profit organizations; Smith et al., 2004). Our experience of undertaking the assessment highlights the necessity for a quantitative evaluation of management scenarios—this could be a mid-term goal for supporting effective mitigation of turtle captures and mortalities in the San Jose gillnet fishery (e.g. Smith et al., 2004; Fulton et al., 2011a).
Numerous management options could integrate under the umbrella of the proposed mitigation hierarchy framework. While we made every attempt to include consideration of management strategies that addressed the negative anthropogenic impact that occurs throughout the life cycle of each of the sea turtle populations of management concern, many fishery management strategies were not evaluated. For example, implementation of a TAC on target fish species is a primary management mechanism in many fishery management frameworks (Gordon, 1954; Karagiannakos, 1996; Marchal et al., 2016). The decision to not include a TAC in any of the management scenarios was made because setting TACs for multiple, individual target species within a mixed-stock fishery must be carefully evaluated (Squires et al., 1998). Such an evaluation went beyond the scope of this study. Instead, we chose to include a simple effort restriction as part of scenario 3, in the form of halving the soak time within the IMG fleet. However, we note that the evaluation of proposed TACs for multiple species in a qualitative MSE process is achievable (Smith et al., 2004; Dichmont and Brown, 2010).
In collating and collecting information about the San Jose gillnet fishery and bycatch species group of management concern, case-specific issues arose. For example, 33% of San Jose gillnet fishers who self-reported turtle captures also noted that they consume turtles (Alfaro-Shigueto et al., 2018). These findings are supported by the report of 133 leatherback turtles caught between 2000 and 2003 off the coast of Salaverry (Figure 1). Of these captured leatherbacks, 41.4% were released alive, and 58.6% were retained for human consumption (Alfaro-Shigueto et al., 2007). These data highlight the need for an intervention focused toward shifting social norms and cultural values away from the consumption of turtle meat and toward alternate food sources. This could potentially be integrated as an offsetting measure (e.g. campaigns to engender pride in conserving turtles funded by a bycatch tax). Such an approach could be supported by compliance and monitoring in the form of the proposed expansion of remote electronic monitoring devices (Figure 3; Bartholomew et al., 2018).
We classified only one avoidance management strategy (a gear trade-in initiative swapping all gillnets for lobster pots or trolling equipment), out of the 13 management strategies evaluated. When we developed the theory for applying the mitigation hierarchy to fisheries management and bycatch mitigation, any spatial, temporal, and spatiotemporal area closures were classified within the avoidance step of the mitigation hierarchy (Milner-Gulland et al., 2018). Equation 1 of the mitigation hierarchy stipulates that avoidance measures ensure no spatiotemporal overlap occurs between the impacting risk and the species unit of management concern, thereby reducing EB (Milner-Gulland et al., 2018). Thus, true avoidance measures require that the impacting fishing activity in question does not overlap with the bycatch of management concern (or has a very low likelihood of occurring; Booth et al., 2019). Because of this, spatiotemporal area closures avoid only if they are large enough or dynamic enough to ensure that fishing impact on the assessed unit of the species of management concern does not occur. For highly migratory marine megafauna such as sea turtles, this means that small spatiotemporal closures may displace the fishing impact to areas where turtles may still be located, thus creating a marginal benefit rather than ensuring the fishing impact is avoided (Halpern et al., 2004; Agardy et al., 2011). We contend that consideration must be given to the size of the proposed spatiotemporal closure in regard of the size of the assessment unit for the species of management concern. Only following this consideration should management measure be classified in the mitigation hierarchy accordingly.
We identified and filled several knowledge gaps in the current analysis, but other knowledge gaps present more substantive uncertainties and a more comprehensive data gathering process. For example, we had limited understanding of how the proposed management strategies will perform in our case-study system (except for net illumination and remote electronic monitoring; Ortiz et al., 2016; Bartholomew et al., 2018). Several trends estimated in the qualitative MSE were more uncertain as a result (Figure 3). In data-limited fisheries management situations such as the current study, it is often necessary to draw on elicited knowledge from fishers and local practitioners to support evaluations. Structured elicitation methods such as the IDEA protocol offer robust frameworks to reduce cognitive biases and more accurately quantify uncertainty (Hanea et al., 2016; Arlidge et al., 2020). Elicited data can then be used with fishery-specific costs of management strategy implementation, alongside consideration of the social implications of implementation.
Finally, a fully quantitative application of the mitigation hierarchy (Eq. 1) would also require an understanding of the relationship between population growth rates and bycatch rates. This was not achievable in our case study and will be challenging for many fisheries and species, particularly those in data-limited situations. As such, targets based on population growth may need to be the “gold standard,” with more realistic measurable targets, such as those based on total catch or BPUE, used in the interim.
Conclusion
We present a case study application of the mitigation hierarchy to evaluate management options to mitigate sea turtle captures and reduce bycatch in a small-scale gillnet fishery in northern Peru. The conceptual overarching framework provided by the mitigation hierarchy helped integrate a range of fisheries management processes toward a fishery-specific quantitative target that feeds into a wider goal for biodiversity (Milner-Gulland et al., 2018; Squires et al., 2018). In data-limited fisheries like our case study, such goals remain aspirational, yet this framing clarifies how local-scale management action can translate to higher level goals for biodiversity. The proposed framework supported explicit consideration of uncertainties and highlighted future areas of research before implementing a more comprehensive assessment of management strategies in the future. The mitigation hierarchy’s step-wise precautionary approach toward biodiversity encouraged a more holistic appraisal of management actions to address the negative fishing impact to sea turtles from the San Jose gillnet fishery. The framing of management options within the context of the hierarchy helped with consideration of preventative and compensatory measures throughout the life cycle of each turtle species of management focus. Integrating the mitigation hierarchy framework with MSE offers potential, as both qualitative and quantitative assessments can be undertaken, catering to a wide suite of potential fisheries. It also demonstrates how the mitigation hierarchy can add value to existing methods and procedures established within existing fisheries management processes. In identifying and filling key knowledge gaps and considering the socio-economic implications of a diverse suite of management strategies, the mitigation hierarchy shows the potential for supporting effective fishery-specific solutions that translate to aspirational national and international biodiversity goals.
Data Availability Statement
All datasets generated for this study are included in the article/Supplementary Material. The survey data in anonymized form and R code underlying this research can be found at https://osf.io/ze5pw/.
Ethics Statement
The studies involving human participants were reviewed and approved by the University of Oxford (CUREC 1A; Ref No: R52516/RE001 and R52516/RE002). The patients/participants provided their written informed consent to participate in this study.
Author Contributions
WA, DS, and EM-G conceived the manuscript. WA wrote the first draft. JA-S and JM supported the data analysis of the observer database. JA-S, HB, and JM contributed to the development of the framework’s application in the case study fishery. All authors contributed significantly to revising the manuscript.
Funding
WA was supported by a Ph.D. Commonwealth Scholarship from the Commonwealth Scholarship Commission in the United Kingdom and the University of Oxford (Ph.D. scholarship NZCR-2015-174), and the work was supported by the Pew Charitable Trusts through a Pew Marine Fellowship to EM-G.
Conflict of Interest
The authors declare that the research was conducted in the absence of any commercial or financial relationships that could be construed as a potential conflict of interest.
Acknowledgments
We thank the NOAA, Southwest Fisheries Science Center for supporting this research. This article originated at a 2017 workshop organized by NOAA-Fisheries entitled “Mitigating Bycatch: Novel Insights to Multidisciplinary Approaches.” A special thanks to Bruno Ibañez-Erquiaga and Natalie Bravo for your support throughout the data gathering process. We also thank the reviewers whose valuable comments helped to improve the clarity and strength of the article.
Supplementary Material
The Supplementary Material for this article can be found online at: https://www.frontiersin.org/articles/10.3389/fmars.2020.00049/full#supplementary-material
References
Agardy, T., Di Sciara, G. N., and Christie, P. (2011). Mind the gap: addressing the shortcomings of marine protected areas through large scale marine spatial planning. Mar. Policy 35, 226–232. doi: 10.1016/j.marpol.2010.10.006
Alexander, K., Hobday, A., Cvitanovic, C., Ogier, E., Nash, K., Cottrell, R., et al. (2018). Progress in integrating natural and social science in marine ecosystem-based management research. Mar. Freshw. Res. 70, 71–83. doi: 10.1071/MF17248
Alfaro-Shigueto, J., Dutton, P. H., Van Bressem, M., and Mangel, J. (2007). Interactions between leatherback turtles and Peruvian artisanal fisheries. Chelon. Conserv. Biol. 6, 129–134.
Alfaro-Shigueto, J., Mangel, J. C., Bernedo, F., Dutton, P. H., Seminoff, J. A., and Godley, B. J. (2011). Small-scale fisheries of Peru: a major sink for marine turtles in the Pacific. J. Appl. Ecol. 48, 1432–1440. doi: 10.1111/j.1365-2664.2011.02040.x
Alfaro-Shigueto, J., Mangel, J. C., Darquea, J., Donoso, M., Baquero, A., Doherty, P. D., et al. (2018). Untangling the impacts of nets in the southeastern Pacific: Rapid assessment of marine turtle bycatch to set conservation priorities in small-scale fisheries. Fish. Res. 206, 185–192. doi: 10.1016/j.fishres.2018.04.013
Alfaro-Shigueto, J., Mangel, J. C., Dutton, P. H., Seminoff, J. A., and Godley, B. J. (2012). Trading information for conservation: a novel use of radio broadcasting to reduce sea turtle bycatch. Oryx 46, 332–339. doi: 10.1017/S0030605312000105
Alfaro-Shigueto, J., Mangel, J. C., Pajuelo, M., Dutton, P. H., Seminoff, J. A., and Godley, B. J. (2010). Where small can have a large impact: structure and characterization of small-scale fisheries in Peru. Fish. Res. 106, 8–17. doi: 10.1016/j.fishres.2010.06.004
Aranda, C., and Chandler, M. (1989). Las tortugas marinas del Perú y su situación actual. Science 62, 77–86.
Arlidge, W. N. S., Alfaro-Shigueto, J., Ibañez-Erquiaga, B., Mangel, J., Squires, D., and Milner-Gulland, E. J. (2020). Evaluating elicited judgements of turtle captures for data-limited fisheries management. Conserv. Sci. Pract. 2020:e181. doi: 10.1111/CSP2.181
Arlidge, W. N. S., Bull, J. W., Addison, P. F. E., Burgass, M. J., Gianuca, D., Gorham, T. M., et al. (2018). A global mitigation hierarchy for nature conservation. Bioscience 68, 336–347. doi: 10.1093/biosci/biy029
Balazs, G. H., and Chaloupka, M. (2004). Thirty-year recovery trend in the once depleted Hawaiian green sea turtle stock. Biol. Conserv. 117, 491–498. doi: 10.1016/j.biocon.2003.08.008
Bartholomew, D. C., Mangel, J. C., Alfaro-Shigueto, J., Pingo, S., Jimenez, A., and Godley, B. J. (2018). Remote electronic monitoring as a potential alternative to on-board observers in small-scale fisheries. Biol. Conserv. 219, 35–45. doi: 10.1016/j.biocon.2018.01.003
Bennett, G., Gallant, M., and Ten Kate, K. (2017). State of Biodiversity Mitigation 2017: Markets and Compensation for Global Infrastructure Development. Washington, DC: Forest Trends Ecosystem Marketplace.
Bjørndal, T., and Conrad, J. M. (1987). The dynamics of an open access fishery. Can. J. Econ. 20, 74–85. doi: 10.2307/135232
Bonneuil, C. (2015). Tell me where you come from, I will tell you who you are: a genealogy of biodiversity offsetting mechanisms in historical context. Biol. Conserv. 192, 485–491. doi: 10.1016/j.biocon.2015.09.022
Booth, H., Squires, D., and Milner-Gulland, E. J. (2019). The mitigation hierarchy for sharks: a risk-based framework for reconciling trade-offs between shark conservation and fisheries objectives. Fish Fish. 1–21. doi: 10.1111/faf.12429
Bull, J. W., and Milner-Gulland, E. (2019). Choosing prevention or cure when mitigating biodiversity loss: trade-offs under ‘no net loss’ policies. J. Appl. Ecol. 1–13. doi: 10.1111/1365-2664.13524
Bull, J. W., Milner-Gulland, E. J., Addison, P. F. E., Arlidge, W. N. S., Baker, J., Brooks, T. M., et al. (2019). Net positive outcomes for nature. Nat. Ecol. Evol. 4, 4–7. doi: 10.1038/s41559-019-1022-z
Burgman, M. A., Mcbride, M., Ashton, R., Speirs-Bridge, A., Flander, L., Wintle, B., et al. (2011). Expert status and performance. 6:e22998. doi: 10.1371/journal.pone.0022998
Castillo, G., Fernandez, J., Medina, A., and Guevara-Carrasco, R. (2018). Third structural survey of the artisanal fishery in the Peruvian littoral. Inform. Imarpe 45, 299–388.
Chaloupka, M. (2003). “Stochastic simulation modeling of loggerhead population dynamics given exposure to competing mortality risks in the western South Pacific,” in Loggerhead Sea Turtle, eds A. B. Bolten, and E. Witherington (Washington, D.C: Smithsonian Institution Press), 319.
Christensen, V., De La Puente, S., Sueiro, J. C., Steenbeek, J., and Majluf, P. (2014). Valuing seafood: the Peruvian fisheries sector. Mar. Policy 44, 302–311. doi: 10.1016/j.marpol.2013.09.022
Costello, C., Ovando, D., Clavelle, T., Strauss, C. K., Hilborn, R., Melnychuk, M. C., et al. (2016). Global fishery prospects under contrasting management regimes. Proc. Natl. Acad. Sci. 113, 5125–5129. doi: 10.1073/pnas.1520420113
Council on Environmental Quality [CEQ], (2000). Protection of the Environment (Under the National Environment Policy Act). Report No 40 CFR 1500-1517. Washington, D.C: CEQ.
Curtis, K. A., Moore, J. E., and Benson, S. R. (2015). Estimating limit reference points for western Pacific leatherback turtles (Dermochelys coriacea) in the US West Coast EEZ. PLoS One 10:e0136452. doi: 10.1371/journal.pone.0136452
Dichmont, C., and Fulton, E. A. (2017). Fisheries science and participatory management strategy evaluation: eliciting objectives, visions and system models. Dec. Mak. Conserv. Nat. Resour. Manag. 22:19.
Dichmont, C. M., and Brown, I. W. (2010). A case study in successful management of a data-poor fishery using simple decision rules: the queensland spanner crab fishery. Mar. Coast. Fish. 2, 1–13. doi: 10.1577/C08-034.1
Donoso, M., and Dutton, P. H. (2010). Sea turtle bycatch in the chilean pelagic longline fishery in the southeastern pacific: opportunities for conservation. Biol. Conserv. 143, 2672–2684. doi: 10.1016/j.biocon.2010.07.011
Dutton, D. L., Dutton, P. H., Chaloupka, M., and Boulon, R. H. (2005). Increase of a Caribbean leatherback turtle Dermochelys coriacea nesting population linked to long-term nest protection. Biol. Conserv. 126, 186–194. doi: 10.1016/j.biocon.2005.05.013
Dutton, P. H., and Squires, D. (2008). Reconciling biodiversity with fishing: a holistic strategy for pacific sea turtle recovery. Ocean Dev. Int. Law 39, 200–222. doi: 10.1080/00908320802013685
Eckert, K. L. (2012). Synopsis of the Biological Data On The Leatherback Sea Turtle (Dermochelys coriacea). U.S. Department of Interior, Fish and Wildlife Service, Biological Technical Publication BTP-R 4015–2012. Washington, D.C: FAO.
Eckert, S., Gearhart, J., Bergmann, C., and Eckert, K. (2008). Reducing leatherback sea turtle bycatch in the surface drift-gillnet fishery in Trinidad. Bycatch Commun. Newslett. 8, 2–6.
Eckert, S. A., and Eckert, K. L. (2005). Strategic Plan for Eliminating the Incidental Capture and Mortality of Leatherback Turtles in the Coastal Gillnet Fisheries of Trinidad and Tobago: Proceedings of a National Consultation, Port of Spain, Trinidad, 16-18 February 2005, Ministry of Agriculture, Land and Marine Resources, Government of the Republic of Trinidad and Tobago, in Collaboration with the Wider Caribbean Sea Turtle Conservation Network (WIDECAST). Ballwin, MO: WIDECAST.
Eguchi, T., Gerrodette, T., Pitman, R. L., Seminoff, J. A., and Dutton, P. H. (2007). At-sea density and abundance estimates of the olive ridley turtle Lepidochelys olivacea in the eastern tropical Pacific. Endang. Spec. Res. 3, 191–203. doi: 10.3354/esr003191
Environmental Systems Research Institute [ESRI], (2018). ArcMap: Release 10.6.1.9270. Redlands, CA: Environmental Systems Research Institute.
Epperly, S. P., Stokes, L., and Dick, S. (2004). Careful Release Protocols for Sea Turtle Release With Minimal Injury. Silver Spring, MA: NOAA.
Escudero, H. L. (1997). Encuesta Estructural de la Pesquería Artesanal del Litoral Peruano. Peru: Informe del Instituto del Mar del Perú.
Estrella, C. (2007). Resultados Generales De La Segunda Encuesta Estructural de la pesquería Artesanal en El Litoral Peruano Enepa 2004–2005. Informe Del Instituto Del mar del Perú. Peru: Informe del Instituto del Mar del Perú.
Estrella, C., and Swartzman, G. (2010). The peruvian artisanal fishery: changes in patterns and distribution over time. Fish. Res. 101, 133–145. doi: 10.1016/j.fishres.2009.08.007
Ferraro, P. J., and Gjertsen, H. (2009). A global review of incentive payments for sea turtle conservation. Chelon. Conserv. Biol. 8, 48–56. doi: 10.2744/CCB-0731.1
Fletcher, W. (2005). The application of qualitative risk assessment methodology to prioritize issues for fisheries management. ICES J. Mar. Sci. 62, 1576–1587. doi: 10.1016/j.icesjms.2005.06.005
Fletcher, W. J. (2008). “Implementing an ecosystem approach to fisheries management: lessons learned from applying a practical EAFM framework in Australia and the Pacific,” in The Ecosystem Approach to Fisheries’ eds G. Bianchi and H. R. Skjoldal (Rome: FAO), 112–124.
Fletcher, W. J. (2014). Review and refinement of an existing qualitative risk assessment method for application within an ecosystem-based management framework. ICES J. Mar. Sci. 72, 1043–1056. doi: 10.1093/icesjms/fsu142
Fletcher, W. J., Chesson, J., Sainsbury, K., Hundloe, T., and Fisher, M. (2003). National ESD Reporting Framework for Australian Fisheries: The “How To” Guide for Wild Capture Fisheries. Report no: FRDC Project 2000/145. Canberra: ESD.
Flintan, F. (2002). Flip-flops and Turtles-Women’s Participation in the Kiunga National Marine Reserve ICDP, Kenya. Paris: UNESCO.
Food, and Agriculture Organization [FAO] (2009). Guidelines to Reduce Sea Turtle mortality in fishing operations. Rome: Foodand Agriculture Organisation.
Food, and Agriculture Organization [FAO] (2012). The EAF Toolbox: The Ecosystem Approach To Fisheries. Rome: Foodand Agriculture Organisation.
Forsberg, K., Casabonne, F., and Castillo, J. (2012). First evidence of green turtle nesting in Peru. Mar. Turtle Newslet. 133, 9–11.
Friedman, K., Garcia, S., and Rice, J. (2018). Mainstreaming biodiversity in fisheries. Mar. Policy 95, 209–220. doi: 10.1016/j.marpol.2018.03.001
Fulton, E. A. (2001). The Effects Of Model Structure And Complexity On The Behaviour And Performance Of Marine Ecosystem Models. Churchill Ave: University of Tasmania.
Fulton, E. A., Link, J. S., Kaplan, I. C., Savina-Rolland, M., Johnson, P., Ainsworth, C., et al. (2011a). Lessons in modelling and management of marine ecosystems: the Atlantis experience. Fish Fish. 12, 171–188. doi: 10.1111/j.1467-2979.2011.00412.x
Fulton, E. A., Smith, A. D., Smith, D. C., and Johnson, P. (2014). An integrated approach is needed for ecosystem based fisheries management: insights from ecosystem-level management strategy evaluation. PLoS One 9:e84242. doi: 10.1371/journal.pone.0084242
Fulton, E. A., Smith, A. D., Smith, D. C., and Van Putten, I. E. (2011b). Human behaviour: the key source of uncertainty in fisheries management. Fish Fish. 12, 2–17. doi: 10.1111/j.1467-2979.2010.00371.x
Gilman, E., Gearhart, J., Price, B., Eckert, S., Milliken, H., Wang, J., et al. (2010). Mitigating sea turtle by-catch in coastal passive net fisheries. Fish Fish. 11, 57–88. doi: 10.1111/j.1467-2979.2009.00342.x
Gordon, H. S. (1954). “The economic theory of a common-property resource: the fishery,” in Classic Papers in Natural Resource Economics, ed. C. Gopalakrishnan (London: Palgrave Macmillan).
Gray, C. A., and Kennelly, S. J. (2018). Bycatches of endangered, threatened and protected species in marine fisheries. Rev. Fish Biol. Fish. 28, 521–541. doi: 10.1007/s11160-018-9520-7
Griffiths, V. F., Bull, J. W., Baker, J., and Milner-Gulland, E. (2018). Conserv. Biol. 33, 13184. doi: 10.1111/cobi.13184
Guevara-Carrasco, R., and Bertrand, A. (2017). Atlas de la Pesca Artesanal Del Mar Del Perú. Edición IMARPE-IRD. Silver Spring, MA: NOAA.
Hall, M. A., Alverson, D. L., and Metuzals, K. I. (2000). By-catch: problems and solutions. Mar. Pollut. Bull. 41, 204–219. doi: 10.1007/BF00122585
Halpern, B. S. (2003). The impact of marine reserves: do reserves work and does reserve size matter? Ecol. Appl. 13, 117–137.
Halpern, B. S., Gaines, S. D., and Warner, R. R. (2004). Confounding effects of the export of production and the displacement of fishing effort from marine reserves. Ecol. Appl. 14, 1248–1256. doi: 10.1890/03-5136
Halpern, B. S., Klein, C. J., Brown, C. J., Beger, M., Grantham, H. S., Mangubhai, S., et al. (2013). Achieving the triple bottom line in the face of inherent trade-offs among social equity, economic return, and conservation. Proc. Natl. Acad. Sci. U.S.A. 110, 6229–6234. doi: 10.1073/pnas.1217689110
Hanea, A., Mcbride, M., Burgman, M., Wintle, B., Fidler, F., Flander, L., et al. (2016). I nvestigate D iscuss E stimate A ggregate for structured expert judgement. Int. J. Forecast. 33, 267–279. doi: 10.1016/j.ijforecast.2016.02.008
Hazen, E. L., Scales, K. L., Maxwell, S. M., Briscoe, D. K., Welch, H., Bograd, S. J., et al. (2018). A dynamic ocean management tool to reduce bycatch and support sustainable fisheries. Sci. Adv. 4:eaar3001. doi: 10.1126/sciadv.aar3001
Hobday, A., Smith, A., Stobutzki, I., Bulman, C., Daley, R., Dambacher, J., et al. (2011). Ecological risk assessment for the effects of fishing. Fish. Res. 108, 372–384. doi: 10.1016/j.fishres.2011.01.013
International Organization for Standardization [ISO] (2009). Risk Management–Principles And Guidelines. Geneva: International Organization for Standardization.
International Union for Conservation of Nature [IUCN] (2010a). The IUCN Red List Of Threatened Species. Gland: IUCN.
International Union for Conservation of Nature [IUCN] (2010b). Legal FRAMEWORK FOR PROTECTED AREAS: PEru. Gland: IUCN.
Janisse, C., Squires, D., Seminoff, J., and Dutton, P. (2010). “Conservation investments and mitigation: the california drift gillnet fishery and pacific sea turtles,” in Handbook of Marine Fisheries Conservation and Management, eds G. Quentin, R. Hilborn, and D. Squires (Berlin: Springer).
Karagiannakos, A. (1996). Total allowable catch (TAC) and quota management system in the european union. Mar. Policy 20, 235–248. doi: 10.1016/0308-597X(96)86986-7
Karr, K. A., Fujita, R., Carcamo, R., Epstein, L., Foley, J. R., Fraire-Cervantes, J. A., et al. (2017). Integrating science-based co-management, partnerships, participatory processes and stewardship incentives to improve the performance of small-scale fisheries. Front. Mar. Sci. 4:345. doi: 10.3389/fmars.2017.00345
Kelez, S., Velez-Zuazo, X., Angulo, F., and Manrique, C. (2009). Olive ridley Lepidochelys olivacea nesting in Peru: the southernmost records in the Eastern Pacific. Mar. Turtle Newslett. 126, 5–9.
Lee Lum, L. (2006). Assessment of incidental sea turtle catch in the artisanal gillnet fishery in Trinidad and Tobago, West Indies. Appl. Herpetol. 3, 357–368. doi: 10.1163/157075406778905081
Lester, S. E., Halpern, B. S., Grorud-Colvert, K., Lubchenco, J., Ruttenberg, B. I., Gaines, S. D., et al. (2009). Biological effects within no-take marine reserves: a global synthesis. Mar. Ecol. Prog. Ser. 384, 33–46. doi: 10.3354/meps08029
Lewison, R. L., Johnson, A. F., and Verutes, G. M. (2018). Embracing complexity and complexity-awareness in marine megafauna conservation and research. Front. Mar. Sci. 5:207. doi: 10.3389/fmars.2018.00207
Marchal, P., Andersen, J. L., Aranda, M., Fitzpatrick, M., Goti, L., Guyader, O., et al. (2016). A comparative review of fisheries management experiences in the European Union and in other countries worldwide: Iceland, Australia, and New Zealand. Fish Fish. 17, 803–824. doi: 10.1111/faf.12147
Maron, M., Ives, C. D., Kujala, H., Bull, J. W., Maseyk, F. J., Bekessy, S., et al. (2016). Taming a wicked problem: resolving controversies in biodiversity offsetting. Bioscience 66, 489–498. doi: 10.1093/biosci/biw038
Mazaris, A. D., Schofield, G., Gkazinou, C., Almpanidou, V., and Hays, G. C. (2017). Global sea turtle conservation successes. Sci. Adv. 3:e1600730. doi: 10.1126/sciadv.1600730
Milner-Gulland, E. J., Garcia, S. M., Arlidge, W. N. S., Bull, J. W., Charles, T., Dagorn, L., et al. (2018). Translating the terrestrial mitigation hierarchy to marine megafauna bycatch. Fish Fish. 19, 547–561. doi: 10.1111/faf.12273
Morales, V. R., and Vargas, P. (1996). Legislation protecting marine turtles in Peru. Mar. Turtle Newslett. 75, 22–23.
Niner, H. J., Ardron, J. A., Escobar, E. G., Gianni, M., Jaeckel, A., Jones, D. O. B., et al. (2018). Deep-Sea Mining With No Net Loss of Biodiversity – An Impossible Aim. Front. Mar. Sci. 5:53. doi: 10.3389/fmars.2018.00053
Ortiz, N., Mangel, J. C., Wang, J., Alfaro-Shigueto, J., Pingo, S., Jimenez, A., et al. (2016). Reducing green turtle bycatch in small-scale fisheries using illuminated gillnets: The Cost of Saving a Sea Turtle. Mar. Ecol. Prog. Ser. 545, 251–259. doi: 10.3354/meps11610
Peckham, S. H., Lucero-Romero, J., Maldonado-Díaz, D., Rodríguez-Sánchez, A., Senko, J., Wojakowski, M., et al. (2016). Buoyless nets reduce sea turtle bycatch in coastal net fisheries. Conserv. Lett. 9, 114–121. doi: 10.1111/conl.12176
Quiñones, J., Quispe, S., and Galindo, O. (2017). Illegal capture and black market trade of sea turtles in Pisco. Peru: the never-ending story. Latin Am. J. Aquat. Res. 45, 615–621.
R Core Team, (2019). R: A Language and Environment for Statistical Computing. Vienna: R Foundation for Statistical Computing.
Rainey, H. J., Pollard, E. H., Dutson, G., Ekstrom, J. M., Livingstone, S. R., Temple, H. J., et al. (2015). A review of corporate goals of no net loss and net positive impact on biodiversity. Oryx 49, 232–238. doi: 10.1017/S0030605313001476
Richard, J., and Hughes, D. (1972). Some observations of sea turtle nesting activity in Costa Rica. Mar. Biol. 16, 297–309. doi: 10.1007/BF00347753
Santidrián-Tomillo, P., Robinson, N. J., Fonseca, L. G., Quirós-Pereira, W., Arauz, R., Beange, M., et al. (2017). Secondary nesting beaches for leatherback turtles on the Pacific coast of Costa Rica. Latin Am. J. Aquat. Res. 45, 563–571. doi: 10.3856/vol45-issue3-fulltext-6
Seminoff, J. A., Allen, C. D., Balazs, G. H., Dutton, P. H., Eguchi, T., Haas, H., et al. (2015). Status Review of the Green Turtle (Chelonia Mydas) Under The Engangered Species Act. Silver Spring, MA: NOAA.
Shumway, N., Watson, J. E. M., Saunders, M. I., and Maron, M. (2018). The risks and opportunities of translating terrestrial biodiversity offsets to the marine realm. Bioscience 68, 125–133. doi: 10.1093/biosci/bix150
Smith, A. (1993). Risk assessment or management strategy evaluation: what do managers need and want. ICES 500:18.
Smith, A. (1994). “Management strategy evaluation: the light on the hill,” in Psroceedings of the Population Dynamics for Fisheries Management, Australian Society for Fish Biology Workshop, Perth, WA.
Smith, A., Sachse, M., Smith, D., Prince, J., Knuckey, I., Baelde, P., et al. (2004). Alternative Management Strategies For The Southern And Eastern Scalefish And Shark Fishery–Qualitative Assessment Report. Canberra: Australian Fisheries Management Authority.
Snoddy, J. E., and Williard, A. S. (2010). Movements and post-release mortality of juvenile sea turtles released from gillnets in the lower Cape Fear River, North Carolina, USA. Endang. Spec. Res. 12, 235–247. doi: 10.3354/esr00305
Spotila, J. R., Reina, R. D., Steyermark, A. C., Plotkin, P. T., and Paladino, F. V. (2000). Pacific leatherback turtles face extinction. Nature 405:529. doi: 10.1038/35014729
Squires, D., Campbell, H., Cunningham, S., Dewees, C., Grafton, R. Q., and Herrick, Jr., et al. (1998). Individual transferable quotas in multispecies fisheries. Mar. Policy 22, 135–159. doi: 10.1016/S0308-597X(97)00039-0
Squires, D., and Garcia, S. (2018). The least-cost biodiversity impact mitigation hierarchy with a focus on marine fisheries and bycatch issues. Conserv. Biol. 32, 989–997. doi: 10.1111/cobi.13155
Squires, D., Restrepo, V., Garcia, S., and Dutton, P. (2018). Fisheries bycatch reduction within the least-cost biodiversity mitigation hierarchy: conservatory offsets with an application to sea turtles. Mar. Policy 93, 55–61. doi: 10.1016/j.marpol.2018.03.018
Squires, D., Sun, C., Hilger, J., Chan, V., Helvey, M., Herrick, S., et al. (2016). Conservation of Global Public Goods: The Endangered Species Act and Pacific sea turtles, U.S. Department of Commerce Southwest Fisheries Science Center Working Paper. La Jolla, CA: NOAA.
Standards Australia, (2000). Environmental Risk Management: Principles and Process. Based on AS/NZS 4360:1999, Risk Management. Report no: HB 203-2000. Homebush, NSW: Standards Australia.
Standards Australia, (2004). Risk Management Guidelines: Companion to AS/NZS 4360: 2004. Homebush, NSW: Standards Australia.
Suuronen, P., and Gilman, E. (2019). Monitoring and managing fisheries discards: New technologies and approaches. Mar. Policy 24:103554. doi: 10.1016/j.marpol.2019.103554
Troëng, S., and Rankin, E. (2005). Long-term conservation efforts contribute to positive green turtle Chelonia mydas nesting trend at Tortuguero. Costa Rica. Biol. Conserv. 121, 111–116. doi: 10.1016/j.biocon.2004.04.014
United Nations Environment Programme World Conservation Monitoring Centre [UNEP-WCMC], and International Union for Conservation of Nature [IUCN], (2016). United Nations Environment Programme World Conservation Monitoring Centre [UNEP-WCMC] Protected Planet Report 2016. Cambridge: International Union for Conservation of Nature.
Valverde, L. (2001). Expert Judgment Resolution In Technically-Intensive Policy Disputes In Assessment And Management Of Environmental Risks. Berlin: Springer.
Wallace, B. P., Dimatteo, A. D., Hurley, B. J., Finkbeiner, E. M., Bolten, A. B., Chaloupka, M. Y., et al. (2010a). Regional management units for marine turtles: a novel framework for prioritizing conservation and research across multiple scales. PLoS one 5:e15465. doi: 10.1371/journal.pone.0015465
Wallace, B. P., Lewison, R. L., Mcdonald, S. L., Mcdonald, R. K., Kot, C. Y., Kelez, S., et al. (2010b). Global patterns of marine turtle bycatch. Conserv. Lett. 3, 131–142. doi: 10.1111/j.1755-263X.2010.00105.x
Wallace, B. P., Tiwari, M., and Girondot, M. (2013). Dermochelys coriacea (East Pacific Ocean Subpopulation). The IUCN Red List of Threatened Species 2013: e.T46967807A46967809. Available at: http://dx.doi.org/10.2305/IUCN.UK.2013-2.RLTS.T46967807A46967809.en [accessed March 2018].
Wang, J., Barkan, J., Fisler, S., Godinez-Reyes, C., and Swimmer, Y. (2013). Developing ultraviolet illumination of gillnets as a method to reduce sea turtle bycatch. Biol. Lett. 9:20130383. doi: 10.1098/rsbl.2013.0383
Wolf, S., Hartl, B., Carroll, C., Neel, M. C., and Greenwald, D. N. (2015). Beyond PVA: why recovery under the Endangered Species Act is more than population viability. Bioscience 65, 200–207. doi: 10.1093/biosci/biu218
Wyneken, J., Lohmann, K. J., and Musick, J. A. (2013). The Biology Of Sea Turtles, CRC press: Boca Raton, FL.
Keywords: bycatch, fisheries management, management strategy evaluation, risk assessment, social-ecological system, structured decision-making, turtles
Citation: Arlidge WNS, Squires D, Alfaro-Shigueto J, Booth H, Mangel JC and Milner-Gulland EJ (2020) A Mitigation Hierarchy Approach for Managing Sea Turtle Captures in Small-Scale Fisheries. Front. Mar. Sci. 7:49. doi: 10.3389/fmars.2020.00049
Received: 22 May 2019; Accepted: 27 January 2020;
Published: 14 February 2020.
Edited by:
Mark Meekan, Australian Institute of Marine Science (AIMS), AustraliaReviewed by:
Luis Cardona, University of Barcelona, SpainKathryn D. Bisack, National Marine Fisheries Service (NOAA), United States
Copyright © 2020 Arlidge, Squires, Alfaro-Shigueto, Booth, Mangel and Milner-Gulland. This is an open-access article distributed under the terms of the Creative Commons Attribution License (CC BY). The use, distribution or reproduction in other forums is permitted, provided the original author(s) and the copyright owner(s) are credited and that the original publication in this journal is cited, in accordance with accepted academic practice. No use, distribution or reproduction is permitted which does not comply with these terms.
*Correspondence: William N. S. Arlidge, william.arlidge@zoo.ox.ac.uk; william.arlidge@gmail.com