Transparent Oxyfluoride Nano-Glass Ceramics Doped with Pr3+ and Pr3+–Yb3+ for NIR Emission
 Giulio Gorni
 Alessandro Cosci
 Stefano Pelli
 Laura Pascual
 Alicia Durán
 M. J. Pascual
- 1Instituto de Cerámica y Vidrio, Consejo Superior de Investigaciones Científicas (CSIC), Madrid, Spain
- 2Microdevices for Photonics Laboratory (MIP-LAB), Istituto di Fisica Applicata “Nello Carrara”, Consiglio Nazionale delle Ricerche (CNR), Sesto Fiorentino, Italy
- 3Museo Storico della Fisica e Centro Studi e Ricerche Enrico Fermi, Roma, Italy
- 4Instituto de Catálisis y Petroleoquímica, Consejo Superior de Investigaciones Científicas (CSIC), Madrid, Spain
Pr3+–Yb3+ co-doped oxyfluoride glasses and glass-ceramics (GCs) containing LaF3 nanocrystals have been prepared to obtain NIR emission of Yb3+ ions upon Pr3+ excitation in the blue region of the visible spectrum. Two different compositions have been tested: 0.1–0.5 Pr–Yb and 0.5–1 Pr–Yb, in addition to Pr3+ singly doped samples. The crystallization mechanism of the nano-GCs was studied by differential thermal analysis revealing that it occurs from a constant number of nuclei, the crystal growth being limited by diffusion. High-resolution transmission microscopy demonstrated that phase separation acts as precursor for LaF3 crystallization and a detailed analysis of the chemical composition (EDXS) revealed the enrichment in RE3+ ions inside the initial phase separated droplets, from which the LaF3 crystals are formed. The RE3+ ions incorporation inside LaF3 crystals was also proved by photoluminescence measurements showing Stark splitting of the RE3+ ions energy levels in the glass-ceramic samples. Lifetime measurements showed the existence of a better energy transfer process between Pr3+ and Yb3+ ions in the GCs compared to the as made glass. The highest value of energy transfer efficiency is 59% and the highest theoretical quantum efficiency is 159%, obtained for GCs 0.1–0.5 Pr–Yb treated at 620°C for 40 h.
Introduction
Solar green energy is one of the emerging fields where rare earth (RE) ions are intensively used to improve silicon solar cells (SSCs) efficiency. In fact, the most important routes to reduce costs and promote the use of solar energy are: decrease refining and crystallization cost of silicon (the most widely used semiconductor), to use less silicon (thinner cells), developing thin films solar cells of less expensive materials (organic, polymeric) and/or improving SSCs efficiency.
Currently, many efforts are focused in the modification of the photovoltaic (PV) cells to make them more efficient. The main problem to improve PV energy conversion efficiency is associated with the spectral mismatch between the energy distribution of photons in the incident solar spectrum and the band-gap of silicon (Huang et al., 2013). Therefore, in the last years, solar down-converter materials doped with RE ions, able to convert the blue part of the solar spectrum to the range 980–1050 nm, where silicon presents the best response, are becoming increasingly important (Trupe et al., 2002; Richards, 2006; van der Ende et al., 2009).
According to Abrams et al. (2011), a theoretical improvement of SSCs could be as high as 7% for an ideal lossless system; however, improvements (even though smaller than 7%) could be reached with a properly engineered solar converter layer.
Among the converter materials, glasses and glass-ceramics (GCs) for PV application are increasingly important thanks to their relatively easy production and engineering and their capability of hosting a great variety of RE ions in different concentrations.
Oxyfluoride nano-GCs containing luminescent RE ions have been extensively studied for their good mechanical and optical properties. Oxyfluoride nano-GCs are very attractive host materials, because they combine the very low phonon energy of fluoride nano-crystals environment, especially LaF3 (<450 cm–1). They are able to host Ln3+ ions giving rise to high quantum efficiencies, with the high chemical and mechanical stability of a silicate glass matrix (de Pablos-Martín et al., 2012).
This paper describes the structural and optical properties of LaF3 containing GCs doped with Pr3+ and Pr3+–Yb3+ of composition 55SiO2–20Al2O3–15Na2O–10LaF3 (mol%) produced by melting-quenching (MQ). The properties of the un-doped glass system have been extensively studied elsewhere (Bhattacharyya et al., 2009; Hemono et al., 2009; de Pablos-Martín et al., 2011).
There are many published examples of different glass systems and crystalline phases studied for solar application with Pr3+–Yb3+. Indeed, we have chosen doping concentrations also relying on literature.
Chen et al. (2008) studied β-YF3 containing GCs doped with 0.1 Pr3+ and 0.1–1.5 Yb3+ (mol %), obtaining the highest Yb3+ emission for 1.0 Yb3+ while for 1.5 Yb3+ a quenching effect was observed. The corresponding energy transfer efficiency (ETE) and quantum efficiency (QE) were 90 and 190%, respectively.
Lakshminarayana and Qiu (2009) studied Pr–Yb down-conversion (DC) in oxyfluoride germanate glasses made by MQ and doped with 0.5 Pr3+ and 2–30 Yb3+ (mol %). The highest DC signal at 980 nm was measured for the 0.5 Pr3+–4 Yb3+ but the 0.5 Pr3+–2 Yb3+ produced almost as good results. Pr3+ lifetimes at 608 nm were 9.5 and 4.9 µs and the ETE 35 and 66% for 2 and 4Yb3+, respectively.
Chen et al. (2012) and Zhou et al. (2012) characterized oxyfluoride GCs containing CaF2 nanocrystals. Chen et al. (2012) prepared materials with composition 45SiO2–25Al2O3–10Na2O–20CaF2–0.1PrF3–yYbF3 (y = 0.1–1.0) (mol%). The NIR emission suffered quenching for 1 Yb3+ and the most intense signal was obtained for 0.5Yb3+. The decay curve of Pr3+:3P0–3H6 at 610 nm was measured and the lifetime for 0.5 Yb3+ was 78 µs, and the ETE and QE were 53 and 153%, respectively. Zhou et al. (2012) studied the compositions 60SiO2–20Al2O3–20CaF2:0.4Pr3+/xYb3+ (x = 0, 1, 2, and 4) (mol%). For Yb3+ concentrations higher than 1 mol% a quenching of Yb3+ emission at 980 nm was measured and for 1 Yb3+ the QE was 158%. The authors also tested a c-Si solar cell covered by the doped samples and measured a decrease compared with that covered by a host glass. Their conclusion was that a more efficient solar cell could be obtained by a proper ion doping concentration, an optimized sample thickness and the introduction of an antireflection film on the interface air-glass interface as well as the introduction of a waveguide structure on the DC layer to reduce emission losses.
Katayama studied the DC process of Pr–Yb in oxyfluoride glasses (Katayama and Tanabe, 2010a,b) and in SrF2 GCs [Katayama and Tanabe, 2010a,b (p. 2); Katayama and Tanabe, 2013] with variable Yb3+ concentration: 0.1 Pr3+–xYb3+ (x = 0–2.9) obtaining the best DC emission for the highest Yb3+ concentration. The ETE from the Pr3+:3P0 to Yb3+:2F5/2 increases from 42% for the glass to 75% for GCs, and the main ET process is a two-step process with Yb3+ and Pr3+ emission at 980 and 1300 nm, respectively. Pr3+ emission at 1300 nm was more quenched, due to phonons, than in SrF2-containing GCs.
Gao and Wondraczek (2013) obtained DC in boro-aluminosilicate glasses and LaBO3 GCs doped with 1 Pr3+–xYb3+ (x = 0.1–5). The best DC signal at 980 nm was obtained for 0.5 Yb3+, the signal being quenched for higher concentrations, and the maximum value of the QE, obtained for 5 Yb3+, was 183%.
Among all the studied materials there are a few examples regarding LaF3-containing GCs doped with RE for DC produced by MQ, from which we point out the work of Xu et al. (2011) dealing with oxyfluoride GCs doped with Pr3+–Yb3+ of composition 40SiO2–30Al2O3–18Na2O–12LaF3 (mol%). However, in the work of Xu, the most relevant conclusions are as follows: (1) Pr3+ ions are preferentially incorporated inside LaF3 crystals, as shown by the increase of Pr3+ emission at 600 nm in GCs compared to glass and (2) on the contrary Yb3+ ions are not hosted inside LaF3; therefore, the precipitation of LaF3 crystals cannot improve the ET between Pr3+ and Yb3+.
Another study of LaF3 crystals for DC emission is due to Deng et al. (2011) who studied crystalline powders of LaF3 doped with Pr3+–Yb3+ prepared by co-precipitation method using La3+, Pr3+, and Yb3+ as nitrates and NH4HF2 as fluorine source. For a fixed Pr3+ concentration of 0.5 mol% several Yb3+ concentrations were tested. With the increase of Yb3+ concentration the visible emission from Pr3+ weakens monotonically, while the NIR emission of Yb3+ intensifies. However, a decrease of the Yb3+ emission occurs for concentrations higher than 3%.
Xiang et al. (2014) studied Pr3+–Yb3+ doped β-NaLuF4 hexagonal nanoplates with a size of 250 nm × 110 nm, synthesized by a solvo-thermal process. The ET from Pr3+ ions to Yb3+ ions occurs only by a two-step ET process when the Yb3+ concentration is very low; however, increasing the Yb3+ concentration, a cooperative ET process occurs for Yb3+ concentration as high as 20 mol%.
Furthermore, there are many publications about spectroscopic characterization of RE ions doped materials for DC, but very few papers exist where a correlation between optical properties and material processing is made.
In this paper, glasses and GCs of composition 55SiO2–20Al2O3–15Na2O–10LaF3 (mol%) doped with 0.1 Pr3+, 0.5 Pr3+, 0.1–0.5 Pr3+–Yb3+, and 0.5–1 Pr3+–Yb3+ have been prepared. The structural properties of the materials have been studied by differential thermal analysis (DTA), X-ray diffraction (XRD), TEM and the optical properties by UV–VIS Absorption, photoluminescence (PL), and lifetime decay. The differences of the DC properties of the samples are described and the relationship of material processing with the optical properties is given.
Materials and Methods
Glass Melting and Crystallization
Oxyfluoride glasses with composition 55SiO2–20Al2O3–15Na2O–10LaF3 (mol%) (55Si–10La) have been prepared by melting reagent grade SiO2 sand (Saint-Gobain, Aviles, Spain, 99.6%), Al2O3 (Panreac), Na2CO3 (Sigma-Aldrich, >99.5%), LaF3 (Alfa Aesar, 99.99%). Pr3+ and Yb3+ were added as fluorides (Alfa Aesar, 99.99%) in 0.1–0.5 and 0.5–1 concentrations (mol%). Samples doped with only Pr3+ were also prepared for comparison of the optical properties. A more complete description of glass preparation was given in (de Pablos-Martín et al., 2011).
Al2O3 was previously annealed at 800°C for 12 h. Batch materials were weighed to obtain 100 g of glass, mixed for 1 h to ensure a good homogenization, put in a covered Pt crucible and annealed for 2 h at 1200°C. The Pt crucible was then placed in an elevator furnace for 1.5 h at 1650°C, the molten glasses were quenched in air onto a brass mold, fused again for 30 min to improve homogeneity and quenched onto a cold (−10°C) brass mold. The glasses were annealed at 600°C for 30 min for stress relaxation.
Glass-ceramics were obtained by heat treatment at 620°C for 1, 3, 5, 20, 40, and 80 h and at 660 and 680°C for 20 h. In all the cases, a heating rate of 10°C/min was used followed by quenching in air.
Heat treatments were performed on bulk specimens (size 1–1.25 mm).
DTA and Crystallization Mechanism
Non-isothermal crystallization kinetics was studied by DTA/TG (SDT Q600—TA Instruments). Measurements have been performed on 20–30 mg of glass with particles size between 1 and 1.25 mm to reproduce bulk conditions. DTA scans were carried out with heating rates in the range 10–60°C/min.
The glass transition temperature Tg, crystallization activation energy Ea, and Avrami parameters (n, m) were calculated from DTA measurements.
The Avrami parameter n allows assessing the crystallization process and was obtained employing the Ozawa equation (Ozawa, 1970):
where x is the partial area of the crystallization peak calculated for a fixed temperature T and q is the heating rate. By using the Kissinger equation (Kissinger, 1956) the crystallization activation energy Ea was obtained by
where Tp, R, and C are the crystallization peak temperature, the gas constant and a constant, respectively. Finally, the m parameter, representing the growth dimensionality, was obtained by the Matusita equation (Matusita and Sakka, 1980):
X-Ray Diffraction
The heat-treated samples were milled and sieved (< 63 μm) and characterized by XRD with a Bruker D8 Advance diffractometer. Diffractograms were acquired in the rage 10 ≤ 2θ ≤ 70° with a step size of 0.02° and 1 s acquisition for each step. Crystals size, D, was estimated using the Scherrer equation (Eq. 4), where λ is the wavelength (1.54056 Å—CuKα1), Bm the full width at half maximum of the LaF3 peak (111) and θ its diffraction angle. The factor 0.94 corresponds to spherical crystals. Pseudo-Voigt function has been used to fit diffraction peak parameters. The instrumental broadening Bi has been also taken into account using NaF powder properly milled and sieved (<63 μm):
Crystalline growth can be described by the following equation:
where r is the crystal radius, U the crystal growth rate, t the time, and p a growth exponent. The logarithmic form of Eq. 5 is commonly used:
High-Resolution Transmission Microscopy (HRTEM)
TEM samples of glasses and GCs were prepared by cutting slices, plane parallel grinding, dimpling to a residual thickness of 10–15 µm, and ion-beam thinning using Ar+ ions. The angle of incidence was set to 8°, the beam energy to 5 kV, current to 5 mA, and milling time to 10–14 h. HRTEM including scanning transmission microscopy-high angle annular dark field and energy dispersive X-ray spectroscopy (EDXS) were performed with a JEOL 2100 field emission gun transmission electron microscope operating at 200 kV and providing a point resolution of 0.19 nm. The microscope was equipped with an energy dispersive X-ray spectrometer (EDXS—INCA x-sight, Oxford Instruments). EDXS analysis was performed in STEM mode, with a probe size of ca. 1 nm. In order to determine the particle distribution, we first assumed the particles to be spheres. No high contrast was obtained when working in the Scherzer focus, the shape of the particles was not well defined and difficult to measure. Thus, slightly under-focused TEM images were used to solve this problem. HAADF-STEM images were obtained where the particle shape was more distinguishable, and it is possible to measure the average diameter of the particles. By this method, only well-defined particles were measured which still resulted in a statistically well-representative data collection.
Optical Properties
Bulk specimens were cut from the annealed glass and heat treated to obtain glass-ceramic materials. 0.1 Pr and 0.1–0.5 Pr–Yb glasses were treated at 620°C for 20 h and 40 h, and at 660°C for 20 h. 0.5 Pr and 0.5–1 Pr–Yb glasses were treated at 620°C for 40 h and 660°C for 20 h. All the samples have been polished and optically characterized by UV–VIS absorption and PL spectroscopy.
UV–VIS spectra (Lambda 950—Perkin Elmer) were acquired between 300–2200 nm.
A photomultiplier tube (PMT) R6872 for UV–VIS and a Peltier cooled PbS for NIR detection were used as detectors.
A lock-in (5210-Princeton Research Instrument) configuration with an InGaN led at 435 nm (Roithner) as source for Pr3+ excitation and a fiber laser at 976 nm to excite Yb3+ ions was used to obtain PL spectra. A 2 × 2 mm2 spot was produced with a lens focusing system and the samples were excited on the side edge to reduce re-absorption processes. Emission spectra were collected by an iHR-320 (Jobin-Yvon) spectrometer equipped with two gratings: 1200 g/mm blazed at 500 nm, and 600 g/mm blazed at 1000 nm. The detection system was calibrated using an incandescence lamp with known emission spectrum. A S-20 PMT and an InGaAs PD were used for UV–VIS and IR detection, respectively. Finally, all PL spectra were properly corrected for the instrument response.
Lifetime decay curves, upon excitation at 435 nm, were acquired with a fast oscilloscope (Tektronix), and the source was modulated electronically by a controller (ITC4000-Thorlabs).
For no single exponential decay, lifetimes were calculated using the following formula:
The ETE and the QE were calculated using the following equations:
where τPr and τPr/Yb are the Pr3+ lifetime, corresponding to the same excited state level, in doped and co-doped samples, while ηPr and ηYb are the Pr3+ and Yb3+ QEs.
Results and Discussion
DTA and Crystallization Mechanism
Differential thermal analysis curves and the variation of glass transition temperature (Tg), crystallization starting temperature (Tx), and crystallization peak temperature (Tp), with the heating rate are given in Figures 1A,B for the samples doped with 0.1–0.5 Pr–Yb.
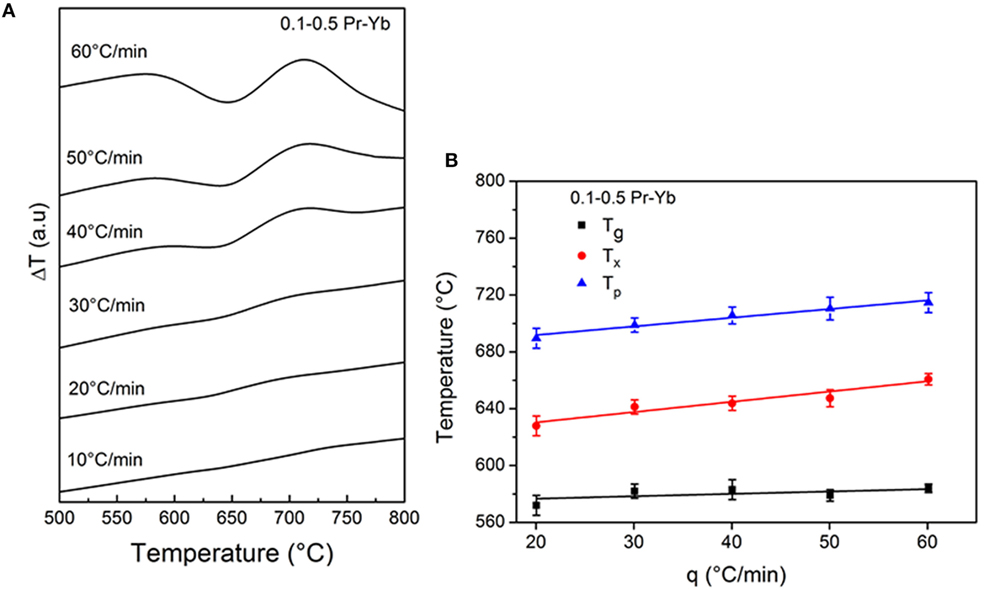
Figure 1. (A) Differential thermal analysis curves for 0.1–0.5 Pr–Yb glass performed at heating rates 10–60°C/min. (B) Variation of the glass transition temperature (square), crystallization starting temperature (circle), and LaF3 crystallization peak temperature (triangle) with the heating rate.
It was not possible to estimate Tg, Tx, Tp from DTA curves performed at heating rate of 10°C/min due to very small endothermic peak (Tg) and exothermic peak (Tx, Tp) corresponding to LaF3 crystallization. For 0.5–1 Pr–Yb doped glass the first values were obtained from a heating rate of 30°C/min.
The stability parameter, defined as ΔT = Tp − Tg, is 114°C for both co-doped glasses for a heating rate of 10°C/min (calculated by extrapolation from the fits). The variation of Tx and Tp with the heating rate is faster than that of Tg, as confirmed by the slope parameter α in the equation T = αq, summarized in Table 1. The calculated Tg for a heating rate of 10°C/min are 570°C for 0.1–0.5 Pr–Yb and 585°C for 0.5–1 Pr–Yb. Higher Tx and Tp values indicate a delay of the crystallization onset for materials with higher concentration of dopants.
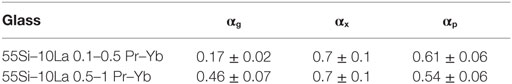
Table 1. Coefficients α (min) from the lines T = α, q for the glass transition temperature (Tg), crystallization starting temperature (Tx), and crystallization peak temperature (Tp).
By using Eq. 2, crystallization activation energies were calculated and their values are (329 ± 16) kJ/mol and (342 ± 18) kJ/mol for 0.1–0.5 Pr–Yb and 0.5–1 Pr–Yb, respectively. These results are similar to those obtained for the un-doped (de Pablos-Martín et al., 2011) and Tm3+ doped glass (de Pablos-Martín et al., 2013), Avrami n parameter was calculated, using Eq. 1, from the slope of each line; a n mean value was obtained from the slope of the five lines represented in Figures 2A,B for 0.1–0.5 Pr–Yb and 0.5–1 Pr–Yb, respectively. By substituting the calculated crystallization activation energy into the Matusita equation (Eq. 3) and plotting the left side of Eq. 3 as a function of Ea/RTp, the m parameter has been obtained from the slope of the lines represented in Figures 2C,D.
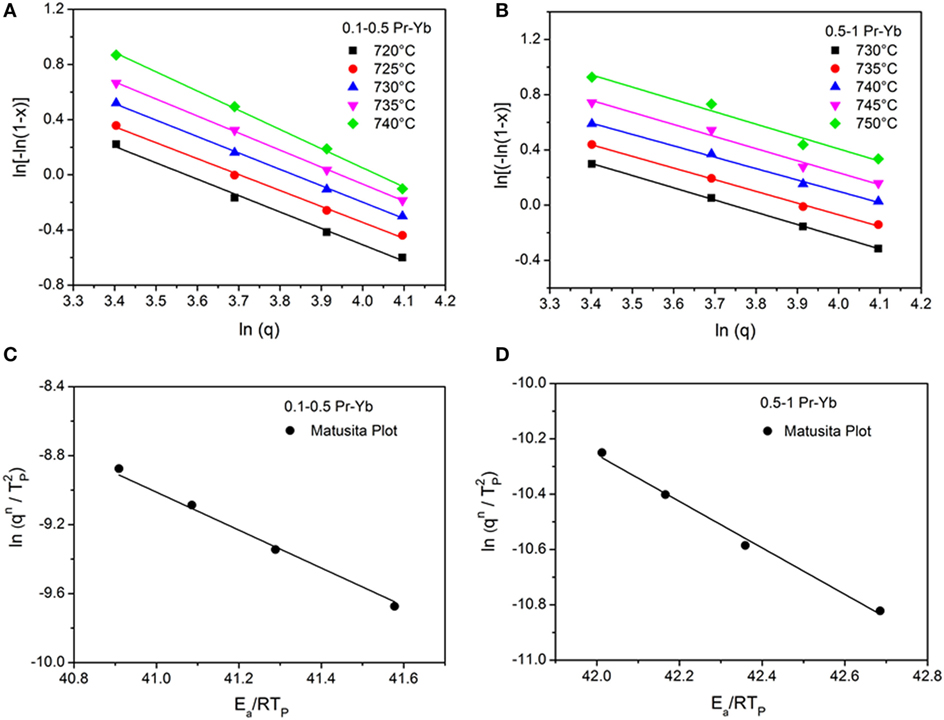
Figure 2. Ozawa plot for (A) 0.1–0.5 Pr–Yb and (B) 0.5–1 Pr–Yb doped glass. (C) Matusita plot for 0.1–0.5 Pr–Yb and (D) 0.5–1 Pr–Yb doped glass.
For 0.1–0.5 Pr–Yb, n = 1.23 ± 0.08 and m = 1.2 ± 0.1, while for 0.5–1 Pr–Yb n = 0.86 ± 0.08 and m = 0.84 ± 0.08. The two values of (n, m) for each composition are the same within uncertainties. The higher value obtained for the 0.1–0.5 Pr–Yb glass could be interpreted considering that the crystallization process is faster than for the 0.5–1 Pr–Yb glass. These parameters can be approximated to the nearest integer or semi-odd integer resulting in n = 1 and m = 1 for both materials. This means that the use of Kissinger equation is valid for the calculation of the crystallization activation energy and corresponds to a volumetric crystallization with crystal growth controlled by diffusion (Donald, 2004). The same (n, m) parameters were also obtained for the un-doped glass and for Tm3+ doped glass (de Pablos-Martín et al., 2013), confirming that dopants do not affect the crystallization mechanism but may affect the crystallization kinetics and influence LaF3 crystals size.
X-Ray Diffraction
X-ray diffraction measurements for GCs 0.1–0.5 Pr–Yb treated at 620°C for 1, 3, 5, 20, 40, and 80 h are given in Figure 3A, while diffractograms for heat treatment at 620, 660, and 680°C for 20 h are compared in Figure 3B. Very similar diffractograms have been obtained for GCs 0.5–1 Pr–Yb and are not represented.
Figure 3. Diffractograms for glass-ceramics (GCs) 0.1–0.5 Pr–Yb treated at (A) 620°C for 1, 3, 5, 20, 40, and 80 h and at (B) 620, 660, and 680°C for 20 h. All diffractograms have been labeled by their Miller indices and the LaF3 reference peaks are shown in the bottom. (C) Crystal size variation with the treatment time or temperature for GC 0.1–0.5 Pr–Yb treated at 620°C (square) during 1, 3, 5, 20, 40, 80 h, 660°C (circle) and 680°C (triangle) for 20 h. (D) Crystal growth p exponent for GCs treated at 620°C during 1, 3, 5, 20, 40, and 80 h.
In all the cases, LaF3 was the only appearing crystalline phase confirmed by the reference (JCPDS 32-0483). All the distinguishable peaks of the diffraction pattern were labeled by Miller indexes. Crystals size was estimated using the generalized Scherrer equation (Eq. 4), to take into account the instrumental broadening, applied to LaF3 (111) peak (2θ ≈ 27.5°).
Crystal growth exponent p has been estimated by Eq. 6. Figure 3C shows crystal size variation with treatment time, and Figure 3D shows the crystal growth exponent p for GCs 0.1–0.5 Pr–Yb.
For GCs, 0.1–0.5 Pr–Yb crystals size at 620°C, shown in Figure 3C, is almost constant ≈12 nm for different treatment times, while treating the samples at different temperatures for the same time of 20 h, crystals size shows important changes. The increase of crystals size at higher temperature is indicated by the more intense diffraction peaks and by the narrowing of the peaks. At 660°C, crystals size is ≈14 nm and at 680°C ≈ 26 nm. As a consequence, for the heat treatment at 680°C, 20 h, the material partially lost its transparency due to quite bigger crystals. In fact, even though crystals are still quite small, the phase separation droplets containing several crystals inside have quite bigger sizes (as it will be shown in next section—Section “TEM”), ranging from an average value of 37 nm at 620°C up to ≈100 nm at 680°C. The GC starts to loose transparency at temperatures higher than 660°C. Moreover, temperatures higher than the glass softening temperature, ≈670°C, are not useful for practical purpose.
Glass-ceramics 0.5–1 Pr–Yb treated at 620°C, 1 h are almost amorphous and crystal size stabilizes to a constant value, around 11 nm, for treatments longer than 3 h. The onset of crystallization is delayed compared to GCs doped with 0.1–0.5 Pr–Yb, and this is associated with the higher activation energy (342 kJ/mol vs 329 kJ/mol). This is related to the nucleating effect of fluorides which promotes the production of smaller nuclei compared to what happens with lower fluoride content, according to which smaller nuclei should be favored. In fact, it is known that fluorine content in oxyfluoride glasses acts as a nucleating agent and suppresses crystal growth by increasing nuclei quantity (Chen et al., 2007; Bhattacharyya et al., 2009).
Pr3+ singly doped samples showed very similar behavior and only LaF3 crystals precipitate in the glass matrix, and the crystals size is similar to the one obtained for the co-doped samples.
The calculation of p exponents was carried out using Eq. 6, starting from plots of crystals size for GCs treated at 620°C for 20 h. Data are plotted in Figure 3D for GCs 0.1–0.5 Pr–Yb. The crystal growth exponent at 620°C is p = 0.040 ± 0.005, while for GCs 0.5–1 Pr–Yb the p exponent is p = 0.03 ± 0.01. The very small dependence of crystal growth on the time of heat treatment together with small values for crystal growth exponent p, indicates the presence of an inhibition phenomenon explained in detail in Bhattacharyya et al. (2009) and de Pablos-Martín et al. (2011, 2012). These previous studies showed that La and Si-enriched phase separation droplets are precipitated already during the preparation of the initial glass. Upon conversion of the glass into a nano-GCs by appropriate annealing, LaF3 nano-crystals are formed within these droplets. Similar results have been obtained in this work as shown in Section “TEM.”
TEM
Figure 4A shows a TEM image of the 0.1–0.5 Pr–Yb glass. The starting glass presents phase separation with a narrow size distribution of the droplets between 15–40 nm and an average droplets size of 28 nm (Figure 4B). The majority of the droplets do not present any structure inside. However, in very few droplets, small crystalline domains of 5–7 nm in size have been also detected, but this incipient crystallinity in the base glass is not detectable by XRD. The chemical composition along 80 nm scanning line (Figure 4C) was measured by EDXS and represented in Figure 4D. The droplets are enriched in F, La, Pr and Yb, a clear evidence of RE incorporation inside the droplets. Furthermore, excess of Si and Al are relocated toward the periphery of the droplets, and the formation of a barrier enriched in glass formers prevent further crystal growth, during the crystallization process, due to the increase of viscosity.
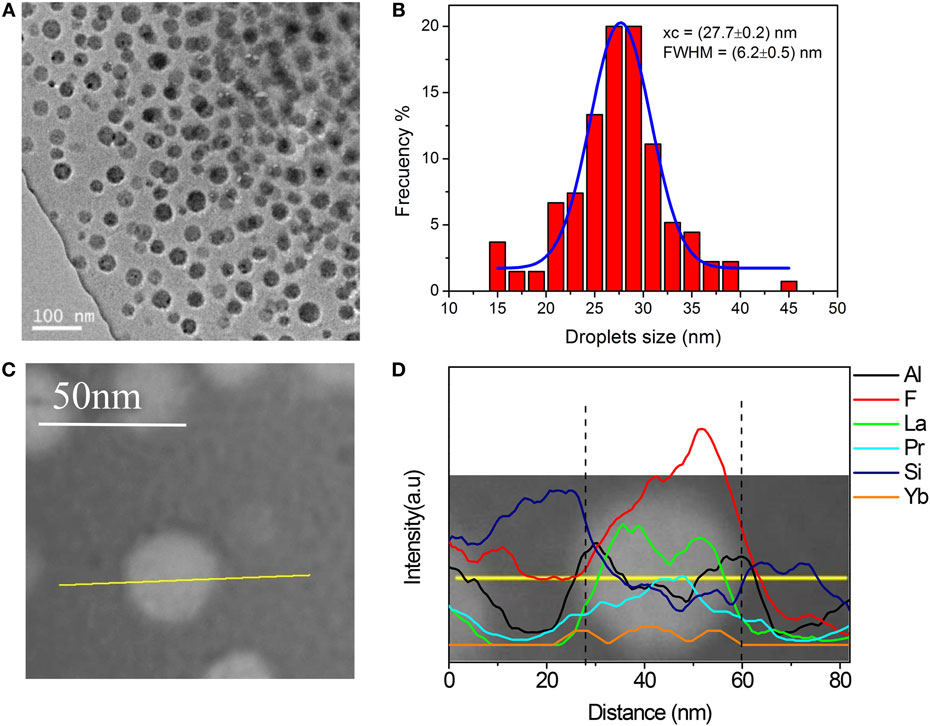
Figure 4. (A) TEM image of the 0.1–0.5 Pr–Yb glass showing phase separation droplets. (B) Droplet size distribution. (C) STEM image of the glass sample where the yellow line is the scanning line along which EDXS analysis was performed (D).
Figure 5A shows an image of the GC 0.1–0.5 620°C, 20 h and bigger droplets, with average size ≈33 nm, were detected as compared to the untreated glass (Figure 5B). A feature of this glass system is the crystals formation inside the initial phase separation droplets, already enriched in crystals components in the as made glass. The size of the crystals inside each droplet is clearly observed in Figure 5C, and their size distribution is represented in Figure 5D. An average crystals size of 10 nm was obtained for this heat treatment, in agreement with the value obtained by XRD measurements. Figures 5E,F show EDXS analysis of one single droplet. Al and Si are mostly confined in the interphase and tend to be smaller in correspondence of the maximum F, La, Pr, and Yb concentration, i.e., inside the droplet. Clear presence of RE ions inside the phase separation droplets and crystals is observed for glass and GCs. The detection of Yb is quite difficult, but its presence in the crystals is observed.
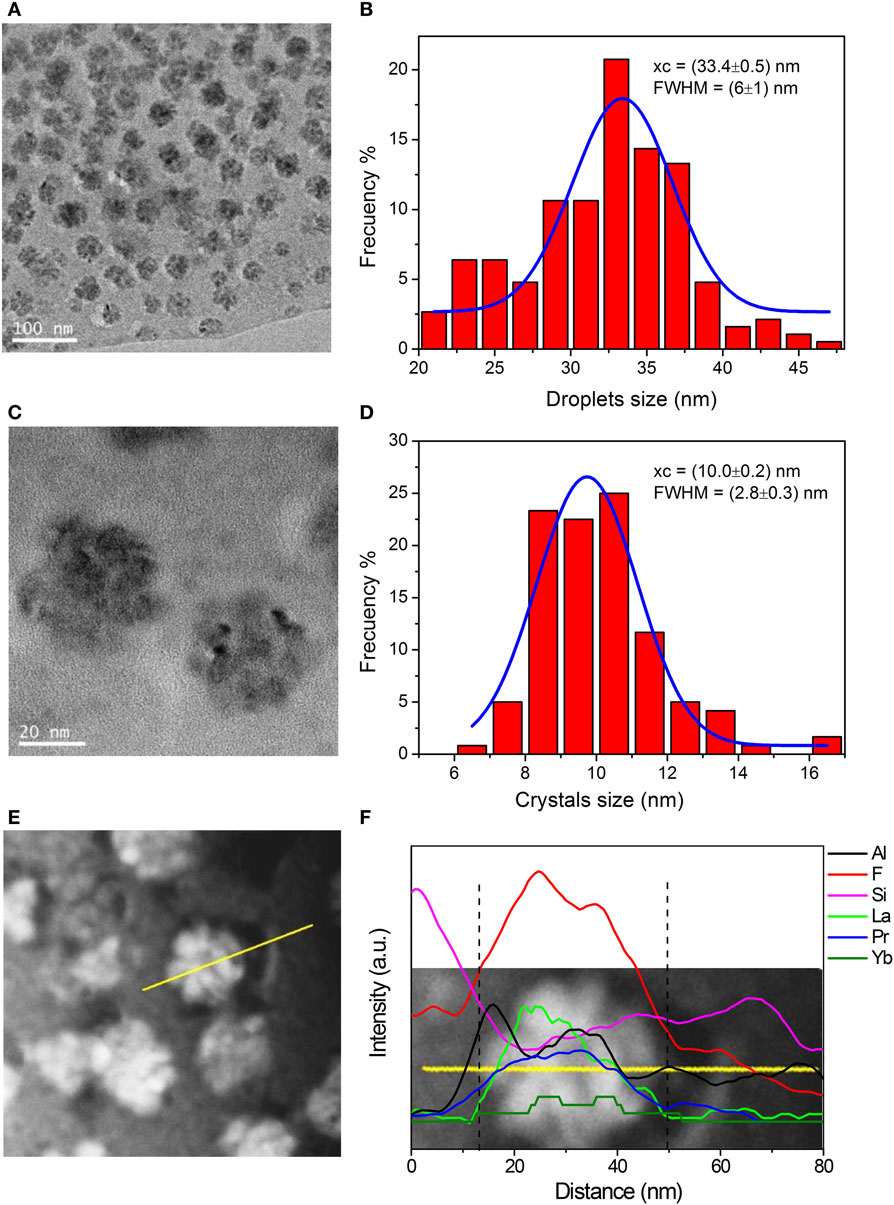
Figure 5. (A) TEM image of the glass-ceramic 0.1–0.5 Pr–Yb 620°C, 20 h and corresponding droplet size distribution (B). (C) TEM image of two droplets and cystals size distribution inside the droplet (D). (E) STEM image of the sample and EDXS analysis along the yellow line containing one droplet (F).
Optical Properties
UV–VIS optical density for Pr3+- and Pr3+–Yb3+-doped glasses and GCs are represented in Figure 6.
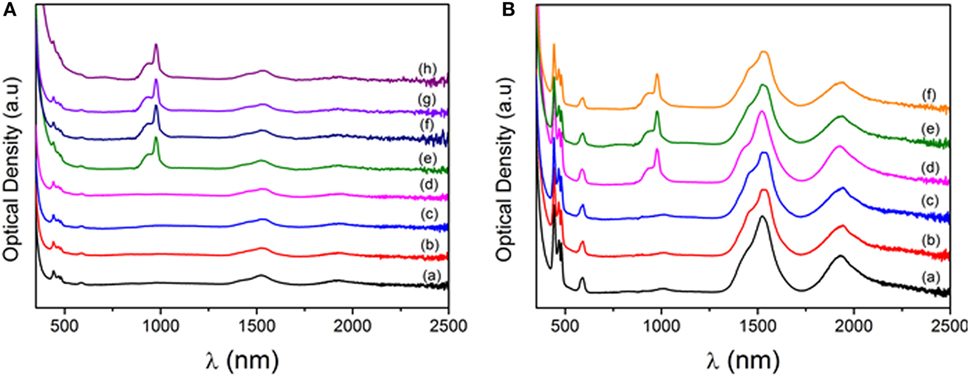
Figure 6. (A) Optical density for Glass 0.1 Pr (a), glass-ceramic (GC) 0.1 Pr 620°C, 20 h (b), GC 0.1 Pr 620°C, 40 h (c), GC 0.1 Pr 660°C, 20 h (d), Glass 0.1–0.5 Pr–Yb (e), GC 0.1–0.5 Pr–Yb 620°C, 20 h (f), GC 0.1–0.5 Pr–Yb 620°C, 40 h, and GC 0.1–0.5 Pr–Yb 660°C, 20 h (h). (B) Optical density for Glass 0.5 Pr (a), GC 0.5 Pr 620°C, 40 h (b), 0.5 Pr GC 660°C, 20 h (c), glass 0.5–1 Pr–Yb (d), GC 0.5–1 Pr–Yb 620°C, 40 h (e), and GC 0.5–1 Pr–Yb 660°C, 20 h (f).
Glasses have lower absorbance compared to GCs that suffer Rayleigh scattering caused by density fluctuations due to the presence of nano-crystals inside the glass matrix. The strong UV absorption (Urbach tail) below 350 nm is due to electronic transitions between the ligand (oxygen mainly) and the glass network former ion (silicon). In all materials the transitions between the 4f and 4f states corresponding to Pr3+ and Yb3+ ions are clearly visible. From the left, the following Pr3+ transitions can be assigned: 3H0–3P2,1,0 at 442, 466, and 480 nm, 3H4–1D2 at 590 nm, 3H4–3F4 at 1460 nm, 3H4–3F3 at 1590, and 3H4–3F2 at 1930 nm. The Yb3+ transition 2F7/2–2F5/2 is also observed at 980 nm. For 0.5 Pr and 0.5–1 Pr–Yb GCs (Figure 6B), a small underlying structure is observed for Pr3+ absorption to the 3F3 level, reflecting the different local field felt by Pr3+ ions compared to glasses, a proof of Pr3+ incorporation inside LaF3 crystals that causes a narrowing of the band and the Stark components can be appreciated. However, clearer evidence of RE3+ ions inside LaF3 crystals appears in the PL spectra.
PL spectra for Pr3+ doped and Pr3+–Yb3+ co-doped glasses and GCs are given in Figure 7. Excitation has been provided by an InGaN LED centered at 435 nm and Pr3+ ions have been excited to the 3P2 level. By non-radiative decay, the 3P0 level is populated and Pr3+ radiative emissions from this level to the three excited states 3H4,5,6 and 3F2,3,4 are clearly visible in the range 450–750 nm.
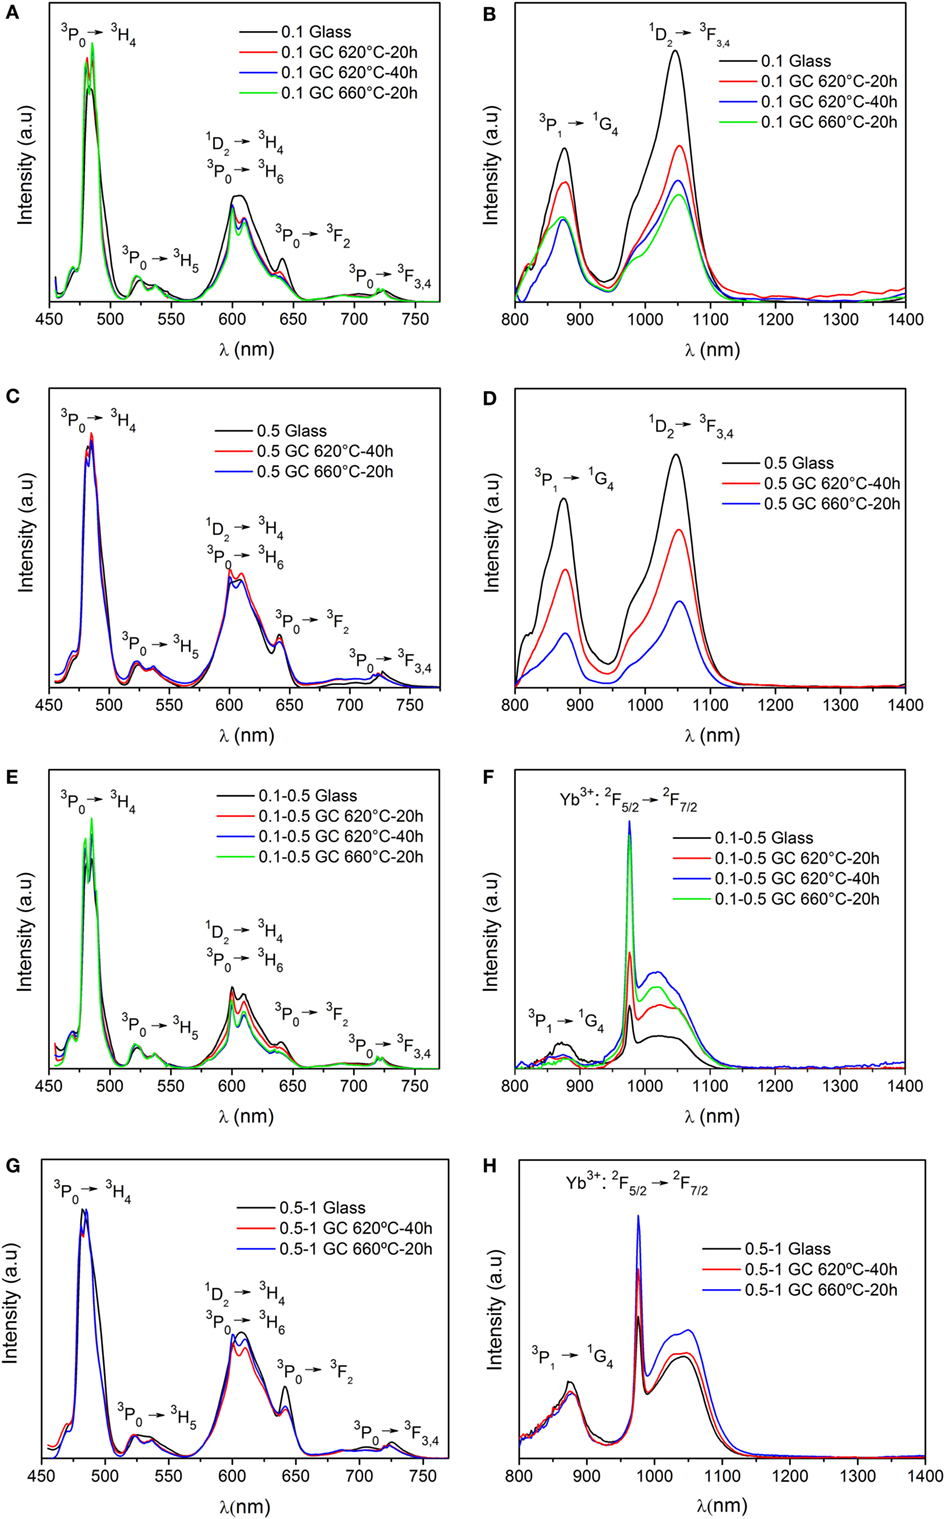
Figure 7. PL emission spectra for (A,B) 0.1 Pr, (C,D) 0.5 Pr, (E,F) 0.1–0.5 Pr–Yb, (G,H) 0.5–1 Pr–Yb doped samples. Excitation is at 435 nm.
For samples singly doped with Pr3+, the emission at 1.05 µm corresponding to the transition from 1D2–3F3,4 levels is observed and the emission at 600 nm corresponding to the 1D2–3H4 transition, in both doped and co-doped samples, overlaps with the 3P0–3H6 emission band. The population of 1D2 level is due to multi-phonon relaxation from the 3P0 level, and this contribution is stronger in glass than in GCs, meaning the incorporation of Pr3+ ions inside LaF3 crystals, where phonons are much smaller.
However, in co-doped samples, the 3P0 level is also quenched by the presence of Yb3+ ions, producing a DC signal in the range 950–1150 nm, as a consequence of an ET process. The Pr3+ transition 1G4–3H5 at 1.3 µm is not observed in any samples, glass or GCs. Moreover, the 3P0–1G4 transition at 950 is not osberved either.
For all samples, a more evident distinction in the Pr3+ emission between glass and GCs is observed. Again, co-doped glasses present the lowest Yb3+ DC signal at 976 nm while the Pr3+ transition 3P0–3H6 gets smaller passing from glass to GCs. Glass does not show sharp Stark splitting while a clear splitting of the 3H5,6 and 3F4 is visible in the GCs, a convincing proof that Pr3+ ions are incorporated into LaF3 crystals. However, Yb3+ ions should be incorporated in LaF3 crystals as well. In fact, a difference in the local environment between Pr3+ and Yb3+ does not seem favorable for ET processes. Additionally, DC emission gets stronger in GCs.
Xu et al. (2011) studied a 0.5–0.5 Pr–Yb doped oxyfluoride GCs containing LaF3 crystals and found that the visible emission increases more than NIR emission passing from glass to GCs. Moreover, NIR emission of Yb3+ ions did not increase monotonously with the heat treatment temperature or time. These results are in contradiction with ours. They concluded that Yb3+ ions are not favored to be incorporated inside LaF3 crystals, while we observed incorporation. TEM images (Figure 5), and particularly the elemental analysis with 1 nm resolution, showed an enrichment of Yb3+ inside the droplets, while no significant Yb3+ concentration was detected in the glass matrix.
While for 0.1–0.5 Pr–Yb doped samples the effect of the increase of temperature seems comparable to the increase of heat treatment time, for 0.5–1 Pr–Yb doped materials the increase of temperature produces the most evident improvement of Yb3+ DC emission at 976 nm. This may be explained considering that a doping with 0.1–0.5 Pr–Yb produces a lower nuclei density, but bigger crystals are still possible by rising the annealing temperature (Figure 3C). In particular, bigger crystals can host more RE3+ ions and a heat treatment at 620°C, 40 h thus produces an improvement of DC signal.
For 0.5–1 Pr–Yb, due to the quite higher fluoride content into the initial melt, the as made glass has a higher nuclei density thanks to the nucleating action of fluorine. The smaller initial nuclei make it more difficult to produce bigger crystals, due to the reduction of the effective cross-section to capture other crystal forming ions and to the presence of a diffusion barrier of higher viscosity around LaF3 crystals that is formed earlier and which is expected to be thicker. In addition, in a glass doped with more RE3+ ions, viscosity increases compared to un-doped glass (or to a less doped glass), at the temperatures of nano-glass ceramic formation (Tg + 20–80°C) (de Pablos-Martín et al., 2013). As a consequence, RE3+ ions diffusion inside crystals can require longer times, and therefore, the best improvement is obtained by rising the temperature until a decrease of viscosity starts to allow more RE3+ ions diffusion inside the LaF3 crystals but avoiding the growth of nanocrystals above 20 nm.
As suggested by van Wijngaarden et al. (2010), the cross relaxation scheme, Figure 8A, is the most common scheme for Pr–Yb DC. The two step ET process firstly allows Yb3+ ions excitation to the 2F5/2, and then Pr3+ ions from the 1G4 level transfer energy to Yb3+ ions.
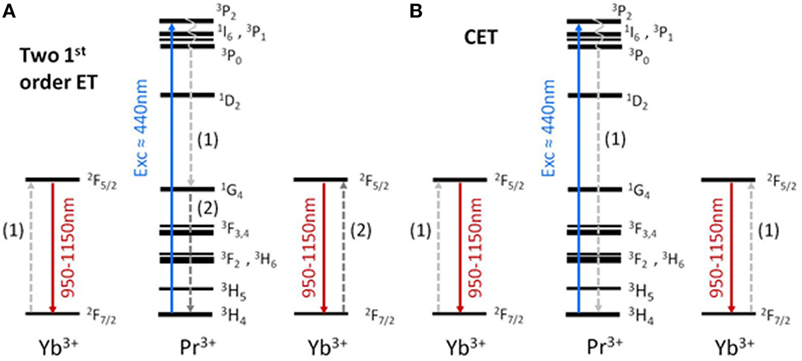
Figure 8. (A) Two first order energy transfer (ET) processes, the first being a cross relaxation. (B) Cooperative energy transfer between one Pr3+ and two Yb3+ ions.
Xiang et al. (2014) found that, increasing Yb3+ concentration to 10 mol%, cooperative energy transfer (CET) process, Figure 8B, becomes increasingly important and for very high concentration as 20 mol% CET process is the main ET process.
In this study, the absence of the emission at 1.3 µm (1G4–3H5) from Pr3+ ions indicates that 1G4 level is not populated or that this level is highly quenched in glass as well as in GCs. Considering that even for glass samples doped with only 0.1 mol% of Pr3+ this emission is not observed, we are tempted to affirm that this transition hardly occurs in our samples. Furthermore, the 3P0–1G4 transition at 950 nm is not observed in any sample and this is in agreement with the absence of population of the 1G4 level and finally, it could be a proof of the fact that the CET from the Pr3+ 3P0 can be relevant for co-doped samples. Hence, it is possible to conclude that the ET between Pr3+ to Yb3+ (2F7/2–2F5/2) is improved in GCs respect to glass and CET could be quite relevant.
As suggested by Gao and Wondraczek (2013), the ET from the 1G4 level of Pr3+ to the 2F5/2 level of Yb3+ is rather unlikely because the 1G4 level is almost 200 cm–1 lower than the Yb3+ 2F5/2 level and an opposite back ET, from the Yb3+ 2F5/2 to the Pr3+ 1G4 level, should be favored. Considering that the ET from 1G4 of Pr3+ to the 2F5/2 of Yb3+ is not observed in our measurements, the back ET from Yb3+ to Pr3+ ions was also studied by direct excitation of Yb3+ ions with a laser fiber at 976 nm. The corresponding PL measurements for GCs 0.1–0.5 Pr–Yb GC are given in Figure 9. The same results have been obtained for the GCs 0.5–1 Pr–Yb.
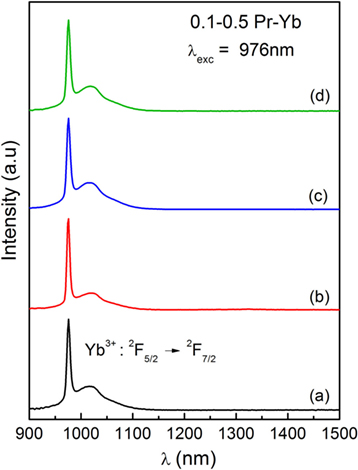
Figure 9. PL spectra upon Yb3+ direct excitation at 976 nm for the glass (a), glass-ceramics (GC) 620°C, 20 h (b), GC 620°C, 40 h (c), and GC 660°C, 20 h (d) for the 0.1–0.5 Pr–Yb composition.
As clearly observed, no Pr3+ emission is present for direct excitation of Yb3+ at 976 nm, meaning the absence of a back ET mechanism. Therefore, the first order ET from 1G4 of Pr3+ to 2F5/2 of Yb3+ is quite unlikely.
Figure 10 shows Pr3+ lifetime at 610 nm (3P0–3H6) for 0.1–0.5 Pr–Yb and 0.5–1 Pr–Yb co-doped samples, respectively. Lifetimes have been calculated by best fit and in all cases a bi-exponential fit has been necessary. Fast decays correspond to ET between neighbor ions while longer lifetimes give indication about radiative emission lifetime, although there can be also not negligible contributions from ET over long distances (Katayama and Tanabe, 2013). Lifetime uncertainty is ≈ 5%. Pr3+ emission in GCs has a more evident non-exponential profile. Pr3+ decays in co-doped samples is faster than glass, and this is a further proof of a more efficient ET mechanism between Pr3+ and Yb3+ ions. For Pr3+ singly doped samples, lifetime increases passing from glass to GCs and their values are summarized in Table 2.
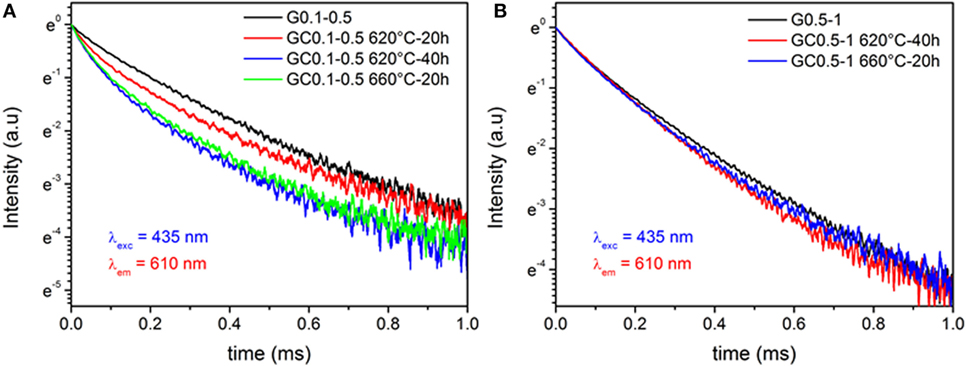
Figure 10. Pr3+:3P0–3H6 transition lifetime at 610 nm upon 435 nm excitation, for (A) 0.1–0.5 Pr–Yb and (B) 0.5–1 Pr–Yb co-doped samples.
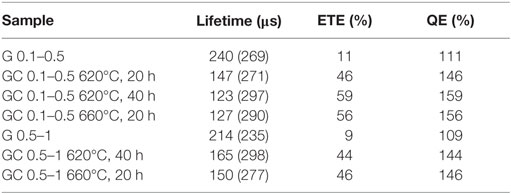
Table 2. Pr3+ lifetime at 610 nm for co-doped and Pr3+ singly doped (in parenthesis) glasses and glass-ceramics (GCs) with the corresponding energy transfer efficiency (ETE) and quantum efficiency (QE).
ETE and QE of all co-doped samples have been calculated using Eqs 8 and 9. An estimation of the highest theoretical QE was obtained setting ηPr and ηYb in Eq. 9 equal to 1. The values are summarized in Table 2. ETE is quite smaller for glass than for GCs and for 0.1–0.5 Pr–Yb composition it is 11% for glass and almost 60% for GC 620°C, 40 h and the highest QE is 159%. For 0.5–1 Pr–Yb, the highest ETE value, obtained for GC 660°C, 20 h, is 46% and the highest QE is 146%. Therefore, the best results in terms of ETE and QE are obtained for the 0.1–0.5 Pr–Yb GC 620°C, 40 h, and this could be explained considering the higher ratio between Pr3+ and Yb3+ ions that should favor a more uniform Yb3+ distribution around Pr3+ increasing the probability of DC emission.
Figure 11 shows Yb3+ emission at 976 nm for both co-doped compositions. Near single exponential decay are observed for GCs samples, while non-radiative relaxation channels are more important for glasses. GCs lifetimes increase as compared to glasses and this is a further proof of Yb3+ ions inside LaF3 crystals. All Yb3+ lifetimes are summarized in Table 3.
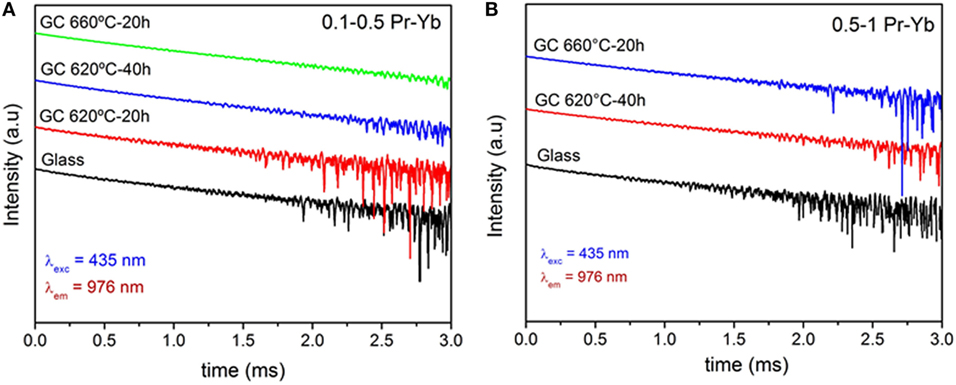
Figure 11. Yb3+:2F5/2–2F7/2 transition lifetime at 976 nm upon 435 nm excitation, for (A) 0.1–0.5 Pr–Yb and (B) 0.5–1 Pr–Yb co-doped samples.
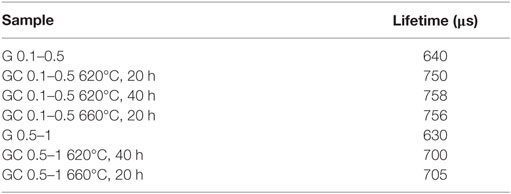
Table 3. Yb3+: 2F5/2–2F7/2 lifetime for all co-doped samples.
Conclusion
Nano oxyfluoride GCs doped with 0.1 and 0.5 Pr and co-doped with 0.1–0.5 Pr–Yb and 0.5–1 Pr–Yb have been prepared with LaF3 as only crystal phase. In all the cases, glasses and GCs treated at 620 and 660°C are perfectly transparent, due to the small crystal size (12–14 nm).
Crystallization kinetics showed that the crystal growth of LaF3 starts from a constant number of nuclei already present in the as made glass and the process is controlled by diffusion. In particular, by increasing dopants concentration, the nuclei density increases but nuclei size gets smaller. Likewise, the increase of Tg and Tx for higher dopants concentrations causes a delay in the crystallization onset and limits RE3+ ions diffusion due to higher viscosity.
Down-conversion emission of Yb3+ was observed in the range 950–1,150 nm upon Pr3+ excitation at 440 nm, and CET from the 3P0 level of Pr3+ could play relevant role in the ET process from Pr3+ to Yb3+.
Pr3+ and Yb3+ ions get incorporated inside LaF3 crystals in GCs samples. This fact is strongly supported by the more evident Stark splitting of Pr3+ emission spectra passing from glass to GCs, by the Pr3+ lifetime decrease in GCs suggesting that a better ET occurs and by Yb3+ lifetime increase in GCs indicating a decrease of non-radiative processes compared to glasses.
Glass-ceramics samples show better DC emission in the range 950–1150 nm compared to glasses and by a proper heat treatment it is possible to find the best combination to enhance Yb3+ DC and suppress unwanted Pr3+ emission. The highest ETE and QE were 59 and 159%, respectively, for GC 0.1–0.5 Pr–Yb 620°C, 40 h.
The results here described encourage continuing with further analysis of these materials as DC materials. In particular, different RE3+ ions concentration combinations should be tested. The DC emission by Yb3+ ions show the possibility of using this glass system in Photonics, even though further studies, regarding RE3+ ions concentrations, materials thickness, etc., should be performed to optimize the best DC signal and the application of these materials.
Author Contributions
GG prepared the materials and studied their structural properties. He also measured lifetimes with SP. He contributed to the discussion of results and writing of the paper. AC contributed to the PL measurements. SP contributed to the management of the experiment and to the PL and lifetime measurements. LP performed HR-TEM characterization and analysis. AD and MP contributed to the structure and planning of the work, management of the experiments, work supervision and discussion, and writing of the paper.
Conflict of Interest Statement
The authors declare that the research was conducted in the absence of any commercial or financial relationships that could be construed as a potential conflict of interest.
Acknowledgments
The authors would like to thank Juan Vargas (technician at ICV-CSIC) for samples preparation.
Funding
Financial support of the Spanish National Project MAT2013-48246-C2-1-P. GG wishes to acknowledge a grant given by the Tuscany region “Progetto Giovani Si” (Italy). AC wishes to acknowledge the financial support of the Ministero dell’Istruzione, dell’Università e della Ricerca (MIUR) through the Centro Fermi project “Premiale 2012 – Fisica e strumentazione per la salute dell’uomo.”
References
Abrams, Z. R., Niv, A., and Zhang, X. (2011). Solar energy enhancement using down-converting particles: a rigorous approach. J. Appl. Phys. 109, 114905–114909. doi:10.1063/1.3592297
Bhattacharyya, S., Höche, T., Hemono, N., Pascual, M. J., and van Aken, P. A. (2009). Nano-crystallization in LaF3-Na2O-Al2O-SiO2 glass. J. Cryst. Growth 311, 4350–4355. doi:10.1016/j.jcrysgro.2009.07.027
Chen, D., Wang, Y., Yu, Y., Huang, P., and Weng, F. (2008). Near-infrared quantum cutting in transparent nanostructured glass-ceramics. Opt. Lett. 33, 1884–1886. doi:10.1364/OL.33.001884
Chen, D., Wang, Y., Yu, Y., and Ma, E. (2007). Influence of Yb3+ content on microstructure and fluores-cence of oxyfluoride glass-ceramics containing LaF3 nano-crystals. Mater. Chem. Phys. 101, 464–469. doi:10.1016/j.matchemphys.2006.08.005
Chen, Q. J., Zhang, W. J., Huang, X. Y., Dong, G. P., Peng, M. Y., and Zhang, Q. Y. (2012). Efficient down- and up-conversion of Pr3+-Yb3+ co-doped transparent oxyfluoride glass-ceramics. J. Alloys Compd. 513, 139–144. doi:10.1016/j.jallcom.2011.10.007
de Pablos-Martín, A., Durán, A., and Pascual, M. J. (2012). Nanocrystallisation in oxyfluoride systems: mechanisms of crystallisation and photonic properties. Int. Mater. Rev. 57, 165–186. doi:10.1179/1743280411Y.0000000004
de Pablos-Martín, A., Hemono, N., Mather, G. C., Bhattacharyya, S., Höche, T., Bornhöft, H., et al. (2011). Crystallization kinetics of LaF3 nanocrystals in an oxyfluoride glass. J. Am. Ceram. Soc. 94, 2420–2428. doi:10.1111/j.1551-2916.2011.04547.x
de Pablos-Martín, A., Ristic, D., Bhattacharyya, S., Höche, T., Mather, G. C., Ramırez, M. O., et al. (2013). Effects of Tm3+ additions on the crystallization of LaF3 nanocrystals in oxyfluoride glasses: optical characterization and up-conversion. J. Am. Ceram. Soc. 96, 447–457. doi:10.1111/jace.12120
Deng, K., Wei, X., Wang, X., Chen, Y., and Yin, M. (2011). Near-infrared quantum cutting via resonant energy transfer from Pr3+ to Yb3+ in LaF3. Appl. Phys. B 102, 555–558. doi:10.1007/s00340-011-4413-7
Donald, I. W. (2004). Crystallisation kinetics of a lithium zinc silicate glass studied by DTA and DSC. J. Non Cryst. Solid 345-346, 120–126. doi:10.1016/j.jnoncrysol.2004.08.007
Gao, G., and Wondraczek, L. (2013). Near-infrared down-conversion in Pr3+/Yb3+ co-doped boro-aluminosilicate glasses and LaBO3 glass ceramics. Opt. Mater. Express 3, 633–644. doi:10.1364/OME.3.000633
Hemono, N., Pierre, G., Muñoz, F., de Pablos-Martín, A., Pascual, M. J., and Durán, A. (2009). Processing of transparent glass-ceramics by nano-crystallisation of LaF3. J. Eur. Ceram. Soc. 29, 2915–2920. doi:10.1016/j.jeurceramsoc.2009.05.013
Huang, X., Han, S., Huang, W., and Liu, X. (2013). Enhancing solar cell efficiency: the search for luminescent materials as spectral converters. Chem. Soc. Rev. 42, 173–201. doi:10.1039/c2cs35288e
Katayama, Y., and Tanabe, S. (2010a). Near infrared down-conversion in Pr3+–Yb3+ codoped oxyfluoride glass ceramics. Opt. Mater. 33, 176–179. doi:10.1016/j.optmat.2010.07.016
Katayama, Y., and Tanabe, S. (2010b). Spectroscopy and 1 µm luminescence by visible quantum cutting in Pr3+-Yb3+ codoped glass. Materials 3, 2405–2411. doi:10.3390/ma3042405
Katayama, Y., and Tanabe, S. (2013). Mechanism of quantum cutting in Pr3+–Yb3+ codoped oxyfluoride glass ceramics. J. Lumin. 134, 825–829. doi:10.1016/j.jlumin.2012.06.042
Kissinger, H. E. (1956). Variation of peak temperature with heating rate in differential thermal analysis. J. Res. Nat. Bur. Stand. 57, 217–221. doi:10.6028/jres.057.026
Lakshminarayana, G., and Qiu, J. (2009). Near-infrared quantum cutting in RE3+/Yb3+ (RE = Pr, Tb, and Tm): GeO2–B2O3–ZnO–LaF3 glasses via down-conversion. J. Alloys Compd. 481, 582–589. doi:10.1016/j.jallcom.2009.03.034
Matusita, K., and Sakka, S. (1980). Kinetic study on crystallization of glass by differential thermal analysis – criterion on application of kissinger plot. J. Non Cryst. Solid 38, 741–746. doi:10.1016/0022-3093(80)90525-6
Ozawa, T. (1970). Kinetic analysis of derivative curves in thermal analysis. J. Therm. Anal. 2, 301–324. doi:10.1007/BF01911411
Richards, B. S. (2006). Luminescent layers for enhanced silicon solar cell performance: down-conversion. Sol. Energy Mater. Sol. Cells 90, 1189–1207. doi:10.1016/j.solmat.2005.07.001
Trupe, T., Green, M. A., and Wurfel, P. (2002). Improving solar cell efficiencies by down-conversion of high energy photons. J. Appl. Phys. 92, 1668–1674. doi:10.1063/1.1505677
van der Ende, B. M., Aarts, L., and Meijerink, A. (2009). Near-infrared quantum cutting for photovoltaics. Adv. Mater. 21, 3073–3077. doi:10.1002/adma.200802220
van Wijngaarden, J. T., Scheidelaar, S., Vlugt, T. J. H., Reid, M. F., and Meijerink, A. (2010). Energy transfer mechanism for down-conversion in the (Pr3+, Yb3+) Couple. Phys. Rev. B 81, 155112–155116. doi:10.1103/PhysRevB.81.155112
Xiang, G., Zhang, J., Hao, Z., Zhang, X., Pan, G., Luo, Y., et al. (2014). The energy transfer mechanism in Pr3+ and Yb3+ codoped β-NaLuF4 nanocrystals. Phys. Chem. Chem. Phys. 16, 9289–9293. doi:10.1039/C4CP01184H
Xu, Y., Zhang, X., Dai, S., Fan, B., Ma, H., Adam, J.-L., et al. (2011). Efficient near-infrared down-conversion in Pr3+-Yb3+ codoped glasses and glass ceramics containing LaF3 nanocrystals. J. Phys. Chem. C 115, 13056–13062. doi:10.1021/jp201503v
Keywords: transparent, glass-ceramics, rare-earths, crystallization, down-conversion, solar energy
Citation: Gorni G, Cosci A, Pelli S, Pascual L, Durán A and Pascual MJ (2017) Transparent Oxyfluoride Nano-Glass Ceramics Doped with Pr3+ and Pr3+–Yb3+ for NIR Emission. Front. Mater. 3:58. doi: 10.3389/fmats.2016.00058
Received: 27 May 2016; Accepted: 14 December 2016;
Published: 03 January 2017
Edited by:
Joachim Deubener, Clausthal University of Technology, GermanyReviewed by:
Paul M. Voyles, University of Wisconsin-Madison, USAChao Liu, Wuhan University of Technology, China
Copyright: © 2017 Gorni, Cosci, Pelli, Pascual, Durán and Pascual. This is an open-access article distributed under the terms of the Creative Commons Attribution License (CC BY). The use, distribution or reproduction in other forums is permitted, provided the original author(s) or licensor are credited and that the original publication in this journal is cited, in accordance with accepted academic practice. No use, distribution or reproduction is permitted which does not comply with these terms.
*Correspondence: Maria Jesús Pascual, mpascual@icv.csic.es