 Damien Robert Finn1†
 Michal Ziv-El1,2†
 Joost van Haren3Jin Gyoon Park4
 Jhon del Aguila-Pasquel5
 Jose David Urquiza–Muñoz6‡
 Hinsby Cadillo-Quiroz1,2,7*
- 1School of Life Sciences, Arizona State University, Tempe, AZ, United States
- 2Swette Center for Environmental Biotechnology, Biodesign Institute, Arizona State University, Tempe, AZ, United States
- 3Biosphere 2, University of Arizona, Tucson, AZ, United States
- 4Center for Personalized Diagnostics, Biodesign Institute, Arizona State University, Tempe, AZ, United States
- 5Instituto de Investigaciones de la Amazonia Peruana, Iquitos, Peru
- 6Laboratorio de Suelos del Centro de Investigaciones de Recursos Naturales de la Amazonia Peruana, and Facultad de Ciencias Forestales, Universidad de la Amazonia Peruana, Iquitos, Peru
- 7Center for Fundamental and Applied Microbiomics, Biodesign Institute, Arizona State University, Tempe, AZ, United States
Tropical peatlands are globally important carbon reservoirs that play a crucial role in fluxes of atmospheric greenhouse gases. Amazon peatlands are expected to be large source of atmospheric methane (CH4) emissions, however little is understood about the rates of CH4 flux or the microorganisms that mediate it in these environments. Here we studied a mineral nutrient gradient across peatlands in the Pastaza-Marañón Basin, the largest tropical peatland in South America, to describe CH4 fluxes and environmental factors that regulate species assemblages of methanogenic and methanotrophic microorganisms. Peatlands were grouped as minerotrophic, mixed and ombrotrophic categories by their general water source leading to different mineral nutrient content (rich, mixed and poor) quantified by trace elements abundance. Microbial communities clustered dependent on nutrient content (ANOSIM p < 0.001). Higher CH4 flux was associated with minerotrophic communities compared to the other categories. The most dominant methanogens and methanotrophs were represented by Methanobacteriaceae, and Methylocystaceae, respectively. Weighted network analysis demonstrated tight clustering of most methanogen families with minerotrophic-associated microbial families. Populations of Methylocystaceae were present across all peatlands. Null model testing for species assemblage patterns and species rank distributions confirmed non-random aggregations of Methylococcacae methanotroph and methanogen families (p < 0.05). We conclude that in studied amazon peatlands increasing mineral nutrient content provides favorable habitats for Methanobacteriaceae, while Methylocystaceae populations seem to broadly distribute independent of nutrient content.
Introduction
Peatlands are ecosystems where plant primary productivity exceeds organic matter decomposition, resulting in the accumulation of partially decomposed soil organic matter, acting as globally important organic carbon (OC) reserves (Page et al., 2011; Sjogersten et al., 2014; Page and Baird, 2016). While northern, low-temperature peatlands have been extensively characterized in terms of their microbial communities (Andersen et al., 2013; Serkebaeva et al., 2013; Zhou et al., 2017), little is understood about tropical peatlands, particularly for those in the Amazon basin. Amazon peatlands have been heavily understudied due to the lack of reports of their existence prior to 2008 (Lahteenoja et al., 2009), however over 80 550 km2 containing 7.07 Gt OC have been reported so far, representing 18% of the surface area and 8.3% of the OC content of global tropical peatlands (Rieley and Page, 2016). Due to the high OC content, Amazon peatlands are expected to produce significant amounts of greenhouse gases (GHG) such as carbon dioxide (CO2), methane (CH4) and nitrous oxide (N2O). In fact, recent early reports on GHGs fluxes from a few Amazon peatlands show significant yet highly variable levels of CH4 and N2O across sites, across seasons in a site, or across gradients within in a site (Teh et al., 2017; Winton et al., 2017). Regionally, it has been coarsely estimated that the Amazon Basin can emit 31.6 – 41.1 Tg CH4 year–1, or approximately 7% of global CH4 emissions (Wilson et al., 2016; Teh et al., 2017; Winton et al., 2017) but such an estimate is based on too few data points. To our knowledge there is a limited availability of GHG flux reports from Amazon peatlands and no study has addressed the composition and potential functional patterns of soil microbial communities and their association with CH4 flux in Amazon peatlands.
To better understand the role of microbes participating in CH4 flux it is important to evaluate the environmental controls (i.e., pH, nutrient content, others) as well as microbe-microbe interactions affecting the activity of CH4 producers or consumers. Methane production is performed by methanogenic Archaea (methanogens) as the final stage of the organic matter decomposition cascade, where a broad range of heterotrophic organisms metabolize complex organic molecules releasing simpler methanogenic substrates (acetate, formate, methanol and CO2) (Garcia et al., 2000). Consequently, methanogens are metabolically dependent on active heterotrophs in peatlands. Methanogens are metabolically and physiologically diverse, and are primarily grouped taxonomically in the Orders Methanopyrales, Methanococcales, Methanobacteriales, Methanomicrobiales, and Methanosarcinales (Garcia et al., 2000; Thauer et al., 2008). Conversely, CH4 can also act as a carbon and energy source for specific microbial species known as methanotrophs. These predominantly include aerobic Gamma- and Alpha-proteobacteria of the Methylococcaceae and Methylocystaceae families, respectively (Hanson and Hanson, 1996), aerobic Verrucomicrobia (Dunfield et al., 2007), Archaea that anaerobically oxidize CH4 via coupling with reduction of alternative terminal electron acceptors [like sulfate (Orphan et al., 2002; Orphan et al., 2009) nitrate (Haroon et al., 2013), Fe or Mn (Ettwig et al., 2016)], and NC10 bacteria that is capable to produce its own oxygen from nitrite and oxidize CH4 in anaerobic environments (Ettwig et al., 2010).
Studies of the ecological diversity of methanogens in tropical peatlands globally are few and in some cases with contrasting results. In Peat Swamp Forest in Thailand, hydrogenotrophic members of the Class Methanomicrobia (Kanokratana et al., 2011) were found dominant, while an equivalent peatland in Malaysia putative methylotrophic Methanomassiliicoccales methanogens were identified as the dominant (Too et al., 2018). The first study is in agreement with well-characterized northern peatlands, in which several studies demonstrated that the Order Methanomicrobiales and, to lesser extent, hydrogenotrophic members of the Methanobacteriales and acetoclastic Methanosarcinales are important for CH4 production (Juottonen et al., 2005; Cadillo-Quiroz et al., 2006; Steinberg and Regan, 2008; Lin et al., 2012). However, the result of the second study indicates that there is significant methanogen’s (and plausible methanotrophs) variation that is yet to be accounted in tropical peatlands. To our knowledge, the diversity of methanotrophs in Amazon peatlands has not been documented. Contrasting reports have been observed in other tropical regions where a tropical peatland in Indonesia showed a dominance of Methylomonas sp. from the Methylococcaceae (Arai et al., 2014), while a Malaysian swamp forest peatland showed Methylocystaceae (Too et al., 2018) as the dominant. In northern peatlands, the dominant methanotrophic bacteria tend to befree living or Sphagnum-moss symbionts of the family Methylocystaceae (Chen et al., 2008; Dedysh, 2009; Wieczorek et al., 2011; Kip et al., 2012).
Naturally existing nutrient gradients have historically been used by ecologists to identify environmental parameters that govern observable species assemblages (Tilman and Wedin, 1991; Keddy, 1992; McGill et al., 2006). Geochemical and nutrient gradients in northern and tropical peatlands are typically associated to the dominant water source described as follows: a) minerotrophic -groundwater fed fens or swamps are relatively nutrient-rich; b) ombrotrophic -rain fed bogs are nutrient-poor; and c) mixed water source poor fens or swamps have intermediate nutrient levels (Juottonen et al., 2005; Cadillo-Quiroz et al., 2006; Martini et al., 2007; Lahteenoja and Page, 2011). The biodiversity of methanogenic species has previously been shown to change across peatland geochemical gradients (Juottonen et al., 2005; Cadillo-Quiroz et al., 2006; Lin et al., 2012), but attempts to describe a set of community-assembly associations for tropical peatland methanogens has yet to be considered.
Here we describe GHG flux variation and the first accounts of prokaryotic community compositions across a tropical peatland nutrient gradient in the Pastaza-Marañón Basin, in the western Amazonia, Peru. The Pastaza-Marañón Basin holds the most extensive tropical peatland distribution in South America (Lahteenoja et al., 2012; Draper et al., 2014). A rich diversity of ecosystem types, based on nutrient content, exists here due to mineral deposition from dynamic hydrological activity of river channels originating in the Andes, or rain-fed, or mix water source-fed peat formation (Lahteenoja et al., 2012). The soils included in this study thus originated from peatlands showing minerotrophic (Charo, San Roque, and Buena Vista), mixed (Nueva York and Quistococha) and ombrotrophic (Miraflores and San Jorge) conditions. Sites were assigned to categories as in previous reports (Lahteenoja et al., 2009; Teh et al., 2017) based on soil analysis and site characteristics, plus an additional assessment based on soil mineral content of sodium, magnesium, phosphorous, sulfate, potassium, calcium, manganese, iron, nickel, copper, and zinc (Table 1) as quantifiable geochemical proxies to the nutrient conditions provided by ground water-fed (minerotrophic) or rain-fed (ombrotrophic) or mixed water sources in peatlands (Whitfield et al., 2009).
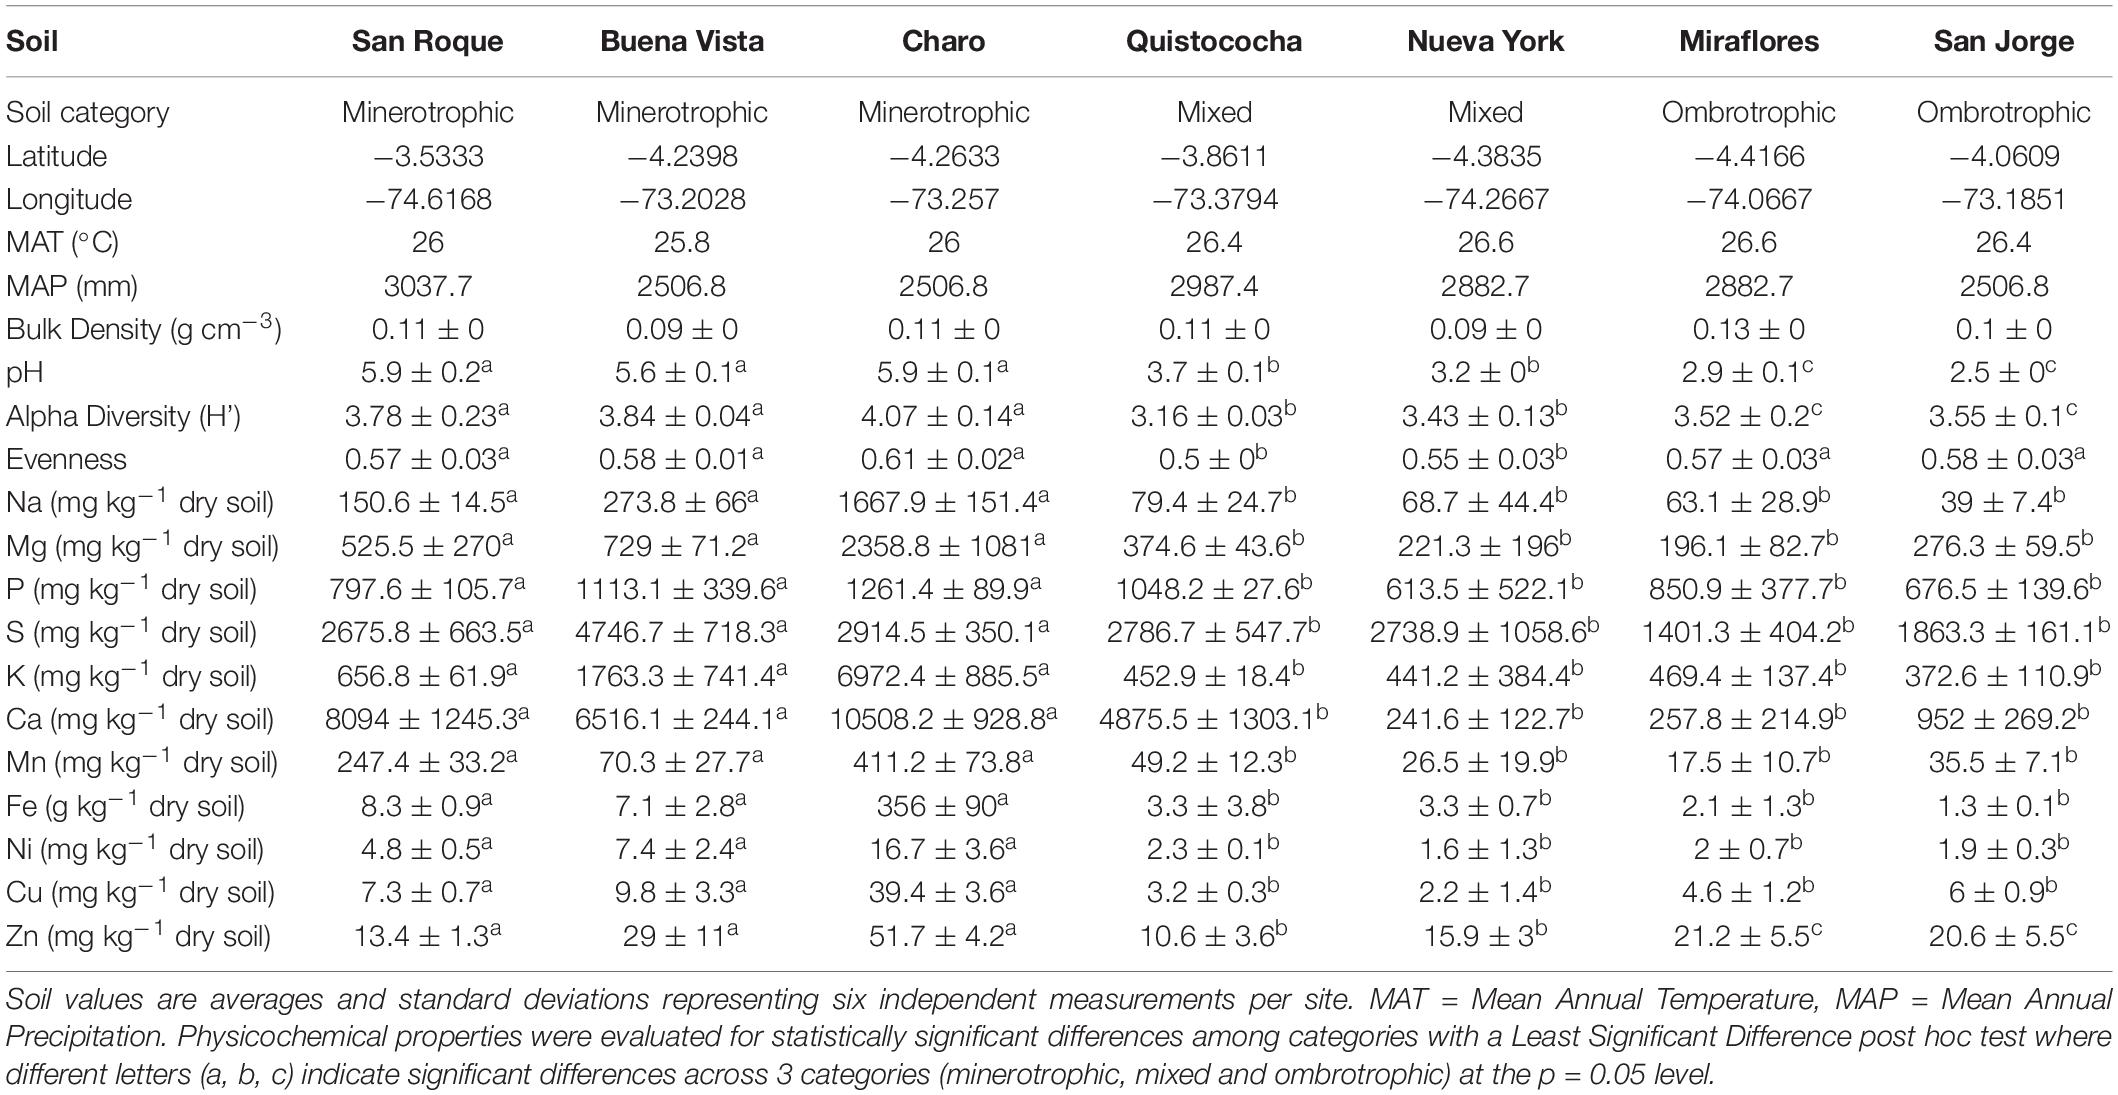
Table 1. List of categories, location, atmospheric records, and soil properties of 7 peatlands from the Pastaza-Marañón Basin.
We hypothesized the following: 1) nutrient concentration variation, measured as elemental composition via inductively coupled plasma-mass spectrometry (ICP-MS), among peatlands with contrasting geochemistry influenced by their source of water shapes the overall microbial community composition; and 2) such variations in nutrient concentration can be associated with CH4 fluxes as well as explain discrete (non-random) assemblages of methanogen and methanotroph families in the study sites.
Materials and Methods
Site Description and Field Sampling
Seven study sites were selected in the Pastaza-Marañon basin, in the Peruvian Western Amazon region (Table 1). Petland information regarding vegetation, geochemistry and peat depths have been described previously for Quistococha (Roucoux et al., 2013), San Jorge and Buena Vista (Kelly et al., 2013), San Roque, Miraflores, and Charo (Lahteenoja et al., 2009) and Nueva York (Lahteenoja and Page, 2011). Annual climatological data was obtained from the database described in Espinoza Villar et al. (2009). Samples were collected in December of 2011 and December of 2012 near the end of the “dry” season or a transitional period to rainy conditions. On-site measurements included pH, air and soil temperature using a HI 99121N meter (Hanna Instruments, RI, United States), and fixed soil volume collection (400 cm3) for bulk density analysis (Chambers et al., 2010). A 100-m long transect near the center of the peatland with north to south direction was done using center location and soil characterization from previous studies (Lahteenoja et al., 2009; Lahteenoja et al., 2012) to better represent peat geochemical conditions. In transect two pair of independent points (∼10 m apart in east to west direction) were placed every 50 m (6 sampling points per site with variable distances from 20 to ∼160 m). Soil samples were collected from the center of sampling points shortly after flux measurements were completed and when relevant at two depths (0–15 and 15–30 cm) (12 samples per site). For each of the six sampling points in the transect, a 15 cm deep and 5 cm diameter mini soil core was collected in sterile bags and mixed, then subsamples were taken for corresponding analysis: triplicated 0.5 gr were aseptically placed in sterile tubes and mixed with 1 ml of MoBio Lifeguard Soil stabilization solution (MoBio, United States), ∼50 g of soil was sealed in a bag for physical or chemical analysis. All samples were stored in refrigerated conditions within 24–48 h of collection during field expedition, and subsequently frozen and stored at −20C (for chemical) or −80C (for DNA) until appropriate analysis. GHG fluxes were measured at each of the six soil sampling points at the soil surface. All flux measurements were conducted in a time window of ±3 h from noon (9 am– 3 pm) using metal static vented soil chambers (Keller et al., 2005) enclosing a 0.045 m2 area, where collars with airproof rubber seals in their base were affix to ground with 30 cm stakes at least 30 min before measurements. After the chamber reached pressure equilibration, air samples were taken with plastic syringes at 10, 20, 30, and 40 min and transferred into nitrogen-flushed, pre-evacuated 6 mL glass vials sealed with butyl stoppers (Bellco, NJ, United States).
Soil and Gas Chemistry
A Quadrupole ICP-MS (Thermo Electron X series with CCT, Fisher Scientific, United States) was used to analyze soil elemental composition in the Metals, Environmental and Terrestrial Analytical Laboratory, part of the Chemical and Environmental Characterization Core Facilities at Arizona State University. Between 1.5 – 2.5 g of soil was dried at 80°C for 72 h, digested in hydrofluoric, nitric and hydrochloric acid (12 and 3 h steps), followed by microwave heat digestion (30 min) and final evaporation. ICP-MS analysis of diluted samples in nitric acid along with standards for all elements evaluated done as described elsewhere (Potts, 1992). GHG were analyzed on a modified SRI Greenhouse Gas GC (SRI Instruments, CA, United States) with dual valco valves for separate gas streams for a Flame Ionization Detector (FID) for CO2 and CH4 and an Electron Conductivity Detector (ECD) for N2O. The flux rates were calculated from a linear change in trace gas concentration over time with reference to the internal volume of the chamber and the soil area covered (Hutchinson and Livingston, 1993).
Molecular Analyses
MoBio Lifeguard soil stabilization solution was removed by centrifugation and supernatant removal. Then, genomic DNA was extracted from 0.5 g of soil (wet weight) using a MoBio UltraClean Soil DNA isolation kit (MoBio, CA, United States), with the addition of aluminum ammonium sulfate (5 mM) prior to bead beating. Extracted DNA was quantified with a Qubit fluorometer (Invitrogen, MA, United States) assessed via gel electrophoresis. PCR amplifications were carried out using the 515F (5′-GTGYCAGCMGCCGCGGTA) (Baker et al., 2003) and 909R (5′-CCCCGYCAATTCMTTTRAGT) (Wang and Qian, 2009; Tamaki et al., 2011) primers that cover the V4 and V5 regions of the 16S rRNA gene of Bacteria and Archaea. Unique barcodes of 6 – 10 base pairs were attached to the 5′ end of primers. The PCR was carried out with 1.2 U μL–1 high-fidelity Hotstart Q5 Taq polymerase (New England Biosciences, MA, United States). Thermocycler parameters were: 98°C for 30 s, followed by 25 cycles of 98°C for 10 s, 63°C for 15 s, and 72°C for 15 s, and a final extension at 72°C for 2 min. Each sample was amplified in triplicate and pooled to reduce sequencing bias. PCR products were cleaned via Agencourt AMPure XP beads (Beckman Coulter, CA, United States), and quantified via Bioanalyzer (Agilent Technologies, CA, United States). The Illumina TruSeq DNA Sample Prep kit was used to prepare libraries and sequenced on the Illumina MiSeq v2 platform (Illumina, CA, United States). Paired-end sequences were quality filtered as described elsewhere (Bokulich et al., 2013). Paired-end reads were demultiplexed with an in house script. Downstream analyses for OTU annotation was performed with the Quantitative Insights into Microbial Ecology Two (Qiime2) pipeline (Caporaso et al., 2010). Chimeric sequences were removed with Uchime (Edgar et al., 2011). Closed-reference operational taxonomic unit (OTU) picking at 97% identity was used in relation to the Silva 128 database (Quast et al., 2013). Four 16S rRNA gene analyses performed on Northern peatlands from Sphagnum-dominated bog at Grand Rapids, Minnesota, United States (SRA IDs SRR6514003, SRR6514014, SRR6514002 and SRR6514033), were included in Qiime2 analyses for coarse comparative purposes against Amazon peatlands. Sequences of this study were deposited under SRA Bioproject ID PRJNA501909.
Statistical Analyses
All statistical analyses were performed in R v 3.4.1 (R Development Core Team, 2013). Analysis of variance (ANOVA) was used to compare soil physicochemical variables followed by least-significant difference (LSD) testing (p < 0.05) across defined site categories (minerotrophic, mixed, ombrotrophic). Also, a Permutational multivariate analysis of variance (PERMANOVA) analysis was completed on soil physicochemical variables to test whether the tree site categories will better explained soil conditions than any two-way combination (R2, p < 0.001). ANOVA was also used to compare CO2 gas fluxes, and Kruskal Wallis for CH4 and N2O gas fluxes. Fluxes were visualized as a stacked barplot, with LSD (p < 0.05) using the defined categories plus a Northern peatland one. Alpha diversity (H′) and evenness, as well as ordination of microbial communities with non-metric multidimensional scaling (NMDS) and fitting of climatological variables, environmental variables and GHG fluxes was performed as described elsewhere (Oksanen et al., 2013). Chloroplast and mitochondrial OTUs were identified and removed from the family level matrix. Weighted network analysis was performed on OTU covariance at the family level, with edge weights filtered at the p = 0.05 level determined by Spearman correlation (Csardi and Nepusz, 2006). The Spinglass technique was used to calculate modularity of the network (Reichardt and Bornholdt, 2006). Networks for minerotrophic, mixed and ombrotrophic sites were generated as above, and the frequency of methanogen and methanotroph connections to other nodes were summed, with corresponding nodes reported at the phylum level. Kruskal-Wallis tests were performed for methanogen and methanotroph family abundance with site classification as a categorical variable. Rank Abundance calculations were performed as described elsewhere (Kindt and Coe, 2005). A log-normal model (Equation 1) and a geometric model (Equation 2) were fit to log family abundances over ranks with non-linear least squares, and model fits were compared via Akaike Information Criteria (AIC) (R Development Core Team, 2013). The log-normal model is as follows:
Where S(R) is abundance of the Rth rank, So is the abundance of the first rank, a is an inverse measure of the distribution width, and R corresponds to the Rth rank (Ludwig and Reynolds, 1988). The geometric model is as follows:
Where S(R) is abundance of the Rth rank, S0 is the abundance of the first rank, p is the proportional decrease in abundance and R corresponds to the Rth rank (Dolan et al., 2007). Finally, community assembly patterns of methanogen and methanotroph families were conducted using variance ratio (V-ratio) (Gotelli, 2000). Null model testing of 1000 random permutations of the family matrix was performed with fixed sums and equiprobable distribution across sites (Gotelli, 2000).
Results
Soil Properties and Gas Fluxes
In soil properties measured across study sites (Table 1), a general trend was observed across the geochemical and nutrient gradient (minerotrophic to ombrotrophic) of decreasing pH and soil elemental nutrient concentration, with the ombrotrophic sites demonstrating low pH (<3) (LSD, p < 0.05). No trends were noted for mean annual temperature (MAT), mean annual precipitation (MAP), H′ or evenness. The concentration of elemental soil nutrients consistently supported the separation of the minerotrophic soil category from mixed and ombrotrophic (LSD, p = 005); but not of the last two due to replicate variability despite lower means in ombrotrophic soils (Table 1). However, multivariate analysis of mineral nutrient, pH and bulk soil measurements (PERMANOVA, p < 0.001), showed the separation of mixed and ombrotrophic categories (in addition to minerotrophic), has the highest R2 fit (33%) than any pairwise (up to 26%) and thus better represent the variation across sites supporting our use of tree site categories for Amazon peatland as in this study. For gas flux comparisons (Figure 1), carbon dioxide fluxes differed among all peatlands (ANOVA, p = 0.04), but these differences were independent of the elemental nutrient gradient (ANOVA, p = 0.09). Similarly, N2O flux had high variation among sites but the recorded levels (∼0.5–100 ug N m–2 h–1) were highly specific to individual peatlands (Kruskal-Wallis, p = < 0.001), independent of the nutrient gradient (Kruskal-Wallis, p = 0.05). Conversely, CH4 flux showed a dependence on the elemental nutrient gradient (Kruskal-Wallis, p = 0.03) and independent of individual peatlands (Kruskal-Wallis, p = 0.1). San Roque and Buena Vista (minerotrophic), which had an order of magnitude greater CH4 flux than the other sites, drove this. Charo, also a minerotrophic site, had an unusually low CH4 flux compared to the San Roque and Buena Vista sites. CH4 flux remained relatively low for all mixed and ombrotrophic sites.
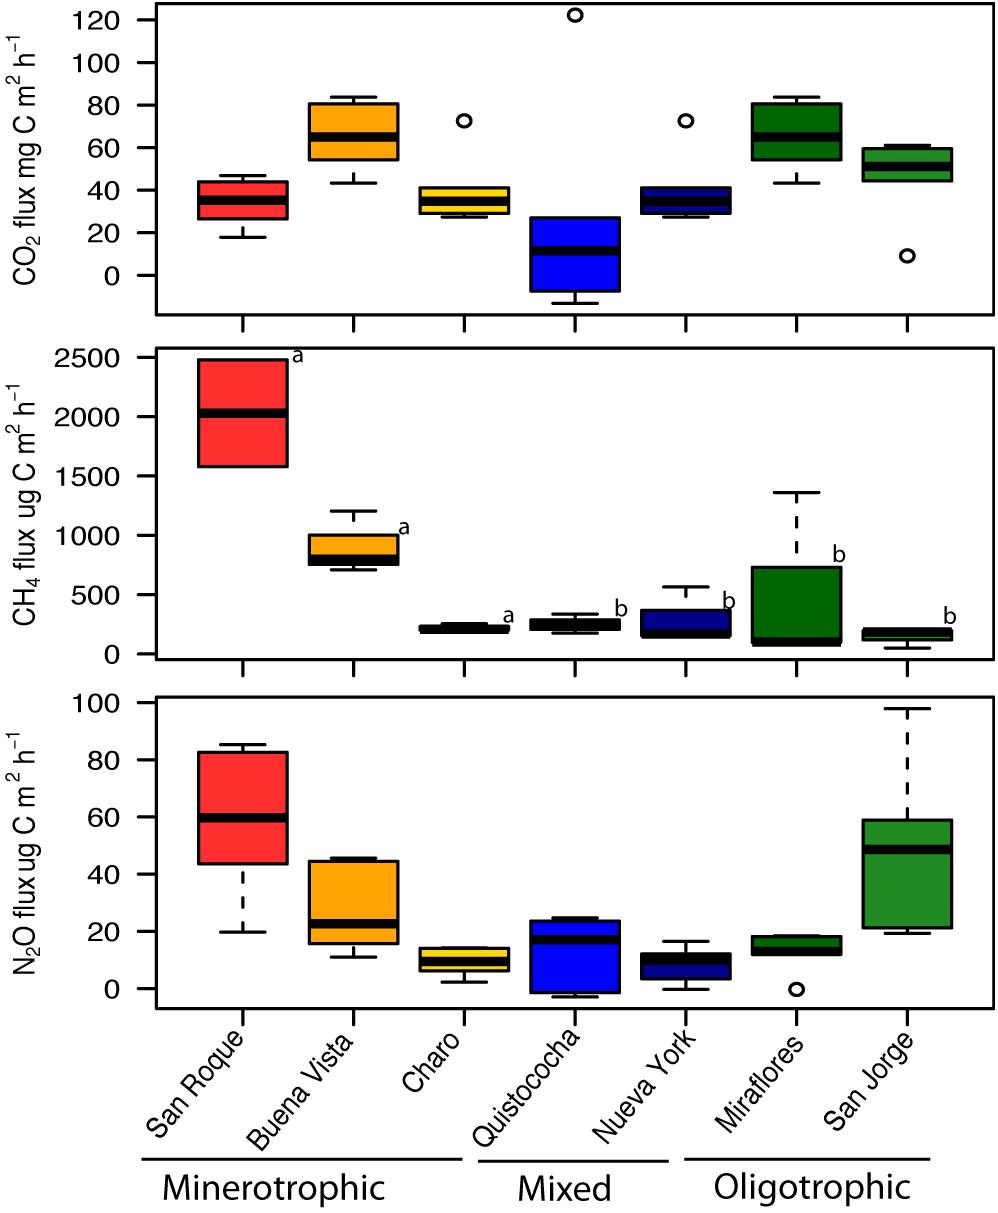
Figure 1. Greenhouse gas fluxes of CO2 (mg C m2 h–1), CH4 (μg C m2 h–1), and N2O (μg N m2 h–1) across the Pastaza-Marañón Basin. Box plots show the mean and quartiles of six independent measurements. All flux measurements were evaluated for statistically significant differences among categories with a Least Significant Difference post hoc test where different letters (a, b) indicate significant differences across site categories (minerotrophic, mixed and ombrotrophic) at the p = 0.05 level.
Relationships Between Communities Across the Nutrient Gradient
Rarefaction of OTUs at the 97% sequence homology and sequencing depth of 50 000 sequences per sample show sufficient sampling was achieved (Supplementary Figure 1) and from the 32 Bacterial and Archaeal phyla with a relative abundance of greater than 0.005% across the soils over a third (mark with asterisks in Figure 2) differed significantly in their frequency across site’s categories (LSD, p < 0.05). Proteobacteria were the dominant phylum fraction across all samples, and were significantly more abundant in minerotrophic and mixed (52 ± 3% and 52 ± 4%, respectively) than ombrotrophic soils (40 ± 5%). The abundance of Acidobacteria differed significantly between the three categories, decreasing from ombrotrophic (32 ± 5%) to minerotrophic (8 ± 2%) as pH increased. Bathyarchaeota abundance was significantly higher in the mixed peatland category (7 ± 1%) than either minerotrophic or ombrotrophic (3 ± 1% and 2 ± 1%, respectively). The low abundance phyla Bacteroidetes, Chloroflexi, Chlorobi, Gemmatimonadaetes, Nitrospirae, and Spirochaetae were significantly higher in minerotrophic peats. Meanwhile Planctomycetes, Thaumarchaeota, Elusimicrobia, and Omnitrophica were significantly higher in the ombrotrophic. Data from a Sphagnum-dominated Northern Peatland soil was included for a broad comparison between Northern and tropical Amazon communities. The primary significant differences in the included northern peatland microbial community to Amazon peatlands were higher abundances of Acidobacteria (52 ± 2%), Verrucomicrobia (8 ± 0%) and TM6 (0.2 ± 0%), and lower abundances of Proteobacteria (23 ± 0%) (Figure 2). Ordination of Amazon peatlands’ microbial communities at the 97% OTU similarity level demonstrated clustering of communities based on geochemical/nutritional categories used in this study (Figure 3), with statistically significant differences (ANOSIM p < 0.001). Environmental variables showed pH and elemental nutrient concentration separated all microbial communities along the first NMDS axis. Of the GHG, only CH4 flux showed an association with minerotrophic communities.
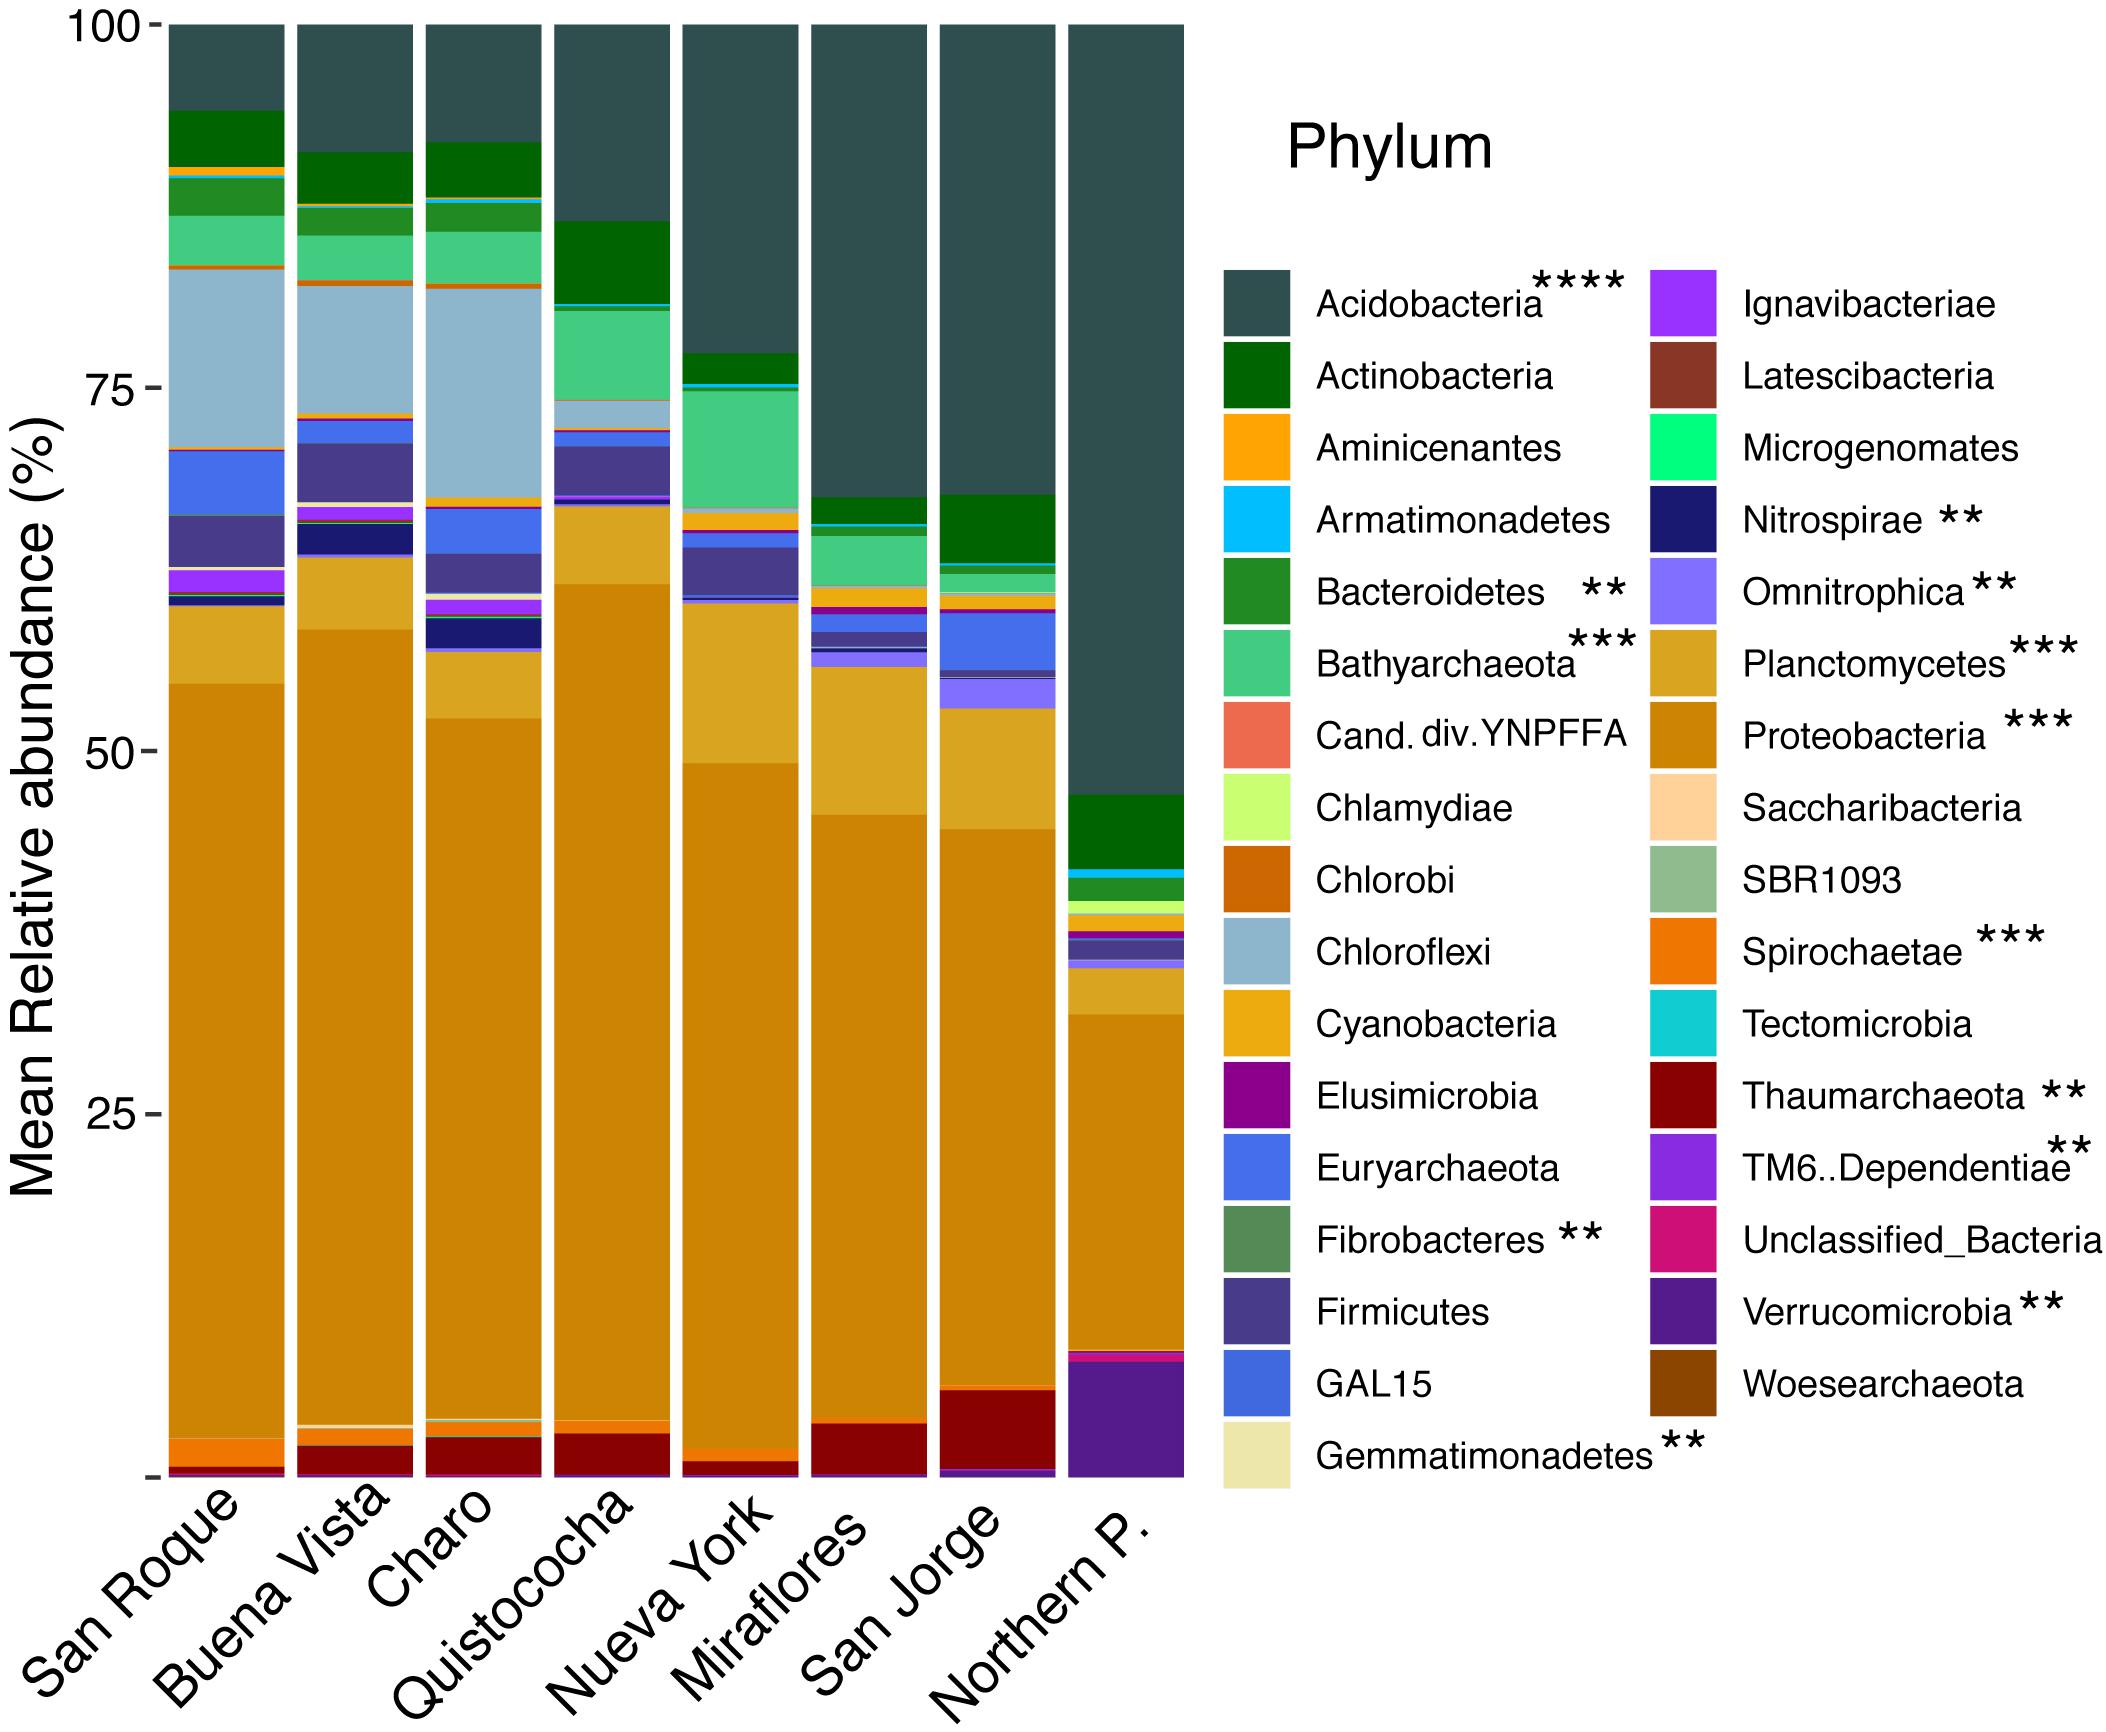
Figure 2. Stacked barplot of relative abundances (%) of Bacterial and Archaeal phyla across the Pastaza-Marañón Basin. Significant differences between phyla in the minerotrophic, mixed, ombrotrophic and Northern peatland groups are shown as: (**) differences between two groups; (***) differences between three groups; and (****) all groups differed. Phyla above 0.005% are shown. Relative abundances are the mean of six independent measurements for Amazon soils, and four for the Northern peatland soil.
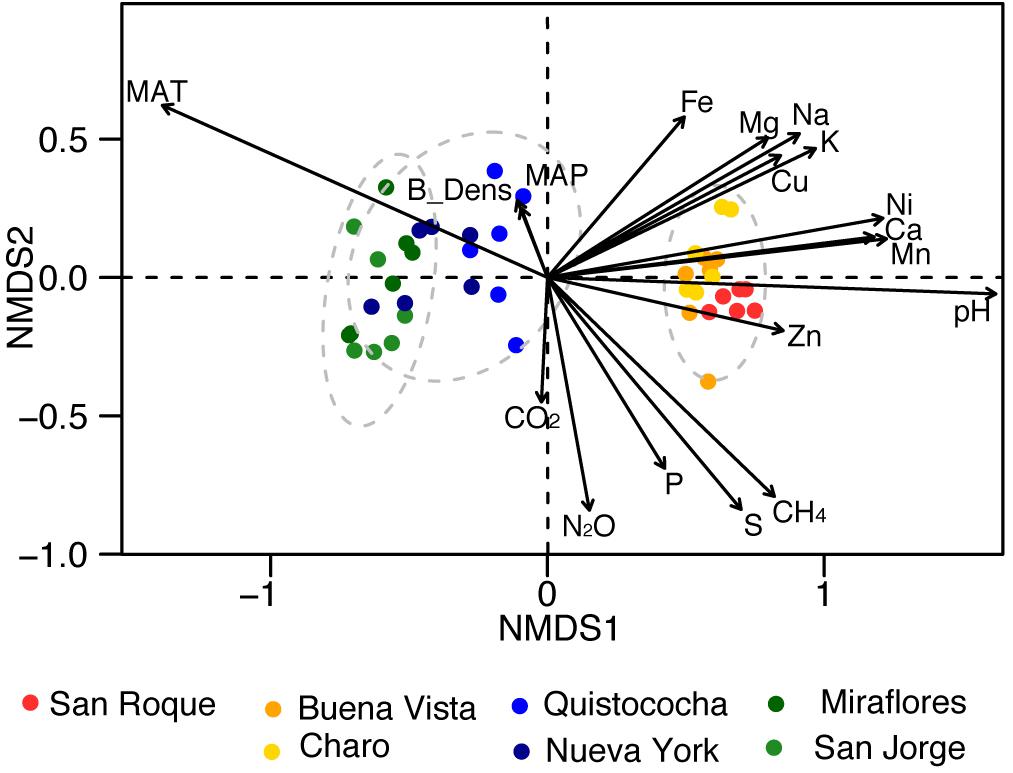
Figure 3. Non-metric multidimensional scaling (NMDS) of microbial community composition of the Pastaza-Marañón Basin peat soils (nodes), and climatological [MAT = mean annual temperature (°C) and MAP = mean annual precipitation (mm)], soil geochemical properties (B_Dens = bulk density, pH, Na, Mg, P, S, K, Ca, Mn, Fe, Ni, Cu, and Zn in units as per Table 1) and gas fluxes (CO2, CH4, and N2O in units as per Figure 1) as loadings. The dotted circles represent 95% confidence intervals of minerotrophic, mixed, and ombrotrophic communities.
Methanogen and Methanotroph Relationships Across the Nutrient Gradient
The values of relative abundances of methanogen and methanotroph families (Table 2) show that type II Methylocystaceae represented the most abundant methanotrophs in all peats and were not affected by nutrient content (p > 0.05) whereas Type I Methylococcaceae were only detectable in the minerotrophic peats. No Verrucomicrobial or anaerobic NC10 methanotrophs were identified at the 97% cut off level among reads. All methanogen families, with the exception of unclassified Methanomicrobia and Methanosarcinales, had highest abundances in the minerotrophic soils. Members of Methanobacteriaceae were the most dominant family in the minerotrophic soils and were almost no detectable in the ombrotrophic soils (p < 0.001). Methanoregulaceae, Methanosaetaceae, Methanosarcinaceae, Methanomicrobiaceae and Methanocellaceae all decreased with decreasing nutrient content (p < 0.005). Members of GOM Arc I (previously termed ANME-2d but not shown to be methanotrophic) were highly abundant in Charo but otherwise not affected by geochemical and nutrient conditions. Only members of the unclassified Methanomicrobia preferred oligotrophic and ombrotrophic peats to rich minerotrophic peats, however these organisms were in very low relative abundance (0.0006%). The OTUs assigned as unclassified Methanomicrobia, Methanomicrobiales or Methanosarcinales are based on environmental, uncultured 16S rRNA genes in the Silva 128 database that lack a close relative to a characterized methanogen family.
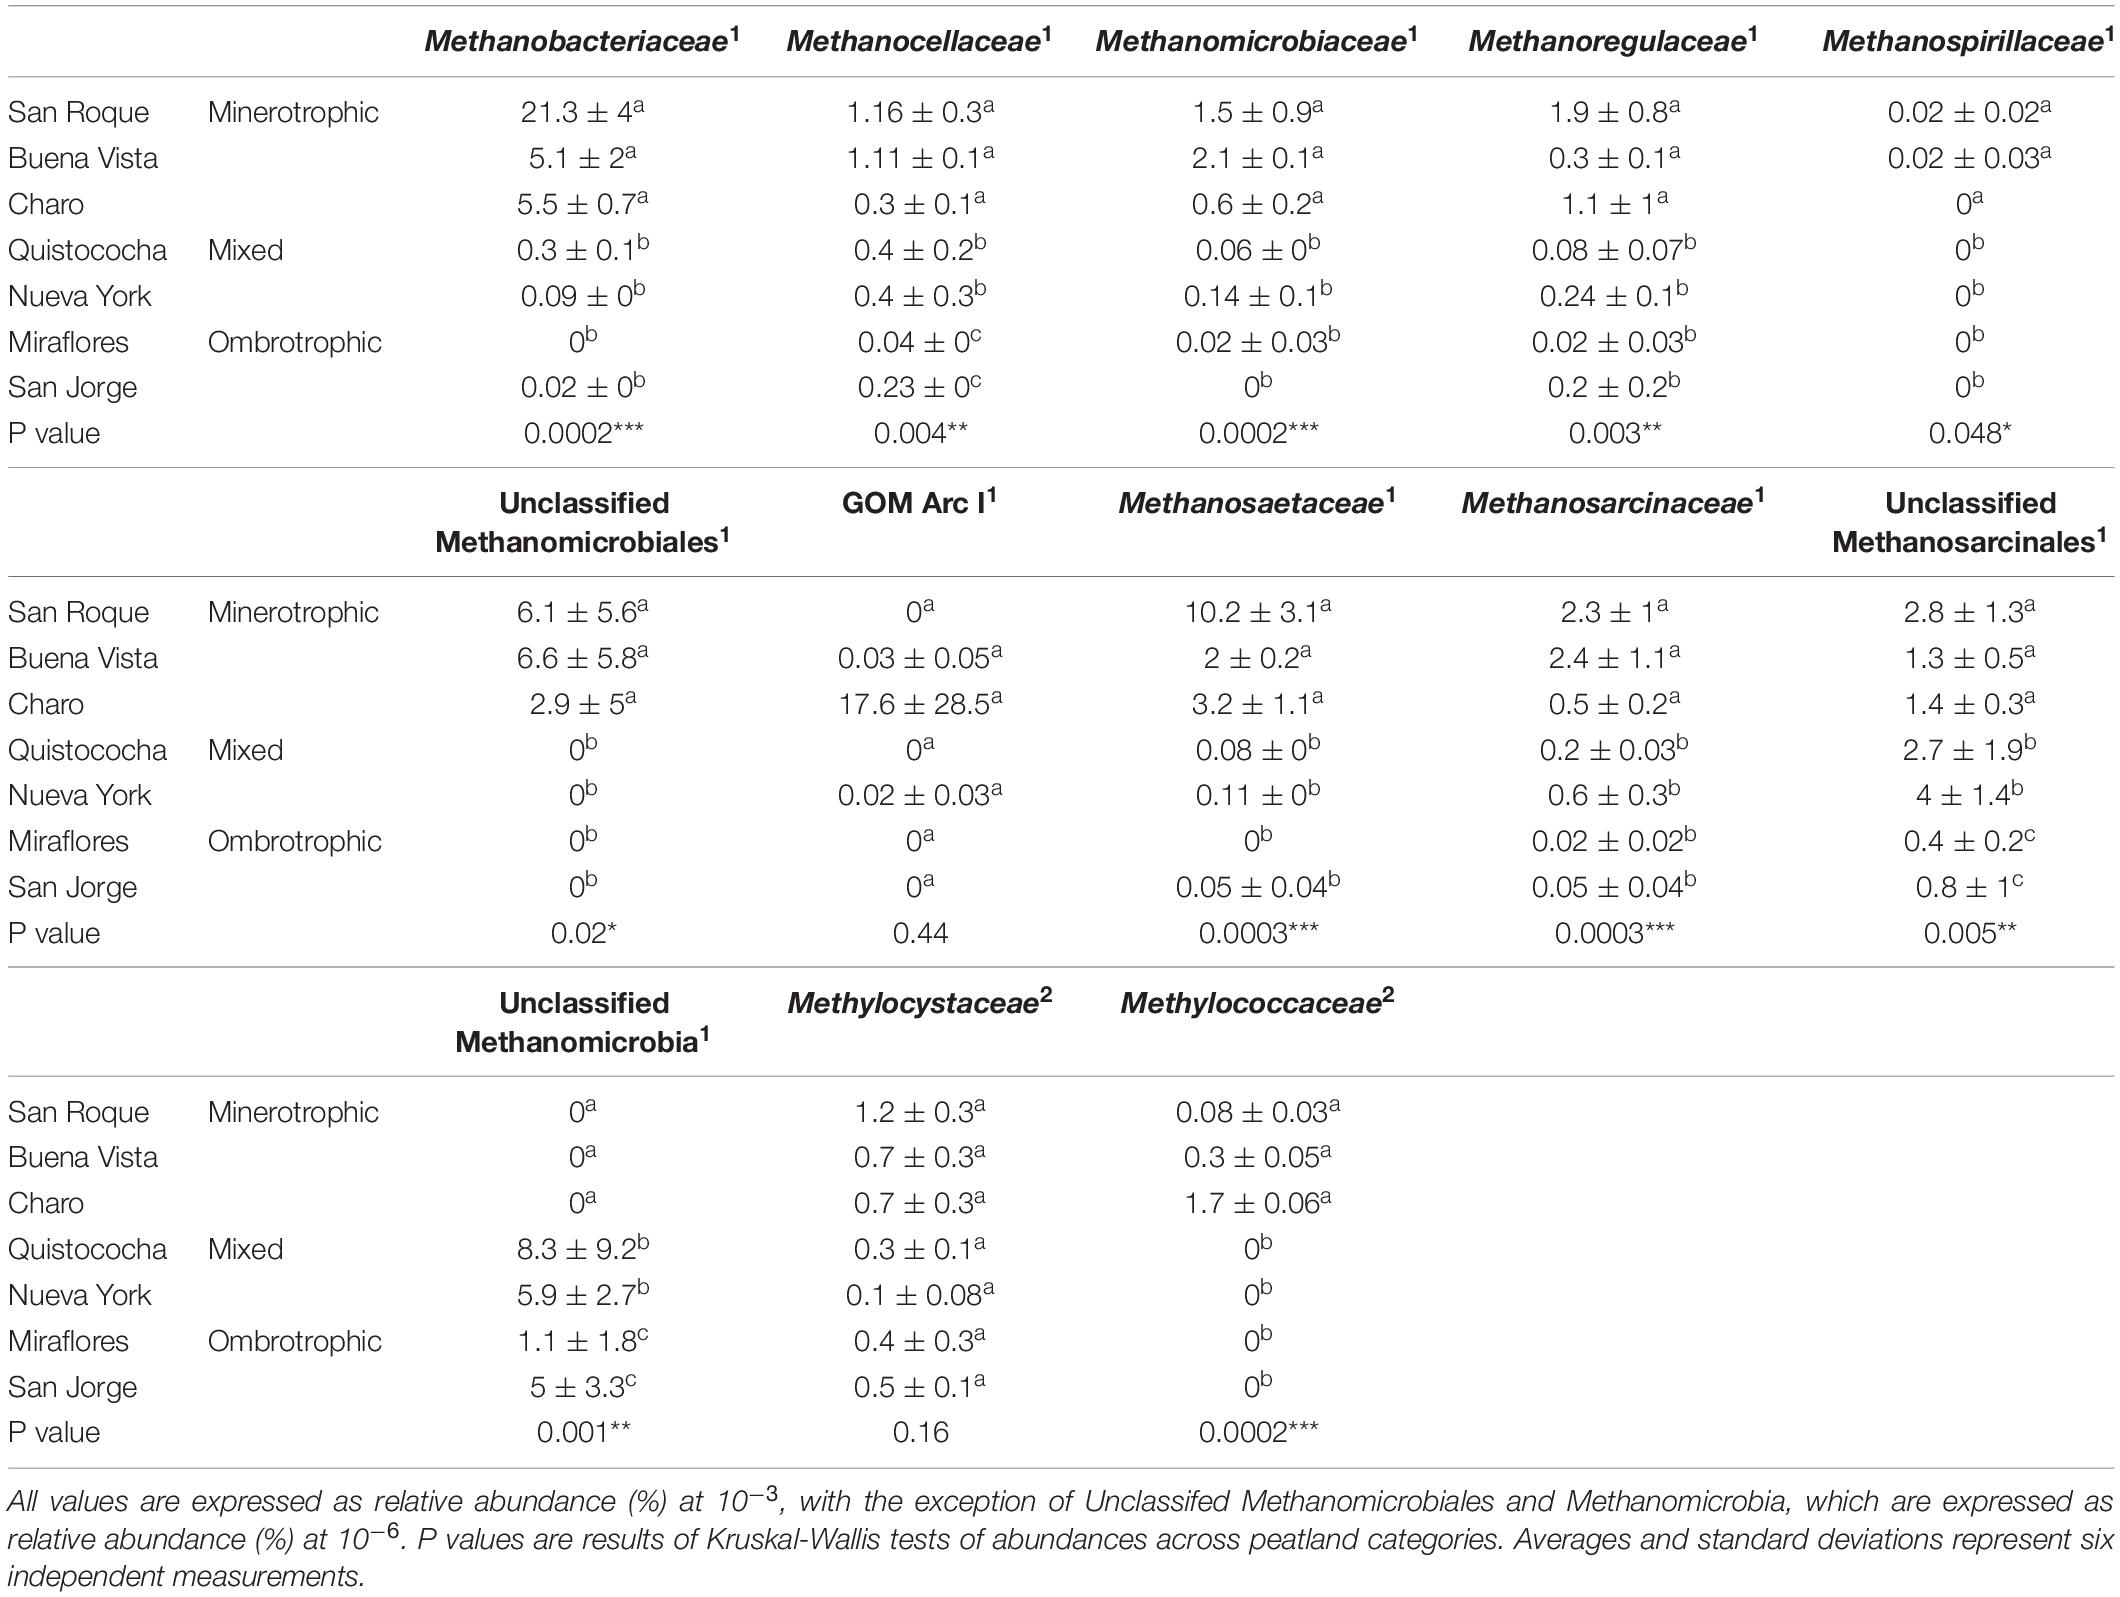
Table 2. Relative abundances of methanogen (1) and methanotroph (2) families across the Pastaza-Marañón Basin nutrient gradient.
Covariance network analysis of microbial families across peats showed three separate modules (Figure 4A). The abundant methanogens in the minerotrophic sites all clustered in Module One (blue). The Unclassified Methanomicrobia grouped with Module Three (green). Methanotrophic Methylococcacae, only identified in the minerotrophic soils, grouped with Module One. The more evenly dispersed Methylocystaceae grouped with Module Two (red), which was intermediate between Modules One and Three. The analysis of individual networks for minerotrophic, mixed and ombrotrophic communities (Figures 4B–D), showed that the total number of nodes (i.e., taxon families) decreased along the gradient (totals of 495, 327, and 301 in the minerotrophic, mixed and ombrotrophic networks, respectively). The variance to mean ratio (VMR) of node connectivity also decreased along the gradient as the number of highly connected, central nodes dispersed (VMRs of 0.81, 0.66, and 0.54 for minerotrophic, mixed and ombrotrophic networks, respectively). Finally, mean path length also decreased as nodes became more dispersed (lengths of 5.88, 2.95, and 2.81 for minerotrophic, mixed and ombrotrophic networks, respectively). A heatmap analysis of the connection frequency between methanogen/methanotroph nodes to significantly covarying nodes in individual networks (Figure 5), shows that methanogen nodes were most often connected to Actinobacteria, Chloroflexi, Firmicutes, Planctomycetes, Alpha- and Delta-Proteobacteria across all categories, and to Bacteroidetes, Thaumarchaeota and Verrucomicrobia and other Euryarchaeota to a lesser degree. Connections to Delta-Proteobacteria were primarily to sulfate reducers (Desulfaculaceae, Desulfobacteraceae, Desulfurellaceae, Desulfovibrionaceae) and the family Syntrophorhabdaceae (Supplementary Table 2). Connections to Alpha-Proteobacteria were between methanogens and methanotrophic Methylocystaceae, Rhizobiaceae, and Sphingomonads (Supplementary Table 2). Methylocystaceae methanotrophs were predominantly connected to varied Alpha-, Beta-, Delta- and Gamma-Proteobacteria. Methylococcaceae showed sparse connections to other Gamma-Proteobacteria, Saccharibacteria, Spirochaetae, Tectomicrobia, TM6, and Verrucomicrobia in the minerotrophic network (Figure 5).
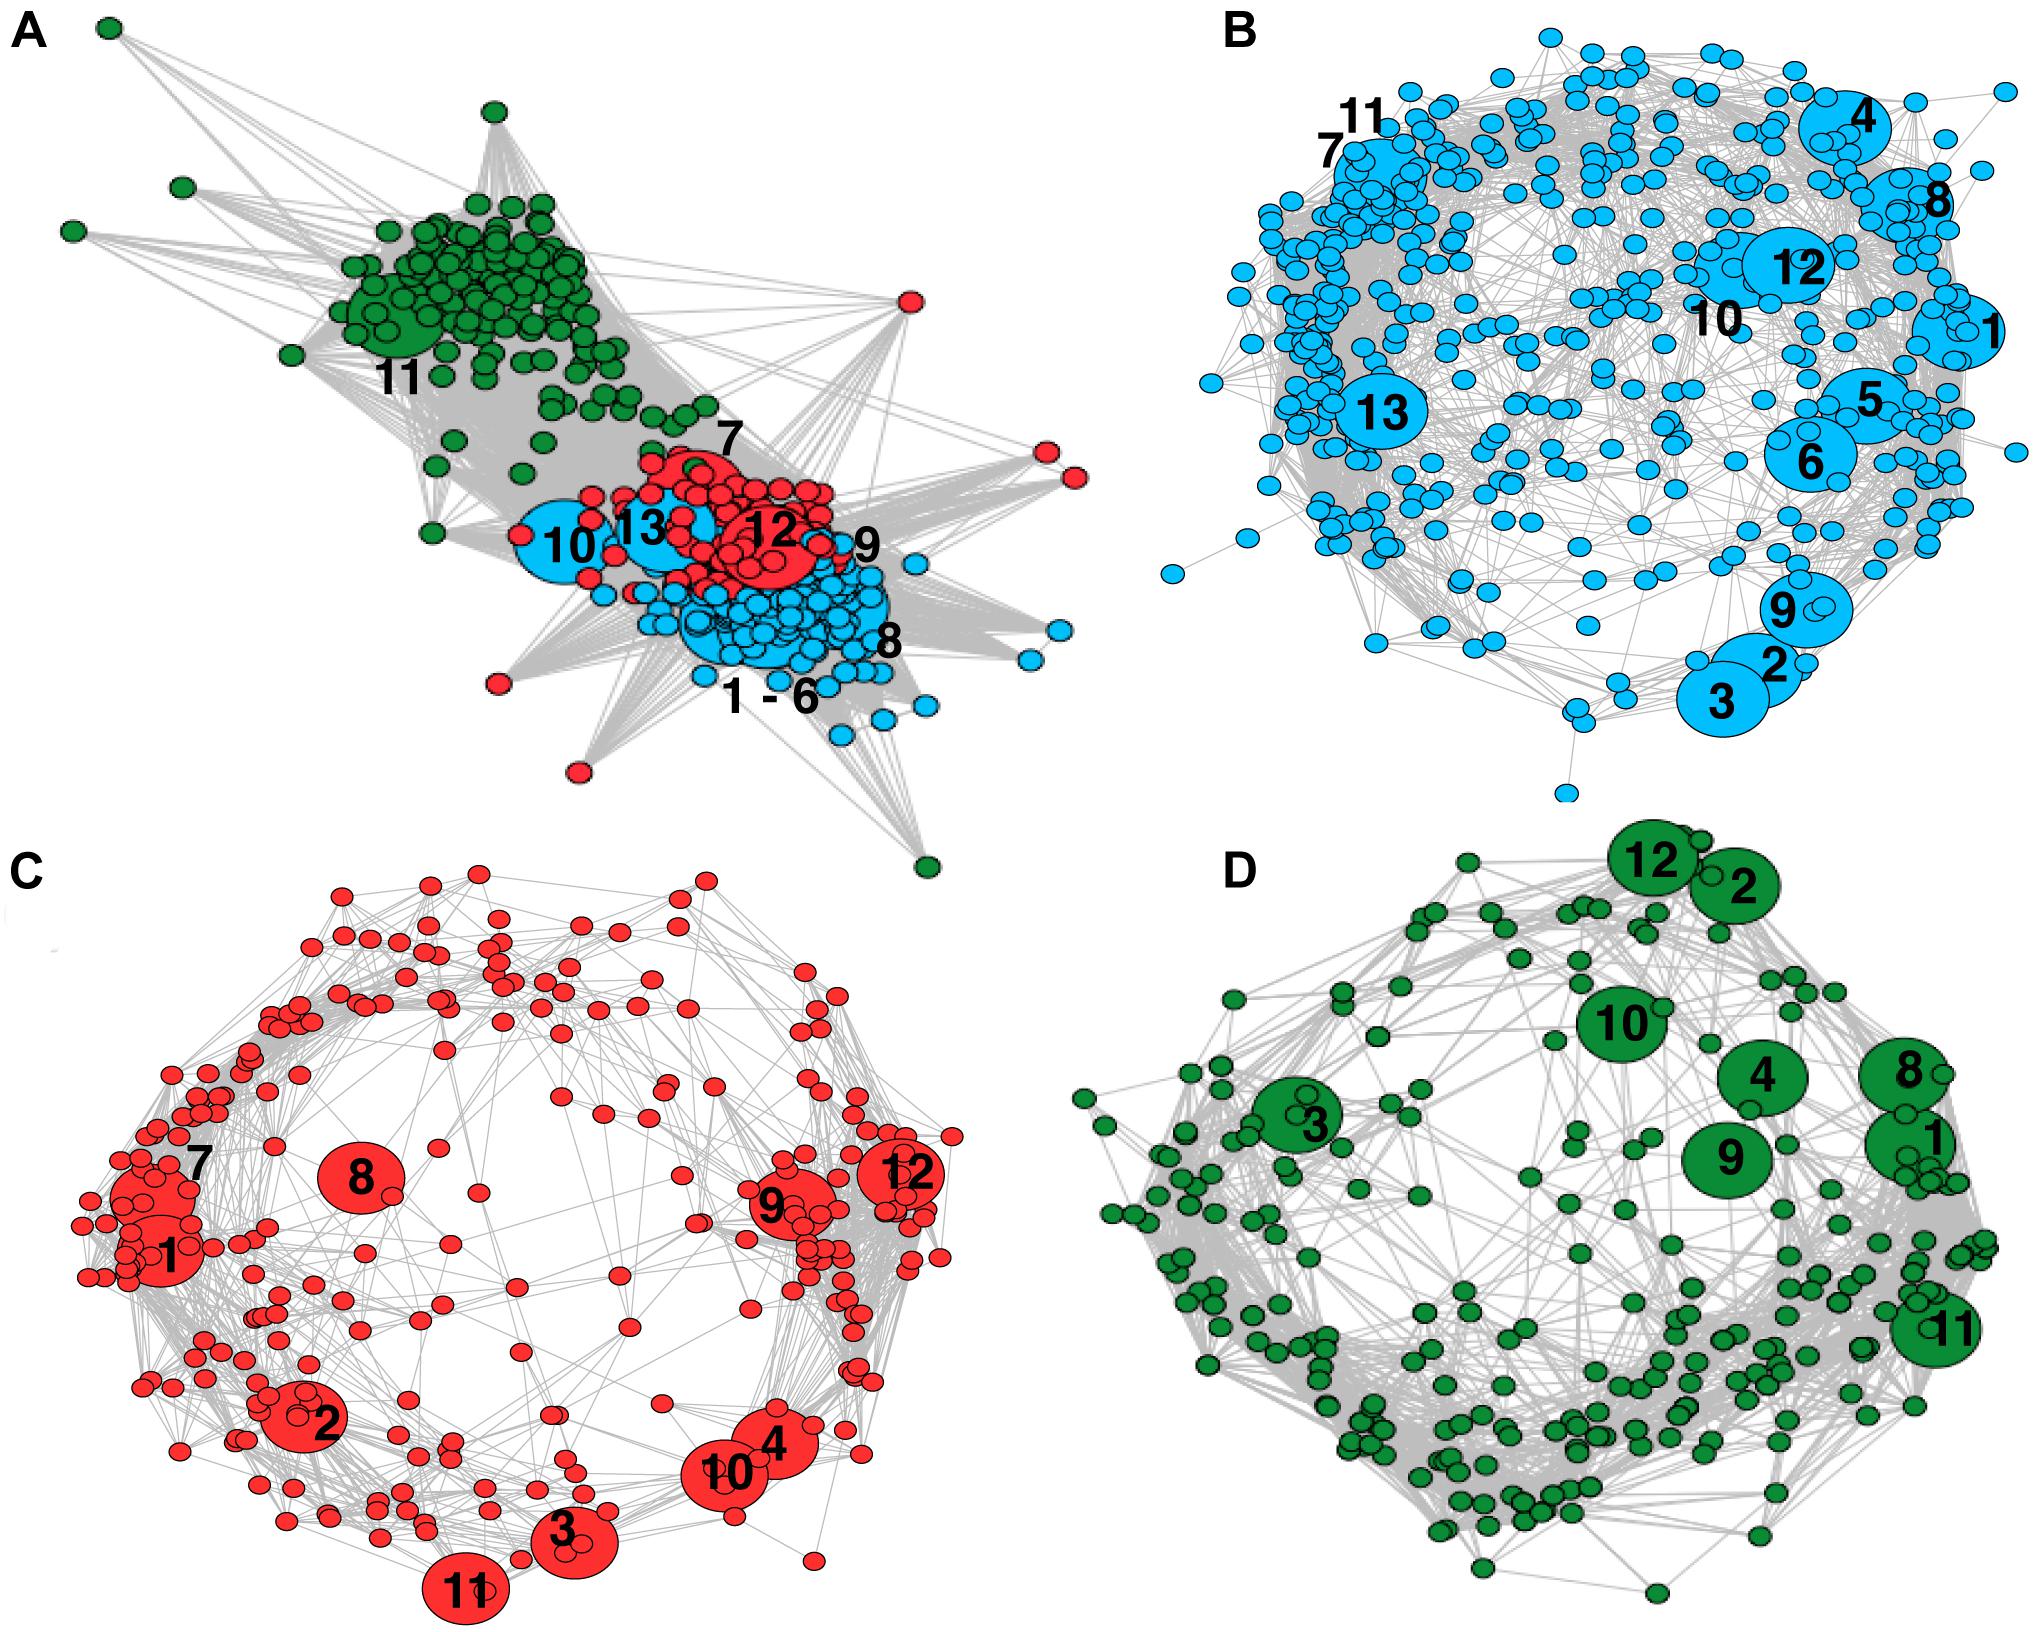
Figure 4. Weighted network analyses of OTU covariance across Pastaza-Marañón Basin peat soils. Nodes represent individual OTUs grouped at the family level. Edges represent significantly covarying OTUs (p < 0.05). Methanogen and methanotroph nodes have been enlarged relative to other nodes, and are labeled at the family level. The numbering scheme is as follows: Methanobacteriaceae (1); Methanocellaceae (2); Methanomicrobiaceae (3); Methanoregulaceae (4); Methanospirillaceae (5); Uncultured Methanomicrobiales (6); GOM Arc I (7); Methanosaetaceae (8); Methanosarcinaceae (9); Uncultured Methanosarcinales (10); Uncultured Methanomicrobia (11); Methylocystaceae (12); Methylococcaceae (13). (A) network of all peatland communities. Nodes are colored by modularity calculated with the Spinglass technique, Module One (blue), Module Two (red), and Module Three (green). Most methanogen and Methylococcaceae aggregated in Module One, with Methylocystaceae in Two and Uncultured Methanomicrobia in Three. (B) A network of the minerotrophic sites (San Roque, Buena Vista and Charo). (C) A network of the mixed sites (Quistococha and Nueva York). (D) A network of the ombrotrophic sites (Miraflores and San Jorge).
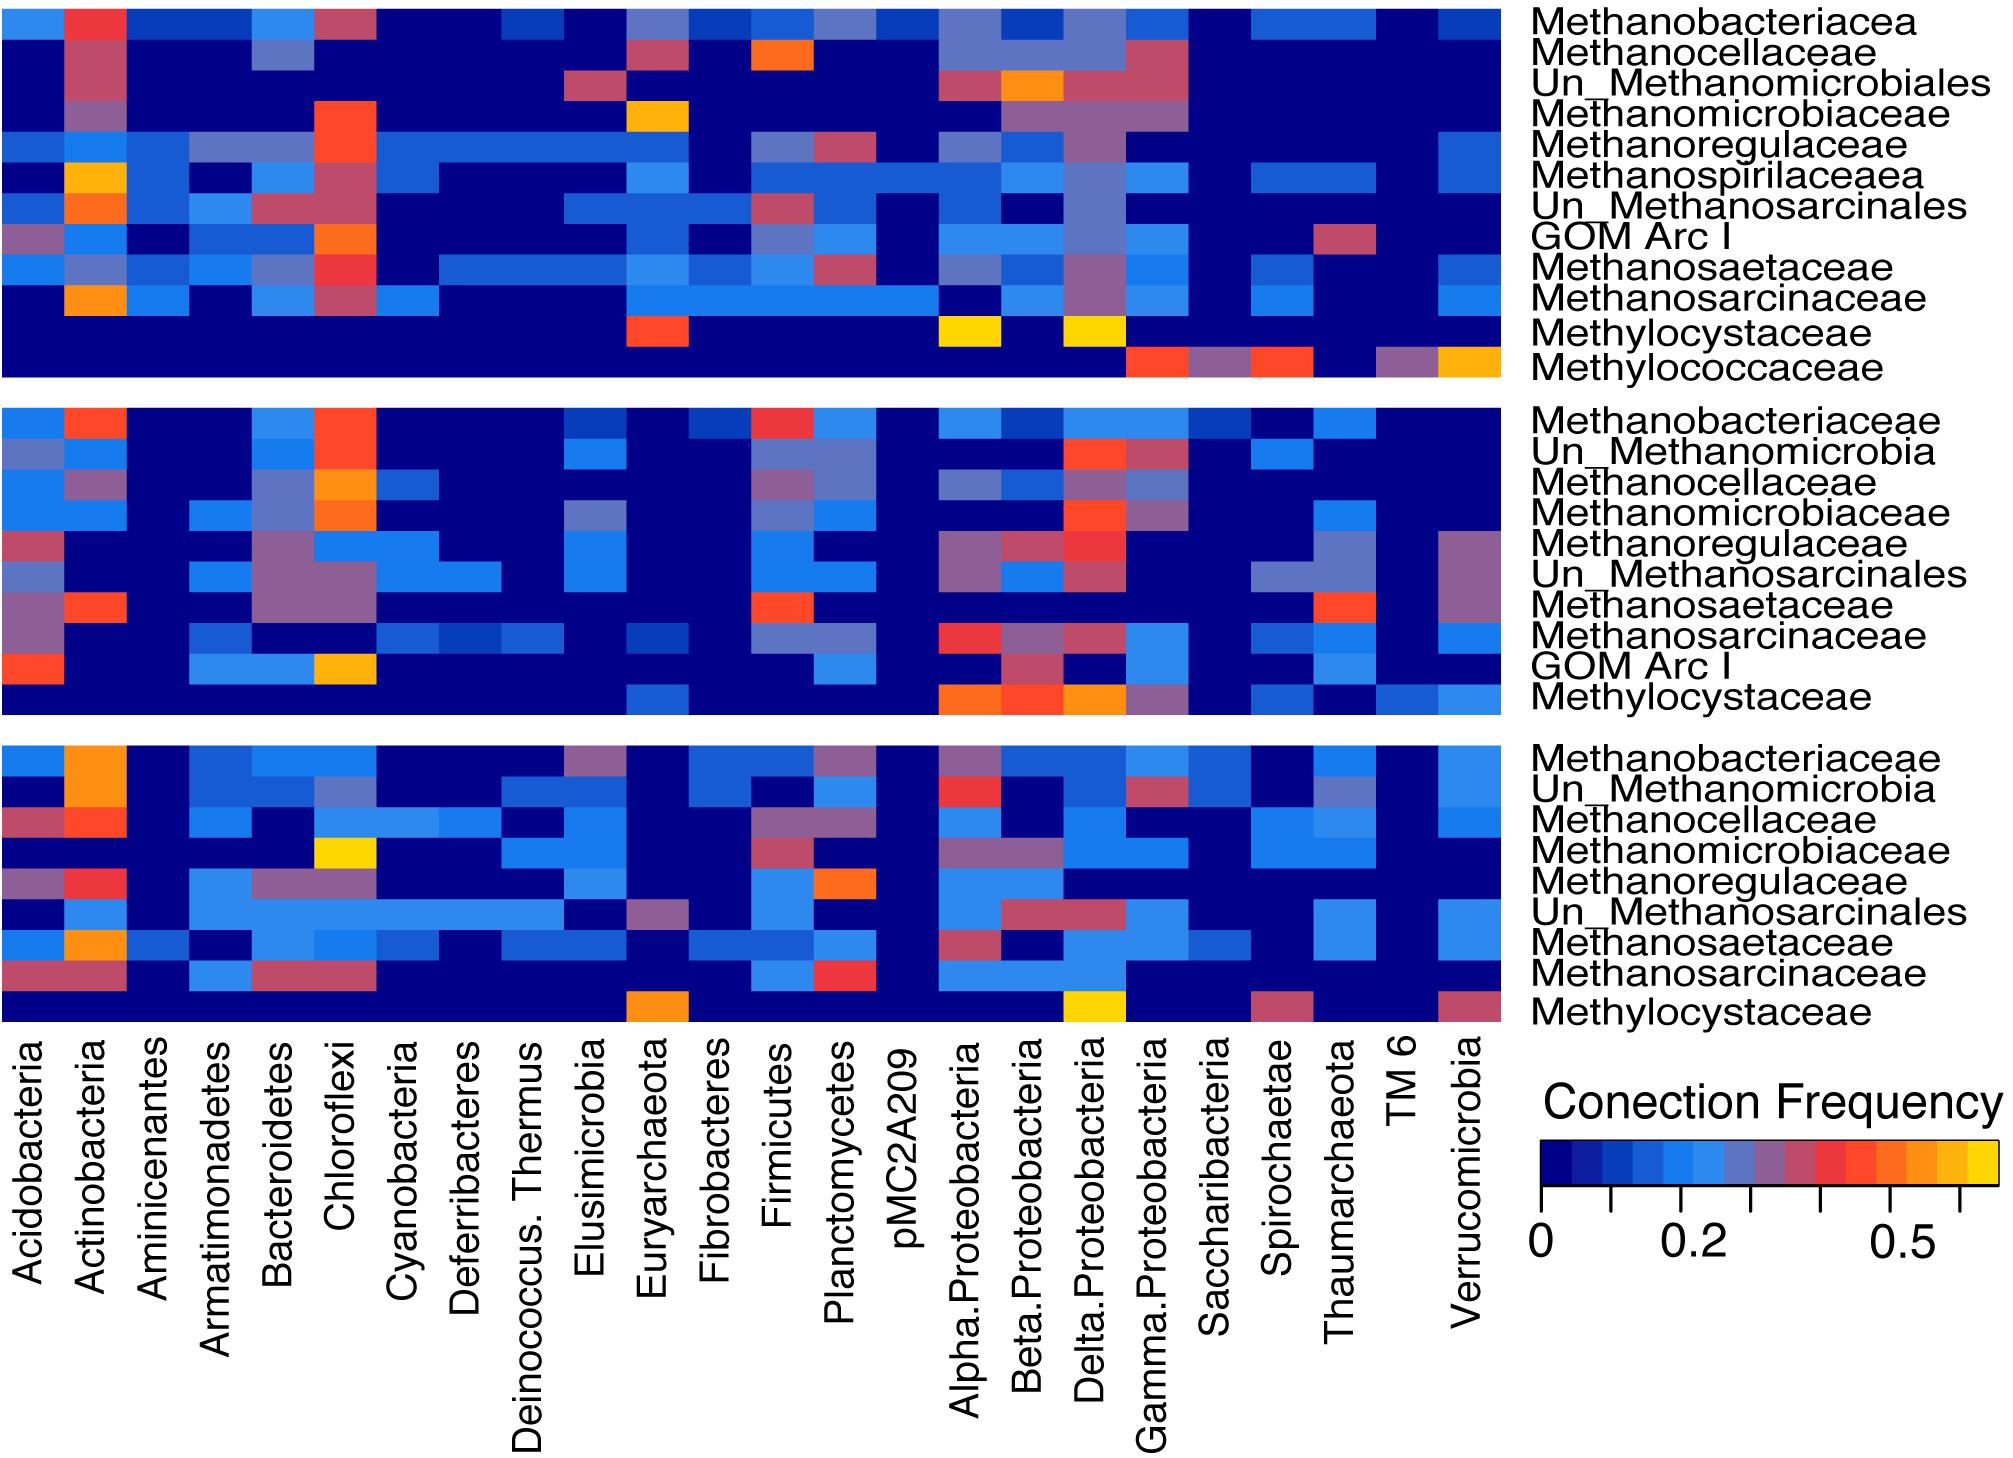
Figure 5. Heatmap of connection frequencies between methanogen and methanotroph nodes to significantly covarying nodes (p < 0.05) from minerotrophic (blue), mixed (red), and ombrotrophic (green) networks. Covarying nodes on the y axis are reported at the Phylum level. Scaled frequencies range from zero (dark blue) to 0.7 (yellow). Units are Hellinger transformed discrete counts of node connections.
Rank abundance curves of methanogen and methanotroph families (Figure 6A) and AIC model comparisons demonstrated geometric distributions (i.e., a poorly structured community) for minerotrophic (blue) (R2 = 0.95) and mixed (red) (R2 = 0.93) communities, whereas the ombrotrophic community had a log-normal distribution (green) (R2 = 0.97) indicative of a highly structured community. Finally, the V-ratio of co-occurrence of methanotroph and methanogen families was 1.6131, which was significantly greater than the upper 95% tail of 1000 permutations of the family matrix (mean of 0.99, standard deviation of 0.04, Figure 6B.).
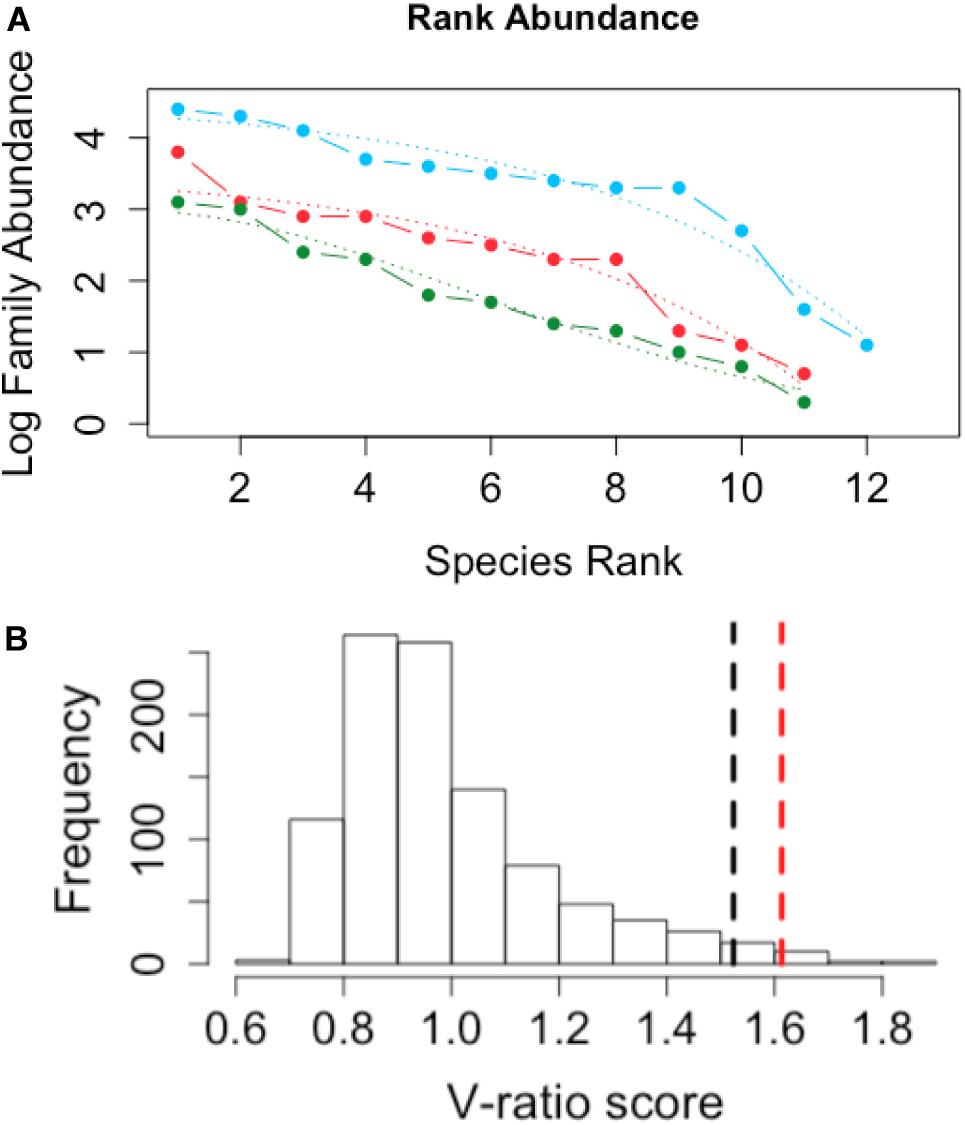
Figure 6. (A) Species Rank abundance for minerotrophic (blue), mixed (red), and ombrotrophic (green) methanogen and methanotroph families. Dotted lines indicate geometric (minerotrophic and mixed) and log-normal model (ombrotrophic) fits for communities from the three peatland categories. (B) Histogram of the distribution of null species co-occurrence, measured as the V-ratio, with a randomized null model. The black dotted line indicates the two-tailed upper 95% tail. The red dotted line indicates the observed V-ratio of methanogen and methanotroph families. The null model was simulated with 1000 replications.
Discussion
Variation in CH4 Flux Across the Nutrient Gradient
Methane fluxes from tropical wetlands can vary greatly, from atmospheric uptake to 30 mg CH4-C m2 h–1, indicative of the underlying complexities that contribute to CH4 flux (Bartlett and Harriss, 1993; Sjogersten et al., 2014; Zhu et al., 2015). Both flight-derived measurements above the Amazon Basin and ground-level field-scale measurements agree that regional differences arising from vegetation type, hydrology and soil pH are important contributors to CH4 flux (Wilson et al., 2016; Teh et al., 2017; Winton et al., 2017). Consistently greater fluxes occur from high-productivity vegetation and nutrient rich soils types that experience seasonal flooding (minerotrophic), compared to rainfall-fed (ombrotrophic) poor and low-productivity vegetation types, which emphasizes the complex interactions between seasonality, hydrology and biological processes in the Amazon Basin (Lahteenoja et al., 2009; Teh et al., 2017).
The measurements recorded here, of 0.3 to 2.5 mg CH4-C m2 h–1, are in similar range to measurements previously collected in diverse wetlands and flooded areas in the Amazon basin, 0.08 to 6 mg CH4-C m2 h–1 (Bartlett et al., 1988; Richey et al., 1988; Bartlett et al., 1990; Miller et al., 2007; Belger et al., 2011). However, CH4 values in this study are in a lower range than those observed in the only other multisite measurements completed in peatlands of Pastaza-Marañón Basin for their dry season measurements (1.8–31 mg CH4-C m2 h–1) (Teh et al., 2017). Nevertheless, the opposite was observed in N2O flux rates in comparison to that same study (0.5–100 vs. ∼0.03–0.87 ug N2O-N m2 h–1 respectively) (Teh et al., 2017). The observed differences between studies are likely explained by the different sampling design, inclusion or not of temporal component in either study, and methodological differences in gas collection indicating further studies, common methodologies and common benchmarks are still needed to better understand CH4 flux variation in the Amazon and develop more accurate regional estimates. Our study did not aim to record seasonal variation which can significantly change CH4 flux in the Pastaza-Marañón peatlands (Teh et al., 2017), but focused on differences across sites in the same season with flux sampling during similar times of day (±3 h around midday) to reduce potential effects of day fluctuations. We found a strong relationship between CH4 flux, nutrient content and pH (LDS test Table 1, and Kruskal-Wallis, p = 0.03) similar to general findings of other studies in both Northern and tropical peatlands (Bartlett and Harriss, 1993; Lai, 2009; Ye et al., 2012; Teh et al., 2017; Winton et al., 2017). The minerotrophic Charo site proved an exception to this, as CH4 fluxes from this site mirrored the mixed and ombrotrophic sites. High concentrations of Fe (356 ± 90 g kg–1 dry soil) and Mn (411 ± 73.8 mg kg–1 dry soil) were present at Charo. In fact, supplementary water chemistry assessments also showed that the concentration of sulfate was also high at Charo compared to the other peatland sites (16.4 ± 9.3 mg L–1 versus 0.1 – 1.67 mg L–1, Supplementary Table 1). As microbial Fe (III), Mn and sulfate reduction are more energetically favorable than methanogenesis (Dubey, 2005) the low CH4 flux observed at Charo is explained by the occurrence of microbial respiration based on alternative terminal electron acceptor for anaerobic respiration (like Fe, Mn, SO4) which are more energetically favorable and outcompete methanogens for several substrates (acetate, formate, etc.) (Bridgham et al., 2013). This was not observed in the other two minerotrophic sites and underscore the importance of evaluating the geochemistry of amazon peatlands as a control of methanogenesis.
Composition of Microbial Phyla Across the Nutrient Gradient
In terms of overall community composition, the dominant Proteobacteria decreased from minerotrophic to ombrotrophic sites, counter mirrored by an increase in the fraction of Acidobacteria in the same gradient. A dominance of Proteobacteria in near-neutral, minerotrophic Northern (Zhou et al., 2017) and poor (pH 3.8) tropical peatlands has been reported in previous community surveys (Espenberg et al., 2018). Similarly, a more dramatic shift in the community favoring Acidobacteria has been found in acidic, nutrient-poor ombrotrophic Northern and tropical peatlands (Jackson et al., 2009; Lin et al., 2012; Lin et al., 2014), and is apparent in the Northern peatland included here for general comparison (pH ∼ 3.5). Bacteroidetes, Firmicutes, Actinobacteria and Chloroflexi represent secondarily dominant phyla in Northern and tropical peatlands, as observed here. Unique to this study was to note relatively high abundances of Bathyarchaeota (up to 8% in the mixed) and Thaumarchaeota (up to 5% in the ombrotrophic peats). As the Bathyarchaeota have only recently been reclassified and incorporated into 16S rRNA gene reference databases, their distribution in terrestrial environments is still not yet fully accounted, but appear to dominate Archaeal communities in some peat, freshwater wetland and mangrove sediments (Xiang et al., 2017). In the comparison to reads from a Northern peatland site incorporated here, Bathyarchaeota were detectable at a mean relative abundance of 0.006%, suggesting a preference for tropical peatlands. However, since Northern peatlands have been shown to hold significant variation in microbial diversity, a more comprehensive comparison against more sites is required to better assess Bathyarchaeota or other group’s preferences. Thaumarchaeota have recently become of great interest as certain isolates are involved in aerobic ammonia oxidation (Brochier-Armanet et al., 2012). These Archaea have also been shown to form macroscopic filaments attached to surfaces in tropical mangrove sediments, that support symbiotic growth of sulfur reducing Proteobacteria (Muller et al., 2010). The environmental role of Bathyarchaeota and Thaumarchaeota in these tropical peatlands remains to be determined.
Methanogen and Methanotroph Family Assemblages Across the Gradient
Methane flux from peatlands is a combined effect of in situ production versus consumption due to the activity of methanogens and methanotrophs, respectively. Methanogenic activity is further constrained by the supply of methanogenic substrates from heterotrophic activity or competition for methanogenic substrate consumption when alternative terminal electron acceptors are available in the ecosystem (Garcia et al., 2000). These two factors make methanogens sensitive to nutrient conditions affecting heterotrophs or competitors, while aerobic methanotrophs can be effected by levels of CH4 or competition for O2 as a shared electron acceptor with other aerobic heterotrophs.
Here we use the relative abundance of a taxonomic unit as a proxy for an organism’s fitness under certain conditions. Relative abundance is a reflection of the capacity of an organism to out-compete others for control of a limiting resource (Pielou, 1975). Such competition gives rise to highly structured, non-uniform species assemblages whereby each species can be considered as occupying a distinct niche (Sugihara, 1980). We sought to investigate how the environment and potential microbial taxa interactions affect methanogenic and methanotrophic communities and whether changes in community assembly were associated with CH4 flux. While de novo genome assemblies suggest that members of the Bathyarchaeota may be capable of methanogenesis (Evans et al., 2015), other studies have demonstrated acetogenic (He et al., 2016) and heterotrophic (Maus et al., 2018; Yu et al., 2018) metabolism by this phyla, and so this taxonomic group was not included in ecological analyses as methanogens. Furthermore, while GOM Arc I were initially termed ANME-2d, this group is neither monophyletic with other ANME groups nor has it been shown to consume CH4 (Lloyd et al., 2006) and so GOM Arc I were considered as methanogens here.
Interestingly, optimal modularity of a network of all peatlands in study agreed with their a priori categorization into three categories. By separating this network based on water geochemistry/nutrient categories and constructing sub-networks, it was clear that connectivity within networks decreased as nodes generally became less central with decreasing mineral levels from minerotrophic to ombrotrophic. From these sub-networks it was possible to gauge the frequency of connections between methanogens/methanotrophs and other phyla. Methanogens were most commonly associated with anaerobic sulfate reducing Delta-Proteobacteria, methanotrophic Alpha-Proteobacterial Methylocystaceae, Actinobacteria, Firmicutes and Chloroflexi. Actinobacteria and Firmicutes include many primary and secondary fermenters (including known syntrophs) sustaining methanogens as shown in northern peatlands (Drake et al., 2009; Wust et al., 2009). The positive covariance between competitive methanogens and sulfate reducers was surprising. However, sulfate reducing Delta-Proteobacteria have been shown to be predominant members of peatland microflora previously (Morales et al., 2006; Lin et al., 2014; Zhou et al., 2017), while it has also been observed that certain hydrogenotrophic methanogens, such as Methanobacteriaceae and Methanomicrobia that dominated these systems, can coexist in vitro and generate CH4 in a stable manner while in co-culture with sulfate reducers (Chen et al., 2018). Indeed, as sulfate reducers can utilize propionate, butyrate, lactate and acetate as alternative electron donors to hydrogen, the potential for coexistence between sulfate reducers and methanogens has been noted for some time (Bryant et al., 1977; Muyzer and Stams, 2008). A relationship between methanogens and methanotrophic Methylocystaceae was not surprising, although the absence of an interaction with Methylococcaceae was. This may be a result of differences in methanotroph ecophysiology, explained in greater detail below. Actinobacteria play a vital role in the catabolism of plant-derived organic matter, important for the initial stages of decomposition (Goodfellow and Williams, 1983; Bentley et al., 2002; Berlemont and Martiny, 2013). The phylum Firmicutes includes many well-characterized heterotrophs responsible for producing partially fermented organic compounds suitable for methanogens, and have been noted to positively covary with methanogens when enriched in batch culture (Sierocinski et al., 2018). In fact, primary and secondary fermenters in Actinobacteria and Firmicutes have been shown sustaining methanogenic metabolism in northern peatland soils (Drake et al., 2009; Wust et al., 2009). Finally, while Chloroflexi are less understood, in silico analyses suggest that this phyla is also involved in the anaerobic degradation of plant-derived organic matter (Hug et al., 2013). Thus, these taxa in consort with methanogens may play an important role in the synergistic degradation of plant-derived organic matter and CH4 cycling in these peatlands. The methanotrophs primarily demonstrated associations with other Proteobacteria, particularly with the more dominant and evenly dispersed Methylocystaceae. This may imply some level of metabolic codependence between Proteobacterial taxa (Morris et al., 2012; Sachs and Hollowell, 2012), which has been demonstrated in co-cultures of methanotrophs and heterotrophic Proteobacteria (Iguchi et al., 2011; Ho et al., 2014; Jeong and Kim, 2018). Also, methanotrophs produce methanol as part of their metabolism and it has been shown they could accumulate it externally upon inhibition of their methanol dehydrogenase (Patel et al., 2016), and putatively could support methylotrophic Proteobacteria. Alternatively, this effect may simply be a product of strong covariance between highly dominant Proteobacteria.
The modularity visualized with the network were supported further as either geometric (minerotrophic and mixed) or log-normal (ombrotrophic) rank distributions (Figure 6A). A log-normal rank distribution is reflective of highly structured, hierarchical communities whereby taxonomic units are separated based on niche differentiation (Preston, 1962) whereas a geometric distribution is reflective of poorly even distributions whereby few taxa of the highest ranks are highly competitive and monopolize available resources at the expense of others (Ludwig and Reynolds, 1988). Also, the null hypothesis of an absence of structured assemblages was rejected based on the V-ratio of methanogen and methanotroph family distributions (p < 0.05, Figure 6B). A V-ratio significantly greater than one indicates aggregation of taxa assemblages (Gotelli, 2000), which was driven by aggregations of methanogen families and Type I Methylococcaceae methanotrophs in the minerotrophic systems. Taken together, all these evidences support a structured, niche-dependent ecology of methanogens and Type I Methylococcaceae in the Pastaza-Marañón Basin.
Ecophysiology of Methanogen and Methanotroph Families
It has been shown previously that methanogen species richness is higher in minerotrophic versus ombrotrophic northern peatlands (Juottonen et al., 2005; Lin et al., 2012). There are likely multiple underlying reasons for this, and for the structured community assemblages in the Pastaza-Marañón Basin. Plant net primary productivity is highest in minerotrophic peatlands relative to others, and higher quantities of plant root exudates can provide potential methanogenic substrates to communities (Whiting and Chanton, 1993). The ombrotrophic peats of this study (Miraflores and San Jorge) are dominated by ‘pole forest’ species (Draper et al., 2014) which are expected to provide more phenolic-like compounds to the peat. Additions of Fe, Ni, Co, and Na have an immediate, positive effect on CH4 production in peatland soils, as these metals can be limiting cofactors for enzymes involved in microbial fermentation and/or methanogenesis (Basiliko and Yavitt, 2001). Finally, methanogenic activity is highly sensitive to pH and both hydrogenotrophic and acetoclastic methanogenesis decreases if the pH is less than 4.5 (Ye et al., 2012).
While the majority of methanogens favored the minerotrophic peats, the abundances of methanogen families differed. The most dominant families in the minerotrophic peatlands were Methanobacteriaceae and Methanosataceae. Methanobacteriaceae are hydrogenotrophic methanogens that typically dominate minerotrophic northern peats (Juottonen et al., 2005; Steinberg and Regan, 2008; Lin et al., 2012). Hydrogenotrophic methanogenesis is more energetically favorable than acetoclastic methanogenesis (−131 vs. −31 ΔG°’ kJ mol–1 CH4, respectively) (Garcia et al., 2000; Thauer et al., 2008). This could explain the dominance of the methanogen population by Methanobacteriaceae relative to acetoclastic Methanosataceae. Simultaneously, the greater abundance of acetoclastic Methanosataceae relative to other hydrogenotrophs could be as it occupies a separate, substrate-dependent niche to the most successful hydrogenotroph, Methanobacteriaceae.
The distributions of Methanobacteriaceae and Methanosataceae were primarily constrained to the minerotrophic peatlands. In the mixed and ombrotrophic environments, the dominant hydrogenotrophic and acetoclastic methanogens were Unclassified Methanomicrobia and Unclassified Methanosarcinales, respectively. The Class Methanomicrobia includes a wide range of Orders, such as Methanocellales, Methanomicrobiales and Methanosarcinales. That these OTUs could not be classified to the Family level suggests there are novel, uncultured methanogens in these mixed and ombrotrophic tropical peatlands. A number of traits in these groups may be favored in such environments. For example, Methanocellales may be uniquely equipped for nutrient-poor, low productivity environments, as they effectively utilize hydrogen under partial pressures reaching the thermodynamic limit of methanogenesis, and dinitrogen-fixation pathways have been identified in several genomes (Lyu and Lu, 2015). Methanosarcinales are metabolically diverse and demonstrate greater growth yield efficiency than hydrogenotrophic methanogens (7.2 vs. up to 3 g biomass mol–1 CH4, respectively) (Thauer et al., 2008).
Similarly to methanogens, methanotroph families demonstrated non-uniform distributions. Methylocystaceae dominance is consistent with observations in northern peatlands (Wieczorek et al., 2011;Andersen et al., 2013) and a forested swamp peatland in Malaysia (Too et al., 2018), and its abundance was unaffected by nutrient content or the relatively low CH4 fluxes from oligotrophic and ombrotrophic peats. Unlike Methylococcacae, Methylocystaceae can utilize carbon sources other than CH4 such as acetate, oxidize CH4 at relatively low oxygen concentrations, and can survive periods of anoxia via storing carbon intracellularly as poly beta-hydroxybutyrate (Vecherskaya et al., 2001; Semrau et al., 2011). As with Methanocellales, these traits allow Methylocystaceae to dominate nutrient-poor environments. Conversely, Methylococcaceae methanotrophs tend to occupy nutrient-rich environmental niches and are dependent on relatively higher concentrations of CH4 (Whittenbury et al., 1970). ANME or NC10 methanotrophs were not identified in this study at analyzed peat depths (0 – 30 cm), which could be explained by absence or low density at this water-saturated shallow depths. One study targeting deeper layers (80 – 135 cm) identified anaerobic methanotrophs in a northern peatland (Zhu et al., 2012), while others identified similar groups in shallow layers (top 15 cm) in wetlands (Segarra et al., 2015;Valenzuela et al., 2017). Since this study, did not target deeper layers to account for anaerobic methanotrophs then the role of nutrient concentration on below-surface anaerobic methanotroph communities, if any, is not addressed by the field sampling design used here.
Relevance for Regional CH4 Fluxes in the Amazon Basin
As has been shown for northern peatlands, our results show a putative coupling between peat geochemical and nutrient content and CH4 flux (Whiting and Chanton, 1993). This has implications both for improvement of global CH4 biogeochemical models and can inform environmental regulations concerning peatlands. Although tropical peatlands are known to be fundamental players in global CH4 cycling, there is a concerning lack of empirical data to support GHG modeling (Sjogersten et al., 2014). Targeted measurements based on historical knowledge of nutrient status and hydrological patterns may assist in continent scale modeling of CH4 flux. Furthermore, anthropological disturbance of peatlands has consequences for ecosystem scale C and nutrient cycling (Andersen et al., 2013). As nutrient status could be key for regulating microbial communities involved in CH4 flux, changes to hydrological regimes and agricultural nutrient deposition has the potential to increase atmospheric CH4 emissions from tropical peatlands.
Conclusion
In conclusion, nutrient concentration shapes microbial communities in the largest tropical peatland in South America, the Pastaza-Marañón Basin. Highly structured, niche-dependent distributions of methanogen and methanotroph families were found to exist, dependent on nutrient concentration. Methanogen communities, dominated by hydrogenotrophic Methanobacteriaceae, aggregate strongly with minerotrophic systems that display higher CH4 flux. This suggests that hydrogenotrophic methanogenesis is the primary source of CH4 in these minerotrophic systems. Methanotroph communities, dominated by Methylocystaceae, are dispersed across all systems regardless of CH4 flux, pH and nutrient content. The putative association between CH4 flux and peatland geochemical and nutrient content can inform modeling of the CH4 cycle in the tropics and suggest increased atmospheric CH4 emissions as a consequence of hydrology disturbance and agricultural nutrient deposition.
Data Availability Statement
The 16S rRNA sequence datasets generated for this study can be found in the NCBI repository under the SRA Bioproject ID PRJNA501909 (https://www.ncbi.nlm.nih.gov/sra/SRX4961727).
Author Contributions
HC-Q designed the study. HC-Q, DF, MZ-E, JP, JH, JA-P, and JU-M conducted the sample collection, gas, chemical, and molecular analyses. DF and MZ-E equally performed the data analyses, modeling and synthesis, and drafted the manuscript. All authors contributed to the final version of the manuscript.
Funding
This material is based upon work partially supported by the National Science Foundation under Grant No 1355066, and Research Advancement funds of the School of Life Sciences at the Arizona State University.
Conflict of Interest
The authors declare that the research was conducted in the absence of any commercial or financial relationships that could be construed as a potential conflict of interest.
Acknowledgments
We acknowledge the invaluable support of Dr. Denis del Castillo Torres, and Capt. Jack Pacaya at the Institute of Peruvian Amazon Research, the multiple field assistants from the local communities visited during field campaign, and the facilities provided by the Universidad de la Amazonia Peruana.
Supplementary Material
The Supplementary Material for this article can be found online at: https://www.frontiersin.org/articles/10.3389/fmicb.2020.00746/full#supplementary-material
References
Andersen, R., Chapman, S. J., and Artz, R. R. E. (2013). Microbial communities in natural and disturbed peatlands: a review. Soil Biol. Biochem. 57, 979–994. doi: 10.1016/j.soilbio.2012.10.003
Arai, H., Hadi, A., Darung, U., Limin, S. H., Hatano, R., and Inubushi, K. (2014). A methanotrophic community in a tropical peatland is unaffected by drainage and forest fires in a tropical peat soil. Soil Sci. Plant Nutr. 60, 577–585. doi: 10.1080/00380768.2014.922034
Baker, G. C., Smith, J. J., and Cowan, D. A. (2003). Review and re-analysis of domain-specific 16S primers. J. Microbiol. Methods 55, 541–555. doi: 10.1016/j.mimet.2003.08.009
Bartlett, K. B., Crill, P. M., Bonassi, J. A., Richey, J. E., and Harriss, R. C. (1990). Methane flux from the Amazon River floodplain - emissions during rising water. J. Geophys. Res. Atmos. 95, 16773–16788.
Bartlett, K. B., Crill, P. M., Sebacher, D. I., Harriss, R. C., Wilson, J. O., and Melack, J. M. (1988). Methane flux from the central Amazonian floodplain. J. Geophys. Res. Atmos. 93, 1571–1582.
Bartlett, K. B., and Harriss, R. C. (1993). Review and assessment of methane emissions from wetlands. Chemosphere 26, 261–320. doi: 10.1016/0045-6535(93)90427-7
Basiliko, N., and Yavitt, J. B. (2001). Influence of Ni, Co, Fe, and Na additions on methane production in Sphagnum-dominated Northern American peatlands. Biogeochemistry 52, 133–153.
Belger, L., Forsberg, B. R., and Melack, J. M. (2011). Carbon dioxide and methane emissions from interfluvial wetlands in the upper Negro River basin, Brazil. Biogeochemistry 105, 171–183. doi: 10.1007/s10533-010-9536-0
Bentley, S. D., Chater, K. F., Cerdeno-Tarraga, A. M., Challis, G. L., Thomson, N. R., James, K. D., et al. (2002). Complete genome sequence of the model actinomycete Streptomyces coelicolor A3(2). Nature 417, 141–147.
Berlemont, R., and Martiny, A. C. (2013). Phylogenetic distribution of potential cellulases in bacteria. Appl. Environ. Microbiol. 79, 1545–1554. doi: 10.1128/aem.03305-12
Bokulich, N. A., Subramanian, S., Faith, J. J., Gevers, D., Gordon, J. I., Knight, R., et al. (2013). Quality-filtering vastly improves diversity estimates from Illumina amplicon sequencing. Nat. Methods 10, 57–59. doi: 10.1038/nmeth.2276
Bridgham, S. D., Cadillo-Quiroz, H., Keller, J. K., and Zhuang, Q. (2013). Methane emissions from wetlands: biogeochemical, microbial, and modeling perspectives from local to global scales. Glob. Change Biol. 19, 1325–1346. doi: 10.1111/gcb.12131
Brochier-Armanet, C., Gribaldo, S., and Forterre, P. (2012). Spotlight on the Thaumarchaeota. ISME J. 6, 227–230. doi: 10.1038/ismej.2011.145
Bryant, M. P., Campbell, L. L., Reddy, C. A., and Crabill, M. R. (1977). Growth of Desulfovibrio in lactate or ethanol media low in sulfate in association with H2-utilizing methanogenic bacteria. Appl. Environ. Microbiol. 33, 1162–1169. doi: 10.1128/aem.33.5.1162-1169.1977
Cadillo-Quiroz, H., Brauer, S., Yashiro, E., Sun, C., Yavitt, J., and Zinder, S. (2006). Vertical profiles of methanogenesis and methanogens in two contrasting acidic peatlands in central New York State, USA. Environ. Microbiol. 8, 1428–1440. doi: 10.1111/j.1462-2920.2006.01036.x
Caporaso, J. G., Kuczynski, J., Stombaugh, J., Bittinger, K., Bushman, F. D., Costello, E. K., et al. (2010). QIIME allows analysis of high-throughput community sequencing data. Nat. Methods 7, 335–336.
Chambers, F. M., Beilman, D. W., and Yu, Z. (2010). Methods for determining peat humification and for quantifying peat bulk density, organic matter and carbon content for palaeostudies of climate and peatland carbon dynamics. Mires Peat 7, 1–10.
Chen, J., Wade, M., Dolfing, J., and Soyer, O. S. (2018). Synthetic methanogenic communities reveal differential impact of ecological perturbations on aceto- and hydrogeno-trophic methanogens. bioRxiv [Preprint]. doi: 10.1101/307041
Chen, Y., Dumont, M. G., Mcnamara, N. P., Chamberlain, P. M., Bodrossy, L., Stralis-Pavese, N., et al. (2008). Diversity of the active methanotrophic community in acidic peatlands as assessed by mRNA and SIP-PLFA analyses. Environ. Microbiol. 10, 446–459. doi: 10.1111/j.1462-2920.2007.01466.x
Csardi, G., and Nepusz, T. (2006). The igraph software package for complex network research. Int. J. Complex Syst. 1695, 1–9.
Dedysh, S. N. (2009). Exploring methanotroph diversity in acidic northern wetlands: molecular and cultivation-based studies. Microbiology 78, 655–669. doi: 10.1134/s0026261709060010
Dolan, J., Ritchie, M., and Ras, J. (2007). The ‘neutral’ community structure of planktonic herbivores, tintinnid ciliates of the microzooplankton, across the SE tropical Pacific ocean. Biogeosci. Discuss. 4, 561–593. doi: 10.5194/bgd-4-561-2007
Drake, H. L., Horn, M. A., and Wust, P. K. (2009). Intermediary ecosystem metabolism as a main driver of methanogenesis in acidic wetland soil. Environ. Microbiol. Rep. 1, 307–318. doi: 10.1111/j.1758-2229.2009.00050.x
Draper, F. C., Roucoux, K. H., Lawson, I. T., Mitchard, E. T. A., Coronado, E. N. H., Lahteenoja, O., et al. (2014). The distribution and amount of carbon in the largest peatland complex in Amazonia. Environ. Res. Lett. 9:124017. doi: 10.1088/1748-9326/9/12/124017
Dubey, S. (2005). Microbial ecology of methane emission in rice agroecosystem, a review. Appl. Ecol. Environ. Res. 3, 1–27. doi: 10.15666/aeer/0302_001027
Dunfield, P. F., Yuryev, A., Senin, P., Smirnova, A. V., Stott, M. B., Hou, S. B., et al. (2007). Methane oxidation by an extremely acidophilic bacterium of the phylum Verrucomicrobia. Nature 450, 879–818.
Edgar, R. C., Haas, B. J., Clemente, J. C., Quince, C., and Knight, R. (2011). UCHIME improves sensitivity and speed of chimera detection. Bioinformatics 27, 2194–2200. doi: 10.1093/bioinformatics/btr381
Espenberg, M., Truu, M., Mander, U., Kasak, K., Nolvak, H., Ligi, T., et al. (2018). Differences in microbial community structure and nitrogen cycling in natural and drained tropical peatland soils. Sci. Rep. 8:4742.
Espinoza Villar, J. C., Ronchail, J., Guyot, J. L., Cochonneau, G., Naziano, F., Lavado, W., et al. (2009) Spatio-temporal rainfall variability in the Amazon basin countries (Brazil, Peru, Bolivia, Colombia, and Ecuador). Int. J. Climatol. 29, 1574–1594. doi: 10.1002/joc.1791
Ettwig, K. F., Butler, M. K., Le Paslier, D., Pelletier, E., Mangenot, S., Kuypers, M. M. M., et al. (2010). Nitrite-driven anaerobic methane oxidation by oxygenic bacteria. Nature 464, 543–594.
Ettwig, K. F., Zhu, B., Speth, D., Keltjens, J. T., Jetten, M. S. M., and Kartal, B. (2016). Archaea catalyze iron-dependent anaerobic oxidation of methane. Proc. Natl. Acad. Sci. U.S.A. 113, 12792–12796. doi: 10.1073/pnas.1609534113
Evans, P. N., Parks, D. H., Chadwick, G. L., Robbins, S. J., Orphan, V. J., Golding, S. D., et al. (2015). Methane metabolism in the archaeal phylum Bathyarchaeota revealed by genome-centric metagenomics. Science 350, 434–438. doi: 10.1126/science.aac7745
Garcia, J. L., Patel, B. K. C., and Ollivier, B. (2000). Taxonomic phylogenetic and ecological diversity of methanogenic Archaea. Anaerobe 6, 205–226. doi: 10.1006/anae.2000.0345
Goodfellow, M., and Williams, S. T. (1983). Ecology of actinomycetes. Annu. Rev. Microbiol. 37, 189–216. doi: 10.1146/annurev.mi.37.100183.001201
Gotelli, N. J. (2000). Null model analysis of species co-occurrence patterns. Ecology 81, 2606–2621. doi: 10.1890/0012-9658(2000)081[2606:nmaosc]2.0.co;2
Hanson, R. S., and Hanson, T. E. (1996). Methanotrophic bacteria. Microbiol. Rev. 60, 439–471. doi: 10.1128/mmbr.60.2.439-471.1996
Haroon, M. F., Hu, S., Shi, Y., Imelfort, M., Keller, J., Hugenholtz, P., et al. (2013). Anaerobic oxidation of methane coupled to nitrate reduction in a novel archaeal lineage. Nature 500, 567–570. doi: 10.1038/nature12375
He, Y., Li, M., Perumal, V., Feng, X., Fang, J., Xie, J., et al. (2016). Genomic and enzymatic evidence for acetogenesis among multiple lineages of the archaeal phylum Bathyarchaeota widespread in marine sediments. Nat. Microbiol. 1:16035.
Ho, A., De Roy, K., Thas, O., De Neve, J., Hoefman, S., Vandamme, P., et al. (2014). The more, the merrier: heterotroph richness stimulates methanotrophic activity. ISME J. 8, 1945–1948. doi: 10.1038/ismej.2014.74
Hug, L. A., Castelle, C. J., Wrighton, K. C., Thomas, B. C., Sharon, I., Frischkorn, K. R., et al. (2013). Community genomic analyses constrain the distribution of metabolic traits across the Chloroflexi phylum and indicate roles in sediment carbon cycling. Microbiome 1:22. doi: 10.1186/2049-2618-1-22
Hutchinson, G. L., and Livingston, G. P. (1993). “Use of chamber systems to measure trace gas fluxes,” in Agricultural Ecosystem Effects on Trace Gases and Global Climate Change, ed. L. Harper (Madison, WI: ASA), 63–78. doi: 10.2134/asaspecpub55.c4
Iguchi, H., Yurimoto, H., and Sakai, Y. (2011). Stimulation of methanotrophic growth in cocultures by cobalamin excreted by Rhizobia. Appl. Environ. Microbiol. 77, 8509–8515. doi: 10.1128/aem.05834-11
Jackson, C. R., Liew, K. C., and Yule, C. M. (2009). Structural and functional changes with depth in microbial communities in a tropical Malaysian peat swamp forest. Microb. Ecol. 57, 402–412. doi: 10.1007/s00248-008-9409-4
Jeong, S. Y., and Kim, T. G. (2018). Development of a novel methanotrophic process with the helper microorganism Hyphomicrobium sp. NM3. J. Appl. Microbiol. 126, 534–544. doi: 10.1111/jam.14140
Juottonen, H., Galand, P. E., Tuittila, E. S., Laine, J., Fritze, H., and Yrjala, K. (2005). Methanogen communities and Bacteria along an ecohydrological gradient in a northern raised bog complex. Environ. Microbiol. 7, 1547–1557. doi: 10.1111/j.1462-2920.2005.00838.x
Kanokratana, P., Uengwetwanit, T., Rattanachomsri, U., Bunterngsook, B., Nimchua, T., Tangphatsornruang, S., et al. (2011). Insights into the phylogeny and metabolic potential of a primary tropical peat swamp forest microbial community by metagenomic analysis. Microb. Ecol. 61, 518–528. doi: 10.1007/s00248-010-9766-7
Keddy, P. A. (1992). Assembly and response rules - two goals for predictive community ecology. J. Veg. Sci. 3, 157–164. doi: 10.2307/3235676
Keller, M., Varner, R., Dias, J. D., Silva, H., Crill, P., and De Oliveira, R. C. (2005). Soil-atmosphere exchange of nitrous oxide, nitric oxide, methane, and carbon dioxide in logged and undisturbed forest in the Tapajos National Forest, Brazil. Earth Interact. 9, 1–28. doi: 10.1175/EI125.1
Kelly, T. J., Baird, A. J., Roucoux, K. H., Baker, T. R., Honorio Coronado, E. N., Lawson, I. T., et al. (2013). The high hydraulic conductivity of three wooded tropical peat swamps in northeast Peru: measurements and implications for hydrological function. Hydrol. Process. 28, 3373–3387. doi: 10.1002/hyp.9884
Kindt, R., and Coe, R. (2005). Tree Diversity Analysis. A Manual Software for Common Statistical Methods for Ecological and Biodiversity Studies. Nairobi: World Agroforestry Centre (ICRAF).
Kip, N., Fritz, C., Langelaan, E. S., Pan, Y., Bodrossy, L., Pancotto, V., et al. (2012). Methanotrophic activity and diversity in different Sphagnum magellanicum dominated habitats in the southernmost peat bogs of Patagonia. Biogeosciences 9, 47–55. doi: 10.5194/bg-9-47-2012
Lahteenoja, O., and Page, S. (2011). High diversity of tropical peatland ecosystem types in the Pastaza-Maranon basin, Peruvian Amazonia. J. Geophys. Res. Biogeosci. 116:G02025.
Lahteenoja, O., Reategui, Y. R., Rasanen, M., Torres, D. D., Oinonen, M., and Page, S. (2012). The large Amazonian peatland carbon sink in the subsiding Pastaza-Maranon foreland basin, Peru. Glob. Change Biol. 18, 164–178. doi: 10.1111/j.1365-2486.2011.02504.x
Lahteenoja, O., Ruokolainen, K., Schulman, L., and Alvarez, J. (2009). Amazonian floodplains harbour minerotrophic and ombrotrophic peatlands. Catena 79, 140–145. doi: 10.1016/j.catena.2009.06.006
Lai, D. Y. F. (2009). Methane dynamics in northern Peatlands: a review. Pedosphere 19, 409–421. doi: 10.1016/s1002-0160(09)00003-4
Lin, X., Green, S., Tfaily, M. M., Prakash, O., Konstantinidis, K. T., Corbett, J. E., et al. (2012). Microbial community structure and activity linked to contrasting biogeochemical gradients in bog and fen environments of the Glacial Lake Agassiz Peatland. Appl. Environ. Microbiol. 78, 7023–7031. doi: 10.1128/aem.01750-12
Lin, X. J., Tfaily, M. M., Steinweg, M., Chanton, P., Esson, K., Yang, Z. K., et al. (2014). Microbial community stratification linked to utilization of carbohydrates and phosphorus limitation in a Boreal Peatland at Marcell Experimental Forest, Minnesota, USA. Appl. Environ. Microbiol. 80, 3518–3530. doi: 10.1128/aem.00205-14
Lloyd, K. G., Lapham, L., and Teske, A. (2006). An anerobic methane-oxidizing community of ANME-1b Archaea in hypersaline Gulf of Mexico sediments. Appl. Environ. Microbiol. 72, 7218–7230. doi: 10.1128/aem.00886-06
Lyu, Z., and Lu, Y. H. (2015). Comparative genomics of three Methanocellales strains reveal novel taxonomic and metabolic features. Environ. Microbiol. Rep. 7, 526–537. doi: 10.1111/1758-2229.12283
Martini, I. P., Martinez Cortizas, A., and Chesworth, W. (2007). “Peatlands,” in Peatlands: Evolution and Records of Environmental and Climate Changes, eds I. P. Martini, A. Martinez Cortizas, and W. Chesworth (Amsterdam: Elsevier), 1–14.
Maus, I., Rumming, M., Bergmann, I., Heeg, K., Pohl, M., Nettmann, E., et al. (2018). Characterization of Bathyarchaeota genomes assembled from metagenomes of biofilms residing in mesophilic and thermophilic biogas reactors. Biotechnol. Biofuels 11:167.
McGill, B. J., Enquist, B. J., Weiher, E., and Westoby, M. (2006). Rebuilding community ecology from functional traits. Trends Ecol. Evol. 21, 178–185. doi: 10.1016/j.tree.2006.02.002
Miller, J. B., Gatti, L. V., D’amelio, M. T. S., Crotwell, A. M., Dlugokencky, E. J., Bakwin, P., et al. (2007). Airborne measurements indicate large methane emissions from the eastern Amazon basin. Geophys. Res. Lett. 34:L10809.
Morales, S. E., Mouser, P. J., Ward, N., Hudman, S. P., Gotelli, N. J., Ross, D. S., et al. (2006). Comparison of bacterial communities in New England Sphagnum bogs using terminal restriction fragment length polymorphism (T-RFLP). Microb. Ecol. 52, 34–44. doi: 10.1007/s00248-005-0264-2
Morris, J. J., Lenski, R. E., and Zinser, E. R. (2012). The black queen hypothesis: evolution of dependencies through adaptive gene loss. mBio 3:e00036-12.
Muller, F., Brissac, T., Le Bris, N., Felbeck, H., and Gros, O. (2010). First description of giant Archaea (Thaumarchaeota) associated with putative bacterial ectosymbionts in a sulfidic marine habitat. Environ. Microbiol. 12, 2371–2383. doi: 10.1111/j.1462-2920.2010.02309.x
Muyzer, G., and Stams, A. J. M. (2008). The ecology and biotechnology of sulphate-reducing bacteria. Nat. Rev. Microbiol. 6, 441–454. doi: 10.1038/nrmicro1892
Oksanen, J., Guillaume Blanchet, F., Kindt, R., Legendre, P., Minchin, P., O’Hara, R., et al. (2013). Vegan: Community Ecology Package. R package version 2.0-10. Available online at: http://CRAN.R-project.org/package=vegan (accessed February, 2019).
Orphan, V. J., House, C. H., Hinrichs, K. U., Mckeegan, K. D., and Delong, E. F. (2002). Multiple archaeal groups mediate methane oxidation in anoxic cold seep sediments. Proc. Natl. Acad. Sci. U.S.A. 99, 7663–7668. doi: 10.1073/pnas.072210299
Orphan, V. J., Turk, K. A., Green, A. M., and House, C. H. (2009). Patterns of N-15 assimilation and growth of methanotrophic ANME-2 archaea and sulfate-reducing bacteria within structured syntrophic consortia revealed by FISH-SIMS. Environ. Microbiol. 11, 1777–1791. doi: 10.1111/j.1462-2920.2009.01903.x
Page, S. E., and Baird, A. J. (2016). Peatlands and global change: response and resilience. Annu. Rev. Environ. Resour. 41, 35–57. doi: 10.1146/annurev-environ-110615-085520
Page, S. E., Rieley, J. O., and Banks, C. J. (2011). Global and regional importance of the tropical peatland carbon pool. Glob. Change Biol. 17, 798–818. doi: 10.1111/j.1365-2486.2010.02279.x
Patel, S. K. S., Mardina, P., Kim, S.-Y., Lee, J.-K., and Kim, I.-W. (2016). Biological methanol production by a Type II methanotroph Methylocystis bryophila. J. Microbiol. Biotechnol. 26, 717–724. doi: 10.4014/jmb.1601.01013
Quast, C., Pruesse, E., Yilmaz, P., Gerken, J., Schweer, T., Yarza, P., et al. (2013). The SILVA ribosomal RNA gene database project: improved data processing and web-based tools. Nucleic Acids Res. 41, D590–D596.
R Development Core Team, (2013). R: A Language and Environment for Statistical Computing. Vienna: R Foundation for statistical computing.
Reichardt, J., and Bornholdt, S. (2006). Statistical mechanics of community detection. Phys. Rev. E 74:016110.
Richey, J. E., Devol, A. H., Wofsy, S. C., Victoria, R., and Riberio, M. N. G. (1988). Biogenic gases and the oxidation and reduction of carbon in Amazon River and floodplain waters. Limnol. Oceanogr. 33, 551–561. doi: 10.4319/lo.1988.33.4.0551
Rieley, J., and Page, S. (2016). “Tropical peatland of the world,” in Tropical Peatland Ecosystems, eds M. Osaki and N. Tsuji (Tokyo: Springer), 3–32. doi: 10.1007/978-4-431-55681-7_1
Roucoux, K. H., Lawson, I. T., Jones, T. D., Baker, T. R., Coronado, E. N. H., Gosling, W. D., et al. (2013). Vegetation development in an Amazonian peatland. Palaeogeogr. Palaeoclimatol. Palaeoecol. 374, 242–255. doi: 10.1016/j.palaeo.2013.01.023
Sachs, J. L., and Hollowell, A. C. (2012). The origins of cooperative bacterial communities. mBio 3:e00099-12.
Segarra, K. E. A., Schubotz, F., Samarkin, V., Yoshinaga, M. Y., Hinrichs, K. U., and Joye, S. B. (2015). High rates of anaerobic methane oxidation in freshwater wetlands reduce potential atmospheric methane emissions. Nat. Commun. 6:7477.
Semrau, J. D., Dispirito, A. A., and Vuilleumier, S. (2011). Facultative methanotrophy: false leads, true results, and suggestions for future research. FEMS Microbiol. Lett. 323, 1–12. doi: 10.1111/j.1574-6968.2011.02315.x
Serkebaeva, Y. M., Kim, Y., Liesack, W., and Dedysh, S. N. (2013). Pyrosequencing-based assessment of the Bacteria diversity in surface and subsurface peat layers of a northern wetland, with focus on poorly studied phyla and candidate divisions. PLoS One 8:e63994. doi: 10.1371/journal.pone.0063994
Sierocinski, P., Bayer, F., Yvon-Durocher, G., Burdon, M., Grosskopf, T., Alston, M., et al. (2018). Biodiversity-function relationships in methanogenic communities. Mol. Ecol. 27, 4641–4651. doi: 10.1111/mec.14895
Sjogersten, S., Black, C. R., Evers, S., Hoyos-Santillan, J., Wright, E. L., and Turner, B. L. (2014). Tropical wetlands: A missing link in the global carbon cycle? Glob. Biogeochem. Cycles 28, 1371–1386. doi: 10.1002/2014gb004844
Steinberg, L. M., and Regan, J. M. (2008). Phylogenetic comparison of the methanogenic communities from an acidic, oligotrophic fen and an anaerobic digester treating municipal wastewater sludge. Appl. Environ. Microbiol. 74, 6663–6671. doi: 10.1128/aem.00553-08
Sugihara, G. (1980). Minimal community structure - an explanation of species abundance patterns. Am. Nat. 116, 770–787. doi: 10.1086/283669
Tamaki, H., Wright, C. L., Li, X., Lin, Q., Hwang, C., Wang, S., et al. (2011). Analysis of 16S rRNA amplicon sequencing options on the roche/454 next-generation titanium sequencing platform. PLoS One 6:e25263. doi: 10.1371/journal.pone.0025263
Teh, Y. A., Murphy, W. A., Berrio, J. C., Boom, A., and Page, S. E. (2017). Seasonal variability in methane and nitrous oxide fluxes from tropical peatlands in the western Amazon basin. Biogeosciences 14, 3669–3683. doi: 10.5194/bg-14-3669-2017
Thauer, R. K., Kaster, A. K., Seedorf, H., Buckel, W., and Hedderich, R. (2008). Methanogenic archaea: ecologically relevant differences in energy conservation. Nat. Rev. Microbiol. 6, 579–591. doi: 10.1038/nrmicro1931
Tilman, D., and Wedin, D. (1991). Plant traits and resource reduction for five grasses growing on a nitrogen gradient. Ecology 72, 685–700. doi: 10.2307/2937208
Too, C. C., Keller, A., Sickel, W., Lee, S. M., and Yule, C. M. (2018). Microbial community structure in a Malaysian tropical peat swamp forest: the influence of tree species and depth. Front. Microbiol. 9:2859. doi: 10.3389/fmicb.2018.02859
Valenzuela, E. I., Prieto-Davó, A., López-Lozano, N. E., Hernández-Eligio, A., Vega-Alvarado, L., Juárez, K., et al. (2017). Anaerobic methane oxidation driven by microbial reduction of natural organic matter in a tropical wetland. Appl. Environ. Microbiol. 83, e645–e617.
Vecherskaya, M., Dijkema, C., and Stams, A. J. M. (2001). Intracellular PHB conversion in a Type II methanotroph studied by C-13 NMR. J. Ind. Microbiol. Biotechnol. 26, 15–21. doi: 10.1038/sj.jim.7000086
Wang, Y., and Qian, P.-Y. (2009). Conservative fragments in bacterial 16S rRNA genes and primer design for 16S ribosomal DNA amplicons in metagenomic studies. PLoS One 4:e7401. doi: 10.1371/journal.pone.0007401
Whitfield, P. H., St-Hilaire, A., and Van Der Kamp, G. (2009). Improving hydrological predictions in peatlands. Can. Water Resour. J. 34, 467–478. doi: 10.4296/cwrj3404467
Whiting, G. J., and Chanton, J. P. (1993). Primary production control of methane emission from wetlands. Nature 364, 794–795. doi: 10.1038/364794a0
Whittenbury, R., Phillips, K. C., and Wilkinso, J. (1970). Enrichment, isolation and some properties of Methane-utilizing bacteria. J. Gen. Microbiol. 61, 205–218. doi: 10.1099/00221287-61-2-205
Wieczorek, A. S., Drake, H. L., and Kolb, S. (2011). Organic acids and ethanol inhibit the oxidation of methane by mire methanotrophs. FEMS Microbiol. Ecol. 77, 28–39. doi: 10.1111/j.1574-6941.2011.01080.x
Wilson, C., Gloor, M., Gatti, L. V., Miller, J. B., Monks, S. A., Mcnorton, J., et al. (2016). Contribution of regional sources to atmospheric methane over the Amazon Basin in 2010 and 2011. Glob. Biogeochem. Cycles 30, 400–420. doi: 10.1002/2015gb005300
Winton, R. S., Flanagan, N., and Richardson, C. J. (2017). Neotropical peatland methane emissions along a vegetation and biogeochemical gradient. PLoS One 12:e0187019. doi: 10.1371/journal.pone.0187019
Wust, P. K., Horn, M. A., and Drake, H. L. (2009). Trophic links between fermenters and methanogens in a moderately acidic fen soil. Environ. Microbiol. 11, 1395–1409. doi: 10.1111/j.1462-2920.2009.01867.x
Xiang, X., Wang, R. C., Wang, H. M., Gong, L. F., Man, B. Y., and Xu, Y. (2017). Distribution of Bathyarchaeota communities across different terrestrial settings and their potential ecological functions. Sci. Rep. 7:45028.
Ye, R. Z., Jin, Q. S., Bohannan, B., Keller, J. K., Mcallister, S. A., and Bridgham, S. D. (2012). pH controls over anaerobic carbon mineralization, the efficiency of methane production, and methanogenic pathways in peatlands across an ombrotrophic-minerotrophic gradient. Soil Biol. Biochem. 54, 36–47. doi: 10.1016/j.soilbio.2012.05.015
Yu, T. T., Wu, W. C., Liang, W. Y., Lever, M. A., Hinrichs, K. U., and Wang, F. P. (2018). Growth of sedimentary Bathyarchaeota on lignin as an energy source. Proc. Natl. Acad. Sci. U.S.A. 115, 6022–6027. doi: 10.1073/pnas.1718854115
Zhou, X., Zhang, Z. Q., Tian, L., Li, X. J., and Tian, C. J. (2017). Microbial communities in peatlands along a chronosequence on the Sanjiang Plain, China. Sci. Rep. 7:9567.
Zhu, B., Van Dijk, G., Fritz, C., Smolders, A. J. P., Pol, A., Jetten, M. S. M., et al. (2012). Anaerobic oxidization of methane in a Minerotrophic Peatland: enrichment of nitrite-dependent methane-oxidizing bacteria. Appl. Environ. Microbiol. 78, 8657–8665. doi: 10.1128/aem.02102-12
Keywords: greenhouse gases, methane, peatlands, amazon, methanogens, methanotrophs, community assemblage
Citation: Finn DR, Ziv-El M, van Haren J, Park JG, del Aguila-Pasquel J, Urquiza–Muñoz JD and Cadillo-Quiroz H (2020) Methanogens and Methanotrophs Show Nutrient-Dependent Community Assemblage Patterns Across Tropical Peatlands of the Pastaza-Marañón Basin, Peruvian Amazonia. Front. Microbiol. 11:746. doi: 10.3389/fmicb.2020.00746
Received: 07 November 2019; Accepted: 30 March 2020;
Published: 24 April 2020.
Edited by:
Marcus A. Horn, Leibniz University Hannover, GermanyReviewed by:
Steffen Kolb, Leibniz Centre for Agricultural Landscape Research (ZALF), GermanySarah Faye Harpenslager, Leibniz-Institute of Freshwater Ecology and Inland Fisheries (IGB), Germany
Copyright © 2020 Finn, Ziv-El, van Haren, Park, del Aguila-Pasquel, Urquiza–Muñoz and Cadillo-Quiroz. This is an open-access article distributed under the terms of the Creative Commons Attribution License (CC BY). The use, distribution or reproduction in other forums is permitted, provided the original author(s) and the copyright owner(s) are credited and that the original publication in this journal is cited, in accordance with accepted academic practice. No use, distribution or reproduction is permitted which does not comply with these terms.
*Correspondence: Hinsby Cadillo-Quiroz, hinsby@asu.edu
†These authors have contributed equally to this work
‡Present Address: Jose David Urquiza-Muñoz, Theoretical Ecosystem Ecology, Department of Biogeochemical Processes, Max Planck Institute for Biogeochemistry, Jena, Germany