Testing Links of Food-Related Olfactory Perception to Peripheral Ghrelin and Leptin Concentrations
 Rachel Ginieis
 Sashie Abeywickrema
 Indrawati Oey
 Mei Peng
- 1Sensory Neuroscience Laboratory, Department of Food Science, University of Otago, Dunedin, New Zealand
- 2Riddet Institute, Palmerston North, New Zealand
The peptide hormones ghrelin and leptin play major roles in the regulation of appetite and food intake. However, the precise effects of these hormones on sensory processing remain a subject of debate, particularly with food related stimuli and its small body of evidence. Here, we test for relationships between ghrelin and leptin levels against olfactory performance with multiple food-related odours. Specifically, a total of 94 Caucasian males were tested for their supra-threshold sensitivity (i.e., d′), intensity, and valence perception to three odour compounds (i.e., vanilla, potato, and dairy odours). These sensory data were then analysed against peripheral ghrelin and leptin levels, both assessed in plasma samples. Participants’ body adiposity measures were also obtained. Results lent strong support to one of our original hypotheses, with ghrelin levels being positively correlated to the supra-threshold sensitivity of the dairy odour, (r = 0.241, p = 0.020), and intensity ratings to most of the food odours tested [dairy (r = 0.216, p = 0.037) and vanilla (r = 0.241, p = 0.020)]. By contrast, peripheral leptin levels were not significantly linked to any of the olfactory measures (p > 0.05). These relationships remained similar after controlling for variabilities of adiposity measures. The present study brings novel insights by identifying positive links between supra-threshold olfactory perception and ghrelin. This new knowledge is highly relevant for future research linking olfactory shifts to hormonal dysregulation and obesity.
Introduction
Understanding the aetiology of obesity remains an important research direction (1). Over-responsiveness to food cues is considered a key contributor to obesity in the current food environment (2, 3). Research over the last two decades has shown that maladaptive eating behaviour is often accompanied by major alterations in peptide hormones, such as ghrelin and leptin (4, 5). However, mechanisms underpinning these observed relationships remain unclear. Recent research has postulated that sensory processing plays an important role in mediating hormonal effects on eating (6–8). The current study adds to the emerging body of research by testing for links between peripheral leptin and ghrelin levels and olfactory perception of food-related stimuli.
Previous research has consistently observed links between obesity and resistance to leptin and ghrelin [e.g., (9, 10)]. Notably, peripheral ghrelin and leptin have been increasingly used as biomarkers for obesity (9, 11). Individuals with obesity were shown to have reduced ghrelin (1/3–1/2 time lower) (11, 12), and increased leptin levels (2–8 times higher), compared to normal-weight controls (13–15). In addition to links to obesity, neurological evidence suggests that both ghrelin and leptin can modulate neural responsiveness to food rewards (4, 5, 16). Specifically, ghrelin is an orexigenic agent (i.e., promoting food intake) (17, 18) and leptin is an anorexigenic agent (i.e., inhibiting food intake) (19, 20). Based on these previous findings, it is intuitive to propose that changes of ghrelin and leptin alter food-related neurological and behavioural responses, and correspondingly influence one’s body weight overtime (5, 21–23). However, the precise mechanism underpinning these effects remains unclear. Recent research suggests that sensory processing may play a key role in mediating ghrelin and leptin effects on eating [cf. (24)], although such findings remain controversial.
Across the five special senses, olfaction is the least understood, despite its vital function in flavour perception and food acceptance (25). Olfactory processing emerges from first-order neurons at the olfactory mucosa (OM) toward the olfactory bulb (OB) (25). The OB then conveys olfactory information to the olfactory cortex (26–28), which includes the piriform cortex, anterior olfactory nucleus, lateral entorhinal cortex, periamygdaloid cortex and the cortical nucleus of the amygdala (26, 29–31). Further higher order projections from the olfactory cortex to the orbitofrontal cortex, amygdala, and hippocampus encode for executive, emotional, motivational, and memory-related processes associated with human olfaction (32). Thus, higher-order processing confers its specificity to the stimulus perceived and reveal odour features, including odour intensity and valence (29). This temporal cascade of olfactory processes is shown to start with odour detection and discrimination, followed by the identification of odour quality (e.g., the smell of a rose) and ends with the hedonic perception of this stimulus (33). Altogether, these complex neuroanatomical pathways govern different aspects of an individual’s olfactory perception, from detection sensitivity to hedonic valence, highlighting a fundamental difference between these sensory measures.
Ghrelin and leptin can traverse the blood-brain barrier and reach several cerebral areas that are directly involved with feeding behaviour [e.g., hypothalamus: (34–36); mesolimbic reward system: (37)], as well as other sensory-related regions that are indirectly linked to eating (38–40). Recent research further indicated that ghrelin and leptin were particularly involved in olfactory transduction (41). Specifically, ghrelin receptors are found in olfactory structures such as the glomeruli, mitral cells, and granule cells located in the OB (39). More recent research indicated that ghrelin is able to modulate olfactory information transmission from the mitral cells to the amygdala and hypothalamus (42). Similarly, leptin and its associated receptor have been found in the OM (43), olfactory epithelium (44) and OB (45). More functional evidence indicated that leptin was involved in olfactory-related mechanisms such as the mucus production (41, 46). Furthermore, ghrelin and leptin signalling, and olfactory transduction were shown to be co-modulated in shared cerebral structures that are closely related to feeding (35, 42). These observed links point to the possibility that ghrelin and leptin influence eating behaviour via shaping individual olfactory perception.
A few studies have tested for links between olfactory perception and peripheral ghrelin levels, with findings remaining controversial. Specifically, a subset of these studies attempted to test for links between peripheral ghrelin and detection threshold to neutral odours (e.g., n-butanol) (47–50). However, most of these studies failed to detect any significant relationship (47–49). Only a recent study found a significant positive correlation between peripheral ghrelin levels and detection threshold scores to n-butanol (50). Importantly, the study from Uygun et al. (50) was performed only on women with obesity while other studies considered all weight groups for analysis, which may have contributed to these differential results. Although no study tested for links between peripheral ghrelin and olfactory sensitivity to food odours, a few studies showed that systemic ghrelin infusions significantly increased individual sniffing magnitude in response to food odours (39) and generated a greater response to food odour conditioning task (48). In line with these findings, peripheral ghrelin levels were shown to be significantly associated with valence ratings (VR) of food odours (e.g., black pepper oil) (48, 49). Such inter-study inconsistencies may indicate the important role of the nature of odorants in the relationship between peripheral ghrelin and olfaction.
With regards to the link between leptin and olfactory acuity, animal studies have consistently observed a negative relationship [e.g., (51)], while human studies revealed mixed findings. Specifically, several rodent studies observed that leptin-deficient animals exhibited a heightened sensitivity to food-related odours, compared to matched controls (44, 52, 53). Such findings were later explained as leptin reduces neural activity in the olfactory epithelium and OB (45, 54–56). Accordingly, a recent human study highlighted a negative correlation between OB volume and peripheral leptin levels (57). On the other hand, studies with human subjects regarding olfactory sensitivity revealed either positive (49, 58) or negative correlations with peripheral leptin levels (58, 59). Karlsson et al. (58) further pointed out differential results being dependent on the sex of participants with peripheral leptin levels and olfactory sensitivity being negatively linked in females and positively linked in males. Notably, these studies mainly focussed on identification, detection and discrimination of a neutral olfactory compound, n-butanol. The study from Trellakis et al. (49) was the only experiment on human subjects incorporating food odours, and their results revealed a significant correlation between pleasantness to black pepper oil smell and peripheral levels of leptin. Given that numerous animal studies using food odours observed a consistent negative relationship between leptin and olfaction, the use of food odours to assess olfactory functions in humans may reveal a consistent link with peripheral leptin levels.
The present paper aims to test for links of peripheral ghrelin and leptin levels to olfactory functions. Due to the close relationship between olfactory supra-threshold functions and eating behaviour [e.g., (60)], the present study compares peripheral hormone levels to supra-threshold sensitivities, intensity ratings (IR), and VR to three food-related odours. Building upon previous literature, we hypothesised that individuals with elevated levels of peripheral ghrelin show heightened olfactory supra-threshold sensitivity and IR, but reduced VR of food odours. By contrast, we hypothesised that individuals with high levels of peripheral leptin levels show weakened olfactory supra-threshold sensitivity and IR, but heightened VR for food odours.
Materials and Methods
Participants
A total of 94 Caucasian males [25.2 ± 5.7 years of age; body mass index (BMI): 26.7 ± 4.9 kg⋅m–2] undertook this study. Given the high degree of inter-individual differences in olfactory perception due to sex, only males were recruited and included in the present study [cf. (61)]. Sample size was determined using G*Power 3.1.9.7 Software, with calculations being based on the effect sizes reported in previous studies testing for links between peripheral hormone levels and olfactory performances [e.g., (49, 50)]. The analysis produced a sample size of 84 to achieve an 80% power and an α-level of 0.05, based on bivariate normal model of correlations (effect size r = 0.300). We decided to recruit an additional 10 participants to allow for at least 10% of predicted rate of participants’ withdrawal. All participants were non-smokers, and were free from sensory dysfunctions, chronic medical conditions, or food allergies. Participants were required to abstain from food or non-water beverage after 10 p.m. of the night prior to each laboratory session and the phlebotomy appointment. In addition, participants were asked not to wear any cologne or scented cosmetic on the day of the testing. All participants gave informed written consents. The study was approved by the University of Otago Ethics Committee for Human Participation – health panel (Reference: H18/111). Each participant received a monetary compensation upon completion of the study.
Study Overview
Each participant attended six 30-min experimental sessions over consecutive weekdays, from 7.00 to 9.30 a.m., and a separate phlebotomy test for blood sample collection. All experimental sessions were carried out in standard individual sensory booths, at 20°C and under red light, in the Sensory Neuroscience Laboratory at the University of Otago, New Zealand. The six experimental sessions included replicated assessments of individual supra-threshold sensitivities, intensity, and valence perception of three food-related odours. Testing orders were randomised across participants using a Latin Square design (62). Participants’ weight and height were measured in laboratory for calculating anthropometric measures. On a separate morning after the completion of sensory tests, participants were asked to attend a phlebotomy appointment for collection of a fasting blood sample.
Stimuli
Information of the olfactory stimuli used in this study are described in Table 1. These odorants were selected due to their close relevance to common snack foods in New Zealand (63, 64). Each odorant was made into solutions of 11 concentrations following an additive logarithmic steps, with the middle concentration being the reference sample. The five lower concentration levels referred to the decremental series, and the five higher concentration levels to the incremental series. Serial dilution method was used to make these solutions, with filtered water (0.5 μm) being the solvent. According to previous reports and pilot tests, the selected concentration range of the olfactory compounds should be above the recognition thresholds associated with the odorant (60, 65, 66). During the sensory tests, all olfactory samples were presented at a volume of 5 mL in 50 mL glass bottles (73 mm height, 42 mm diameter, Arthur Holmes, New Zealand).
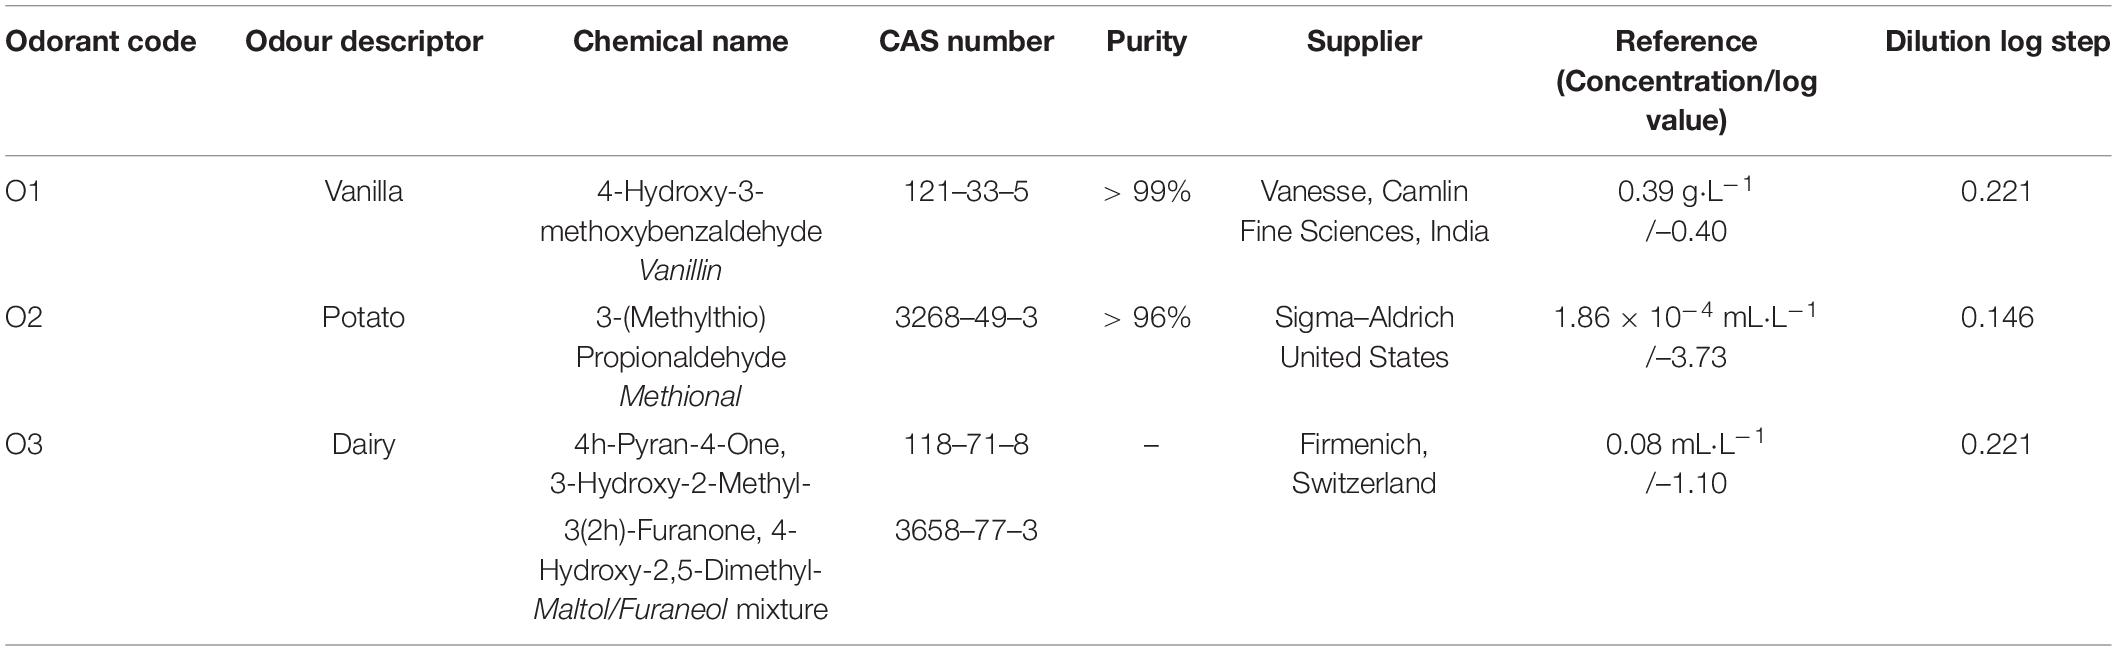
Table 1. Summary of olfactory stimuli characteristics including description, compound, suppliers, purity, and reference concentrations.
Olfactory Supra-Threshold Sensitivity Measures
Each odorant was tested twice over two 30-min sessions on separate days. The supra-threshold sensitivity test was constructed based on the method of constant stimuli, with a two-alternative forced choice (2-AFC) presentation. In a single 2-AFC task, the participant was presented with one reference sample and one testing sample (from either the incremental or decremental series), following a pre-determined randomised order. The participants were required to sniff the two samples for two seconds each and then indicate the “most intense sample.” Each testing session contains 50 2-AFC comparisons, comprising five replicated testing of each concentration level. Across the two sessions, for each odorant, each concentration level was compared to the reference sample for 10 replicates. Participants were given non-flavoured crackers and a glass of water for inter-trial palate cleansing. Olfactory supra-threshold sensitivity tests were performed on Compusense Cloud software (Guelph, ON, Canada).
Olfactory Intensity and Valence Ratings
Intensity and hedonic general Labelled Magnitude Scale (gLMS) were used to measure intensity and valence perception to each testing odorant. The intensity gLMS is a 100-point scale, marked with semi-logarithmically spaced descriptors (no sensation = 0, weak = 6, moderate = 17, strong = 35, very strong = 53, strongest imaginable sensation of any kind = 100) (67). The hedonic gLMS is a double scale ranging from −100 to 100, where −100 represents the strongest imaginable dislike, and 100 represents the strongest imaginable like (68). Other interval labels are similar to the intensity gLMS. Both scales are widely accepted and were shown to be adapted to scale olfactory sensations (67–69). On the first day of the six laboratory sessions, participants were instructed on how to use these scales (69). For each odorant, intensity and valence were rated against the reference sample (see Table 1). These ratings were performed on Compusense Cloud software (Guelph, ON, Canada).
Measurements of Hormones
Blood samples were collected between 7.30 and 10 a.m. following overnight fasting. Samples were then centrifuged in a refrigerated centrifuge (4°C) for 10 min at 1,000 × g within 30 min of blood collection. The plasma was pipetted and transferred in K2 EDTA tubes and stored at −80°C until analysis. Leptin and acyl ghrelin (active ghrelin) were both measured in duplicate using a commercially available multiplex kit (Milliplex Map kit, Human Metabolic Hormone Magnetic Bead Panel HMHEMAG-34K; Millipore Corp., St. Louis, MO, United States). Milliplex map kits are specific to the Luminex Magpix Analyzer and are analytically validated for sensitivity, specificity, and reproducibility. These kits offer a great sensitivity for active ghrelin and leptin with respective detection thresholds of 14 pg/mL (intra-assay CV < 10%, inter-assay CV < 15%) and 41 pg/mL (intra-assay CV < 10%, inter-assay CV < 15%). Additionally, when a sample contained a lower concentration than the lowest detection threshold, standard curves were extrapolated to determine the sample concentration. The measurements of the 94 blood samples required three Milliplex map kits in total. The protocol was performed over two consecutive days, and the exact same procedure was followed for each kit.
Anthropometric Measurements
Participants’ weight and height were measured using a standard scale and stadiometer to the nearest 0.1 unit. Participants were asked to stay in standing position wearing light clothing without shoes. Participants’ BMI were classified as normal weight for a value between 18.5 and 24.9 kg⋅m–2, overweight from 25 to 29.9 kg⋅m–2, and obese over 30 kg⋅m–2. Additionally, body fat percentage was also measured using skinfold thickness measurements on four body sites (biceps, triceps, subscapular area, and suprailiac area) as a complementary measure of BMI.
Sensitivity Calculations
Individual supra-threshold sensitivities were calculated based on the results obtained from 2-AFC tasks. Specifically, Hit rates (H; correctly recognising the higher concentration positioned on the left side) and False Alarm rates (F; mistakenly recognising the lower concentration positioned on the left side as the higher concentration) were calculated for decremental and incremental series separately. A decremental d′ value – d′ (Decremental,Reference) – as well as an incremental d′ value – d′ (Reference,Incremental) – were calculated using the equation from Macmillan and Creelman (70), for each sensory stimulus and each individual. The individual value of d′ resulted from the addition of d′(D,R) and d′ (R,I) for each participant and each sensory stimulus. Additionally, extreme values of d′ were corrected using the 1/(2N) rule (71). In line with the rule, extreme proportions of H and F reaching a value of 1 or 0 were replaced with 1–1/(2N) and 1/(2N), respectively, with N being the number of trials used in the experimental design. The calculations of d′(D,R), d′ (R,I), and d′ were performed on Excel (Microsoft office, 2018, United States).
Statistical Analyses
Pearson’s correlations were firstly calculated to assess the relationships between continuous values of BMI and peripheral levels of ghrelin and leptin. Pearson’s correlations were also calculated between sensory measures of supra-threshold sensitivity (d′), IR and VR for each olfactory compound. Subsequently, Pearson’s and partial correlations were calculated between olfactory functions (d′, IR, and VR) and peripheral ghrelin levels, with and without BMI as a covariate. Similar analyses were then performed to assess the correlations between olfactory functions (d′, IR, and VR) and peripheral leptin levels. For all correlation analyses, the strength of the correlation observed was reported as weak, moderate, and strong for an absolute value of the correlation coefficient in the ranges of 0–0.4, 0.4–0.7, and 0.7–1, respectively (72). All statistical analyses used an α level of 0.05 for detecting significant differences, and analyses were performed on SPSS Statistics (V26 – IBM Corp., Armonk, NY, United States) and GraphPad Prism 8.0 (GraphPad Software, San Diego, CA, United States).
Results
Summary of Testing Measures
The present study included a total of 94 Caucasian male participants with an average age of 25.81 ± 5.74 years old, body fat percentage of 19.99 ± 5.69% and BMI of 26.78 ± 4.93 kg⋅m–2 (Figure 1). Table 2 summarises the mean values and standard deviations of leptin and ghrelin concentrations in periphery, as well as olfactory performances for three food-related odorants (O1, O2, and O3) across BMI groups.
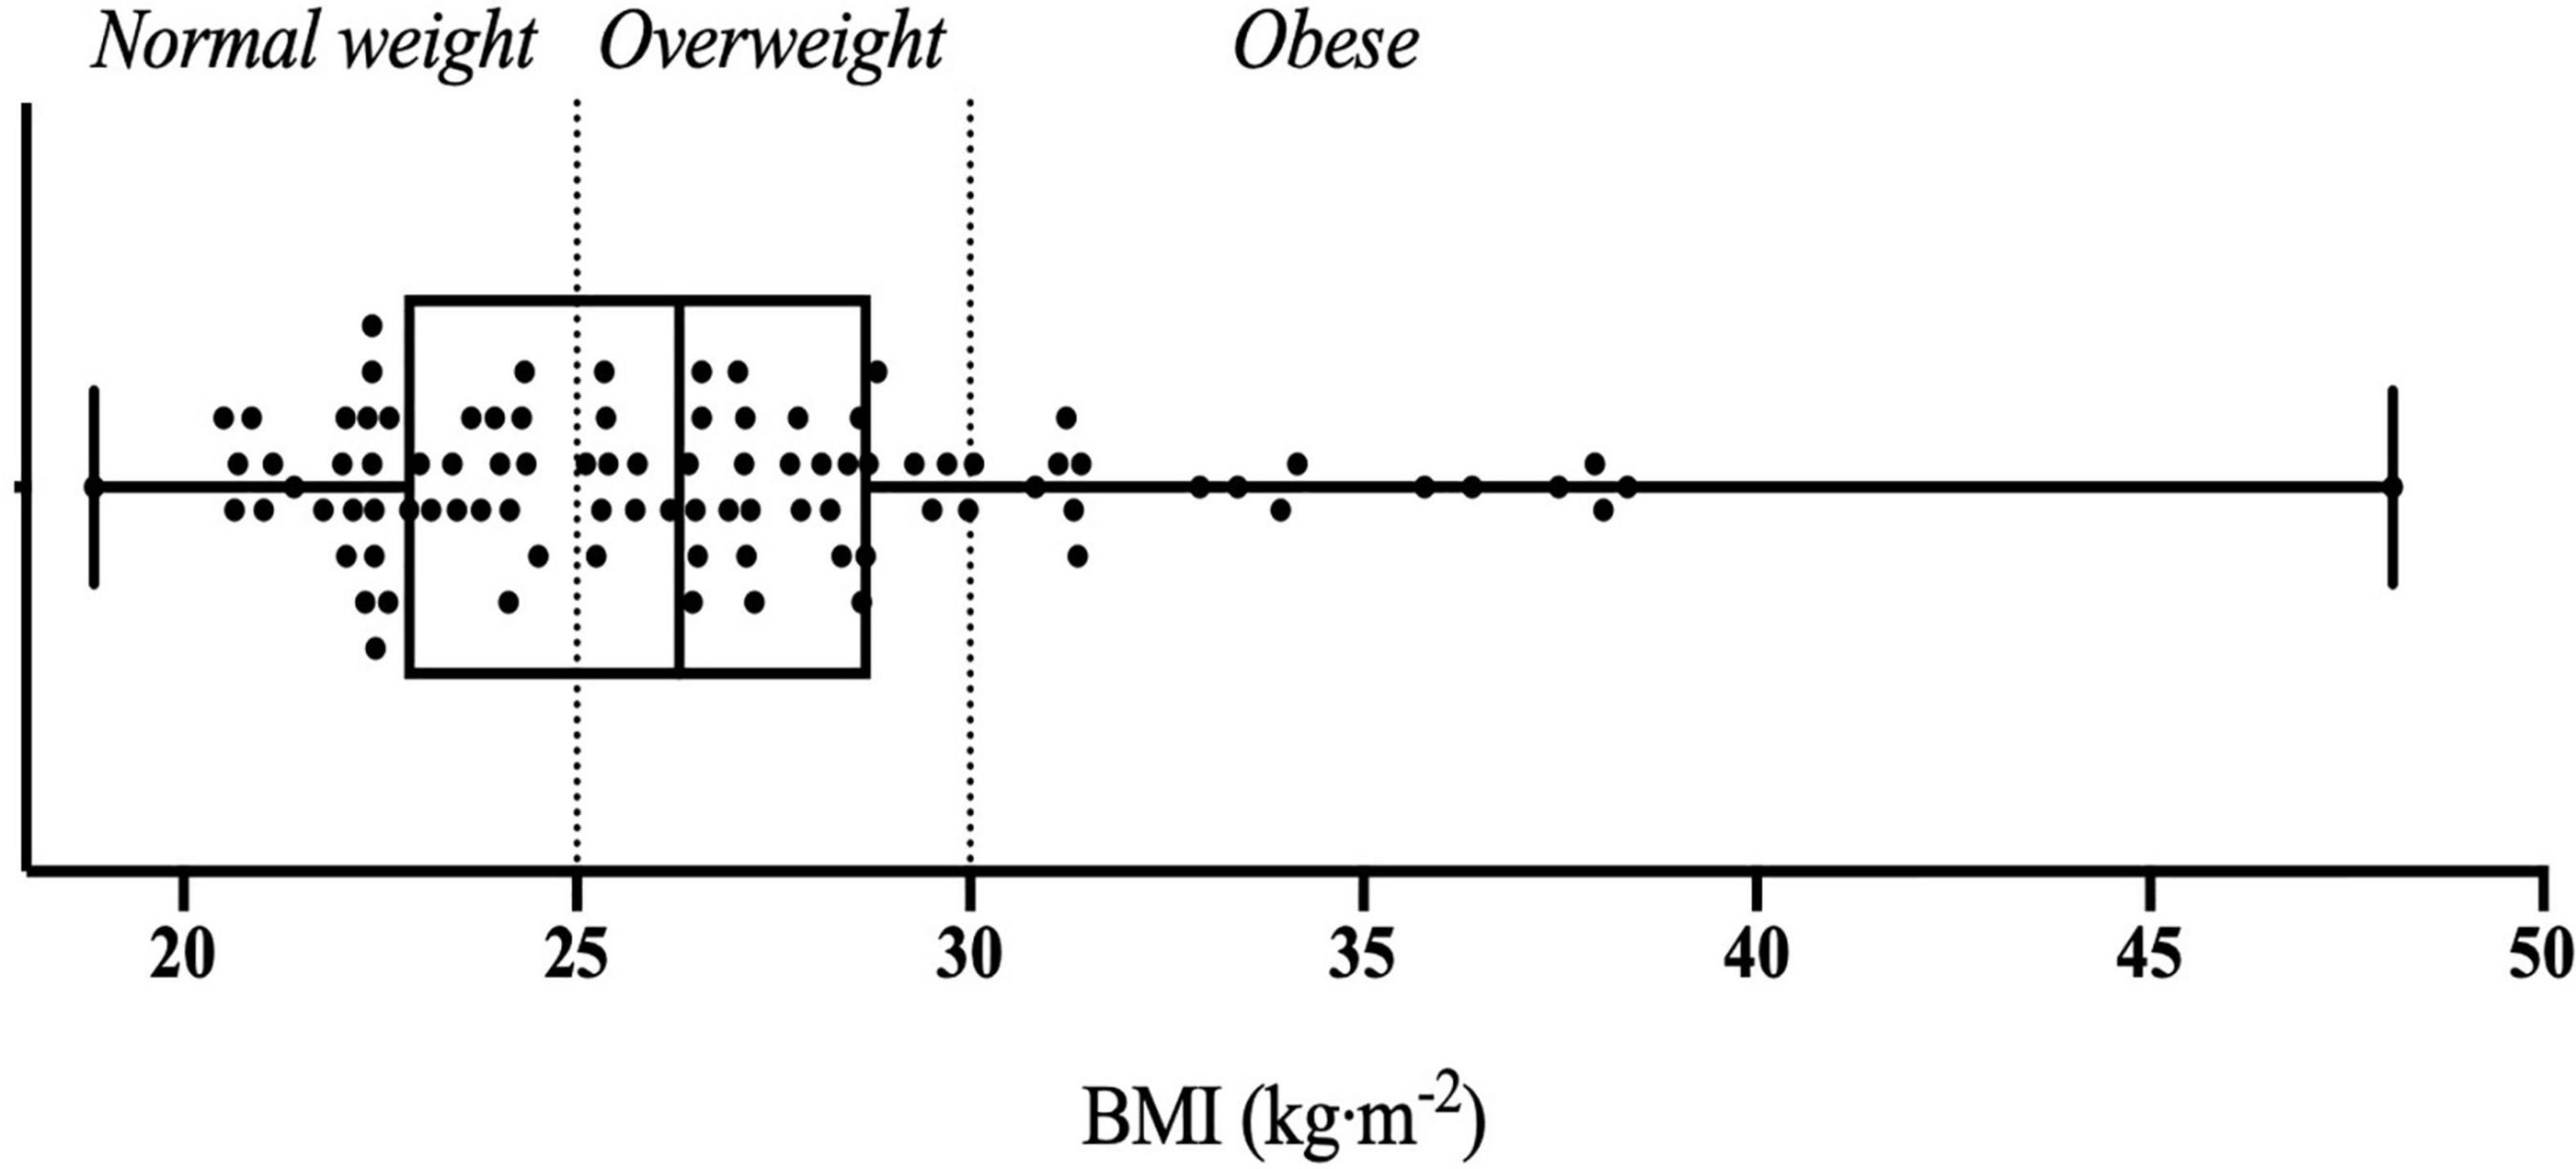
Figure 1. Whisker plot illustrating individuals’ BMI across three BMI groups classified as normal weight, overweight, and obese.
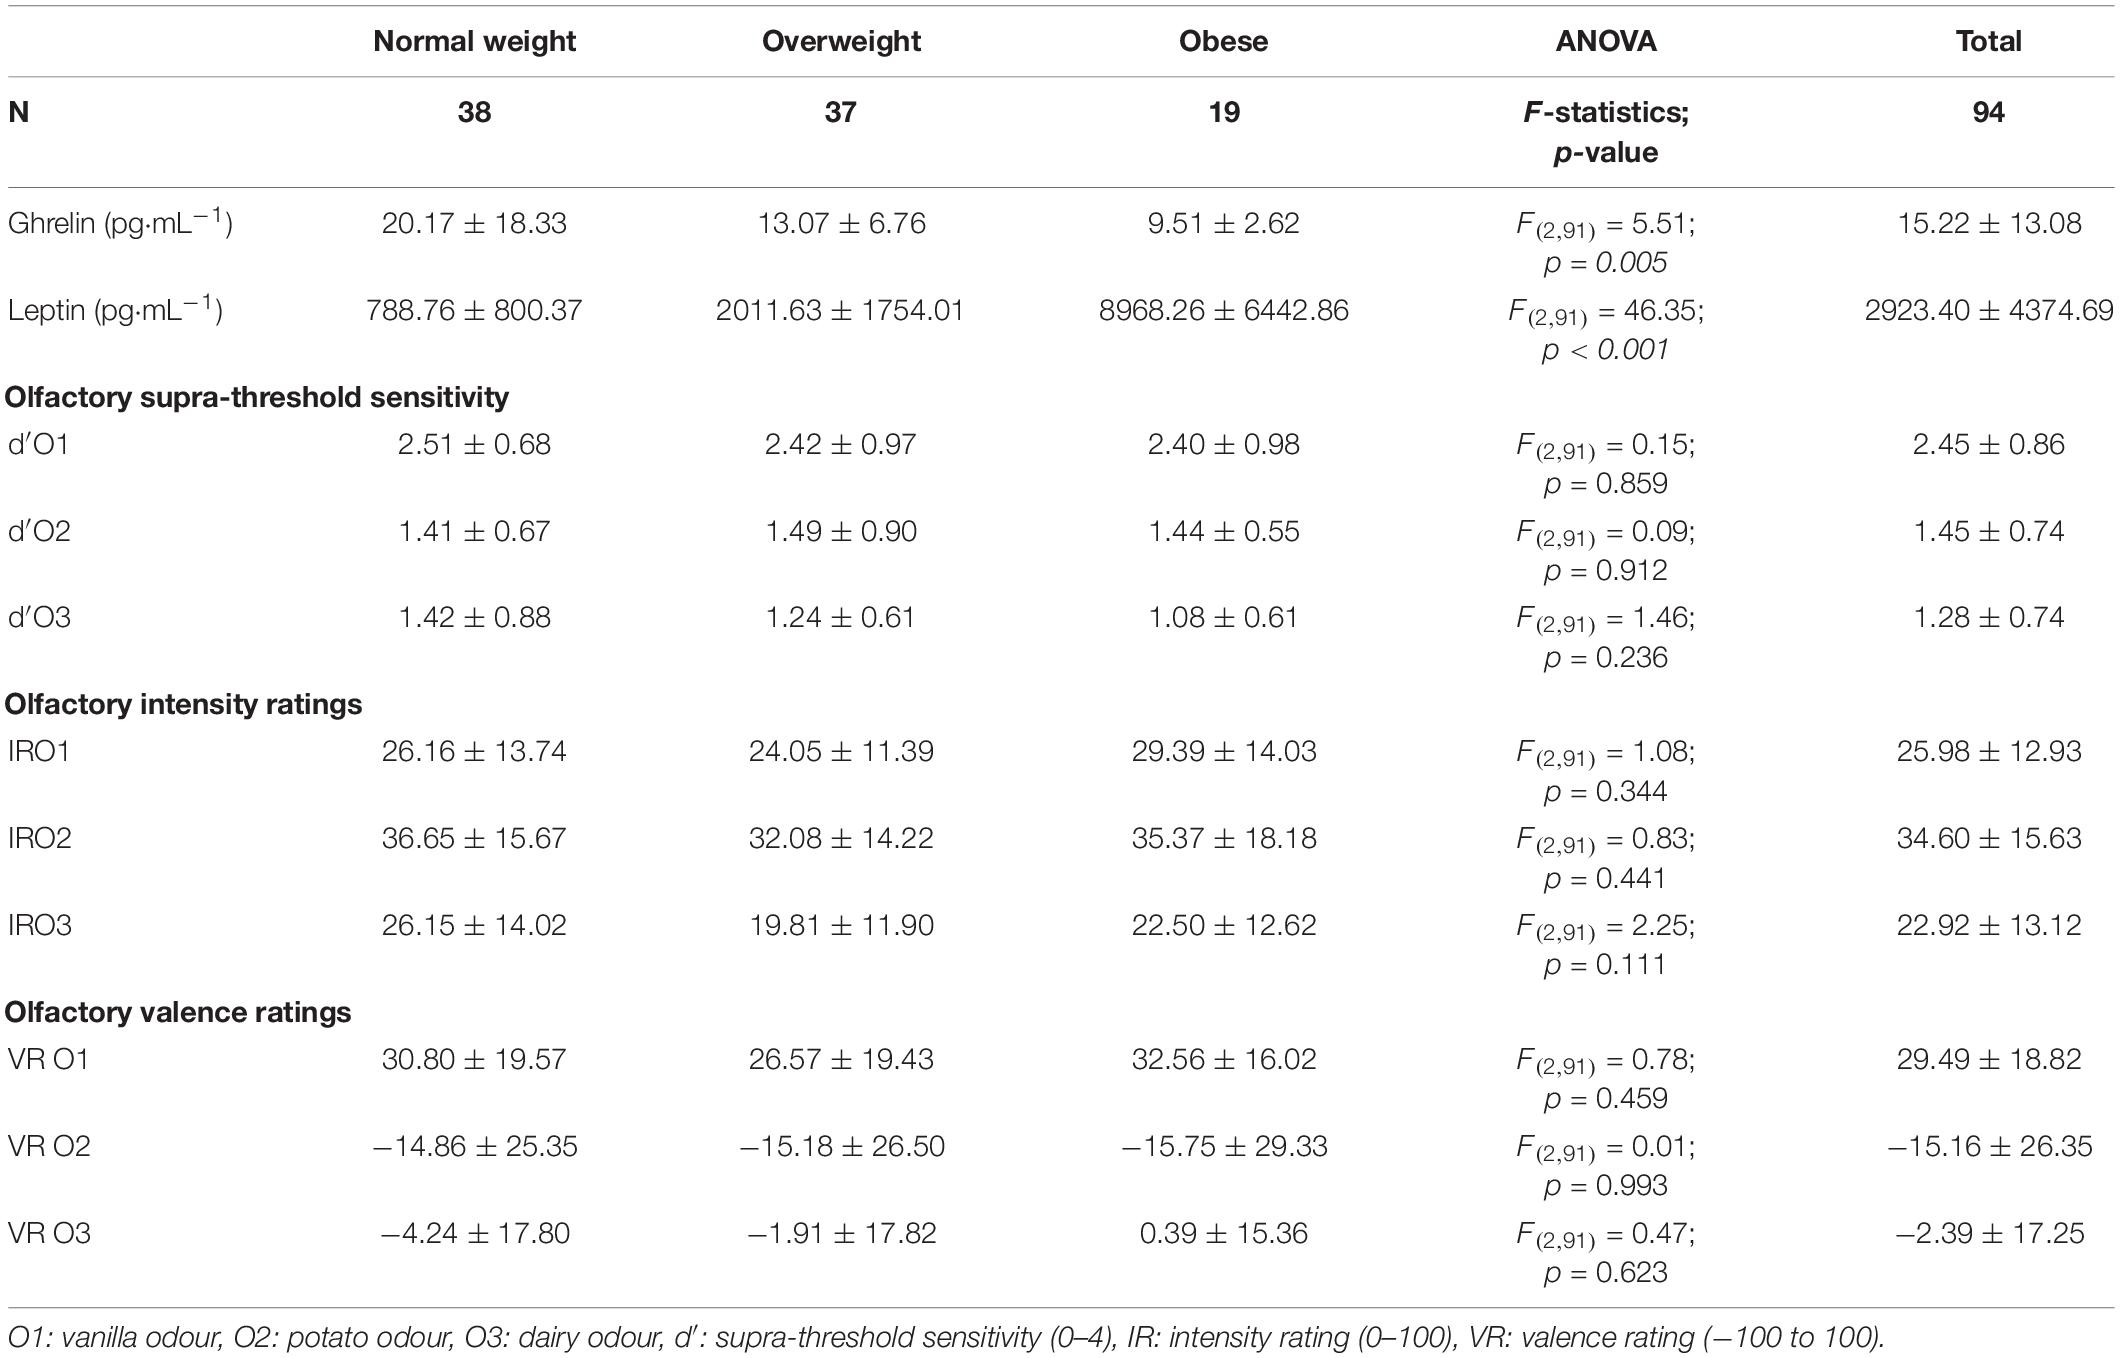
Table 2. Summary of Mean ± SD values of hormonal measures and olfactory functions across BMI groups with results from One-way ANOVAs assessing the effect of BMI groups on each testing variables.
A total of eleven separate One-way ANOVAs examining the effect of BMI groups on each testing variables were performed. Results revealed significant main effects of BMI groups on peripheral ghrelin and leptin levels (Table 2). Post hoc tests, based on simple effects tests with Bonferroni corrections revealed that normal-weight individuals had a significantly higher level of ghrelin than overweight individuals (p = 0.048) and individuals with obesity (p = 0.009, see mean values in Table 2). Additionally, individuals with obesity had higher levels of leptin in periphery than normal weight (p < 0.001) and overweight individuals (p < 0.001, see mean values in Table 2). On the other hand, there was no significant main effect of BMI groups on olfactory measures (Table 2).
Associations Between Peripheral Ghrelin and Leptin Levels and Body Mass Index
Pearson’s correlations were calculated to assess the relationship between continuous values of BMI and peripheral levels of ghrelin and leptin. Results revealed a significant negative correlation between peripheral ghrelin concentration and BMI (r = −0.302; p = 0.003) and a positive and strong significant correlation between leptin and BMI (r = 0.755; p < 0.001). Similar analyses were performed between body fat percentage measures and peripheral levels of ghrelin and leptin, which revealed comparable results (see details in Supplementary Table 1).
Associations Between Olfactory Measures and Body Mass Index
A series of Pearson’s correlations were calculated to assess for associations between continuous values of BMI and olfactory sensory measures including supra-threshold sensitivity (d′), IR and VR for three food-related odorants. Results revealed that BMI and suprathreshold sensitivity for O3 (dairy smell) were significantly negatively correlated (r = −0.217; p = 0.036). In contrast, sensitivities to other odorants (O1 and O2) as well as all IR and VR were not significantly correlated to BMI (p > 0.05, see details in in Supplementary Table 2). Similar analyses were performed between body fat percentage and olfactory measures, which revealed comparable results (see details in Supplementary Table 2).
Links Between Olfactory Sensory Measures
Pearson’s correlations were calculated between sensory measures of supra-threshold sensitivity (d′), IR and VR for each olfactory compounds tested. For all three odorants, sensitivity scores were not shown to be significantly correlated to any of the rating measures (IR and VR) (Figure 2). Regarding O1, a significantly positive and strong correlation was observed between both rating measures IRO1 and VRO1 (r = 0.65, p < 0.001, see Figure 2A). Then, when looking at the olfactory compound O2, a significantly negative correlation was noted between IRO2 and VRO2 (r = −0.35, p < 0.001, see Figure 2B). In contrast, IR and VR were not significantly correlated for the olfactory compound O3 (see Figure 2C).
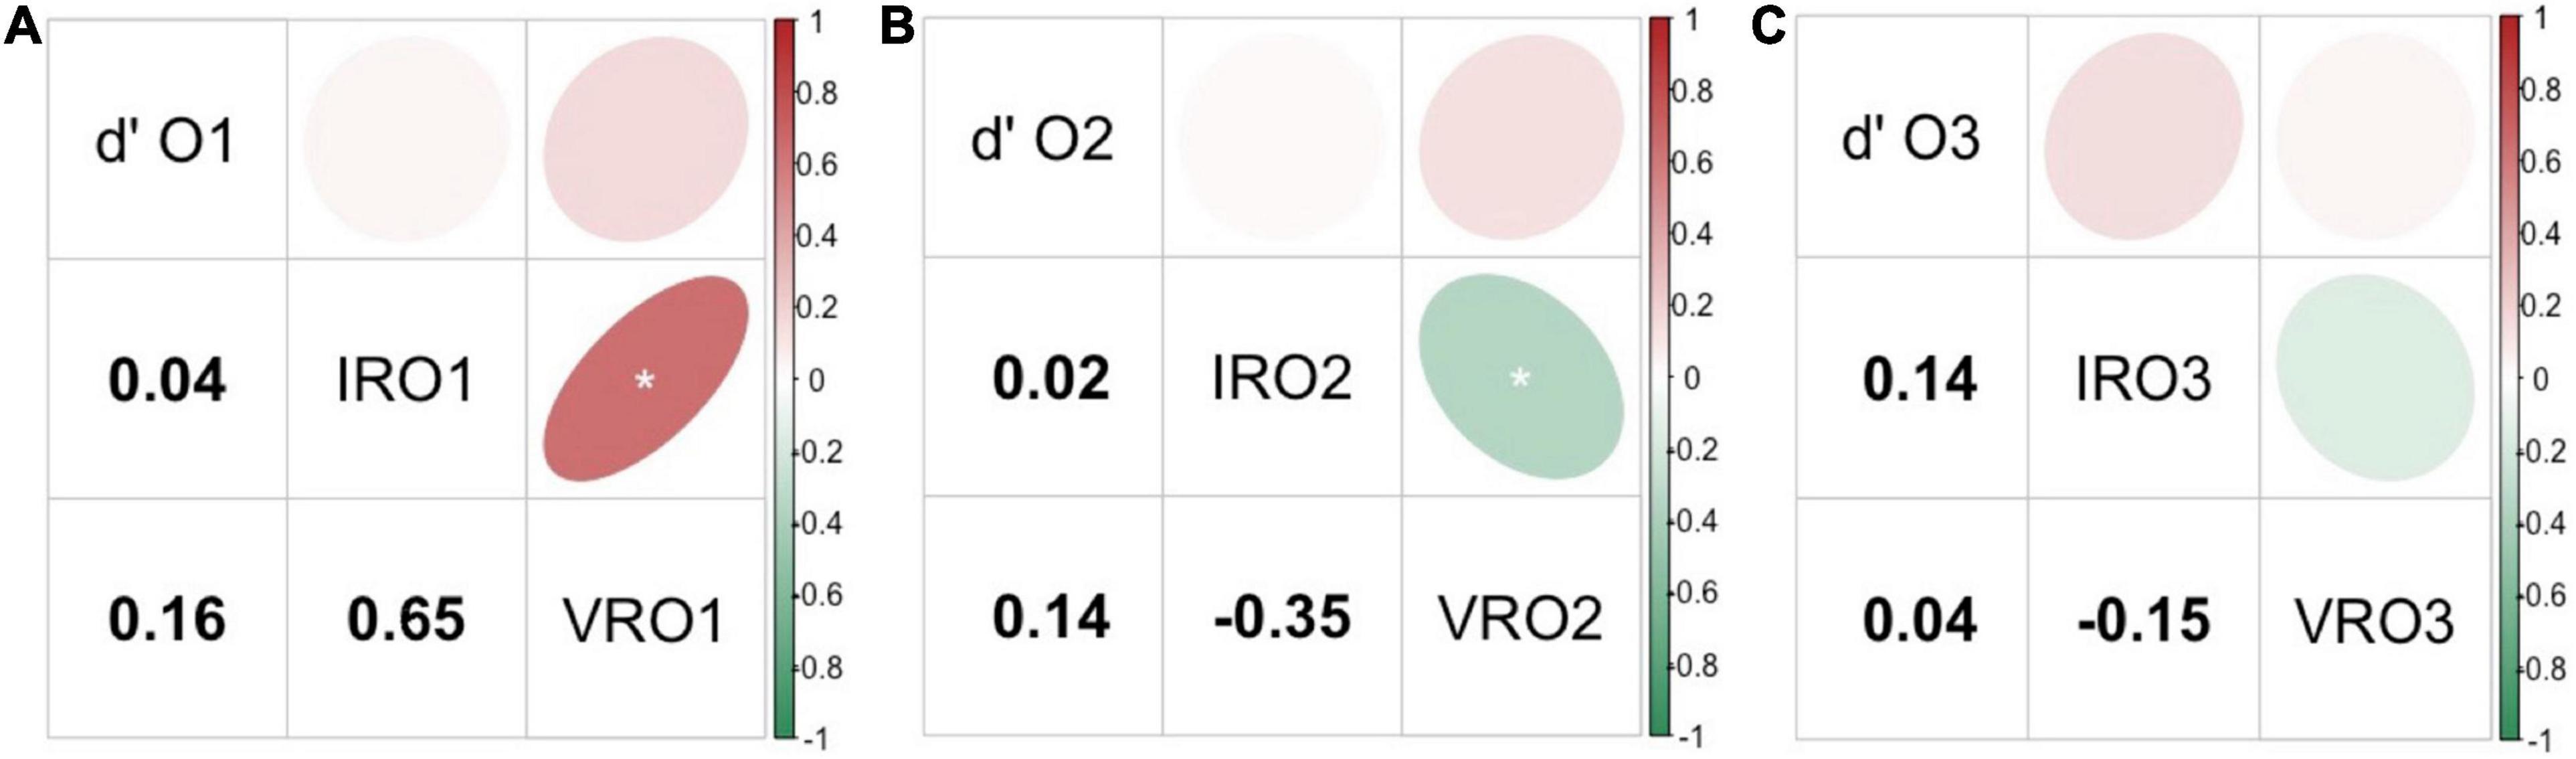
Figure 2. Pearson’s correlations across three types of olfactory measures: supra-threshold sensitivity (d′), intensity ratings (IR) and valence ratings (VR) for the odorants O1 (A), O2 (B), and O3 (C). The upper part of each figure illustrates the strength of the correlation via an elliptical shape, and the lower part shows the correlation coefficient value for each pair of sensory measures compared. Positive correlations are represented in a red gradient and negative correlation in a green gradient. O1: vanilla odour, O2: potato odour, O3: dairy odour. Significant results are represented by *.
Relationships Between Peripheral Ghrelin Levels and Olfactory Functions
Pearson’s correlations were calculated between ghrelin concentrations and olfactory supra-threshold sensitivities, olfactory IR, and olfactory VR, for all three food-related odorants O1, O2, and O3 (Figure 3). These analyses revealed two significantly positive correlations, both involving the olfactory compound O3. Specifically, peripheral ghrelin levels were shown to be significantly positively correlated to d′O3 (r = 0.289, p = 0.005, Figure 3A) and IRO3 (r = 0.217, p = 0.035, Figure 3B). On the other hand, no correlation was observed between olfactory VR for any of the odorant tested and peripheral ghrelin levels (Figure 3C).
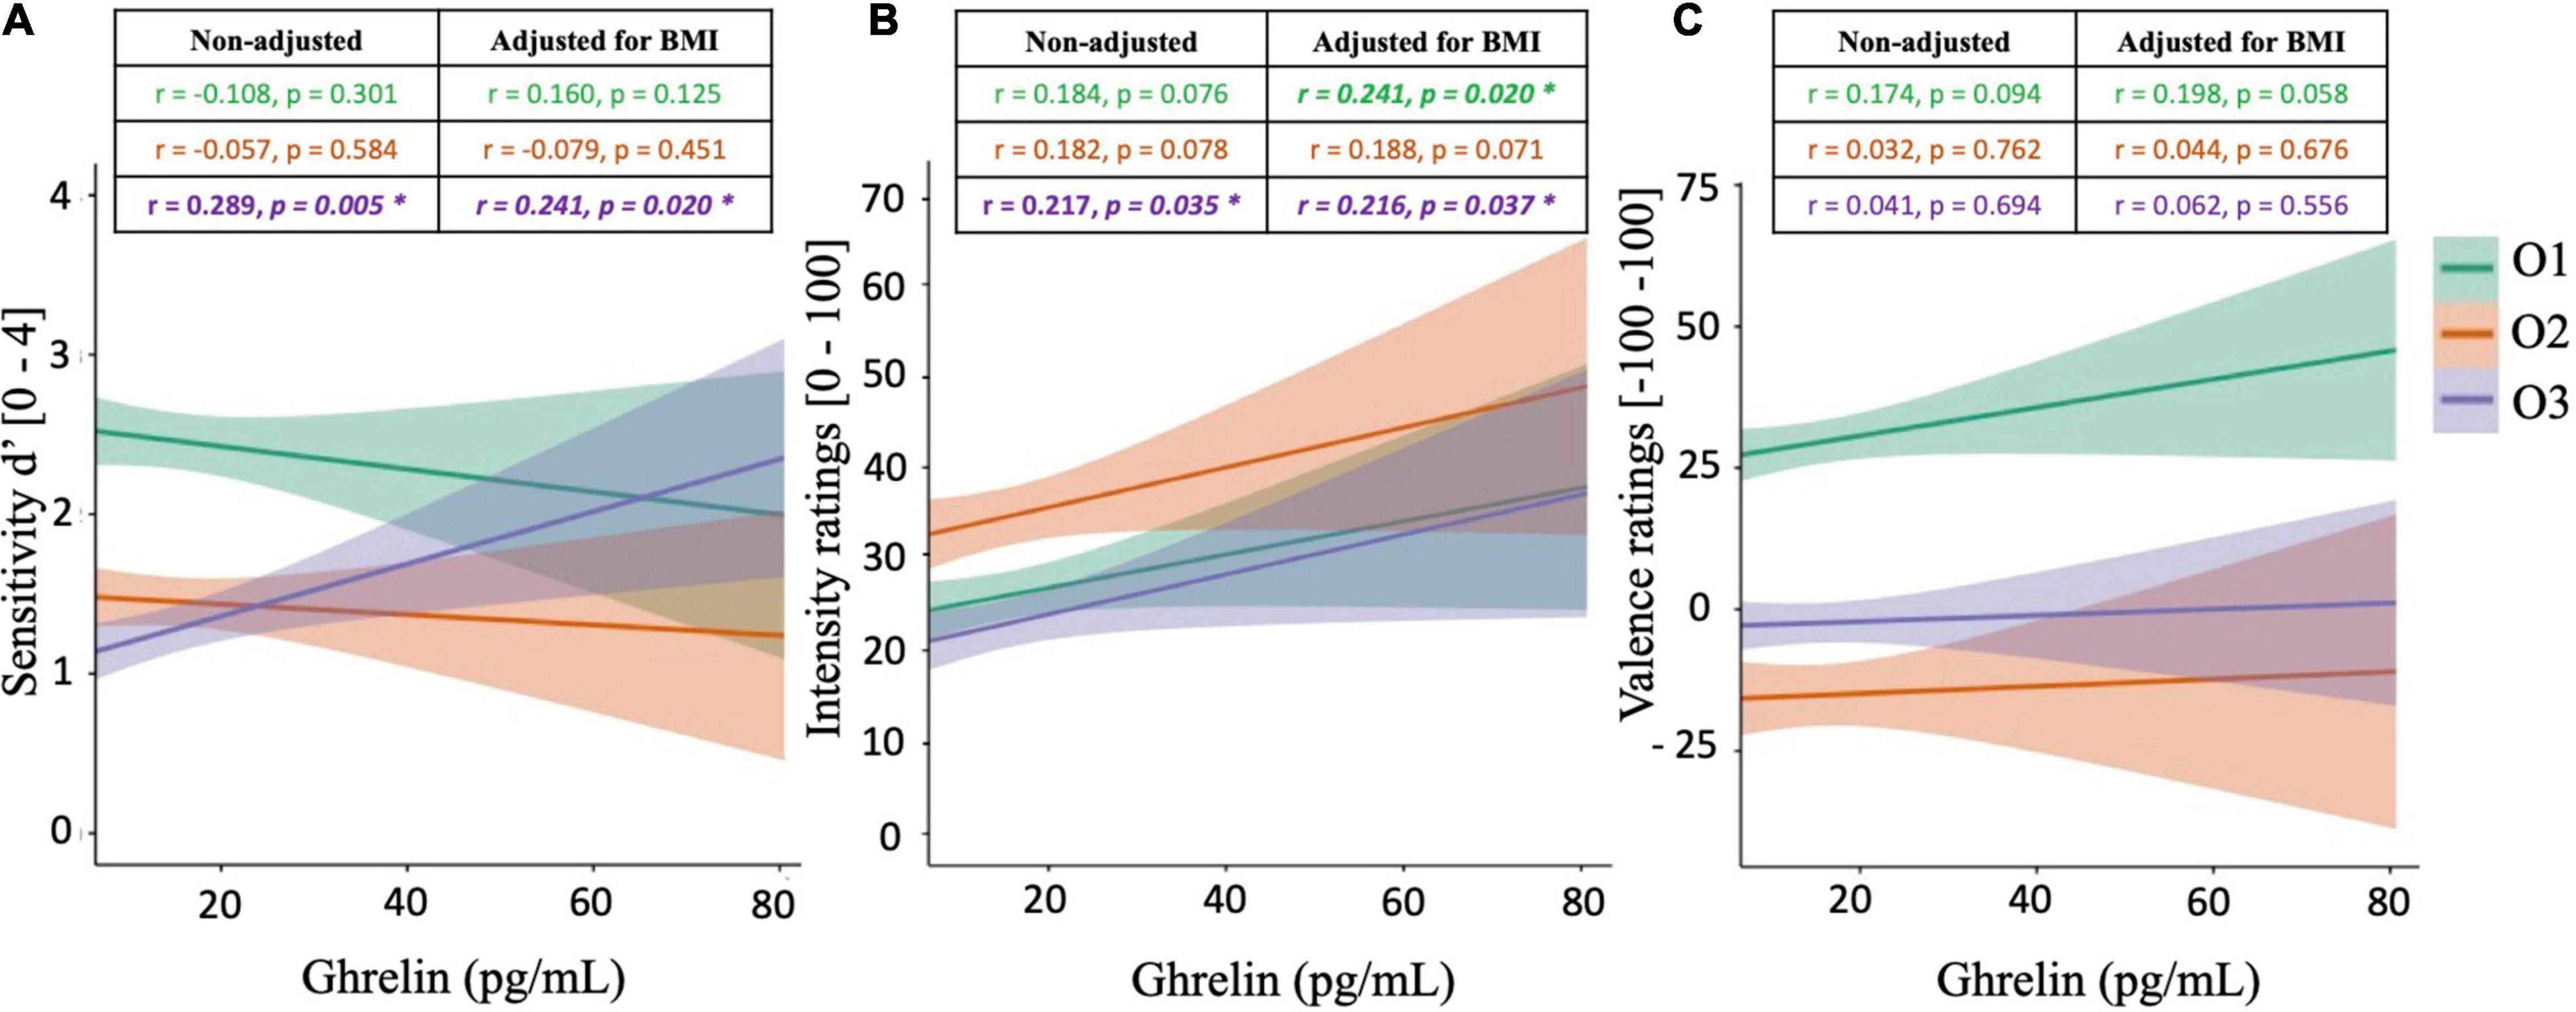
Figure 3. Correlation plots between peripheral ghrelin levels and olfactory supra-threshold sensitivity (A), olfactory intensity ratings (B), and olfactory valence ratings (C) of the odorants O1 (vanilla odour), O2 (potato odour), and O3 (dairy odour). All graphical plots illustrate results obtained from Pearson’s correlations (non-adjusted). Significant results are represented by *.
Subsequently, partial correlations were calculated between peripheral ghrelin levels and olfactory performances, accounting for BMI. Results from partial correlations also revealed that ghrelin concentrations were significantly and positively correlated to different measures of olfactory function, with a specific emphasis on IR. Specifically, positive correlations were observed between peripheral levels of ghrelin and IRO1 (r = 0.241, p = 0.020) and IRO3 (r = 0.216, p = 0.037), and a trend toward statistical significance was observed with IRO2 (r = 0.188, p = 0.071). Furthermore, a significant positive relationship was still observed between peripheral ghrelin levels and d′O3 after adjusting for BMI (r = 0.241, p = 0.020). Finally, while ghrelin levels were not significantly correlated to olfactory VR, a tendency toward significance was noted with VRO1 (r = 0.198, p = 0.058).
Relationships Between Peripheral Leptin Levels and Olfactory Functions
Pearson’s correlations were calculated between peripheral leptin levels and olfactory supra-threshold sensitivities, olfactory IR, and olfactory VR, for all three food-related odorants O1, O2, and O3 (Figure 4). Regarding results on sensitivity measures, a trend toward statistical significance was noted between d′O3 and peripheral leptin concentrations (r = −0.192, p = 0.064), but not with other odorants O1 and O2 (Figure 4A). Additionally, results did not reveal any significant correlation between peripheral leptin and olfactory IR (Figure 4B), nor VR (Figure 4C).
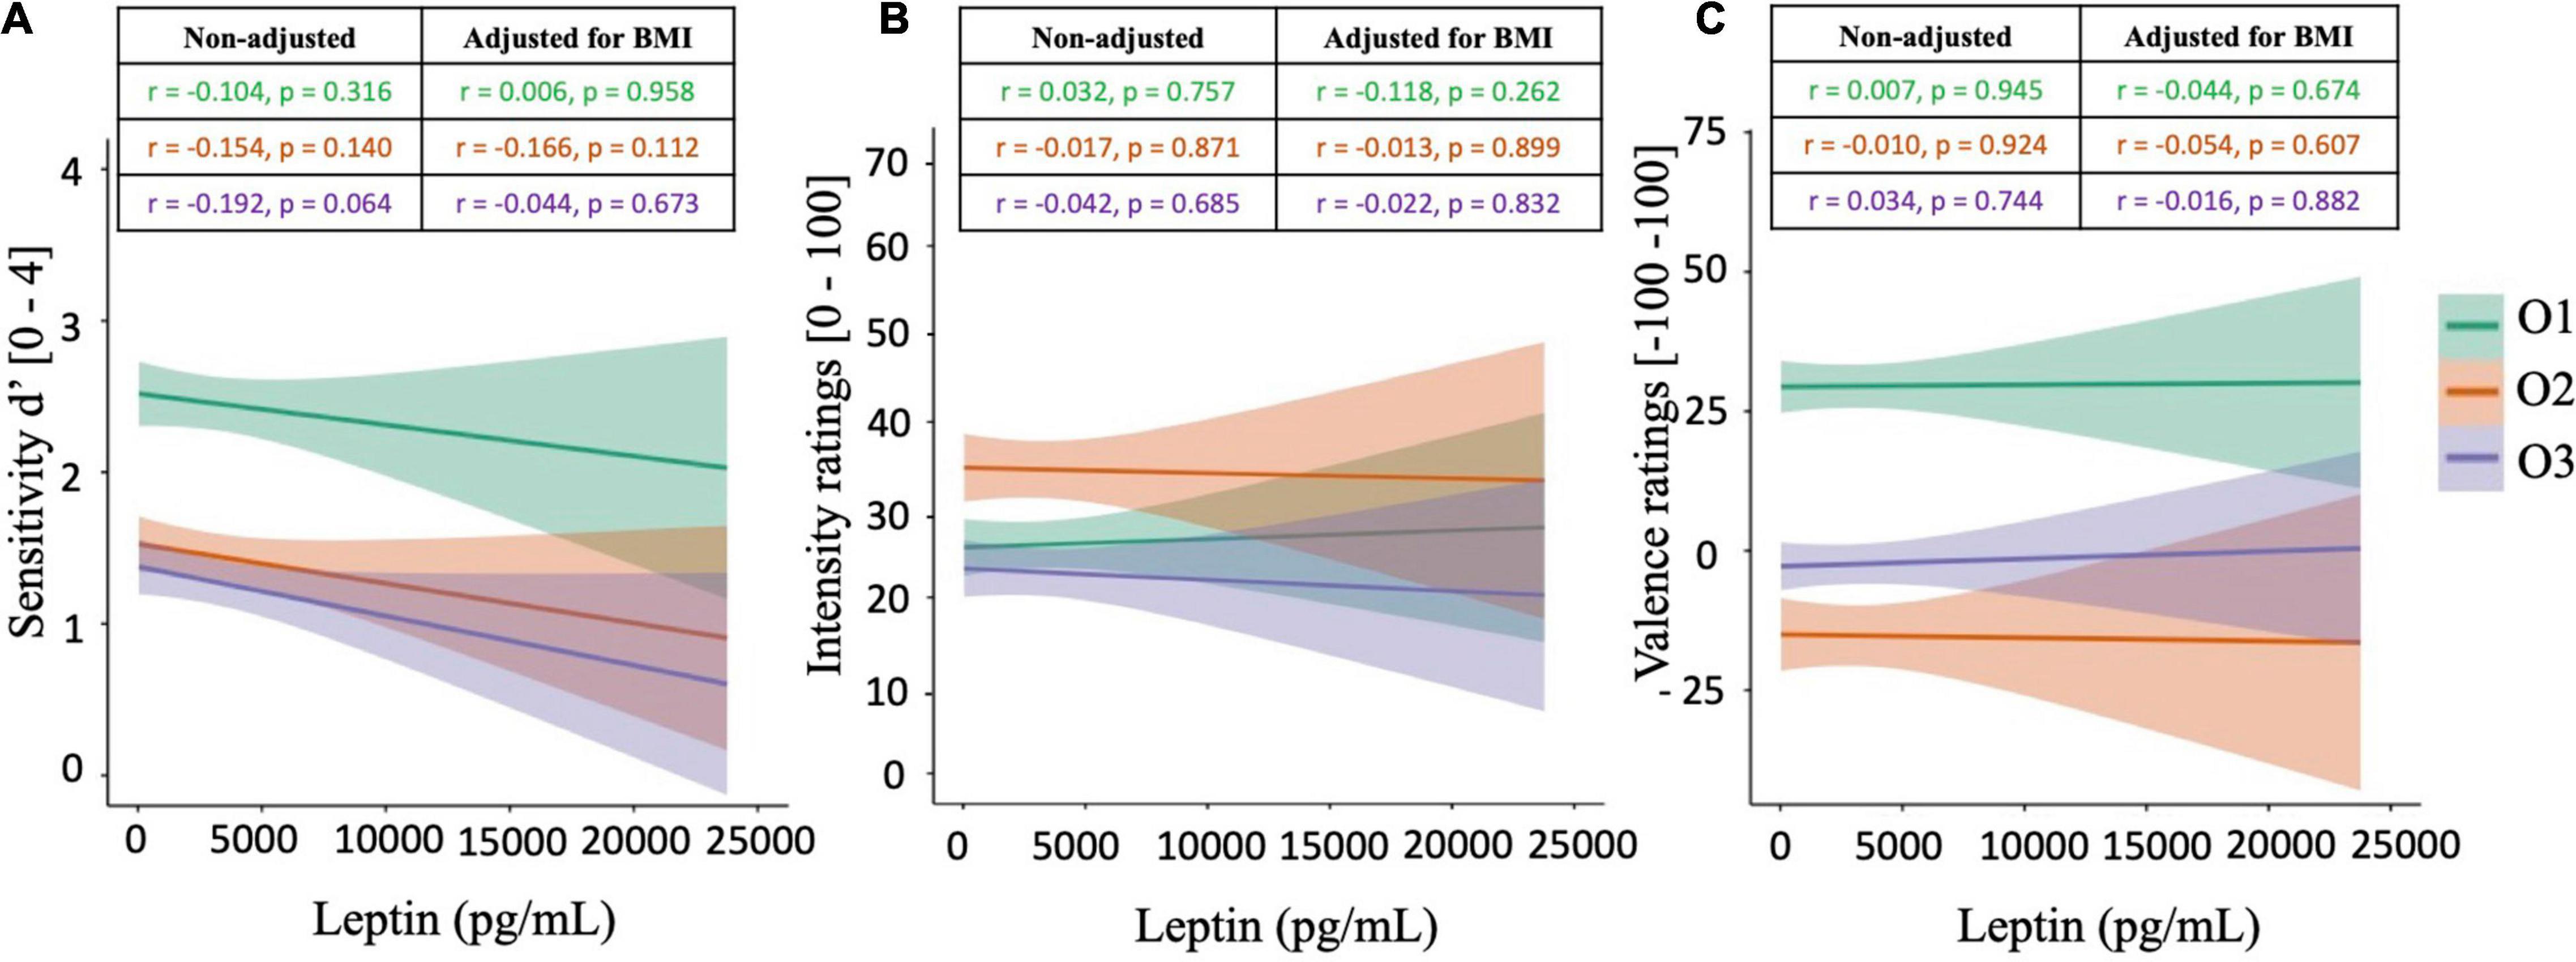
Figure 4. Correlation plots between peripheral leptin levels and olfactory supra-threshold sensitivity (A), olfactory intensity ratings (B), and olfactory valence ratings (C) of the odorants O1 (vanilla odour), O2 (potato odour), and O3 (dairy odour). All graphical plots illustrate results obtained from Pearson’s correlations (non-adjusted). Significant results are represented by *.
Subsequently, partial correlations were calculated between peripheral leptin levels and olfactory performances, accounting for BMI. Results from partial correlations revealed similar outcomes as the ones from Pearson’s correlations, with no significant correlation between peripheral leptin levels and any of the olfactory functions tested (p > 0.05, Figure 3). Notably, the tendency toward significance between d′O3 and peripheral leptin concentrations was no longer observed after adjusting the correlation for BMI (r = −0.044, p = 0.673).
Discussion
The present study investigated the links between fasting individual olfactory functions and peripheral concentrations of ghrelin and leptin, two hormones highly involved in eating behaviour and previously used as biomarkers for obesity. Results from our study support the role of ghrelin in modulating individual olfactory sensitivity and intensity perception of specific food odours (i.e., dairy and vanilla odours), whereas no significant relationships were observed for leptin.
Firstly, the present study confirmed previously reported links between adiposity and hormonal balance, with individuals with obesity having lower levels of ghrelin (12, 15) and higher levels of leptin compared to normal-weight individuals (73, 74). Additionally, the present study also demonstrated that different sensory measures represent distinct phases of perception, with no evidence for correlations between olfactory sensitivity and ratings, in line with previous observations of gustation [e.g., (75)].
The present analyses showed a positive link between fasting peripheral ghrelin levels and supra-threshold sensitivities with the dairy odour, with additional positive relationships based on IR of the dairy and vanilla odour. The observed positive relationships to two of these odours were in line with a recent study of Uygun et al. (50), in which peripheral levels of ghrelin was correlated to odour detection scores. By contrast, no relationship was found between ghrelin and olfactory measures of the potato odour, regardless of controlling for BMI. The inconsistent results across olfactory compounds imply an odour-specific relationship of ghrelin effects. Similarly, Trellakis et al. (49) investigated the link between ghrelin levels and olfactory VR of six odours, and observed only one significant correlation (with black pepper oil). Moreover, studies using a neutral odour of n-butanol failed to observe a ghrelin-olfaction link (47–49), while other studies using food-related odours did (39, 48). These previously observed inconsistencies may be attributed to choices of neutral versus food-related odours. The current findings further highlight discrepant results across different food odours (e.g., vanilla versus potato odours).
It is important to note that the observed ghrelin-olfaction links were subject to the sensory measure. Specifically, significant results were found with supra-threshold sensitivity and intensity rating (to specific odours). However, none of the analyses based on odour valence showed significance (although correlation for the vanilla odour was close to significance after BMI being controlled). Ghrelin links to odour valance had been tested in two separate studies, with findings remaining controversial (48, 49). For instance, Trellakis et al. (49) found that ghrelin was significantly correlated with valence to an odour of black pepper oil, but did not find evidence for relationships based on odour discrimination nor identification. Recent research has found that different types of sensory functions, such as intensity and valence perception, involve distinct brain regions (29). Specifically, evidence has shown that odour intensity perception activates the amygdala, while valence emerges from activations of the orbitofrontal cortex (76). Moreover, Russo et al. (42) demonstrated that ghrelin injections were able to modulate rat’s sense of smell, by altering olfactory transduction from the mitral cells to the amygdala – a cortical area thought to be important for intensity perception. In this context, our study offers new behavioural data on close links between ghrelin and odour intensity perception in humans. Additionally, these findings point to the importance of considering specific sensory functions when evaluating links to ghrelin levels.
In general, the present study failed to detect strong associations between leptin levels and olfactory measures, which was in line with findings from Uygun et al. (50). In contrast, numerous previous investigations have reported either positive (49, 58) or negative associations between leptin levels and olfactory sensitivities (51, 54, 55, 58, 59). In addition, one study reported negative correlations between leptin and odour valence (49). Previously, obesity has been linked to increased leptin levels and declined olfactory functions [cf. (7, 77)]. Building upon these findings, we originally proposed that leptin should be negatively correlated to odour sensitivity. Notably in our results, correlation between leptin and sensitivity to the dairy odour was close to significance (p = 0.06) but increased drastically with correlations controlling for BMIs (p = 0.67). Such change in correlation coefficients suggests that the link between leptin and odour sensitivity was prominently mediated by individual BMIs. In this tripartite relationship, BMI plays a more substantial role in linking leptin and olfactory sensitivities. While future studies are needed to confirm this proposal, our data appear to suggests that leptin and olfactory performance are not directly linked.
The current findings point to the important role of olfactory processing in mediating ghrelin influences on food intake (78). Elevated peripheral ghrelin levels have been previously observed in individuals experiencing food reward anticipation, which is characterised by an increased cerebral activity in reward-related areas, such as the orbitofrontal cortex (79, 80). Furthermore, evidence suggests that peripheral ghrelin concentration following consumption of energy-dense food maintains at a high level in sated healthy-weight individuals, in contrary to the expected post prandial ghrelin profile (5, 22). Our study has found that individuals with fasting elevated peripheral ghrelin levels show heightened olfactory supra-threshold sensitivity and intensity perception for specific food odours, which may facilitate food-seeking behaviour. This finding may be related to neural evidence for convergence of ghrelin and sensory functions, as evidence indicates that sensory food cues and systemic ghrelin administration activate the same subset of hypothalamic neurons (81). These connexions directly imply a co-action of ghrelin signalling and olfactory perception, resulting in increased appetite and food intake. Notably, recent research indicated that plasma ghrelin only targets specific brain regions, including the hypothalamus, the mesolimbic pathway, as well as the OB [cf. (82)]. The latter brain area, which is directly involved in olfactory coding processes (25, 27), was shown to be one of the regions with the highest uptake of systemically injected ghrelin (83). Inversely, a recent study from Riera et al. (84) suggested that olfactory activity directly modulates fat mass and hormonal alteration associated with obesity. Therefore, findings from both previous research and the present study support the concept of bidirectional relationship between olfactory perception and metabolic regulation through ghrelin signalling. Overall, these findings bring new insights into understanding individual susceptibility to overeating and obesity.
A limitation of the present study was that no serine protease inhibitor was added to the K2 EDTA blood samples before measuring acyl ghrelin concentrations. The addition of serine protease inhibitor is typically used to limit the degradation of acyl ghrelin due to deacylation (85, 86). A common serine protease inhibitor is aprotinin, which has been widely used as a standardized procedure to prevent from acyl ghrelin degradation in previous research (87). The absence of a protease inhibitor in the present experiment may explain the rather low concentrations of acyl ghrelin reported in this study. However, Blatnik and Soderstrom (86) observed no significant difference in the degree of acyl ghrelin degradation, when plasma samples were stored in K2 EDTA tubes only or in K2 EDTA tubes containing aprotinin, with both storage leading to an approximate loss of 50% of acyl ghrelin. Therefore, concentrations of acyl ghrelin presented in this study should be interpreted with a certain degree of caution.
Conclusion
Overall, the present study investigated links between individual olfactory functions and two major peptide hormones. The findings point to the important role of ghrelin in influencing olfactory performances. Specifically, strong relationships were observed between peripheral ghrelin levels and olfactory functions, in particular intensity perception, of specific food odours. Furthermore, peripheral leptin levels were not linked to any of the tested olfactory performances. Results from the present study brings new data supporting the role of olfaction in mediating hormonal effects on eating.
Data Availability Statement
The original contributions presented in the study are included in the article/Supplementary Material, further inquiries can be directed to the corresponding author.
Ethics Statement
The studies involving human participants were reviewed and approved by the University of Otago Human Ethics Committee (Health). The patients/participants provided their written informed consent to participate in this study.
Author Contributions
RG, SA, and MP contributed to conception and design of the study. RG and SA organized the database. RG performed the statistical analysis and wrote the first draft of the manuscript. MP and IO edited the manuscript. RG, SA, IO, and MP contributed to manuscript revision, read, and approved the submitted version.
Funding
This study was supported by the New Zealand Royal Society Te Apārangi via Marsden Fund (UOO_1720).
Conflict of Interest
The authors declare that the research was conducted in the absence of any commercial or financial relationships that could be construed as a potential conflict of interest.
Publisher’s Note
All claims expressed in this article are solely those of the authors and do not necessarily represent those of their affiliated organizations, or those of the publisher, the editors and the reviewers. Any product that may be evaluated in this article, or claim that may be made by its manufacturer, is not guaranteed or endorsed by the publisher.
Supplementary Material
The Supplementary Material for this article can be found online at: https://www.frontiersin.org/articles/10.3389/fnut.2022.888608/full#supplementary-material
References
1. Ncd-RisC. Trends in adult body-mass index in 200 countries from 1975 to 2014: a pooled analysis of 1698 population-based measurement studies with 19⋅ 2 million participants. Lancet. (2016) 387:1377–96. doi: 10.1016/S0140-6736(16)30054-X
2. Belfort-DeAguiar R, Seo D. Food cues and obesity: overpowering hormones and energy balance regulation. Curr Obes Rep. (2018) 7:122–9. doi: 10.1007/s13679-018-0303-1
3. Lowe MR, Butryn ML. Hedonic hunger: a new dimension of appetite? Physiol Behav. (2007) 91:432–9. doi: 10.1016/j.physbeh.2007.04.006
4. Farooqi IS, Bullmore E, Keogh J, Gillard J, O’Rahilly S, Fletcher PC. Leptin regulates striatal regions and human eating behavior. Science. (2007) 317:1355–1355. doi: 10.1126/science.1144599
5. Monteleone P, Piscitelli F, Scognamiglio P, Monteleone AM, Canestrelli B, Di Marzo V, et al. Hedonic eating is associated with increased peripheral levels of ghrelin and the endocannabinoid 2-arachidonoyl-glycerol in healthy humans: a pilot study. J Clin Endocrinol Metabol. (2012) 97:E917–24. doi: 10.1210/jc.2011-3018
6. Calvo SS-C, Egan JM. The endocrinology of taste receptors. Nat Rev Endocrinol. (2015) 11:213. doi: 10.1038/nrendo.2015.7
7. Faour M, Magnan C, Gurden H, Martin C. Olfaction in the context of obesity and diabetes: insights from animal models to humans. Neuropharmacology. (2022) 206:108923. doi: 10.1016/j.neuropharm.2021.108923
8. Kroemer NB, Krebs L, Kobiella A, Grimm O, Pilhatsch M, Bidlingmaier M, et al. Fasting levels of ghrelin covary with the brain response to food pictures. Addict Biol. (2013) 18:855–62. doi: 10.1111/j.1369-1600.2012.00489.x
9. Izquierdo AG, Crujeiras AB, Casanueva FF, Carreira MC. Leptin, obesity, and leptin resistance: where are we 25 years later? Nutrients. (2019) 11:2704. doi: 10.3390/nu11112704
10. Zhang C-S, Wang L-X, Wang R, Liu Y, Song L-M, Yuan J-H, et al. The correlation between circulating ghrelin and insulin resistance in obesity: a meta-analysis. Front Physiol. (2018) 9:1308. doi: 10.3389/fphys.2018.01308
11. Shiiya T, Nakazato M, Mizuta M, Date Y, Mondal MS, Tanaka M, et al. Plasma ghrelin levels in lean and obese humans and the effect of glucose on ghrelin secretion. J Clin Endocrinol Metabol. (2002) 87:240–4. doi: 10.1210/jcem.87.1.8129
12. Marzullo P, Verti B, Savia G, Walker GE, Guzzaloni G, Tagliaferri M, et al. The relationship between active ghrelin levels and human obesity involves alterations in resting energy expenditure. J Clin Endocrinol Metabol. (2004) 89:936–9. doi: 10.1210/jc.2003-031328
13. Adeyemi E, Abdulle A. A comparison of plasma leptin levels in obese and lean individuals in the United Arab emirates. Nutrit Res. (2000) 20:157–66. doi: 10.1016/s0271-5317(99)00149-9
14. Considine RV, Sinha MK, Heiman ML, Kriauciunas A, Stephens TW, Nyce MR, et al. Serum immunoreactive-leptin concentrations in normal-weight and obese humans. N Engl J Med. (1996) 334:292–5. doi: 10.1056/NEJM199602013340503
15. Ekmen N, Helvaci A, Gunaldi M, Sasani H, Yildirmak ST. Leptin as an important link between obesity and cardiovascular risk factors in men with acute myocardial infarction. Ind Heart J. (2016) 68:132–7. doi: 10.1016/j.ihj.2015.07.032
16. Baicy K, London ED, Monterosso J, Wong M-L, Delibasi T, Sharma A, et al. Leptin replacement alters brain response to food cues in genetically leptin-deficient adults. Proc Natl Acad Sci. (2007) 104:18276–9. doi: 10.1073/pnas.0706481104
17. Cummings DE, Purnell JQ, Frayo RS, Schmidova K, Wisse BE, Weigle DS. A preprandial rise in plasma ghrelin levels suggests a role in meal initiation in humans. Diabetes. (2001) 50:1714–9. doi: 10.2337/diabetes.50.8.1714
18. Tschöp M, Wawarta R, Riepl R, Friedrich S, Bidlingmaier M, Landgraf R, et al. Post-prandial decrease of circulating human ghrelin levels. J Endocrinol Investig. (2001) 24:RC19–21. doi: 10.1007/BF03351037
19. Ahrén B, Larsson H, Wilhelmsson C, Näsman B, Olsson T. Regulation of circulating leptin in humans. Endocrine. (1997) 7:1–8. doi: 10.1007/bf02778056
20. Münzberg H, Morrison CD. Structure, production and signaling of leptin. Metabolism. (2015) 64:13–23. doi: 10.1016/j.metabol.2014.09.010
21. Hinkle W, Cordell M, Leibel R, Rosenbaum M, Hirsch J. Effects of reduced weight maintenance and leptin repletion on functional connectivity of the hypothalamus in obese humans. PLoS One. (2013) 8:e59114. doi: 10.1371/journal.pone.0059114
22. Monteleone P, Scognamiglio P, Monteleone AM, Perillo D, Canestrelli B, Maj M. Gastroenteric hormone responses to hedonic eating in healthy humans. Psychoneuroendocrinology. (2013) 38:1435–41. doi: 10.1016/j.psyneuen.2012.12.009
23. Tschöp M, Smiley DL, Heiman ML. Ghrelin induces adiposity in rodents. Nature. (2000) 407:908–13. doi: 10.1038/35038090
24. Jovanovic P, Riera CE. Olfactory system and energy metabolism: a two-way street. Trends Endocrinol Metabol. (2022) 33:281–91. doi: 10.1016/j.tem.2022.01.004
25. Firestein S. How the olfactory system makes sense of scents. Nature. (2001) 413:211–8. doi: 10.1038/35093026
26. Maresh A, Gil DR, Whitman MC, Greer CA. Principles of glomerular organization in the human olfactory bulb–implications for odor processing. PLoS One. (2008) 3:e2640. doi: 10.1371/journal.pone.0002640
27. Mori K, Nagao H, Yoshihara Y. The olfactory bulb: coding and processing of odor molecule information. Science. (1999) 286:711–5. doi: 10.1126/science.286.5440.711
28. Purves D, Augustine G, Fitzpatrick D, Hall W. Neuroscience. Sunderland, MA: Sinauer Associates, Inc (2004).
29. Grabe V, Sachse S. Fundamental principles of the olfactory code. Biosystems. (2018) 164:94–101. doi: 10.1016/j.biosystems.2017.10.010
30. Lucero MT. Peripheral modulation of smell: fact or fiction? Paper Presented at the Seminars in Cell & Developmental Biology. Amsterdam: Elsevier (2013). doi: 10.1016/j.semcdb.2012.09.001
31. Sankaran S, Khot LR, Panigrahi S. Biology and applications of olfactory sensing system: A review. Sensors Actuat B Chem. (2012) 171:1–17. doi: 10.1016/j.snb.2012.03.029
32. Savic I. Imaging of brain activation by odorants in humans. Curr Opin Neurobiol. (2002) 12:455–61. doi: 10.1016/s0959-4388(02)00346-x
33. Olofsson JK. Time to smell: a cascade model of human olfactory perception based on response-time (RT) measurement. Front Psychol. (2014) 5:33. doi: 10.3389/fpsyg.2014.00033
34. Cowley MA, Smith RG, Diano S, Tschöp M, Pronchuk N, Grove KL, et al. The distribution and mechanism of action of ghrelin in the CNS demonstrates a novel hypothalamic circuit regulating energy homeostasis. Neuron. (2003) 37:649–61. doi: 10.1016/s0896-6273(03)00063-1
35. Russo C, Russo A, Pellitteri R, Stanzani S. Hippocampal Ghrelin-positive neurons directly project to arcuate hypothalamic and medial amygdaloid nuclei. Could they modulate food-intake? Neurosci Lett. (2017) 653:126–31. doi: 10.1016/j.neulet.2017.05.049
36. Sutton AK, Myers MG Jr., Olson DP. The role of PVH circuits in leptin action and energy balance. Annu Rev Physiol. (2016) 78:207–21. doi: 10.1146/annurev-physiol-021115-105347
37. Alvarez-Crespo M, Skibicka KP, Farkas I, Molnár CS, Egecioglu E, Hrabovszky E, et al. The amygdala as a neurobiological target for ghrelin in rats: neuroanatomical, electrophysiological and behavioral evidence. PLoS One. (2012) 7:e46321. doi: 10.1371/journal.pone.0046321
38. Shioda S, Funahashi H, Nakajo S, Yada T, Maruta O, Nakai Y. Immunohistochemical localization of leptin receptor in the rat brain. Neurosci Lett. (1998) 243:41–4. doi: 10.1016/s0304-3940(98)00082-2
39. Tong J, Mannea E, Aimé P, Pfluger PT, Yi C-X, Castaneda TR, et al. Ghrelin enhances olfactory sensitivity and exploratory sniffing in rodents and humans. J Neurosci. (2011) 31:5841–6. doi: 10.1523/JNEUROSCI.5680-10.2011
40. Zigman JM, Jones JE, Lee CE, Saper CB, Elmquist JK. Expression of ghrelin receptor mRNA in the rat and the mouse brain. J Comparat Neurol. (2006) 494:528–48. doi: 10.1002/cne.20823
41. Palouzier-Paulignan B, Lacroix M-C, Aimé P, Baly C, Caillol M, Congar P, et al. Olfaction under metabolic influences. Chem Senses. (2012) 37:769–97. doi: 10.1093/chemse/bjs059
42. Russo C, Russo A, Pellitteri R, Stanzani S. Ghrelin-containing neurons in the olfactory bulb send collateralized projections into medial amygdaloid and arcuate hypothalamic nuclei: neuroanatomical study. Exp Brain Res. (2018) 236:2223–9. doi: 10.1007/s00221-018-5298-z
43. Baly C, Aioun J, Badonnel K, Lacroix M-C, Durieux D, Schlegel C, et al. Leptin and its receptors are present in the rat olfactory mucosa and modulated by the nutritional status. Brain Res. (2007) 1129:130–41. doi: 10.1016/j.brainres.2006.10.030
44. Getchell TV, Kwong K, Saunders CP, Stromberg AJ, Getchell ML. Leptin regulates olfactory-mediated behavior in ob/ob mice. Physiol Behav. (2006) 87:848–56. doi: 10.1016/j.physbeh.2005.11.016
45. Sun C, Tang K, Wu J, Xu H, Zhang W, Cao T, et al. Leptin modulates olfactory discrimination and neural activity in the olfactory bulb. Acta Physiol. (2019) 227:e13319. doi: 10.1111/apha.13319
46. Badonnel K, Durieux D, Monnerie R, Grébert D, Salesse R, Caillol M, et al. Leptin-sensitive OBP-expressing mucous cells in rat olfactory epithelium: a novel target for olfaction-nutrition crosstalk? Cell Tissue Res. (2009) 338:53–66. doi: 10.1007/s00441-009-0846-2
47. Fernández-Aranda F, Agüera Z, Fernández-García JC, Garrido-Sanchez L, Alcaide-Torres J, Tinahones FJ, et al. Smell–taste dysfunctions in extreme weight/eating conditions: analysis of hormonal and psychological interactions. Endocrine. (2016) 51:256–67. doi: 10.1007/s12020-015-0684-9
48. Han JE, Frasnelli J, Zeighami Y, Larcher K, Boyle J, McConnell T, et al. Ghrelin enhances food odor conditioning in healthy humans: an fMRI study. Cell Rep. (2018) 25:2643–52. doi: 10.1016/j.celrep.2018.11.026
49. Trellakis S, Tagay S, Fischer C, Rydleuskaya A, Scherag A, Bruderek K, et al. Ghrelin, leptin and adiponectin as possible predictors of the hedonic value of odors. Regulat Peptides. (2011) 167:112–7. doi: 10.1016/j.regpep.2010.12.005
50. Uygun B, Kiyici S, Ozmen S, Gul Z, Sigirli D, Cavun S. The association between olfaction and taste functions with serum ghrelin and leptin levels in obese women. Metab Syndrome Related Disord. (2019) 17:452–7. doi: 10.1089/met.2019.0037
51. Julliard A, Chaput M, Apelbaum A, Aime P, Mahfouz M, Duchamp-Viret P. Changes in rat olfactory detection performance induced by orexin and leptin mimicking fasting and satiation. Behav Brain Res. (2007) 183:123–9. doi: 10.1016/j.bbr.2007.05.033
52. Badonnel K, Lacroix M-C, Durieux D, Monnerie R, Caillol M, Baly C. Rat strains with different metabolic statuses differ in food olfactory-driven behavior. Behav Brain Res. (2014) 270:228–39. doi: 10.1016/j.bbr.2014.05.011
53. Thanos PK, Robison LS, Robinson JK, Michaelides M, Wang GJ, Volkow ND. Obese rats with deficient leptin signaling exhibit heightened sensitivity to olfactory food cues. Synapse. (2013) 67:171–8. doi: 10.1002/syn.21627
54. Chelminski Y, Magnan C, Luquet SH, Everard A, Meunier N, Gurden H, et al. Odor-induced neuronal rhythms in the olfactory bulb are profoundly modified in ob/ob obese mice. Front Physiol. (2017) 8:2. doi: 10.3389/fphys.2017.00002
55. Prud’Homme M, Lacroix M, Badonnel K, Gougis S, Baly C, Salesse R, et al. Nutritional status modulates behavioural and olfactory bulb Fos responses to isoamyl acetate or food odour in rats: roles of orexins and leptin. Neuroscience. (2009) 162:1287–98. doi: 10.1016/j.neuroscience.2009.05.043
56. Savigner A, Duchamp-Viret P, Grosmaitre X, Chaput M, Garcia S, Ma M, et al. Modulation of spontaneous and odorant-evoked activity of rat olfactory sensory neurons by two anorectic peptides, insulin and leptin. J Neurophysiol. (2009) 101:2898–906. doi: 10.1152/jn.91169.2008
57. Poessel M, Breuer N, Joshi A, Pampel A, Villringer A, Hummel T, et al. Reduced olfactory bulb volume in obesity and its relation to metabolic health status. Front Hum Neurosci. (2020) 14:586998. doi: 10.3389/fnhum.2020.586998
58. Karlsson A, Lindroos A, Lissner L, Torgerson J, Carlsson B, Carlsson L, et al. Evidence for gender-specific associations between leptin and olfaction. JGSM. (2002) 5:25–32.
59. Fernandez-Garcia JC, Alcaide J, Santiago-Fernandez C, Roca-Rodriguez M, Aguera Z, Baños R, et al. An increase in visceral fat is associated with a decrease in the taste and olfactory capacity. PLoS One. (2017) 12:e0171204. doi: 10.1371/journal.pone.0171204
60. Ginieis R, Abeywickrema S, Oey I, Franz EA, Perry T, Keast RSJ, et al. The role of an individual’s olfactory discriminability in influencing snacking and habitual energy intake. Appetite. (2021) 167:105646. doi: 10.1016/j.appet.2021.105646
61. Sorokowski P, Karwowski M, Misiak M, Marczak MK, Dziekan M, Hummel T, et al. Sex differences in human olfaction: a meta-analysis. Front Psychol. (2019) 10:242. doi: 10.3389/fpsyg.2019.00242
63. Jaeger SR, McRae JF, Bava CM, Beresford MK, Hunter D, Jia Y, et al. A Mendelian trait for olfactory sensitivity affects odor experience and food selection. Curr Biol. (2013) 23:1601–5. doi: 10.1016/j.cub.2013.07.030
64. Parnell W, Wilson N, Thomson C, Mackay S, Stefanogiannis N. A focus on nutrition: key findings of the 2008/09 New Zealand Adult Nutrition Survey. Wellington, NZ: Ministry of Health (2011).
65. Fazzalari F. Compilation of Odor and Taste Threshold Values Data. West Conshohocken, PA: ASTM data series (USA) (1978).
66. Pittet AO, Rittersbacher P, Muralidhara R. Flavor properties of compounds related to maltol and isomaltol. J Agricult Food Chem. (1970) 18:929–33. doi: 10.1021/jf60171a044
67. Bartoshuk LM, Duffy VB, Fast K, Green BG, Prutkin J, Snyder DJ. Labeled scales (eg, category, Likert, VAS) and invalid across-group comparisons: what we have learned from genetic variation in taste. Food Qual Prefer. (2003) 14:125–38. doi: 10.1016/s0950-3293(02)00077-0
68. Kalva JJ, Sims CA, Puentes LA, Snyder DJ, Bartoshuk LM. Comparison of the hedonic general labeled magnitude scale with the hedonic 9-point scale. J Food Sci. (2014) 79:S238–45. doi: 10.1111/1750-3841.12342
69. Green BG, Dalton P, Cowart B, Shaffer G, Rankin K, Higgins J. Evaluating the ‘Labeled Magnitude Scale’for measuring sensations of taste and smell. Chem Senses. (1996) 21:323–34. doi: 10.1093/chemse/21.3.323
70. Macmillan NA, Creelman CD. Detection Theory: A User’s Guide. East Sussex: Psychology press (2004).
71. Macmillan NA, Kaplan HL. Detection theory analysis of group data: estimating sensitivity from average hit and false-alarm rates. Psychol Bull. (1985) 98:185.
72. Akoglu H. User’s guide to correlation coefficients. Turk J Emerg Med. (2018) 18:91–3. doi: 10.1016/j.tjem.2018.08.001
73. Hamed EA, Zakary MM, Ahmed NS, Gamal RM. Circulating leptin and insulin in obese patients with and without type 2 diabetes mellitus: relation to ghrelin and oxidative stress. Diab Res Clin Pract. (2011) 94:434–41. doi: 10.1016/j.diabres.2011.08.023
74. Lönnqvist F, Wennlund A, Arner P. Relationship between circulating leptin and peripheral fat distribution in obese subjects. Int J Obes. (1997) 21:255–60. doi: 10.1038/sj.ijo.0800394
75. Webb J, Bolhuis DP, Cicerale S, Hayes JE, Keast R. The relationships between common measurements of taste function. Chemosens Percept. (2015) 8:11–8. doi: 10.1007/s12078-015-9183-x
76. Anderson AK, Christoff K, Stappen I, Panitz D, Ghahremani D, Glover G, et al. Dissociated neural representations of intensity and valence in human olfaction. Nat Neurosci. (2003) 6:196–202. doi: 10.1038/nn1001
77. Peng M, Coutts D, Wang T, Cakmak YO. Systematic review of olfactory shifts related to obesity. Obes Rev. (2019) 20:325–38. doi: 10.1111/obr.12800
78. Müller TD, Nogueiras R, Andermann ML, Andrews ZB, Anker SD, Argente J, et al. Ghrelin. Mol Metabol. (2015) 4:437–60.
79. Goldstone AP, Prechtl CG, Scholtz S, Miras AD, Chhina N, Durighel G, et al. Ghrelin mimics fasting to enhance human hedonic, orbitofrontal cortex, and hippocampal responses to food. Am J Clin Nutrit. (2014) 99:1319–30. doi: 10.3945/ajcn.113.075291
80. Schüssler P, Kluge M, Yassouridis A, Dresler M, Uhr M, Steiger A. Ghrelin levels increase after pictures showing food. Obesity. (2012) 20:1212–7. doi: 10.1038/oby.2011.385
81. Van der Plasse G, Merkestein M, Luijendijk M, Van Der Roest M, Westenberg H, Mulder A, et al. Food cues and ghrelin recruit the same neuronal circuitry. Int J Obes. (2013) 37:1012–9. doi: 10.1038/ijo.2012.174
82. Perello M, Cabral A, Cornejo MP, De Francesco PN, Fernandez G, Uriarte M. Brain accessibility delineates the central effects of circulating ghrelin. J Neuroendocrinol. (2019) 31:e12677. doi: 10.1111/jne.12677
83. Diano S, Farr SA, Benoit SC, McNay EC, da Silva I, Horvath B, et al. Ghrelin controls hippocampal spine synapse density and memory performance. Nat Neurosci. (2006) 9:381–8. doi: 10.1038/nn1656
84. Riera CE, Tsaousidou E, Halloran J, Follett P, Hahn O, Pereira MM, et al. The sense of smell impacts metabolic health and obesity. Cell Metabol. (2017) 26:198–211. doi: 10.1016/j.cmet.2017.06.015
85. Abdalla MMI. Ghrelin–physiological functions and regulation. Eur Endocrinol. (2015) 11:90. doi: 10.17925/EE.2015.11.02.90
86. Blatnik M, Soderstrom CI. A practical guide for the stabilization of acylghrelin in human blood collections. Clin Endocrinol. (2011) 74:325–31. doi: 10.1111/j.1365-2265.2010.03916.x
Keywords: ghrelin, leptin, obesity, olfaction, food odour
Citation: Ginieis R, Abeywickrema S, Oey I and Peng M (2022) Testing Links of Food-Related Olfactory Perception to Peripheral Ghrelin and Leptin Concentrations. Front. Nutr. 9:888608. doi: 10.3389/fnut.2022.888608
Received: 03 March 2022; Accepted: 19 April 2022;
Published: 11 May 2022.
Edited by:
Ellen E. Blaak, Maastricht University, NetherlandsReviewed by:
Hirac Gurden, Université de Paris, FranceMario Perello, Consejo Nacional de Investigaciones Científicas y Técnicas (CONICET), Argentina
Maedeh Ghasemi, Isfahan University of Medical Sciences, Iran
Copyright © 2022 Ginieis, Abeywickrema, Oey and Peng. This is an open-access article distributed under the terms of the Creative Commons Attribution License (CC BY). The use, distribution or reproduction in other forums is permitted, provided the original author(s) and the copyright owner(s) are credited and that the original publication in this journal is cited, in accordance with accepted academic practice. No use, distribution or reproduction is permitted which does not comply with these terms.
*Correspondence: Mei Peng, mei.peng@otago.ac.nz