Article

Land Suitability Analysis for Potato Crop in the Jucusbamba and Tincas Microwatersheds (Amazonas, NW Peru): AHP and RS–GIS Approach

by
Daniel Iliquín Trigoso
1,*,
Rolando Salas López
1,*,
Nilton B. Rojas Briceño
1,
Jhonsy O. Silva López
1,
Darwin Gómez Fernández
1,
Manuel Oliva
1,
Lenin Quiñones Huatangari
2,
Renzo E. Terrones Murga
1,
Elgar Barboza Castillo
1 and
Miguel Ángel Barrena Gurbillón
1
1
Instituto de Investigación para el Desarrollo Sustentable de Ceja de Selva (INDES-CES) de la Universidad Nacional Toribio Rodríguez de Mendoza de Amazonas (UNTRM), Chachapoyas 01001, Peru
2
Instituto de Ciencia de Datos, Universidad Nacional de Jaén, Jaén 06801, Peru
*
Authors to whom correspondence should be addressed.
Agronomy 2020, 10(12), 1898; https://doi.org/10.3390/agronomy10121898
Submission received: 27 October 2020 / Revised: 28 November 2020 / Accepted: 29 November 2020 / Published: 1 December 2020

Abstract

:
Agricultural productivity in the Peruvian region of Amazonas is being jeopardized by conflicts and inadequate land use, that are ultimately contributing to environmental degradation. Therefore, our aim is to assess land suitability for potato (Solanum tuberosum L.) farming in the Jucusbamba and Tincas microwatersheds located in Amazonas, in order to improve land-use planning and enhance the crop productivity of small-scale farmers. The site selection methodology involved a pair-wise comparison matrix (PCM) and a weighted multicriteria analysis using the Analytical Hierarchy Process (AHP) on selected biophysical and socioeconomical drivers. Simultaneously, land cover mapping was conducted using field samples, remote sensing (RS), geostatistics and geographic information systems (GIS). The results indicated that for potato crop farming, the most important criteria are climatological (30.14%), edaphological (29.16%), topographical (25.72%) and socioeconomical (14.98%) in nature. The final output map indicated that 8.2% (22.91 km2) was highly suitable, 68.5% (190.37 km2) was moderately suitable, 21.6% (60.11 km2) was marginally suitable and 0.0% was not suitable for potato farming. Built-up areas (archaeological sites, urban and road networks) and bodies of water were discarded from this study (4.64 km2). This study intends to promote and guide sustainable agriculture through agricultural land planning.

1. Introduction

Potatoes (Solanum tuberosum L.) are a vital source of carbohydrates, proteins, vitamins and minerals, thus holding a fundamental role in the food chain [1]. In 2018, potato cultivation areas in China occupied approximately 5 million hectares, representing more than 20% of the world’s total potato farming area and making China the world’s top potato producer [2,3]. Peru, is the main potato producer within Latin America, and it is home to the largest diversity of potato varieties (about 3000 of the 4000 existing varieties) [4]. Moreover, the gross value of production (GVP) of potatoes represented 10.6% and 15% of the Peruvian gross value of agricultural production in 2016 and 2017, respectively, making it the second most important crop after rice [5].
However, global agriculture is struggling between the need to increase agricultural production and growing environmental concerns [6]. In addition, factors such as population growth, climate change, production technology difficulties, overexploitation of soil and supply problems complicate the ability to predict future potato production [7]. Another problem of Peruvian agricultural activity is deficient planning of potential territories for specific crops, which causes disturbances in the ecosystem, such as annual deforestation to install new plots or the overexploitation of territories which are not suitable for cultivation [8,9]. Therefore, agricultural production strategies and land suitability analyses that take into account climatological [5], topographical, geological and edaphological conditions [10,11] are necessary. Tools such as Remote Sensing (RS), Geographic Information Systems (GIS) and multicriteria analysis (MCA) techniques can be used to identify and prioritize suitable land for agriculture [10,12].
The MCA method used to determine the general suitability of land in Peru is the Classification of Lands by their Capacity of Greater Use (CTCUM) [13]. CTCUM is conditioned by the superposition of criteria of climate (Holdrige life zones [14]), geomorphology (terrain slope) and soil (edaphic criteria of a soil survey [15]). Lands are classified as being suitable for clean/intensive crops, permanent crops, pastures, silviculture, and protection/conservation [13]. However, CTCUM has been applied only in 15/25 Peruvian regions (as part of the Ecological and Economic Zoning–ZEE) and other small districts and watersheds [16]. Another method that will contribute to the CTCUM is Agroecological Zoning (ZAE), whose methodological guide is currently in the process of being approved by the Ministry of Agriculture (MINAGRI). ZAE is also an EMC method that originated with FAO [17] to determine the suitability of land for specific crops. However, like CTCUM, ZAE does not consider the relative importance of the MCA criteria, the incorporation of which is important to improve the EMC. In this context, the analytical hierarchy process (AHP) is the most widely used; it consists of estimating the importance of each criterion using expert opinions. The AHP technique, used to resolve hierarchically structured decision making problems at different levels, seeks to estimate the relative weight of criteria [18,19]. AHP integrated with GIS allows the use of multilevel hierarchies comprising different criteria and restrictions, and is one of the most promising methods for land suitability analysis [10]. Likewise, AHP coupled with RS-GIS has been used in numerous studies worldwide for land suitability analyses for potato farming [20,21,22,23], other crops [11,12,24,25,26,27,28,29,30,31,32] and agriculture in general [7,10,33,34,35]. In Peru, with this method, only two previous studies have reported suitable land analyses for specific crops: for Malus domestica Borkh. in the Mala Valley, Lima Region [36] and for Coffea arabica L. in the Amazonas Region [8].
This study analyzes land suitability for potato (Solanum tuberosum) cultivation in the Jucusbamba and Tincas microwatersheds (Amazonas, NW Peru), using the AHP and RS–GIS approach, aiming to improve land-use planning in the microwatershed area and enhance the crop productivity of small-scale farmers. In sum, (i) climatological, topographical, socioeconomical and edaphological criteria were mapped and weighed, and (ii) through the use of weighted overlay techniques, suitable potato cultivation areas were identified. Our study hypothesized that the area modelled as "highly suitable" for potato cultivation would be greater than the current agricultural area being used for this purpose. This study is intended to provide an instrument in the decision-making process of land-use planning, as well as to promote and guide sustainable agriculture.

2. Materials and Methods
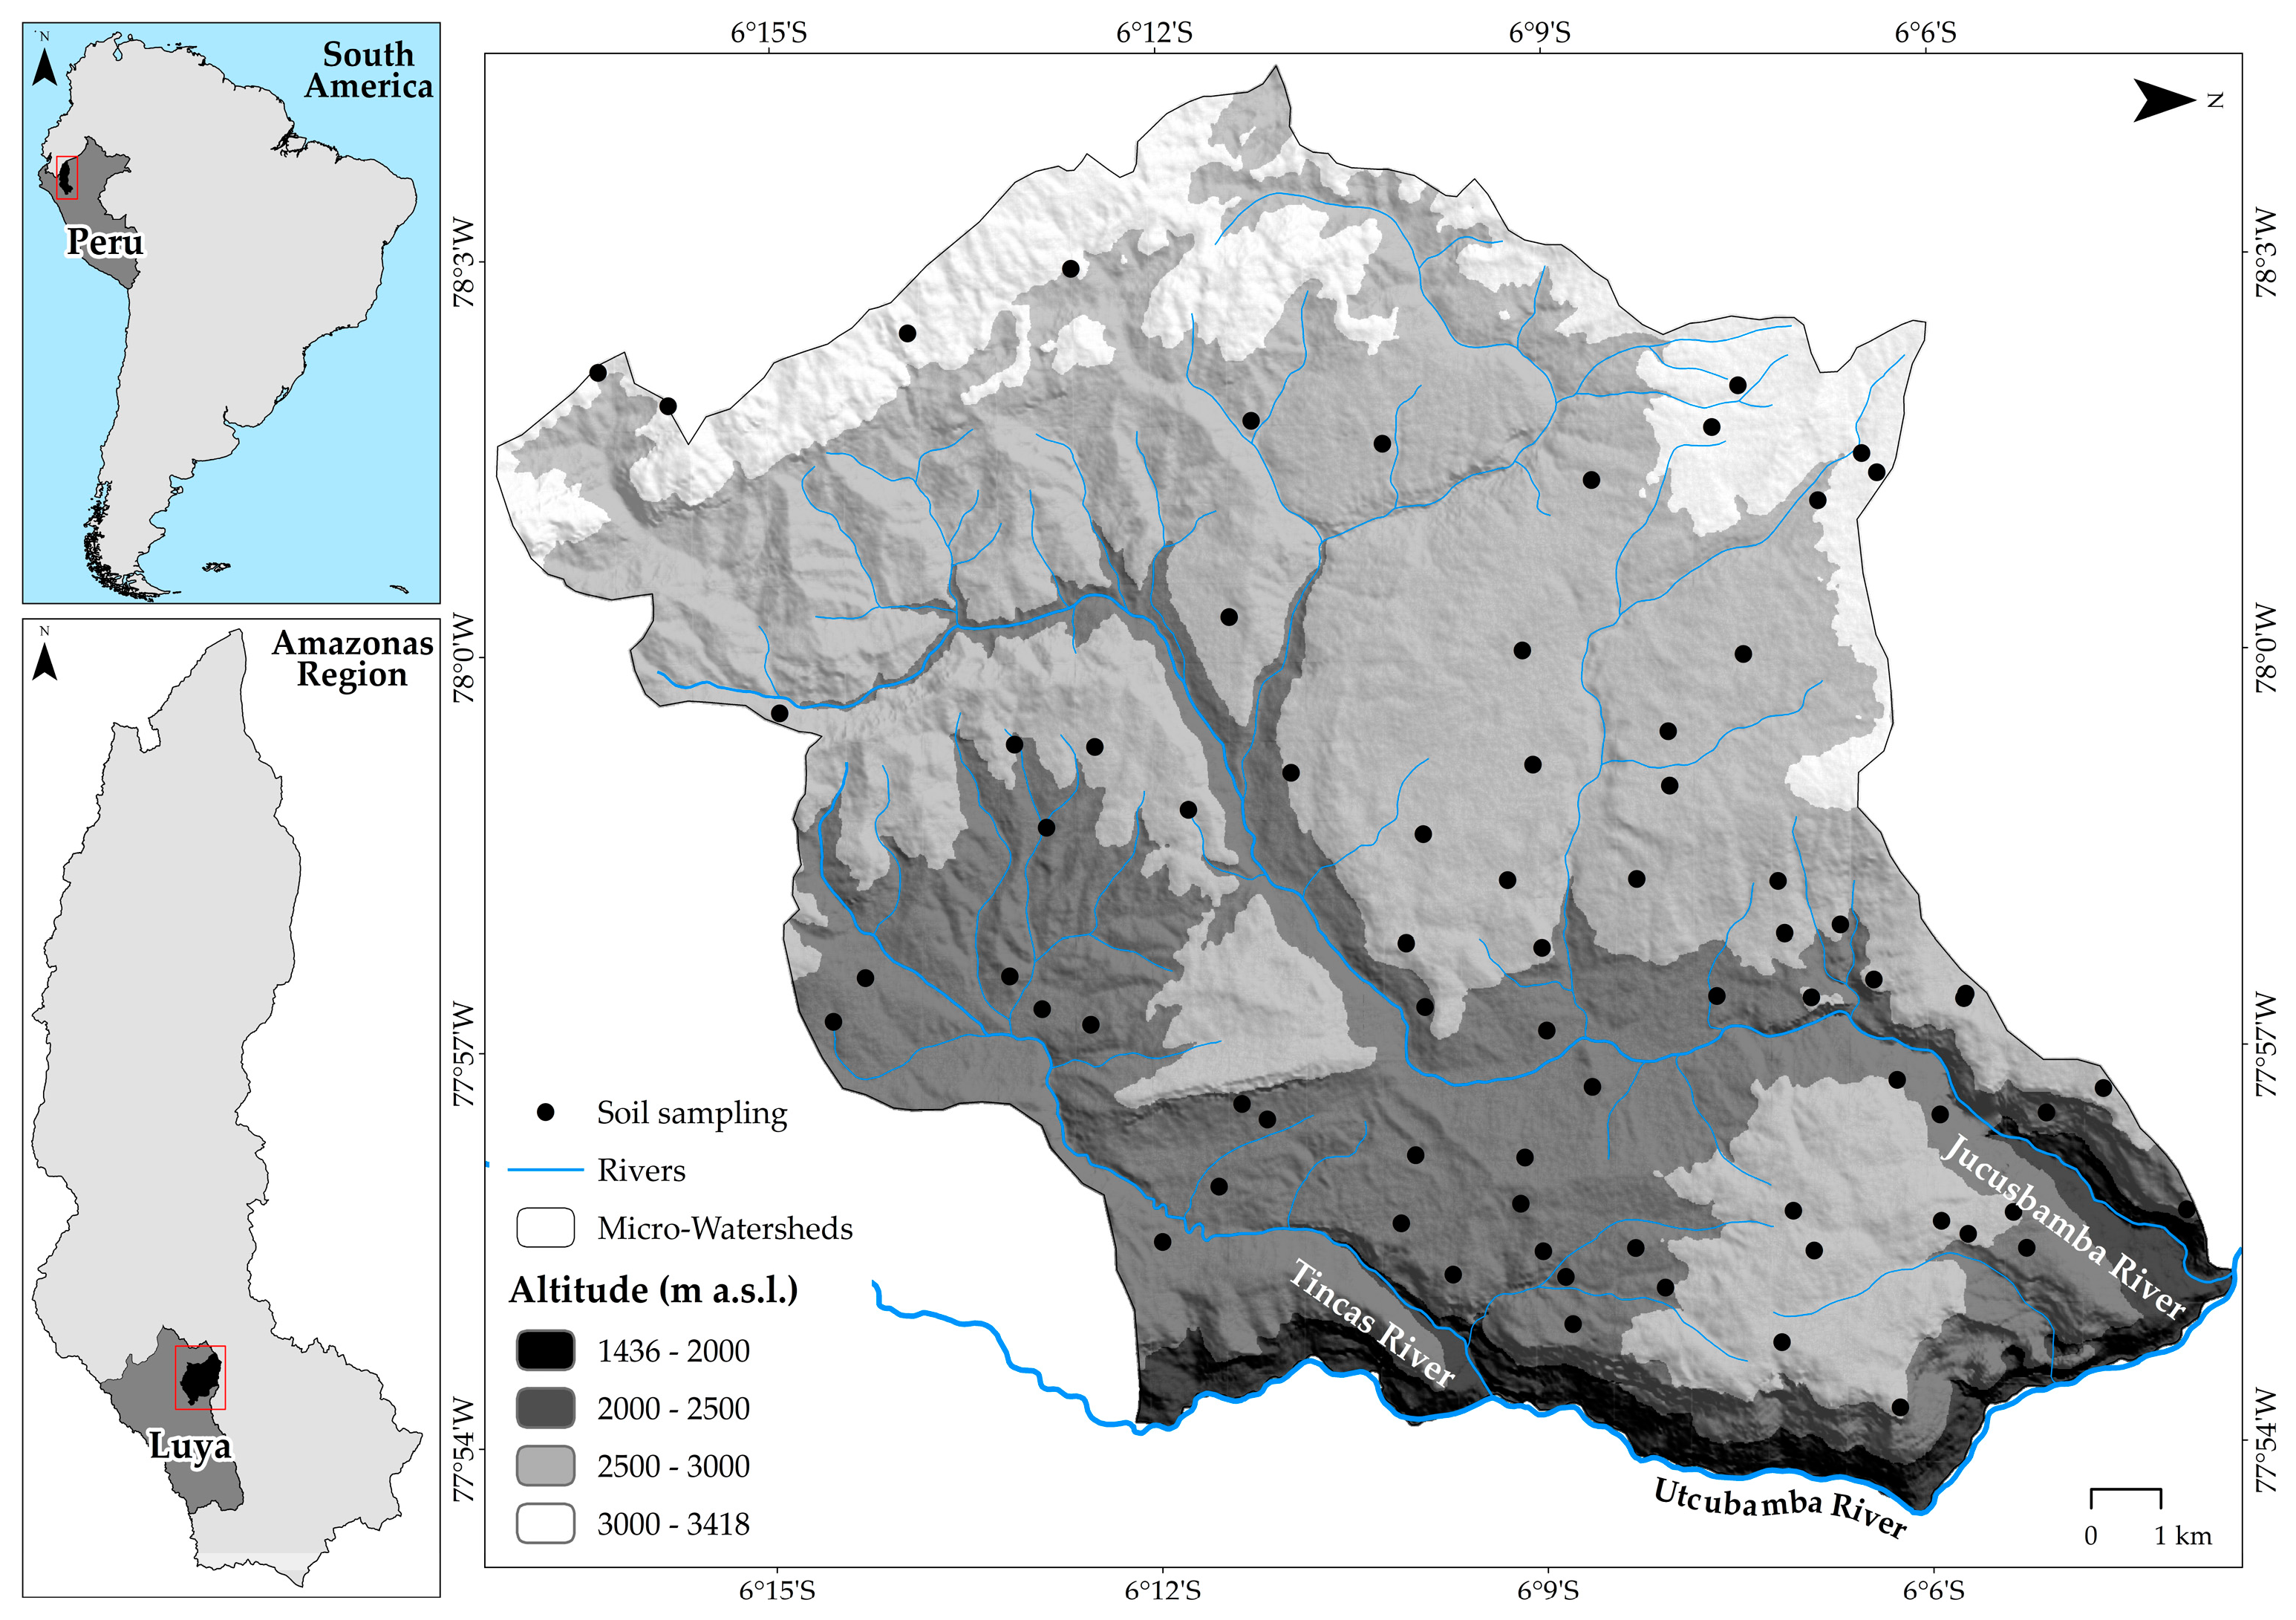
2.1. Study Area

This study was carried out in two microwatersheds (6°03′–6°17′ S, 78°04′–77°54′ W) that included the territories of the districts of Inguilpata, Lonya Chico, Trita, Luya, Lámud and San Cristóbal, located in the province of Luya (Amazonas Region, NW Peru), at an altitudinal gradient of 1435–3433 m a.s.l (Figure 1). Luya has a population of 3579 inhabitants and an economy based on livestock, commerce and small scale agriculture [37] that primarily produces coffee (84.90 km2), potatoes (18.45 km2), corn, legumes, wheat and barley [38]. Within Luya, the Jucusbamba and Tincas microwatersheds cover approximately 278.03 km2 and are the most representative potato-producing areas. However, due to the lack of spatial planning for agricultural activities, the area is threatened by deforestation, land use conflicts and soil degradation, jeopardizing productivity [9,39]. According to the CTCUM, the microwatersheds possess land suitable mainly for pastures (147.97 km2), permanent crops (51.95 km2), silviculture (49.16 km2), protection/conservation (24.81 km2) and clean/intensive crops (2.88 km2) [40]. Additionally, the study area has three microclimates (humid temperate cold, warm temperate slightly humid and warm temperate humid in the upper, middle and lower parts of the basin, respectively) [41], with mean annual temperature and rainfall of 15 °C and 1015 mm, respectively [42].

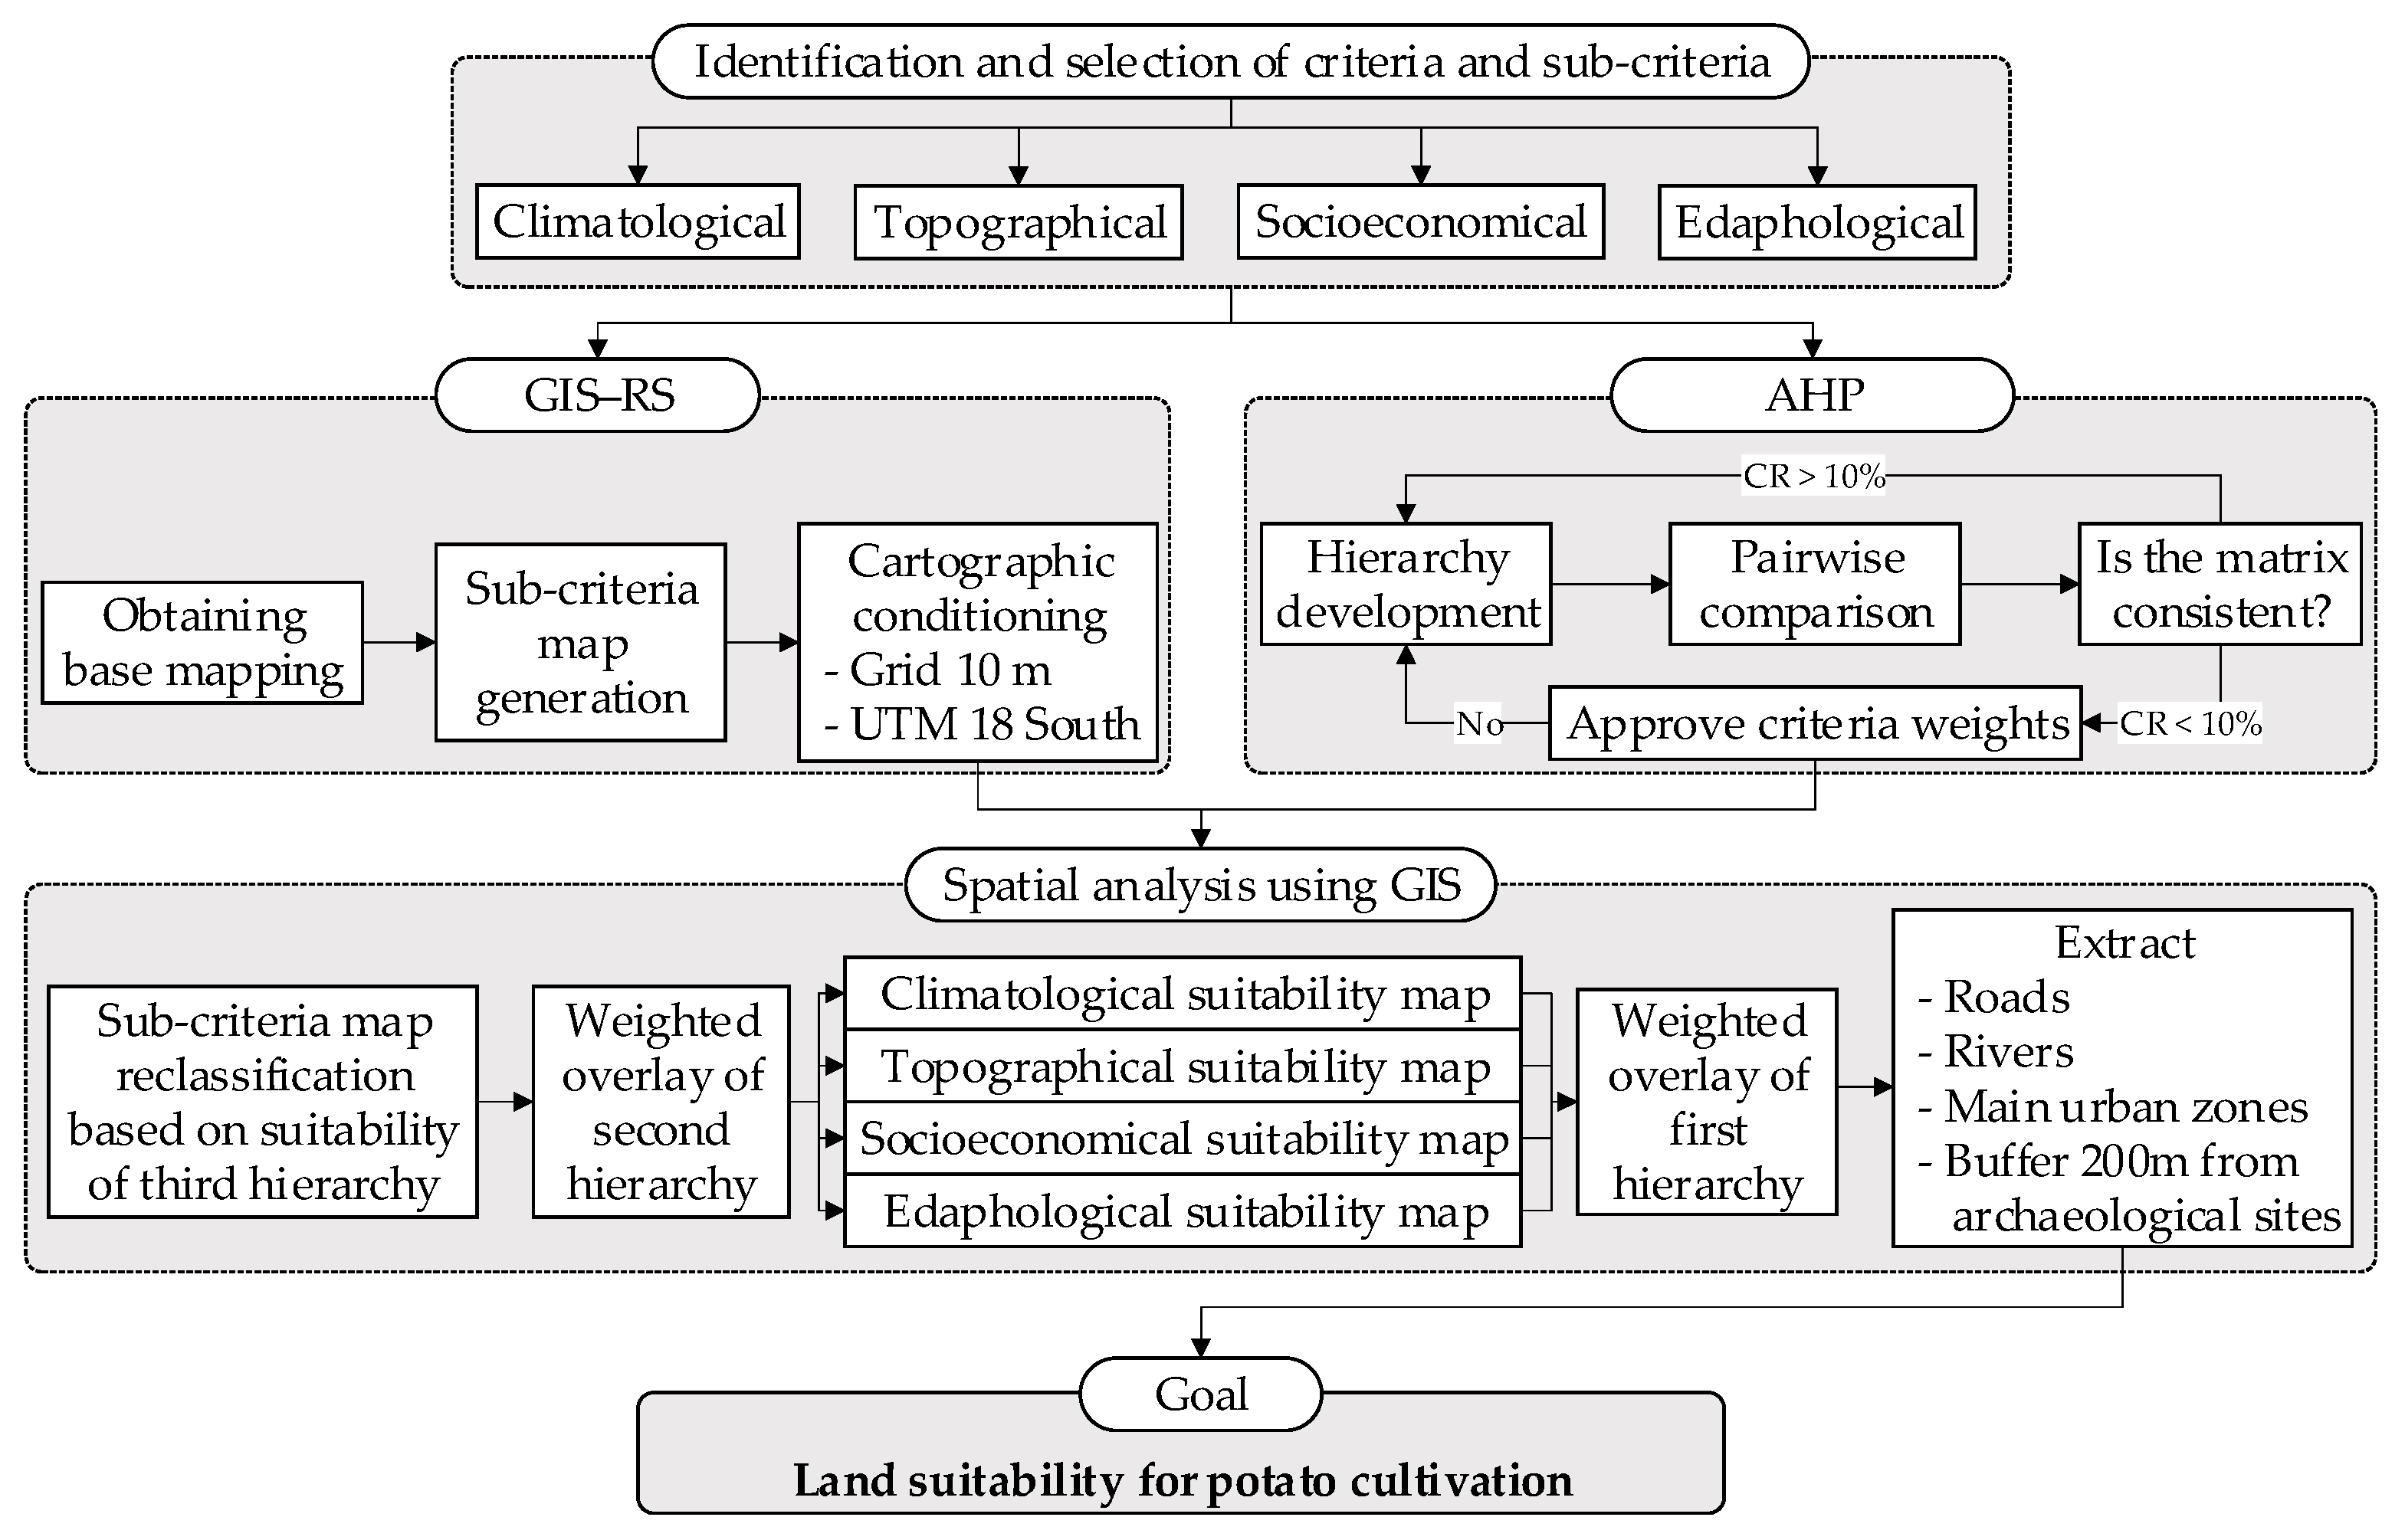
2.2. Methodology Framework

Figure 2 shows the applied research framework for land suitability analyses with respect to potato (S. tuberosum) cultivation using a AHP and RS-GIS approach in the Jucusbamba and Tincas microwatersheds. To summarize, (i) criteria that could determine potato growth and production were identified and selected; (ii) these criteria were mapped using field and RS data in a GIS environment; and (iii) the criteria were compared to determine their degree of importance using AHP. Then, using GIS, maps were integrated and reclassified according to suitability thresholds using weighted overlay.

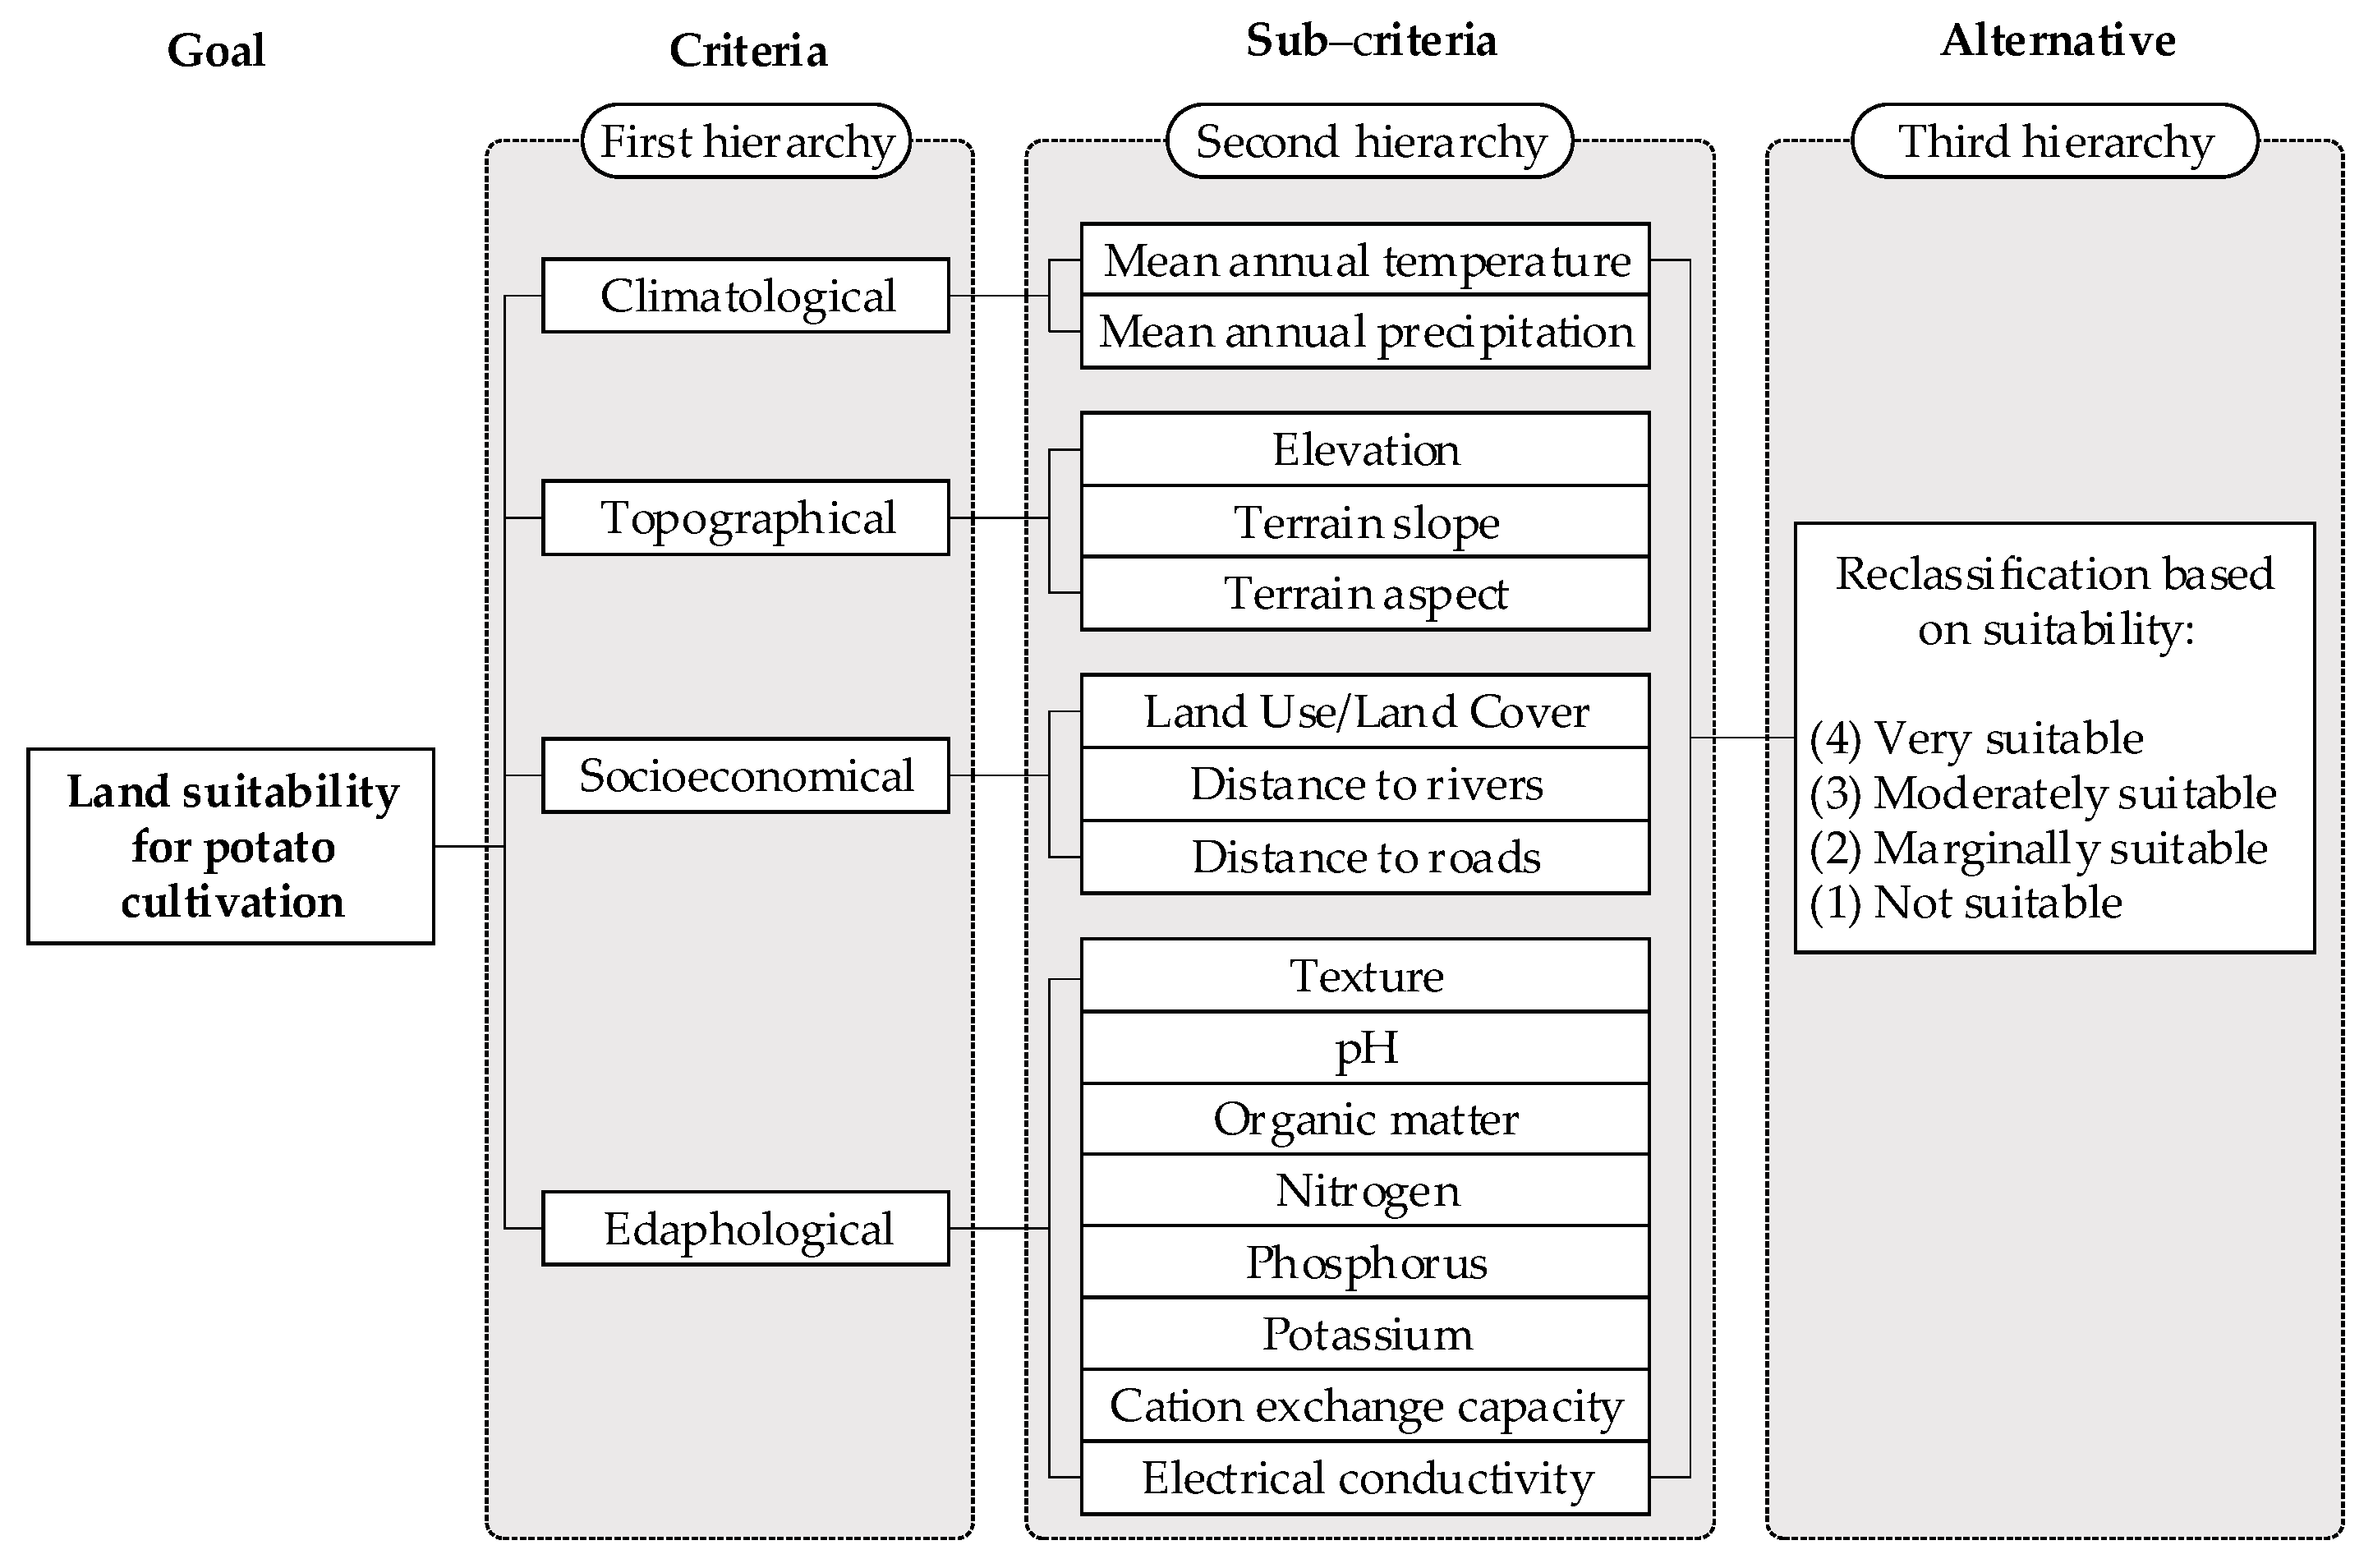
2.3. Identification of Criteria and Subcriteria

The identification process of suitable land for potato cultivation is based on favourable criteria with regard to crop growth and production. Criteria selection was carried out using technical manuals [43,44,45] and crop suitability analysis articles [20,21,46,47]. Subsequently, a hierarchy composed of four main criteria (climatological, edaphological, topographical and socioeconomical) and sixteen subcriteria was made, based on the accessibility and relevance of the data within the biophysical and socioeconomic conditions of the study area (Figure 3).

2.4. Datasets Sources and Processing

Temperature and precipitation layers were obtained from the WorldClim 2.0 database, which contains the average monthly climate data from 1970 to 2000 with a spatial resolution of 30 s (about 1 km2) [42]. Elevation, slope and aspect terrain layers were generated from the Digital Elevation Model (DEM, ALOS PALSAR, 12.5 m), downloaded from the Distributed Active Archive Center (DAAC) from the Alaska Satellite Facility (ASF) [48].
Land Use/Land Cover (LULC) layers were obtained using a Sentinel 2A image (Path/Row: 17MRP; 20 June 2020; Bands: 2–8A, 11–12), acquired from the Copernicus Services Data Hub platform operated by the European Spatial Agency (ESA). Image preprocessing (i.e., atmospheric correction and resampling at 10 m) was executed using the Sentinel Application Platform (SNAP). Afterwards, digital processing was done in ENVI 5.3, following the methodology established by Murillo and Ortiz [49] and CORINE Land Cover adapted for Perú [50]. Hence, LULC were organized into five classes: urban area, grasslands, pastures and crops, bodies of water and forests. To assess the thematic accuracy, a 195–point confusion matrix indicated a general precision of 97% and a Kappa coefficient of 0.96.
The road network of the Ministry of Transport and Communications (MTC) was used as a reference for road distribution [51]. This vectoral layer was updated through field explorations. Furthermore, distance to roads and rivers was calculated using the Euclidean distance tool. The base layer of the rivers was obtained from the national charts 13 g and 13 h, downloaded from the Ministry of Education (MINEDU) geoportal [52].
Edaphological layers were generated from data obtained by collecting 72 soil samples at a depth of 30 cm throughout the study area (Figure 1). These 72 samples were calculated and distributed in accordance with the regulations of the MINAGRI [15], based on spatial data on physiography, life zones, geology and geomorphology obtained from the ZEE–A [53]. Such samples were analysed at the Water and Soil Research Laboratory (LABISAG) of the Research Institute for Sustainable Development of Ceja de Selva (INDES-CES), that belongs to the Toribio Rodriguez de Mendoza National University (UNTRM). The physical (sand, silt and clay content) and chemical (pH, Soil Organic Matter—SOM, Nitrogen—N, Phosphorus—P, Potassium—K, Electrical Conductivity—EC, and Cation Exchange Capacity—CEC) properties of the soil were analyzed. Subsequently, all physical chemical properties were interpolated using the Ordinary Kriging (OK) method (in ArcGIS 10.5) based on five semivariogram models (Spherical, Circular, Gaussian, Linear and Exponential) [21,24,25,27,32]. In order to determine the most suitable semivariogram for each property, the coefficient of determination (R2), mean bias error (MBE), mean absolute bias error (MABE), root-mean-square error (RMSE) and the Student’s t-distribution were used (see formulas in Quiñones et al. [54]). For this purpose, of the 72 samples, 14 (20%) were chosen for the validation stage due to their homogenous distribution. In case any property did not result in an acceptable performing model (see statistical interpretation in Quiñones et al. [54]), layers (250 m; average depths 0–5, 5–10 and 10–15 cm) from the SoilGrids global digital soil mapping system were considered [55]. Additionally, according to the classification given by the United States Department of Agriculture (USDA), soil texture data were generated by using sand, silt and clay content layers along with the QGIS raster calculator [56].

2.5. Standardization of Subcriteria Layers through Suitability Thresholds

In order to execute weighted overlay, the units of the subcriteria were standardized using the raster reclassification of their maps. [57]. For this purpose, each continuous map (subcriterion) was divided according to land suitability level [17,58]. The five levels which are most commonly used in this process are taken from “A Framework For Land Evaluation” [59], and are as follows: “highly suitable“ (territory with minor limitations for agricultural use that do not affect productivity or significantly increase expenses), “moderately suitable“ (territory with moderate limitations that reduce productivity or imply slight risks of soil degradation), “marginally suitable“ (territory with severe limitations that reduce productivity or increase expenses that will only be marginally justified), “currently unsuitable“ (territory whose limitations can be eliminated with technical means or costs, although these modifications are currently unthinkable) and “permanently unsuitable“ (territory with serious limitations that are supposed to be insurmountable in the long term). However, in this study, as in many other studies [8,16], the last two levels (N1 and N2) were combined and four levels of land suitability for potato cultivation were determined (1–4), with 1 being “not suitable” and 4 “highly suitable” [60]. Climatological, topographical, socioeconomical and edaphological criteria were standardized according to suitability thresholds reported in previous studies (Table 1) [33,44,46]. Lastly, standardized thematic maps for each subcriterion are shown in Figure 4.

2.6. Analytical Hierarchy Process (AHP)

The AHP is an accurate approach for quantifying the importance weight for each criterion and subcriterion; the sum of the importance weight of each hierarchy group (Figure 3) is equal to 1 [12]. Relative importance was estimated using pairwise comparison matrices (PCM) [31,66], completed by a group of experts based on Saaty’s nine-point ratio scale [19] (Table 2). This group of experts was made up of researchers in potato cultivation from the UNTRM and the National Institute for Agrarian Innovation (INIA).
Although experts’ opinions are highly valued, their subjective preferences may lead to inconsistencies [67,68]. Therefore, a consistency ratio (CR) must be calculated (Consistency Index (CI) / Random Index (RI) of the matrix) in order to establish a maximum inconsistency value. RI is calculated for different “n” values (number of factors in the matrix) from a simulation of 100,000 matrixes (Table 3) [69]. Also, CI serves as a measure of logical inconsistency against expert judgment during peer-to-peer comparisons [70]. For this purpose, the matrix with the highest value (λmax) is greater than or equal to the number of rows and columns (n) (Equation (1)) [34]. Moreover, CR must be <0.1 (less than 10% inconsistency) to be acceptable. Matrices with two subcriteria are automatically assumed to be consistent and acceptable [68]. This was the case for the climatological matrix.
CI = (λmaxn)/(n − 1),

2.7. Weighted Overlay of Thematic Maps

A weighted overlay analysis using QGIS was carried out with standardized thematic maps (GRIDi) and weight importance (WEIGHTi) for each subcriterion i. Each raster-based layer (Figure 4) was integrated using Equation (2) [68] to generate final output land suitability maps for potato cultivation (GRIDresult).
GRIDresult = Σ [(GRIDi) (WEIGHTi)]

3. Results

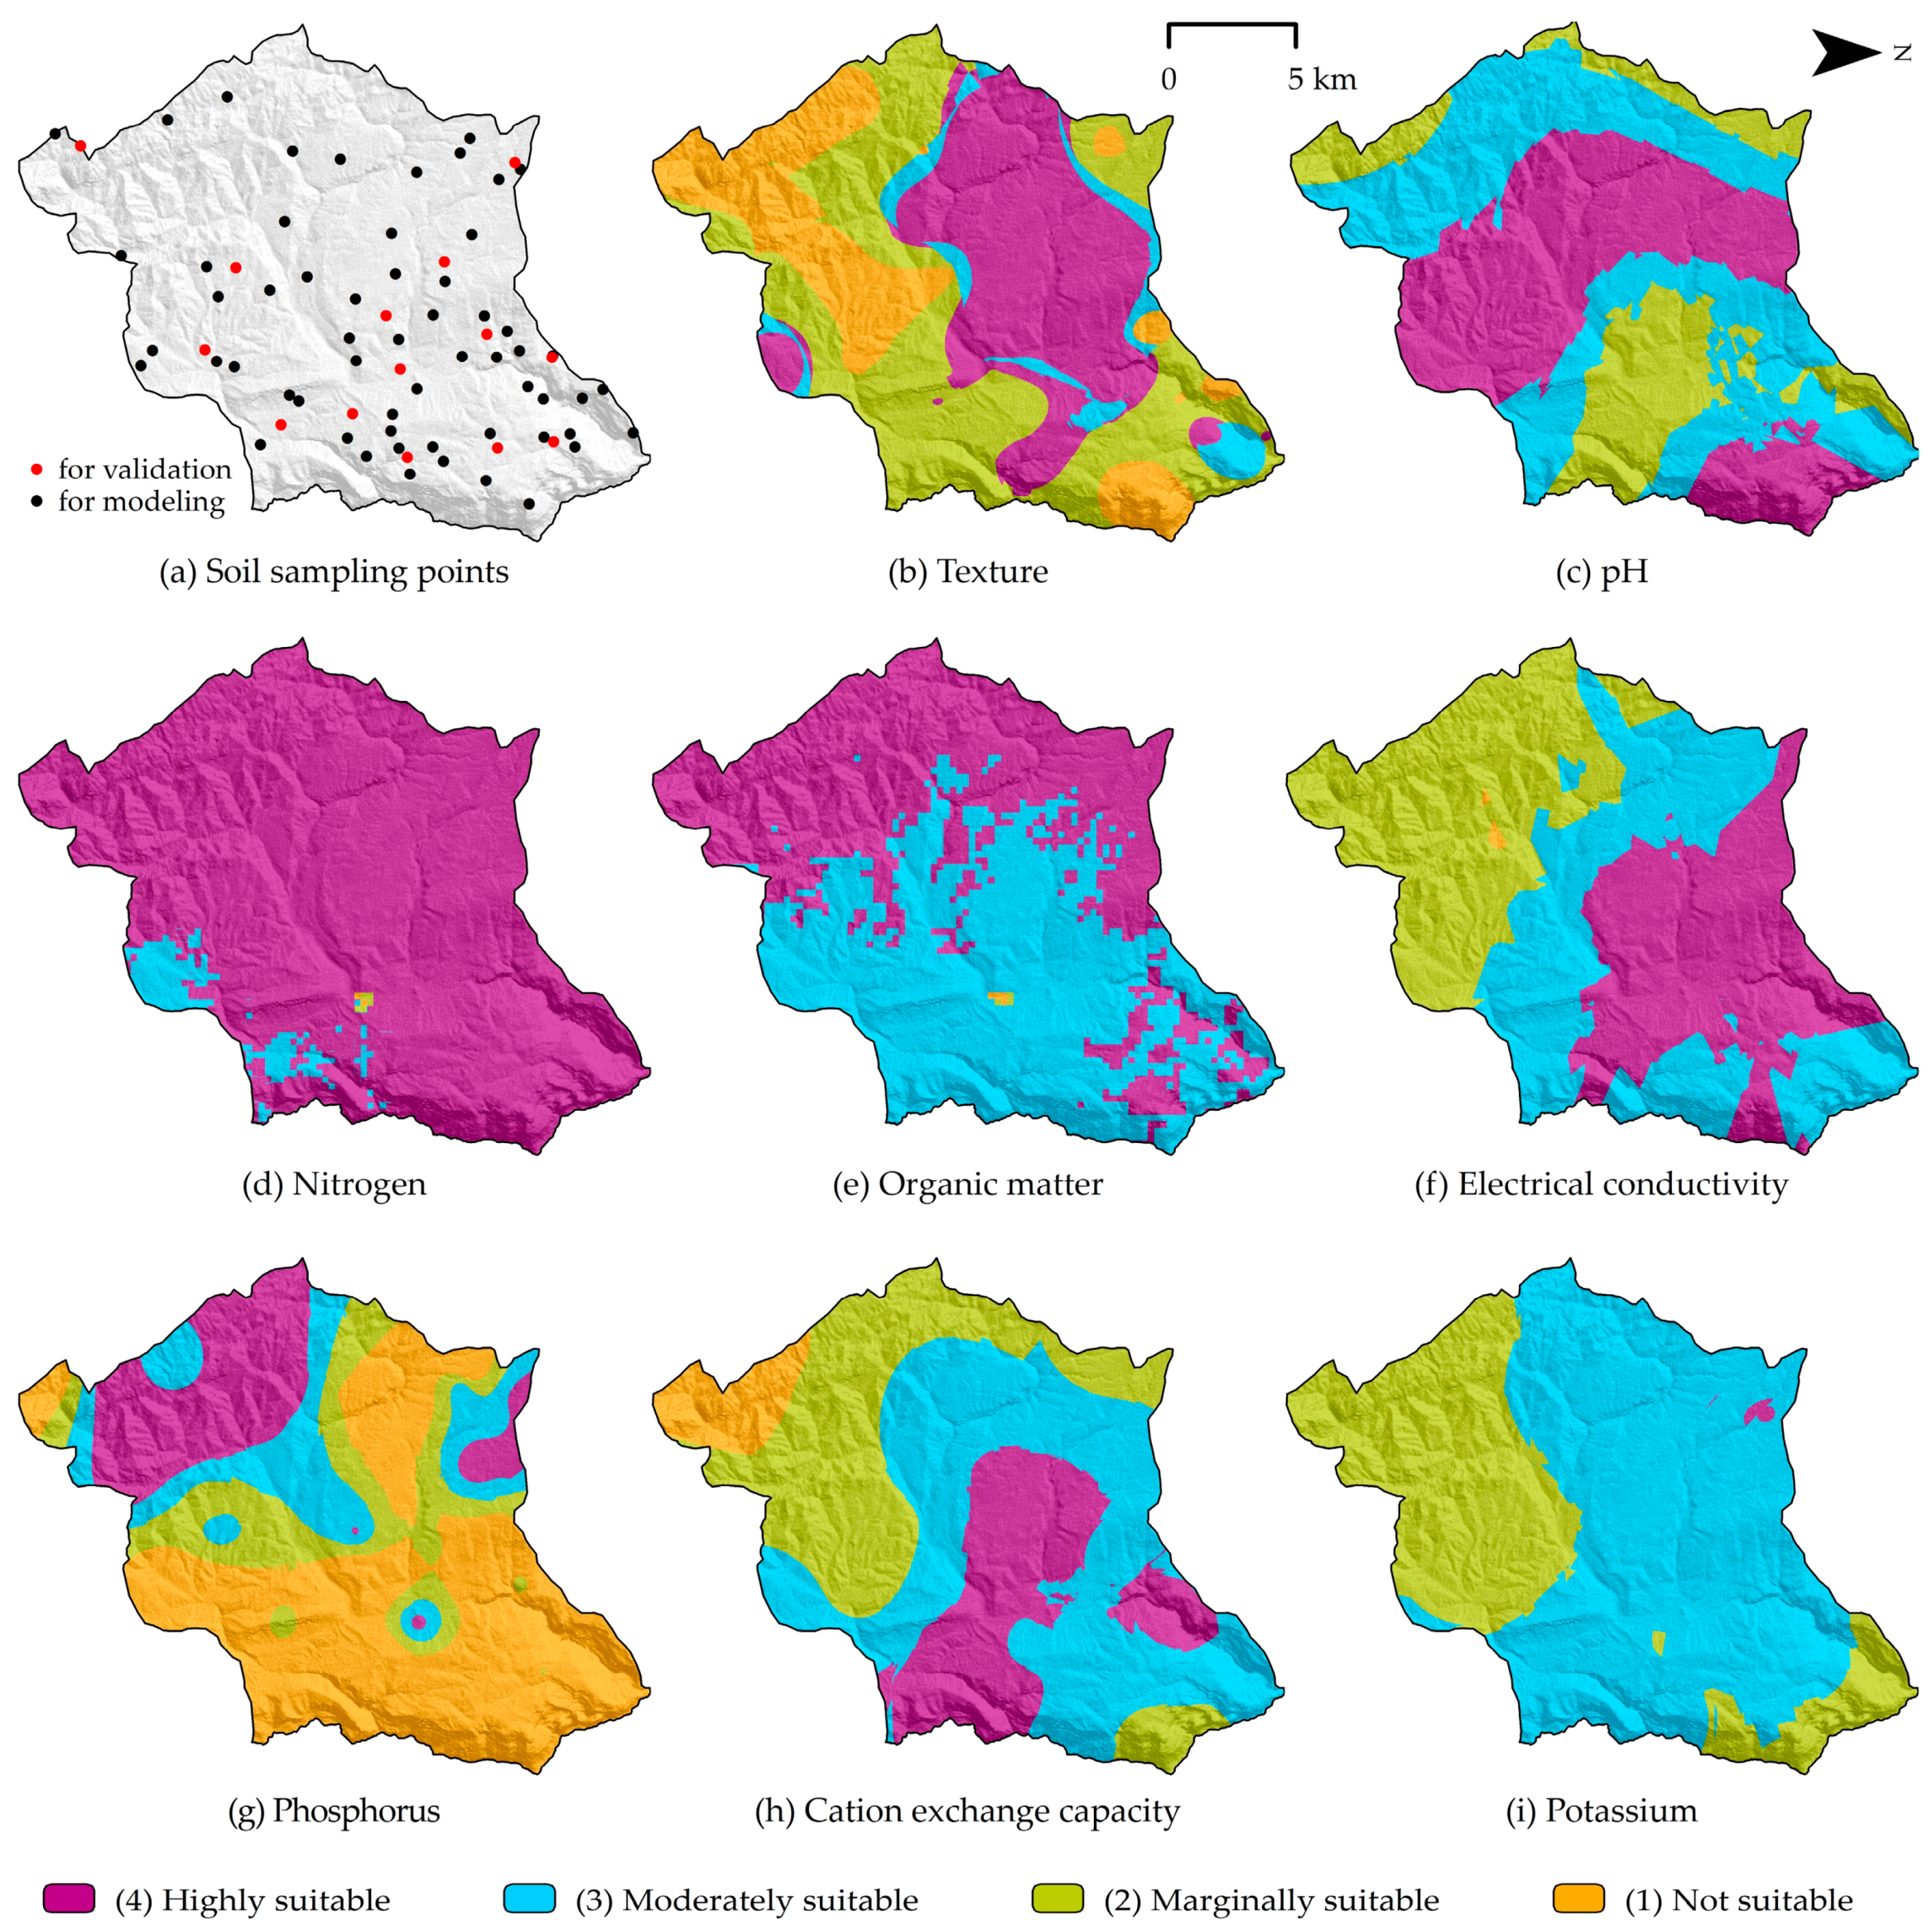
3.1. Descriptive Statistics for Soil Properties

Table 4 shows the descriptive statistics of soil properties in the study area. Moderate variability was shown by pH, while other physical chemical properties displayed a high variability in their results. Furthermore, a negative skewness was observed for pH, Log P, CEC and Sand, and a slight positive skewness for EC, SOM, Log SOM, N, P, K, Silt and Clay.
Fifty Ordinary Kriging (OK) spatial interpolation models with five semivariogram models were generated for each soil property. Performance statistics were calculated for all models and the model with the best performance for each physicochemical property was chosen (Table 5). The Gaussian semivariogram model was better adjusted to different soil properties. Properties with extremely low R2 (N, SOM and Silt) were excluded. Therefore, the silt layer was calculated by supplementing the Sand + Clay layer to 100, and N and SOM layers were obtained from SoilGrids. Lastly, thematic maps for each edaphological subcriteria are shown in Figure 5.

3.2. Subcriteria Importance Weights

Ten experts were consulted and 50 PCMs were constructed, one at the criteria level and four at the subcriteria level, for each expert. The average weighting for each climatological, topographical, socioeconomical and edaphological criterion and subcriterion is shown in Table 6. These were standardized and scored according to their influence on potato cultivation in the Jucusbamba and Tincas microwatersheds.
According to results shown, climatological (30.14%) and edaphological (29.16%) criteria hold the highest importance. Likewise, precipitation (0.4334), slope (0.5475), LULC (0.4764) and SOM (0.1654) are the most representative subcriteria for each hierarchical group. Moreover, average CR oscillated between 0.002 and 0.041 (Table 7), which indicates that the matrices are consistent and acceptable.

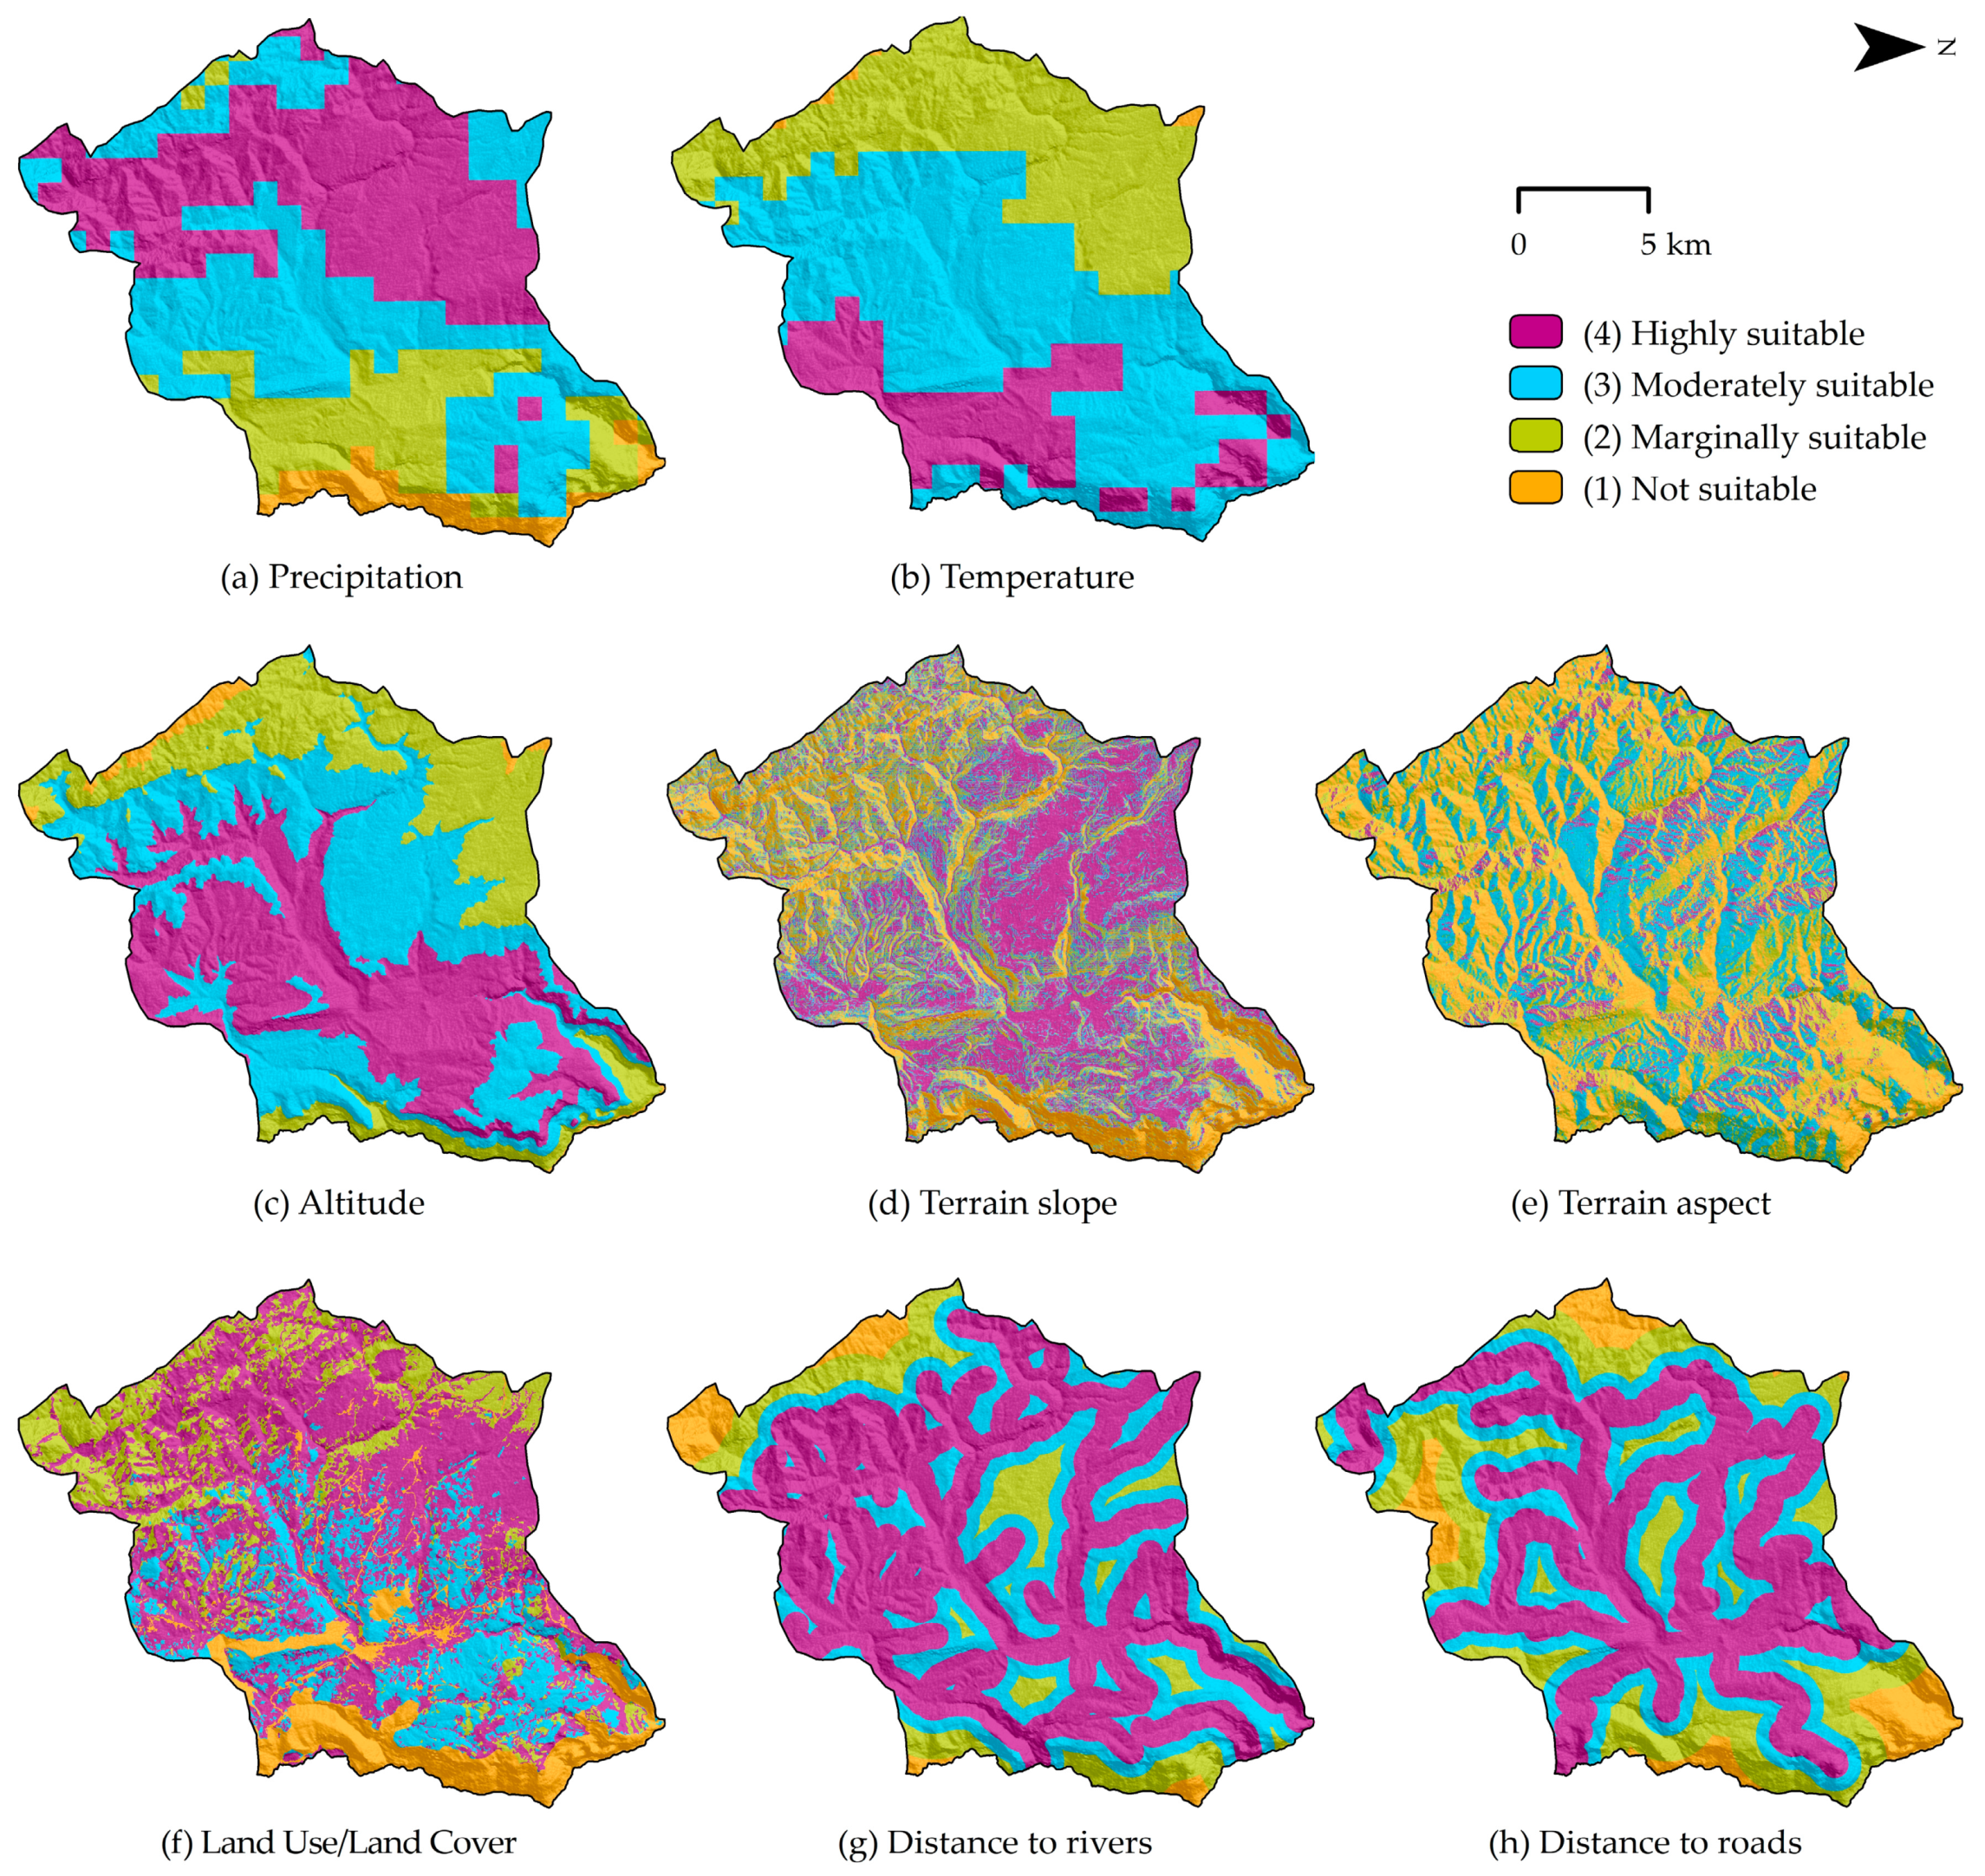
3.3. Suitability Submodels for Potato Cultivation

Suitability submodels were generated with the weighted overlap (Equation (2)) of the subcriteria for each hierarchical group (Figure 6). The submodels that presented the largest “highly suitable” surface for potato cultivation were socioeconomical (96.41 km2) and topographical (89.65 km2) (Table 8). In contrast, the submodels with the smallest “highly suitable” area were climatological (34.30 km2) and edaphological (12.72 km2). In order not to overestimate the suitability of the criteria maps, submodels and final model, the road network, the main urban centres, rivers and a 200 m buffer zone of archaeological sites (4.64 km2) were excluded from the analysis.

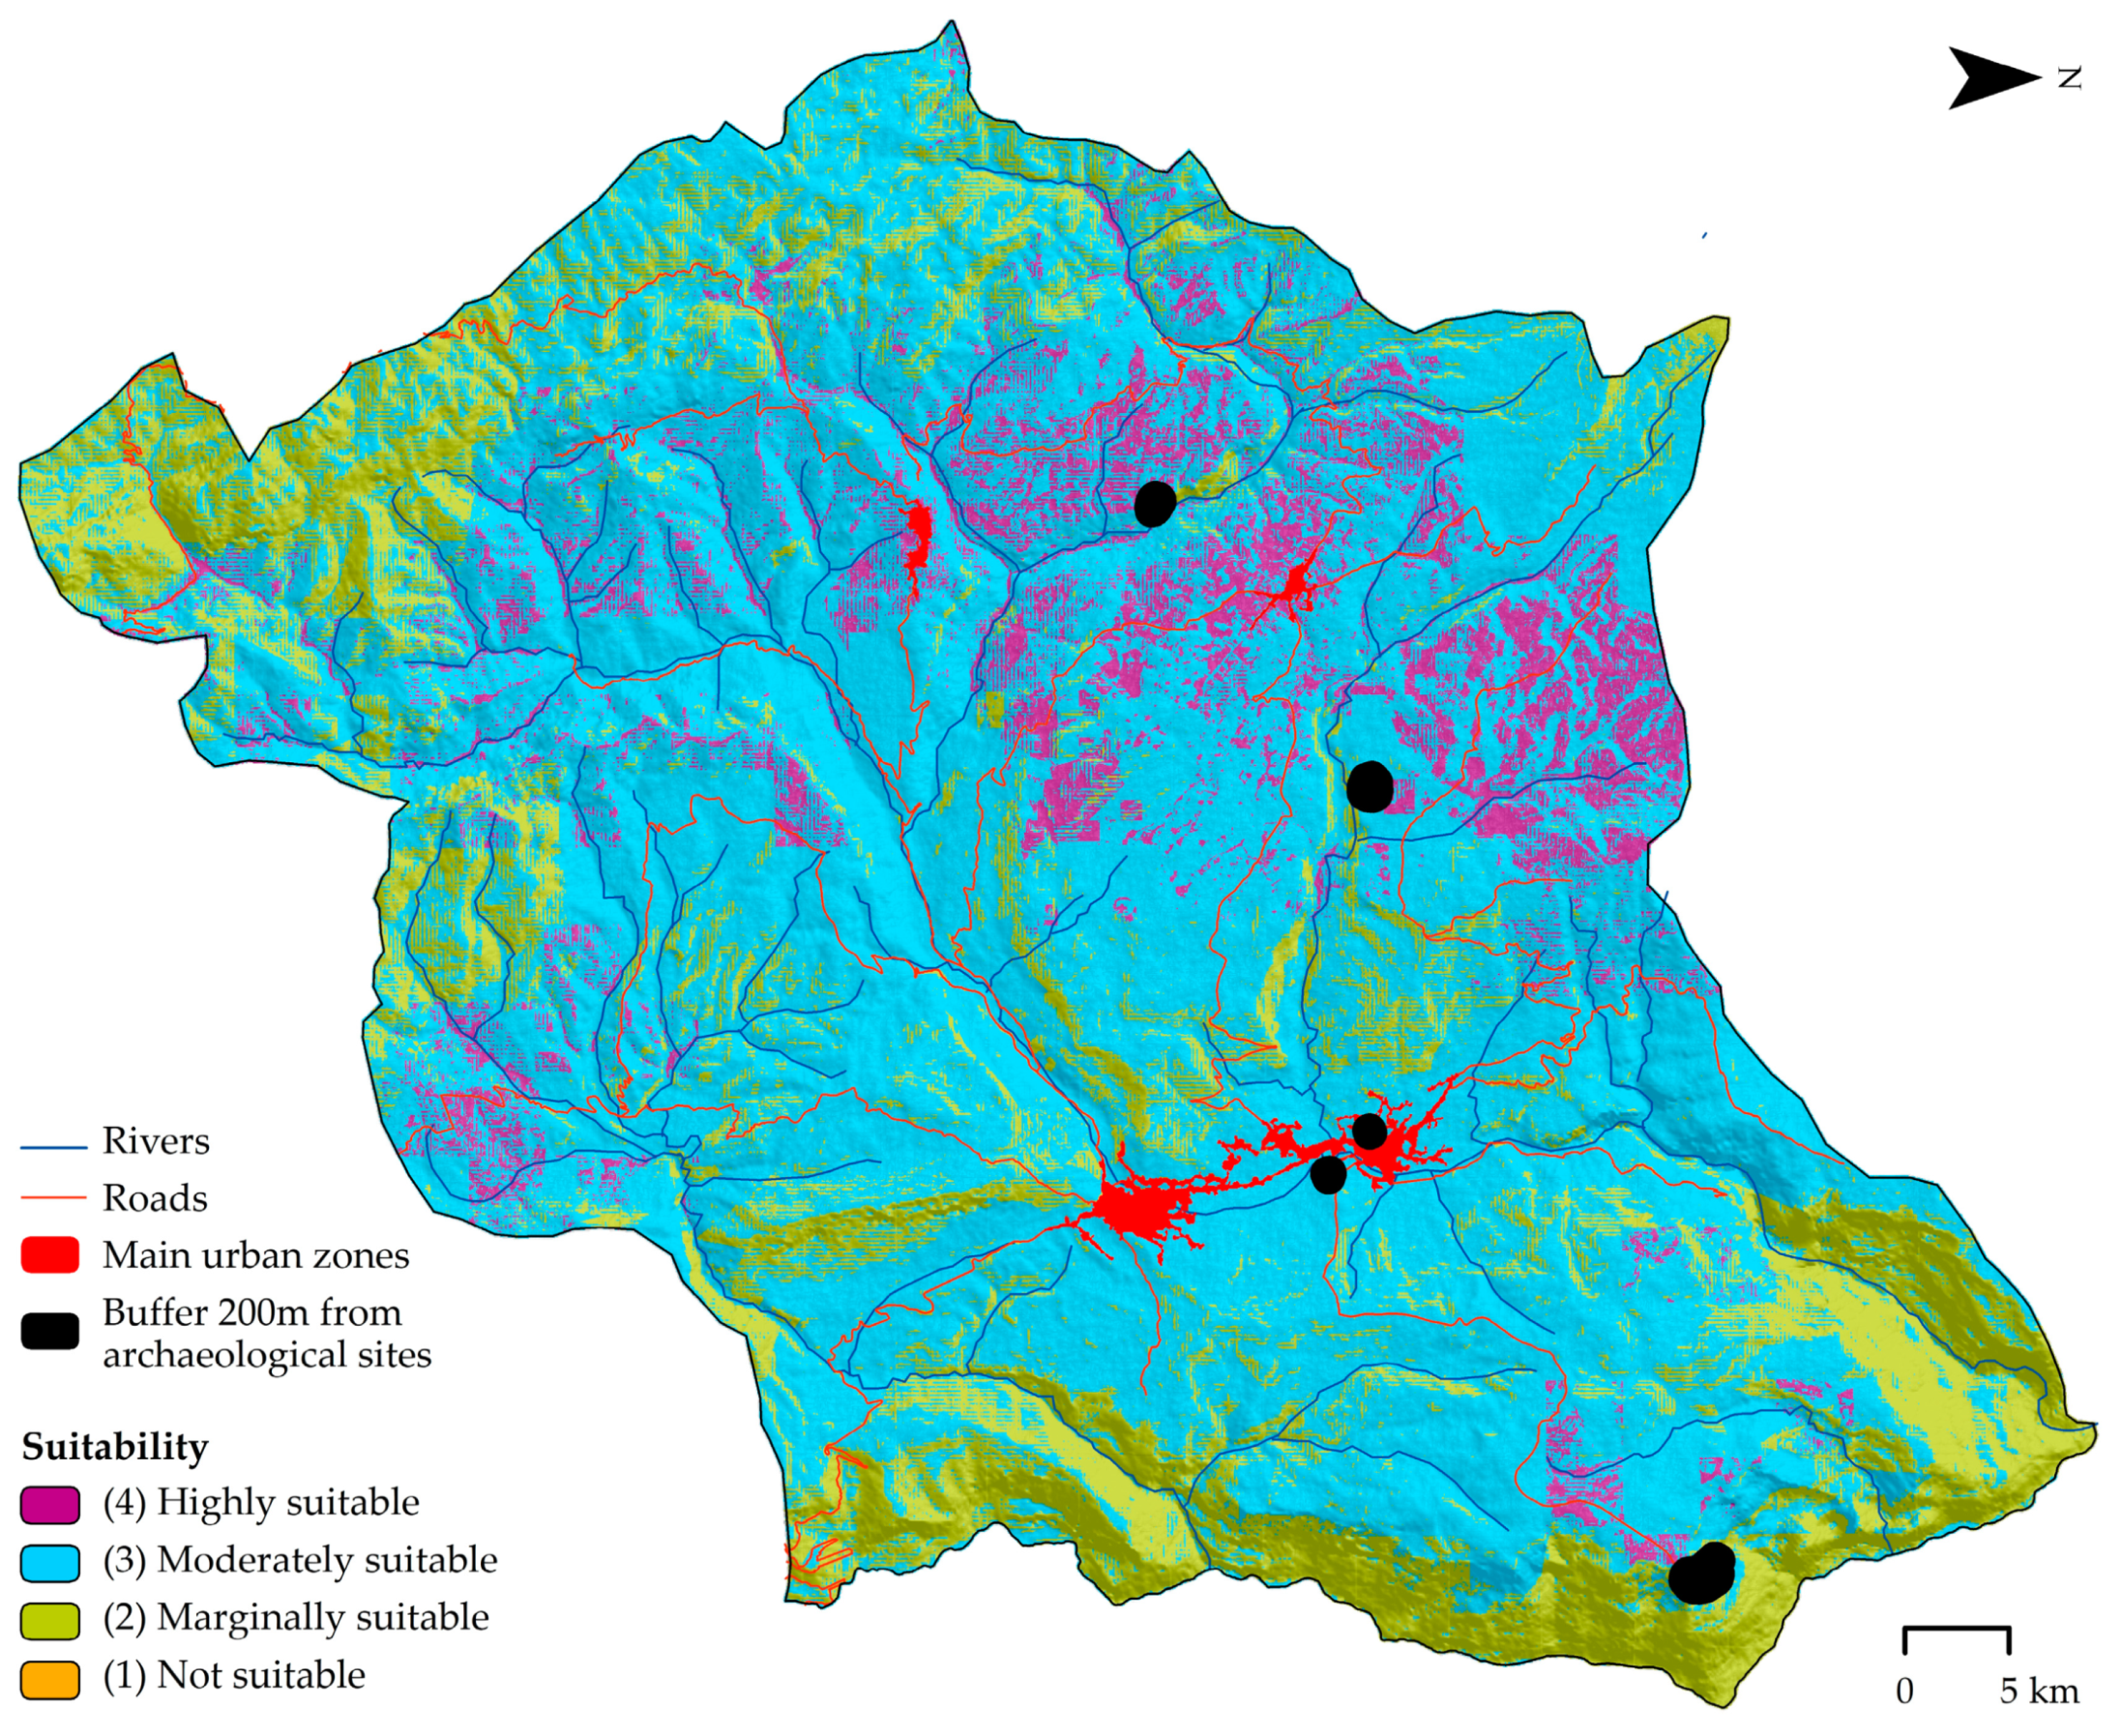
3.4. Land Suitability Model

The final model of land suitability for potato cultivation was generated with the weighted superposition of the submodels (Figure 7). Of the microbasin area, 8.2% (22.91 km2) was "highly suitable" for potato cultivation, “moderately suitable” (190.37 km2) and “marginally suitable” (60.11 km2) areas represented 90.1%, and there were no “not suitable” areas found.

4. Discussion

The coupled AHP and RS-GIS approach is widely used in agricultural land zoning processes. Nevertheless, in comparison to previous studies of the suitability of the territory for potato cultivation [20,21,22,23,46,47,63], for other crops (Brassica napus L. [11,25], Glycine max L. [11], Triticum aestivum L. [23,27], Zea mays L. [27,29], Oryza sativa L. [28], coffee [31], and Vicia faba L. [32]) or for agriculture in general [7,10,33,34,35], we included a greater number of subcriteria. However, in this type of study, the number of subcriteria depends on the focus of the study and the availability of spatial data. For example, future studies may include economic subcriteria (cost benefit, productivity, crop return rate or others [71]) and social (level of family skills, availability of labour, access to information, poverty rate or others [24]) that were not considered here due to the lack of spatial data [68]. An attempt was made to overcome this difficulty by generating larger-scale soil maps through field sampling and the application of geostatistics. Like other studies on the suitability of the territory for the cultivation of potato [21,22] or other crops [25,27,29,30,32], geostatistics were applied, being among the most suitable interpolation methods for the estimation of soil properties [32,72].
Ordinary Kriging (OK) interpolation was used and the Gaussian semivariogram model was best adjusted to different soil properties. For Tashayo et al. [29,30], Gaussian was also the best fit model, while for Ostovari et al. [25] and Pilevar et al. [27], it was Spherical. Although OK is the most widely used method and several studies [21,27,29,30,72] have reported that it is the best for mapping soil characteristics, Li et al. [73] noted that it has a smoothing effect and tends to neglect local variability. In this regard, the Regression Kriging (RK) and other more advanced methods take advantage of the spatial information of environmental covariates and exceed OK [73,74]. In future studies, it is suggested that more advanced spatial interpolation methods be implemented. In this study, we used models generated with low yields (Sand, K, EC and P) due to the lack of detailed secondary information for P and K, and because field sampling was considered better than the information at a smaller scale which was available for Sand and EC (in SoilGrids [55]).
Additionally, after an extensive literature review, only four studies [20,21,22,23] included an integrated AHP approach in land suitability analyses for potato cultivation. Among these, three [21,22,23] evaluated edaphological subcriteria; the study of Kamau et al. did not [20]. This study indicated that the most important criteria for potato cultivation are climatological (30.14%) and edaphological (29.16%), followed by topographical (25.72%) and socioeconomical (14.98%). Similar results were reported by Kamau et al. [20], who did not consider socioeconomic criteria; for their study, edaphological criteria were the most important, followed by climatological and topographic. The similar level of importance of climatological and edaphological subcriteria was due to the fact that both strictly determine the development of crops [75]. Topographic subcriteria are of similar importance, since in mountainous ecosystems, like our study area, the topography has a great influence on the microclimates and edaphic properties (erosion and nutrient cycling) [7,24]. Of the climatological subcriteria, precipitation (57.92%) was the most important in this study, followed by temperature (42.08%). For Kamau et al. [20], precipitation was also more important than temperature. The great importance of precipitation was due to the high water needs of the potato crop (1000–1200 mm, well distributed during the growing cycle) [76]. The deficit of irrigation technologies in the province of Luya and in Amazonas influences the dependence on precipitation for the cultivation of potatoes and other crops. This dependence leads poorly informed residents to start fires with the purpose of generating rains during the dry season of the year [77], leading to land degradation.
Topographical subcriteria (slope, elevation and aspect) were included in this study, unlike that of Kamau et al. [20], as they were taken into account in other agricultural zoning studies [12,26,33,35]. With regard to terrain aspect, this subcriterion strongly influenced solar light and microclimate temperature variations [78]. Slope (54.75%) was considered the most important topographical subcriterion in this study, since it influenced soil depth distribution, soil moisture, soil erosion, nutrient availability, LULC, etc. [79]. Therefore, Zolekar and Bhagat [7] suggested using a high-resolution DEM, which describes the topographic variations in detail and provides greater precision in determining the suitability of the territory for agriculture, especially in mountainous areas such as those in this study.
With regards to edaphological subcriteria, SOM (16.51%) and pH (14.49%) were the most important, followed by primary macronutrients (N 13.98%, P 13.43% and K 13.42%) and other subcriteria (CEC 9.52%, EC 9.42% and Texture 9.24%). This differs from other land suitability analyses, like that of Kamau et al. [20], who used four edaphological subcriteria, whereby texture and drainage had higher importance values, followed by depth and pH. Furthermore, this study differed from studies carried out by Singha et al. [21] and Keshavarzi et al. [22], who used eight different subcriteria, from which K, texture, Organic Carbon (OC) and pH obtained higher importance values. On the other hand, Bagherzadeh et al. [23] obtained higher importance values for CEC and OC within the ten subcriteria they analyzed. The number and the different edaphological subcriteria used by previous studies, as well as each local reality and the varied experience of the experts, contributed to determining the importance of the edaphological subcriteria used in this study [8]. In fact, in any study on the suitability of land for agriculture, knowledge of the physicochemical properties of the soil is indispensable [29].
Within the socioeconomic subcriteria, LULC (47.64%) stands out on the distance to highways (26.56%) and distance to the water network (25.80%); this may have been due to the conservationist approach of the experts. This is because in the province of Luya, agriculture and livestock have brought about large changes in LULC, which caused a loss of 60.21 km2 between 2001–2018 (66–88% of the loss occurred in areas <1 ha) [80]. Additionally, the slightly greater importance of proximity to a road compared to proximity to a water network may have been due to the fact that the study area featured many river water resources, while it lacked good road access. However, this difficulty may be overcome with the paved road project that goes from Corral Quemado (exit to markets on the coast), passes through Cumba, Collonce, Cohechán, to Luya, and continues to Chachapoyas (capital of the region Amazonas) or to the markets of the coast (Chiclayo, etc.) and the jungle (Moyobamba, Tarapoto, etc.) [81].
In the Jucusbamba and Tincas microbasins, the area modeled as “highly suitable” (22.91 km2) for potato cultivation was 454.5% greater than the potato area reported in the last national agricultural census of 2012 (4.13 km2, adding areas of the districts that include the microwatersheds [35]) and spatially coincided with only 29.7% (6.81 km2) with the area classified as being suitable for crops (54.83 km2 adding classes clean/intensive crops and permanent crops [37]) of the CTCUM of the microwatersheds.
Our methodology framework, that integrates AHP and RS-GIS in order to assess land suitability for potato cultivation, can be applied in various future studies with necessary adjustments. Likewise, this methodology can be applied to other crops that have nutritional, economic and environmental importance. Unlike CTCUM, a normative technical instrument that determines the general suitability of land, our framework makes it possible to analyze the suitability of land for specific crops, which could improve the zoning process. Furthermore, CTCUM is based on a Peru Life Zones map which is outdated, even at local scales. For its part, although the ZAE will be an advance in agricultural territorial planning in Peru because it can be used to evaluate specific crops, it is recommended that the weighting of the importance of the criteria through the AHP be implemented. This is important, since each agricultural reality (district, province, region or country) is different, and therefore, the criteria must be prioritized by local experts.

5. Conclusions

This study assessed land suitability for potato cultivation by coupling AHP and RS-GIS techniques and basing them on four main criteria (climatological, edaphological, topographical and socioeconomical) and sixteen subcriteria. A thorough, expert-based analysis showed that climatological and edaphological were the most important criteria. Additionally, the resulting socioeconomical submodel possessed the largest “highly suitable” area in contrast to the edaphological submodel. A final output land suitability map labeled 8.2% (22.91 km2) and 68.5% (190.37 km2) of the Jucusbamba and Tincas microwatersheds as “highly suitable” and “moderately suitable” for potato cultivation, respectively.
This research will provide support in the decision-making process for sustainable agricultural production in the Jucusbamba and Tinas microwatersheds by giving local farmers tools to improve agricultural planning. Finally, this study is intended to promote and guide sustainable agriculture.

Author Contributions

Conceptualization, D.I.T., R.S.L. and N.B.R.B.; Data curation, D.I.T., N.B.R.B. and L.Q.H.; Formal analysis, D.I.T., N.B.R.B., J.O.S.L., M.O., L.Q.H. and E.B.C.; Funding acquisition, M.O. and M.Á.B.G.; Investigation, D.I.T., R.S.L., N.B.R.B., J.O.S.L., D.G.F., L.Q.H., R.E.T.M., E.B.C. and M.Á.B.G.; Methodology, D.I.T., R.S.L., N.B.R.B., J.O.S.L., D.G.F., L.Q.H. and R.E.T.M.; Project administration, R.S.L., M.O. and M.Á.B.G.; Resources, M.O. and M.Á.B.G.; Software, D.I.T., R.S.L., N.B.R.B., J.O.S.L., D.G.F., L.Q.H., R.E.T.M. and E.B.C.; Supervision, R.S.L. and M.O.; Validation, N.B.R.B.; Visualization, R.S.L., N.B.R.B., M.O. and M.Á.B.G.; Writing—original draft, D.I.T. and N.B.R.B.; Writing—review & editing, D.I.T., R.S.L., N.B.R.B., J.O.S.L., D.G.F., M.O., L.Q.H., R.E.T.M., E.B.C. and M.Á.B.G. All authors have read and agreed to the published version of the manuscript.

Funding

This research was funded by Public investment project GEOMATICA (SNIP N° 312235), executed by the Cloud Forest’s Sustainable Development Research Institute (INDES-CES) of the National University Toribio Rodríguez of Mendoza (UNTRM).

Acknowledgments

The authors acknowledge and appreciate the support of the Research Institute for the Sustainable Development of the Jungle brow zone (INDES-CES) of the National University Toribio Rodríguez of Mendoza (UNTRM). They also express thanks to the group of experts who developed the matrices (R.O.G.R., H.A.C.H., L.G.B.R., J.V.T.E., J.A., L.N.Z.L., E.H., J.E.V.G., and L.M.G.R).

Conflicts of Interest

The authors declare no conflict of interest.

References

  1. Mussardo, G. Ampliando la frontera agrícola de la papa (Solanum tuberosum L.) para disminuir los efectos del cambio climático. Stat. Field 2019, 53, 1689–1699. [Google Scholar]
  2. Zhao, J.; Zhan, X.; Jiang, Y.; Xu, J. Variations in climatic suitability and planting regionalization for potato in northern China under climate change. PLoS ONE 2018, 13, e0203538. [Google Scholar] [CrossRef] [PubMed]
  3. Reay, D. Climate-Smart Food; Springer International Publishing: Cham, Switzerland, 2019; ISBN 978-3-030-18205-2. [Google Scholar]
  4. Nathan, A.J.; Scobell, A. How China sees America. Foreign Aff. 2012, 91, 1–13. [Google Scholar]
  5. Laurente Blanco, L.F.; Laurente Quiñonez, F. Application of the ARIMA model for the production of potatoes in Puno-Perú region. Rev. De Investig. E Innovación Agropecu. Y De Recur. Nat. 2019, 6, 30–40. [Google Scholar]
  6. Torres García, M. Aplicaciones Geomáticas en Agricultura; Universitat Politècnica de València: Valencia, Spain, 2017. [Google Scholar]
  7. Zolekar, R.B.; Bhagat, V.S. Multi-criteria land suitability analysis for agriculture in hilly zone: Remote sensing and GIS approach. Comput. Electron. Agric. 2015, 118, 300–321. [Google Scholar] [CrossRef]
  8. Salas López, R.; Gómez Fernández, D.; Silva López, J.O.; Rojas Briceño, N.B.; Oliva, M.; Terrones Murga, R.E.; Iliquín Trigoso, D.; Barboza Castillo, E.; Barrena Gurbillón, M.Á. Land Suitability for Coffee (Coffea arabica) Growing in Amazonas, Peru: Integrated Use of AHP, GIS and RS. ISPRS Int. J. Geo Inf. 2020, 9, 673. [Google Scholar] [CrossRef]
  9. Briceño, N.B.; Castillo, E.B.; Quintana, J.L.; Cruz, S.M.; López, R.S. Deforestación en la Amazonía peruana: Índices de cambios de cobertura y uso del suelo basado en SIG. Boletín Asoc. Geógrafos Españoles 2019, 81, 1–34. [Google Scholar]
  10. Mishra, A.K.; Deep, S.; Choudhary, A. Identification of suitable sites for organic farming using AHP & GIS. Egypt. J. Remote Sens. Space Sci. 2015, 18, 181–193. [Google Scholar]
  11. Kamkar, B.; Dorri, M.A.; Da Silva, J.A.T. Assessment of land suitability and the possibility and performance of a canola (Brassica napus L.)—Soybean (Glycine max L.) rotation in four basins of Golestan province, Iran. Egypt. J. Remote Sens. Space Sci. 2014, 17, 95–104. [Google Scholar] [CrossRef] [Green Version]
  12. Aldababseh, A.; Temimi, M.; Maghelal, P.; Branch, O.; Wulfmeyer, V. Multi-criteria evaluation of irrigated agriculture suitability to achieve food security in an arid environment. Sustainability 2018, 10, 803. [Google Scholar] [CrossRef] [Green Version]
  13. MINAGRI. Decreto Supremo N° 017-2009-AG. Aprueban Reglamento de Clasificación de Tierras por su Capacidad de Uso Mayor; MINAGRI: Lima, Peru, 2009.
  14. INRENA. Mapa Ecológico del Perú. Guía Explicativa; MINAGRI: Lima, Peru, 1995.
  15. MINAGRI. Decreto Supremo N° 013-2010-AG. Aprueban el Reglamento para la Ejecución de Levantamiento de Suelos; MINAGRI: Lima, Peru, 2010.
  16. MINAM. Zonificación Ecológica y Económica (ZEE). Available online: https://www.minam.gob.pe/ordenamientoterritorial/zonificacion-ecologica-y-economica-zee/ (accessed on 20 November 2020).
  17. FAO. Agro-Ecological Zoning: Guidelines; Soil Resources, Management and Conservation Service: Roma, Italy, 1996. [Google Scholar]
  18. Srdjevic, B. Combining different prioritization methods in the analytic hierarchy process synthesis. Comput. Oper. Res. 2005, 32, 1897–1919. [Google Scholar] [CrossRef]
  19. Saaty, T.L. What is the Analytic Hierarchy Process? In Mathematical Models for Decision Support; Springer: Berlin/Heidelberg, Germany, 1988; pp. 109–121. [Google Scholar]
  20. Kamau, S.W.; Kuria, D.; Gachari, M.K. Crop-land Suitability Analysis Using GIS and Remote Sensing in Nyandarua County, Kenya. J. Environ. Earth Sci. 2015, 5, 121–132. [Google Scholar]
  21. Singha, C.; Swain, K.C.; Swain, S.K. Best crop rotation selection with GIS-AHP technique using soil nutrient variability. Agriculture 2020, 10, 213. [Google Scholar] [CrossRef]
  22. Keshavarzi, A.; Tuffour, H.O.; Bagherzadeh, A.; Tattrah, L.P.; Kumar, V.; Gholizadeh, A.; Rodrigo-Comino, J. Using fuzzy-AHP and parametric technique to assess soil fertility status in Northeast of Iran. J. Mt. Sci. 2020, 17, 931–948. [Google Scholar] [CrossRef]
  23. Bagherzadeh, A.; Gholizadeh, A.; Keshavarzi, A. Assessment of soil fertility index for potato production using integrated fuzzy and AHP approaches, northeast of Iran. Eurasian J. Soil Sci. 2018, 7, 203–212. [Google Scholar] [CrossRef]
  24. Herzberg, R.; Pham, T.G.; Kappas, M.; Wyss, D.; Tran, C.T.M. Multi-criteria decision analysis for the land evaluation of potential agricultural land use types in a hilly area of Central Vietnam. Land 2019, 8, 90. [Google Scholar] [CrossRef] [Green Version]
  25. Ostovari, Y.; Honarbakhsh, A.; Sangoony, H.; Zolfaghari, F.; Maleki, K.; Ingram, B. GIS and multi-criteria decision-making analysis assessment of land suitability for rapeseed farming in calcareous soils of semi-arid regions. Ecol. Indic. 2019, 103, 479–487. [Google Scholar] [CrossRef]
  26. Zhang, J.; Su, Y.; Wu, J.; Liang, H. GIS based land suitability assessment for tobacco production using AHP and fuzzy set in Shandong province of China. Comput. Electron. Agric. 2015, 114, 202–211. [Google Scholar] [CrossRef]
  27. Pilevar, A.R.; Matinfar, H.R.; Sohrabi, A.; Sarmadian, F. Integrated fuzzy, AHP and GIS techniques for land suitability assessment in semi-arid regions for wheat and maize farming. Ecol. Indic. 2020, 110, 105887. [Google Scholar] [CrossRef]
  28. Amini, S.; Rohani, A.; Aghkhani, M.H.; Abbaspour-Fard, M.H.; Asgharipour, M.R. Assessment of land suitability and agricultural production sustainability using a combined approach (Fuzzy-AHP-GIS): A case study of Mazandaran province, Iran. Inf. Process. Agric. 2020, 7, 384–402. [Google Scholar] [CrossRef]
  29. Tashayo, B.; Honarbakhsh, A.; Akbari, M.; Eftekhari, M. Land suitability assessment for maize farming using a GIS-AHP method for a semi- arid region, Iran. J. Saudi Soc. Agric. Sci. 2020, 19, 332–338. [Google Scholar] [CrossRef]
  30. Tashayo, B.; Honarbakhsh, A.; Azma, A.; Akbari, M. Combined Fuzzy AHP–GIS for Agricultural Land Suitability Modeling for a Watershed in Southern Iran. Environ. Manag. 2020, 66, 364–376. [Google Scholar] [CrossRef] [PubMed]
  31. Mighty, M.A. Site suitability and the analytic hierarchy process: How GIS analysis can improve the competitive advantage of the Jamaican coffee industry. Appl. Geogr. 2015, 58, 84–93. [Google Scholar] [CrossRef]
  32. Kazemi, H.; Sadeghi, S.; Akinci, H. Developing a land evaluation model for faba bean cultivation using geographic information system and multi-criteria analysis (A case study: Gonbad-Kavous region, Iran). Ecol. Indic. 2016, 63, 37–47. [Google Scholar] [CrossRef]
  33. Pramanik, M.K. Site suitability analysis for agricultural land use of Darjeeling district using AHP and GIS techniques. Modeling Earth Syst. Environ. 2016, 2, 56. [Google Scholar] [CrossRef] [Green Version]
  34. Yalew, S.G.; van Griensven, A.; Mul, M.L.; van der Zaag, P. Land suitability analysis for agriculture in the Abbay basin using remote sensing, GIS and AHP techniques. Model. Earth Syst. Environ. 2016, 2, 101. [Google Scholar] [CrossRef] [Green Version]
  35. Bozdağ, A.; Yavuz, F.; Günay, A.S. AHP and GIS based land suitability analysis for Cihanbeyli (Turkey) County. Environ. Earth Sci. 2016, 75, 813. [Google Scholar] [CrossRef]
  36. Madrigal-Martínez, S.; Puga-Calderón, R.J. Aptitud de la tierra y analisis de sensitividad en la planificacion del cultivo del manzano en el valle Mala, Peru. BIOAGRO 2018, 30, 95–107. [Google Scholar]
  37. INEI. Resultados definitivos de los Censos Nacionales 2017: Amazonas. In Censos Nacionales 2017: XII de Población, VII de Vivienda y III de Comunidades Indígenas; INEI: Lima, Peru, 2017; pp. 1–11347. [Google Scholar]
  38. INEI. Resultados Definitivos. IV Censo Nacional Agropecuario; INEI: Lima, Peru, 2012.
  39. Obando, N.V.; Oliva, M. Nematodos fitoparásitos asociados al cultivo de papa (Solanum tuberosum L.) en la provincia de Luya, Amazonas. Rev. Indes 2015, 1, 94–101. [Google Scholar]
  40. UNTRM. Estudio Semidetallado De Suelos Y Clasificación De Tierras Por Su Capacidad De Uso Mayor De La Microcuenca Tincas Y Jucusbamba; INDES-CES: Chachapoyas, Peru, 2016. [Google Scholar]
  41. Vargas, J. Clima, informe temático. In Proyecto Zonificación Ecológica y Económica del departamento de Amazonas; Convenio entre el IIAP y el Gobierno Regional de Amazonas: Iquitos, Peru, 2010. [Google Scholar]
  42. Fick, S.E.; Hijmans, R.J. WorldClim 2: New 1-km spatial resolution climate surfaces for global land areas. Int. J. Climatol. 2017, 37, 4302–4315. [Google Scholar] [CrossRef]
  43. Avilés, J.; Piedra, R. Manual del Cultivo de Papa en Costa Rica (Solanum tuberosum L.); Instituto Nacional de Innovación y Transferencia en Tecnología Agropecuaria (INTA): San José, Costa Rica, 2017; ISBN 9789968586115. [Google Scholar]
  44. Inostroza, J.; Méndez, P.; Espinoza, N.; Kramm, V. Manual del Cultivo de la Papa en Chile; Instituto de Investigaciones Agropecuarias (INIA): Santiago, Chile, 2007. [Google Scholar]
  45. Zha, Y.; Gao, J.; Ni, S. Use of normalized difference built-up index in automatically mapping urban areas from TM imagery. Int. J. Remote Sens. 2003, 24, 583–594. [Google Scholar] [CrossRef]
  46. Olivares, B.O.; Hernández, R.A. Sectorización ecoterritorial para la producción agrícola sostenible del cultivo de papa (Solanum tuberosum L.) en Carabobo, Venezuela. Cienc. Y Tecnol. Agropecu. 2019, 20, 323–338. [Google Scholar] [CrossRef] [Green Version]
  47. Grisales, O. Suitable Land for Potato Cultivation in the Västra Nyland Region: A GIS Method Template for Field Selection. Bachelor’s Thesis, Sustainable Coastal Management, Novia University of Applied Sciences, Ekenäs, Finland, 2020. [Google Scholar]
  48. NASA. NASA’s Earth Observing System Data and Information System (EOSDIS). Available online: https://search.asf.alaska.edu/#/?flightDirs= (accessed on 15 June 2020).
  49. Castañeda, R.A.M.; Davila, Á.E.O. Máquinas de soporte vectorial para clasificación supervisada de imágenes en bases de datos espaciales. Rev. Ibérica De Sist. E Tecnol. De Inf. 2018, 17, 538–552. [Google Scholar]
  50. MINAM. Mapa Nacional de Cobertura Vegetal. Memoria Descriptiva; Dirección General de Evaluación, Valoración y Financiamiento del Patrimonio Natural: Lima, Perú, 2015. [Google Scholar]
  51. MTC. Descarga de Datos Espaciales. Available online: https://portal.mtc.gob.pe/estadisticas/descarga.html (accessed on 20 June 2020).
  52. MINEDU. Descarga de Información Espacial del MED. Available online: http://sigmed.minedu.gob.pe/descargas/ (accessed on 20 June 2020).
  53. GRA; IIAP. Zonificación Ecológica y Económica (ZEE) del Departamento de Amazonas; Gobierno Regional de Amazonas (GRA) and Instituto de Investigaciones de la Amazonía Peruana (IIAP): Iquitos, Peru, 2010. [Google Scholar]
  54. Quiñones, L.; Barrena, M.; Gosgot, W.; Salas, R.; Milla, M. Estimación de la radiación solar diaria para la ciudad de Bagua, región Amazonas, Perú. Sel. Mat. 2019, 6, 320–328. [Google Scholar] [CrossRef] [Green Version]
  55. Hengl, T.; De Jesus, J.M.; Heuvelink, G.B.M.; Gonzalez, M.R.; Kilibarda, M.; Blagotić, A.; Shangguan, W.; Wright, M.N.; Geng, X.; Bauer-Marschallinger, B.; et al. SoilGrids250m: Global gridded soil information based on machine learning. PLoS ONE 2017, 12, e0169748. [Google Scholar] [CrossRef] [Green Version]
  56. Guerrero, J. Clases Texturales de Suelo Utilizando el Raster Calculator de QGIS. Available online: https://joseguerreroa.wordpress.com/2015/04/06/clases-texturales-de-suelo-utilizando-el-raster-calculator-de-qgis/ (accessed on 30 June 2020).
  57. Effat, H.A.; Hassan, O.A. Designing and evaluation of three alternatives highway routes using the Analytical Hierarchy Process and the least-cost path analysis, application in Sinai Peninsula, Egypt. Egypt. J. Remote Sens. Space Sci. 2013, 16, 141–151. [Google Scholar] [CrossRef] [Green Version]
  58. Fadlalla, R.; Elsheikh, A. Physical Land Suitability Assessment Based On FAO Framework. IOSR J. Eng. 2016, 6, 1–36. [Google Scholar]
  59. FAO. Land suitability classifications. In A Framework for Land Evaluation; FAO: Roma, Italy, 1976; ISBN 9251001111. [Google Scholar]
  60. Higgins, G.M.; Kassam, A.H. The FAO Agro-ecological zone approach to determination of land potential. Pedologie 1981, 2, 147–168. [Google Scholar]
  61. He, Y.; Zhou, Y.; Cai, W.; Wang, Z.; Duan, D.; Luo, S.; Chen, J. Using a process-oriented methodology to precisely evaluate temperature suitability for potato growth in China using GIS. J. Integr. Agric. 2017, 16, 1520–1529. [Google Scholar] [CrossRef] [Green Version]
  62. Djaenudin, D.; Hidayat, A.; Suhardjo, H. Petunjuk Teknis Evaluasi Lahan untuk Komoditas Pertanian; Edisi Kedua Tahun: Bogor, Indonesia, 2011; ISBN 9786028977319. [Google Scholar]
  63. Ospina Sangama, P.G. Determinar la Zona Agroecológica Apta para el cultivo de papa en Funza-Cundinamarca Usando un Sistema de Información Geográfica (SIG). Bachelor’s Thesis, Universidad Militar Granada, Bogotá, Colombia, 2017. [Google Scholar]
  64. Roger, K.E.; Bernard, P.K.Y.; Georges, K.K. Soil physico-chemical properties and land suitability evaluation for maize (Zea mays), beans (Phaseolus vulgaris) and Irish potatoes (Solanum tuberosum) in tephra soils of the western slopes of mount Kupe (Cameroon). Afr. J. Agric. Res. 2016, 11, 4571–4583. [Google Scholar] [CrossRef] [Green Version]
  65. Arias, K.; Arnaude de Chacón, O. Effect of the fertilization chemical, organic and combined on the yield of variety Granola. Agron. Trop. 2010, 60, 75–84. [Google Scholar]
  66. Achu, A.L.; Thomas, J.; Reghunath, R. Multi-criteria decision analysis for delineation of groundwater potential zones in a tropical river basin using remote sensing, GIS and analytical hierarchy process (AHP). Groundw. Sustain. Dev. 2020, 10, 100365. [Google Scholar] [CrossRef]
  67. Francisco, H.R.; Fabrício Corrêia, A.; Feiden, A. Classification of Areas Suitable for Fish Farming Using Geotechnology and Multi-Criteria Analysis. Int. J. Geo Inf. 2019, 8, 394. [Google Scholar] [CrossRef] [Green Version]
  68. Calle Yunis, C.R.; Salas López, R.; Cruz, S.M.; Barboza Castillo, E.; Silva López, J.O.; Iliquín Trigoso, D.; Rojas, B.N. Land suitability for sustainable aquaculture of rainbow trout (Oncorhynchus mykiss) in molinopampa (Peru) based on RS, GIS, and AHP. Isprs Int. J. Geo Inf. 2020, 9, 28. [Google Scholar] [CrossRef] [Green Version]
  69. Aguarón, J.; Moreno-Jiménez, J.M. The geometric consistency index: Approximated thresholds. Eur. J. Oper. Res. 2003, 147, 137–145. [Google Scholar] [CrossRef]
  70. Bozóki, S.; Rapcsák, T. On Saaty’s and Koczkodaj’s inconsistencies of pairwise comparison matrices. J. Glob. Optim. 2008, 42, 157–175. [Google Scholar] [CrossRef] [Green Version]
  71. Duc, T.T. Using GIS and AHP technique for land-use suitability analysis. In International Symposium on Geoinformatics for Spatial Infrastructure Development in Earth and Allied Sciences; Japan-Vietnam Geoinformatics Consortium Institute for Environment and Resources: Ho Chi Minh, Vietnam, 2006; pp. 1–6. [Google Scholar]
  72. Garbanzo-León, G.; Alemán-Montes, B.; Alvarado-Hernández, A.; Henríquez-Henríquez, C. Validación de modelos geoestadísticos y convencionales en la determinación de la variación espacial de la fertilidad de suelos del Pacífico Sur de Costa Rica. Investig. Geogr. 2017, 2017, 20–41. [Google Scholar] [CrossRef]
  73. Li, Q.; Wang, C.; Dai, T.; Shi, W.; Zhang, X.; Xiao, Y.; Song, W.; Li, B.; Wang, Y. Prediction of soil cadmium distribution across a typical area of Chengdu Plain, China. Sci. Rep. 2017, 7, 7115. [Google Scholar] [CrossRef]
  74. Gallardo, A. Geostadística. Rev. Ecosistemas 2006, 15, 5. [Google Scholar]
  75. FAO. Factores que condicionan la producción. In El Cultivo Protegido en Clima Mediterráneo; FAO: Roma, Italy, 2002; ISBN 9253027193. [Google Scholar]
  76. Rodriguez, J.Q.; Quezada, U.R.; Benavides, R.A.; Medrano, J.A. Determinación de coeficientes de uso consuntivo (Kc) en cultivo de papa (Solanum tuberosum) por el método lisimétrico en el valle del Mantaro. PURIQ 2020, 2, 290–306. [Google Scholar]
  77. Barboza Castillo, E.; Turpo Cayo, E.Y.; de Almeida, C.M.; Salas López, R.; Rojas Briceño, N.B.; Silva López, J.O.; Barrena Gurbillón, M.Á.; Oliva, M.; Espinoza-Villar, R. Monitoring Wildfires in the Northeastern Peruvian Amazon Using Landsat-8 and Sentinel-2 Imagery in the GEE Platform. ISPRS Int. J. Geo Inf. 2020, 9, 564. [Google Scholar] [CrossRef]
  78. Lara, E.L.; Rasche, L.; Schneider, U.A. Modeling land suitability for Coffea arabica L. in Central America. Environ. Model. Softw. 2017, 95, 196–209. [Google Scholar] [CrossRef]
  79. Akinci, H.; Özalp, A.Y.; Turgut, B. Agricultural land use suitability analysis using GIS and AHP technique. Comput. Electron. Agric. 2013, 97, 71–82. [Google Scholar] [CrossRef]
  80. MINAM. GEOBOSQUES: Bosque y Pérdida de Bosque. Available online: http://geobosques.minam.gob.pe/geobosque/view/perdida.php (accessed on 6 October 2020).
  81. Figueroa, J.; Stucchi, M.; Rojas-VeraPinto, R. Modelación de la distribución del oso andino Tremarctos ornatus en el bosque seco del Marañón (Perú). Rev. Mex. Biodivers. 2016, 87, 230–238. [Google Scholar] [CrossRef] [Green Version]
Figure 1. Location of the Jucusbamba and Tincas microwatersheds in the province of Luya, Amazonas (NW Peru).
Agronomy 10 01898 g001
Figure 2. Research framework for land suitability modelling for potato cultivation in the Jucusbamba and Tincas microwatersheds (Amazonas, NW Peru).
Agronomy 10 01898 g002
Figure 3. Variable hierarchization for land suitability modelling for potato cultivation in the Jucusbamba and Tincas microwatersheds (Amazonas, NW Peru).
Agronomy 10 01898 g003
Figure 4. Thematic maps for climatological subcriteria (a,b), topographical subcriteria (ce) and socioeconomic subcriteria (fh) for land suitability modelling for potato cultivation in the Jucusbamba and Tincas microwatersheds (Amazonas, NW Peru).
Agronomy 10 01898 g004
Figure 5. Thematic maps for each edaphological sub criterion for land suitability modelling for potato cultivation in the Jucusbamba and Tincas microwatersheds (Amazonas, NW Peru).
Agronomy 10 01898 g005
Figure 6. Submodels of land suitability for potato cultivation in the micro-basins of Jucusbamba and Tincas, Amazonas (NW Peru).
Agronomy 10 01898 g006
Figure 7. Land Suitability Map for potato cultivation in the Jucusbamba and Tincas microwatersheds, Amazonas (NW Peru).
Agronomy 10 01898 g007
Table 1. Subcriteria reclassification and punctuation for land suitability modelling for potato cultivation in the Jucusbamba and Tincas microwatersheds (Amazonas, NW Peru).
Criteria/SubcriteriaHighly Suitable (4) 2Moderately Suitable (3) 2Marginally Suitable (2) 2Not Suitable (1) 2Adapted from
Climatological
Mean annual temperature (°C)9–1111–1515–18<9/>18[29,30,46,61,62]
Mean annual precipitation (mm)1000–12001000–800
1200–1300
800–500
1300–1400
<500
>1400
[20,43,46]
Topographical
Elevation (m a.s.l.)2600–23002300–2000
2600–3500
2000–1500
3500–4500
<1500
>4500
[29,43,46]
Slope (°)0–1213–1818–25>25[24,30,43,46]
AspectSW, planaS, SEE, WNW, NE, N[33,35]
Socioeconomical
LULCForestPastures and cropGrasslandsUrban areas and bodies of water[63]
Distance to rivers (km)<0.50.5–1.51.5–2>2[33]
Distance to roads (km)<0.50.5–1.51.5–3.0>3.0[33]
Edaphological
Texture 1L, SL, SiLCL, SiCL, SCSi, LS, SiCS, C[43]
pH5.5–75–5.5/7–7.54–5/7.5–8<4 / >8[46,64]
SOM (%)5–105–2.52.5–1<1[46,64]
N (%)>0.300.225–0.300.125–0.225<0.125[46,64,65]
P (ppm)20–4015–20/>4015–10<10[43,64]
K (ppm)>350200–350100–200<100[21,46,64]
CEC (cmol(+)/kg)30–5050–60/30–2060–70/20–10>70/<10[64]
EC (dS/m)<44–66–8>8[21,64]
1 L: Loam; SL: Sandy Loam; SiL: Silt Loam; CL: Clay Loam; SiCL: Silty Clay Loam; SC: Sandy Clay; S: Sand; C: Clay; SiC: Silty Clay; LS: Loamy Sand; Si: Silt. 2 Pixel value of the map reclassified according to the four levels of land suitability.
Table 2. Saaty scale for pairwise comparison between the criteria in the AHP.
1/91/71/51/313579
ExtremelyFarSlightlyEqually importantSlightlyFarExtremely
Less importantMore important
Table 3. Random Index (RI) value for each “n” in the AHP.
n12345678910111213141516
IA000.5250.8821.1151.2521.3411.4041.4521.4841.5131.5351.5551.5701.5831.595
Table 4. Descriptive statistical analysis of soil properties in the study area (n = 72) in the Jucusbamba and Tincas microwatersheds (Amazonas, NW Peru).
pHEC
(dS/m)
SOM
(%)
Log SOMN
(%)
P
(ppm)
K
(ppm)
Log
P
CEC
(cmol(+)/kg)
Sand
(%)
Silt
(%)
Clay
(%)
Mean6.860.235.820.710.269.26207.290.7424.8648.5217.7333.75
Median7.630.145.480.740.255.20194.000.7230.5050.0016.0030.60
Minimum2.840.011.410.150.040.2826.40−0.554.0010.005.307.30
Maximum8.790.6635.301.550.5466.30476.191.8239.0582.0056.0078.70
Std. dev1.540.184.050.220.1110.89114.050.4711.7718.587.2718.05
CV (%) 122.4778.2669.70 44.13117.5155.02 47.3338.3041.0153.47
Skewness 2−0.670.535.500.080.243.110.34−0.44−0.57−0.272.060.48
Kurtosis−0.95−0.9937.112.55−0.5311.54−0.720.55−1.31−0.779.00−0.65
1 Coefficient of variation: <15 = low variation, 15–35 = moderate variation, >35 = high variation [21,29,30]. 2 Skewness: <│− + 0.5│ = normal distribution, 0.5–1.0 = application of character changing for dataset, and >1, 0 → application of logarithmic change [21].
Table 5. Best performing semivariogram model for each physical chemical soil property in the Jucusbamba and Tincas microwatershed (NW Peru).
Physical Chemical PropertySemivariogram ModelR2MBEMABERMSEt-Student
pHGaussian0.6500.1990.8731.0640.505
NGaussian0.0780.0730.1050.1210.018
PSpherical0.2992.1577.7429.1650.398
KLinear0.40320.078100.195116.2220.538
SOMGaussian0.0811.4442.1022.4080.018
ECGaussian0.3930.0980.1540.1780.035
CECExponential0.796-0.7695.6436.8410.690
SandGaussian0.481-0.24711.51614.8440.953
ClayExponential0.6071.56011.25212.8240.666
SiltLinear0.021-1.6664.9516.0530.321
Table 6. Importance weights for each criteria and subcriteria for land suitability modelling for potato cultivation in the Jucusbamba and Tincas microwatersheds, Amazonas (NW Peru).
CriteriaWeightRankingSubcriteriaWeightRankingStandardized WeightStandardized Ranking
Climatological30.141Temperature42.08312.682
Precipitation57.92117.461
Topographical25.723Slope54.75114.082
Elevation31.0627.994
Aspect14.2033.6513
Socioeconomical14.984LULC47.6417.145
Distance to roads26.5633.989
Distance to rivers25.8023.8612
Edaphological29.162Texture9.2482.6916
pH14.4924.237
SOM16.5114.816
N13.9834.088
P13.4343.9210
K13.4253.9111
EC9.4272.7515
CEC9.5262.7814
Table 7. Consistency Ratio (CR) of Pairwise Comparison Matrix (PCM).
RatioCriteriaClimatological SubcriteriaTopographical SubcriteriaSocioeconomical SubcriteriaEdaphological Subcriteria
n42348
RI0.8820.000.5250.8821.404
λ m a x 3.992-3.0424.2638.403
CI0.031-0.0210.0880.058
CR0.037Consistent and acceptable0.0400.0220.041
Table 8. Land suitability according to criteria and subcriteria for potato cultivation in the Jucusbamba and Tincas microwatersheds (NW Peru).
Criteria/SubcriteriaHighly
Suitable (4)
Moderately
Suitable (3)
Marginally
Suitable (2)
Not Suitable (1)
km2%km2%km2%km2%
Climatological34.3012.3217.6478.321.457.70.000.0
Temperature47.3917.0140.1850.484.4630.41.360.5
Precipitation105.9838.1104.6537.647.8317.214.925.4
Topographical89.6532.272.8326.272.2226.038.6913.9
Slope102.7637.058.7921.145.6116.466.2323.8
Elevation92.1733.2107.5338.768.7324.74.961.8
Aspect27.8610.082.2729.677.3227.885.9530.9
Socioeconomical96.4134.7124.1544.750.6818.22.150.8
LULC129.6146.655.7520.151.1718.436.8613.3
Distance rivers157.0556.571.7025.834.4212.410.223.7
Distance to roads117.6142.375.4227.158.8321.221.537.7
Edaphological12.724.6126.5245.5134.1548.20.000.0
Texture92.1433.118.176.5105.6138.057.4720.7
pH104.3937.5112.7740.656.2320.20.000.0
SOM129.6346.6143.6451.70.070.00.050.0
N261.9494.211.384.10.060.00.010.0
P49.4717.841.6615.046.4916.7135.7848.8
K0.830.3173.5162.499.0635.60.000.0
CEC59.4821.4116.0241.782.3729.615.525.6
CE83.7730.197.0334.991.9933.10.600.2
Publisher’s Note: MDPI stays neutral with regard to jurisdictional claims in published maps and institutional affiliations.

