
Land Suitability for Cocoa Cultivation in Peru: AHP and MaxEnt Modeling in a GIS Environment

 , ,
, ,  , , ,
, , ,  and
and 
Abstract
:1. Introduction
2. Materials and Methods
2.1. Study Area and Methodology Framework
2.2. Identification and Mapping of Criteria for Cocoa Cultivation
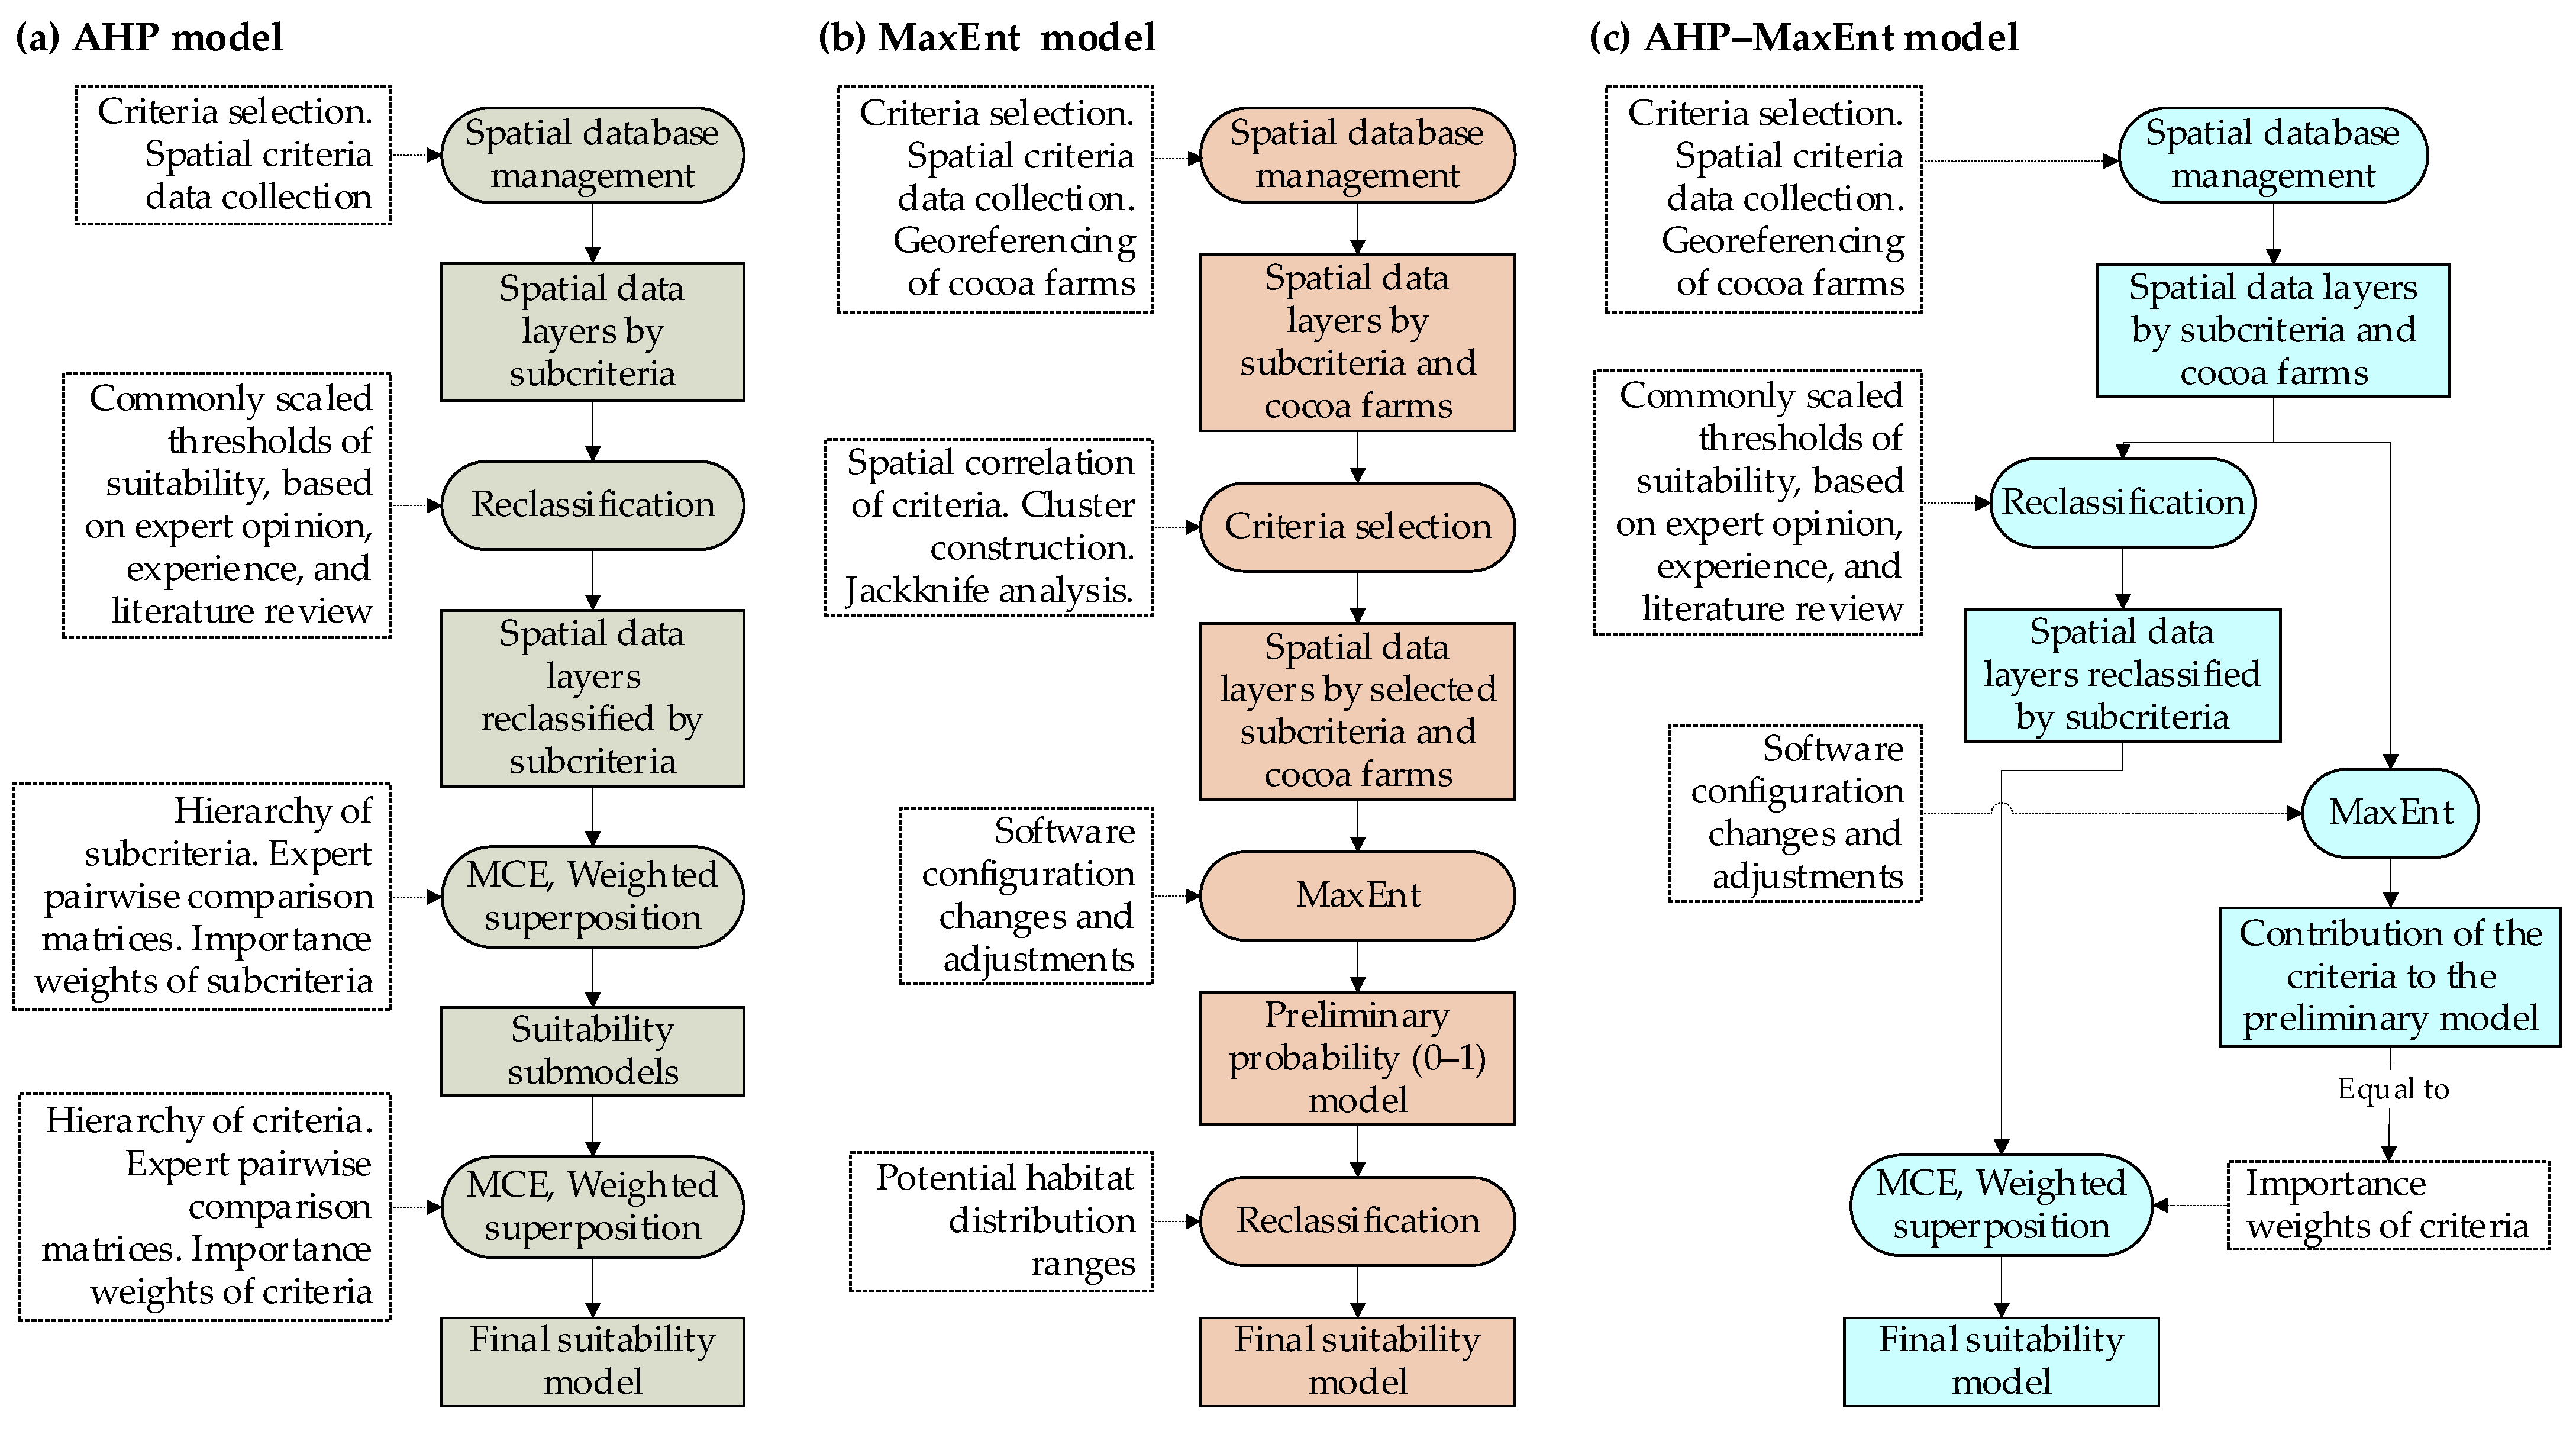
2.3. Modelling Approach with the Analytical Hierarchical Process—AHP
2.3.1. Construction of Hierarchies and Thresholds of Criteria Suitability
2.3.2. Determination of Importance Weights of Criteria
2.3.3. AHP Sub-Model Generation and AHP Suitability Modeling
2.4. Modelling Approach with Maximum Entropy—MaxEnt
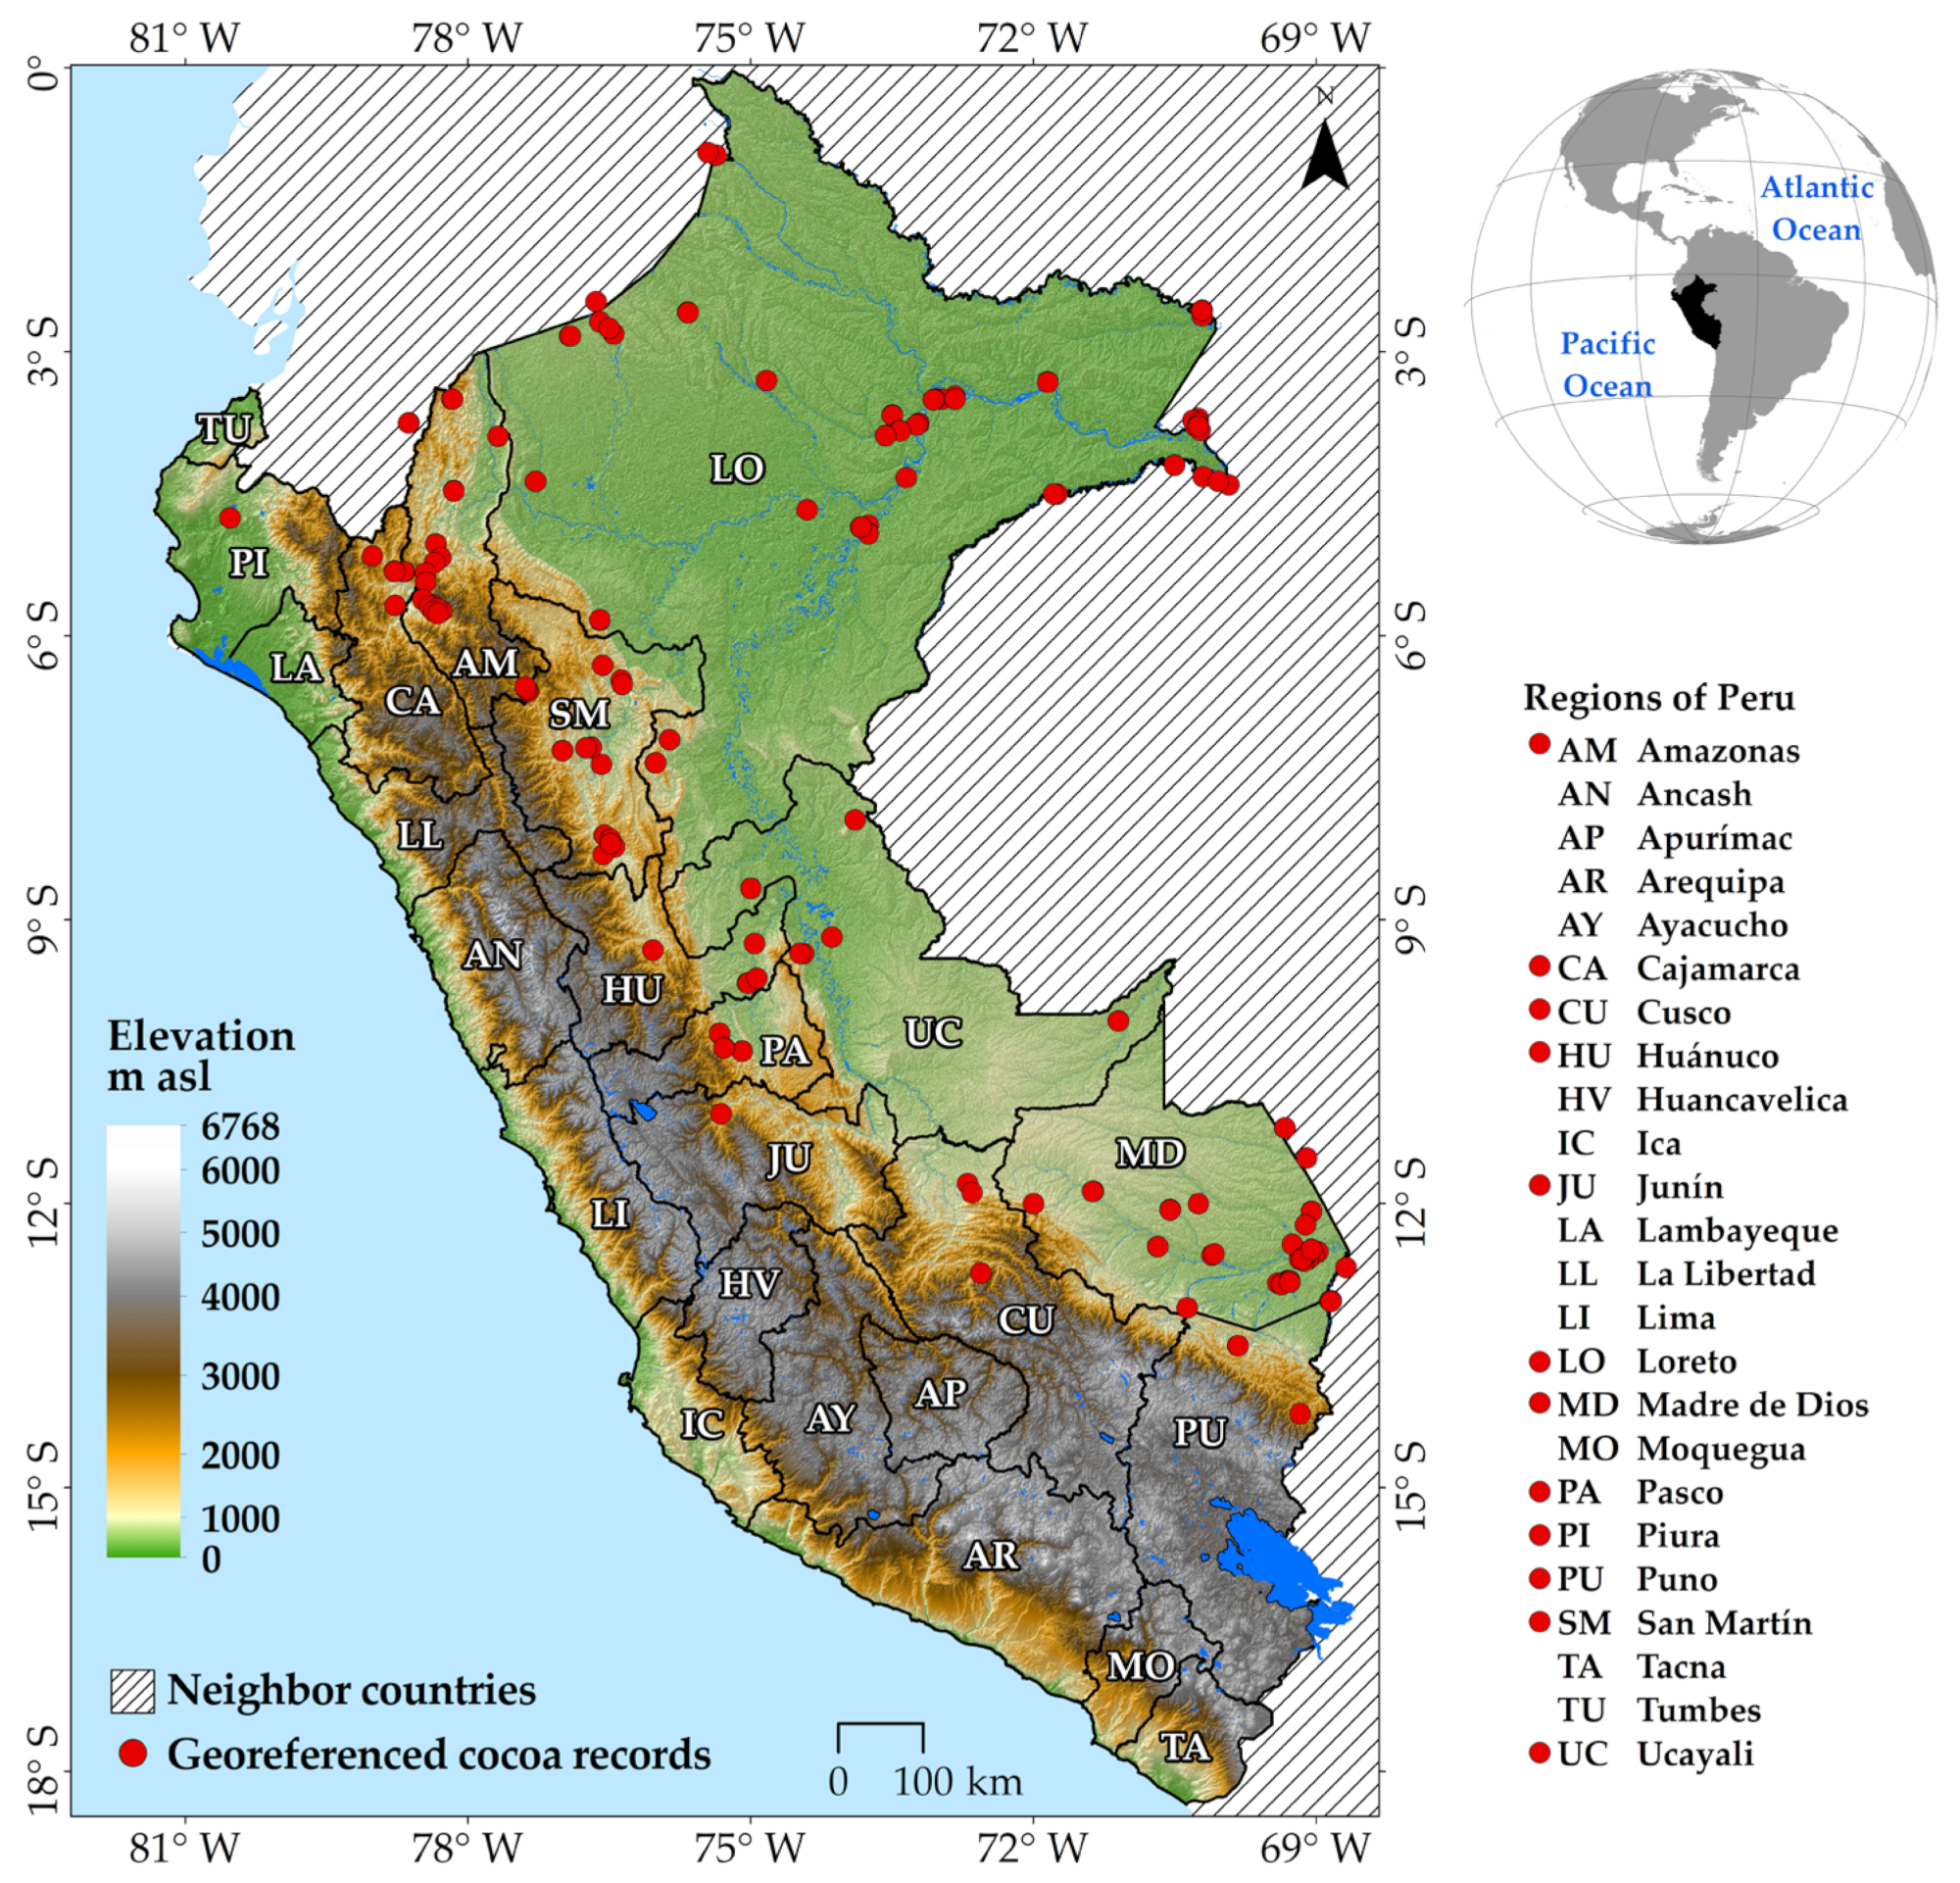
2.4.1. Georeferenced Cocoa Records
2.4.2. Selection of Environmental Criteria
2.4.3. Modelling the Potential Distribution
2.5. AHP–MaxEnt Modeling Approach
3. Results
3.1. Model Based on the Analytical Hierarchical Process—AHP
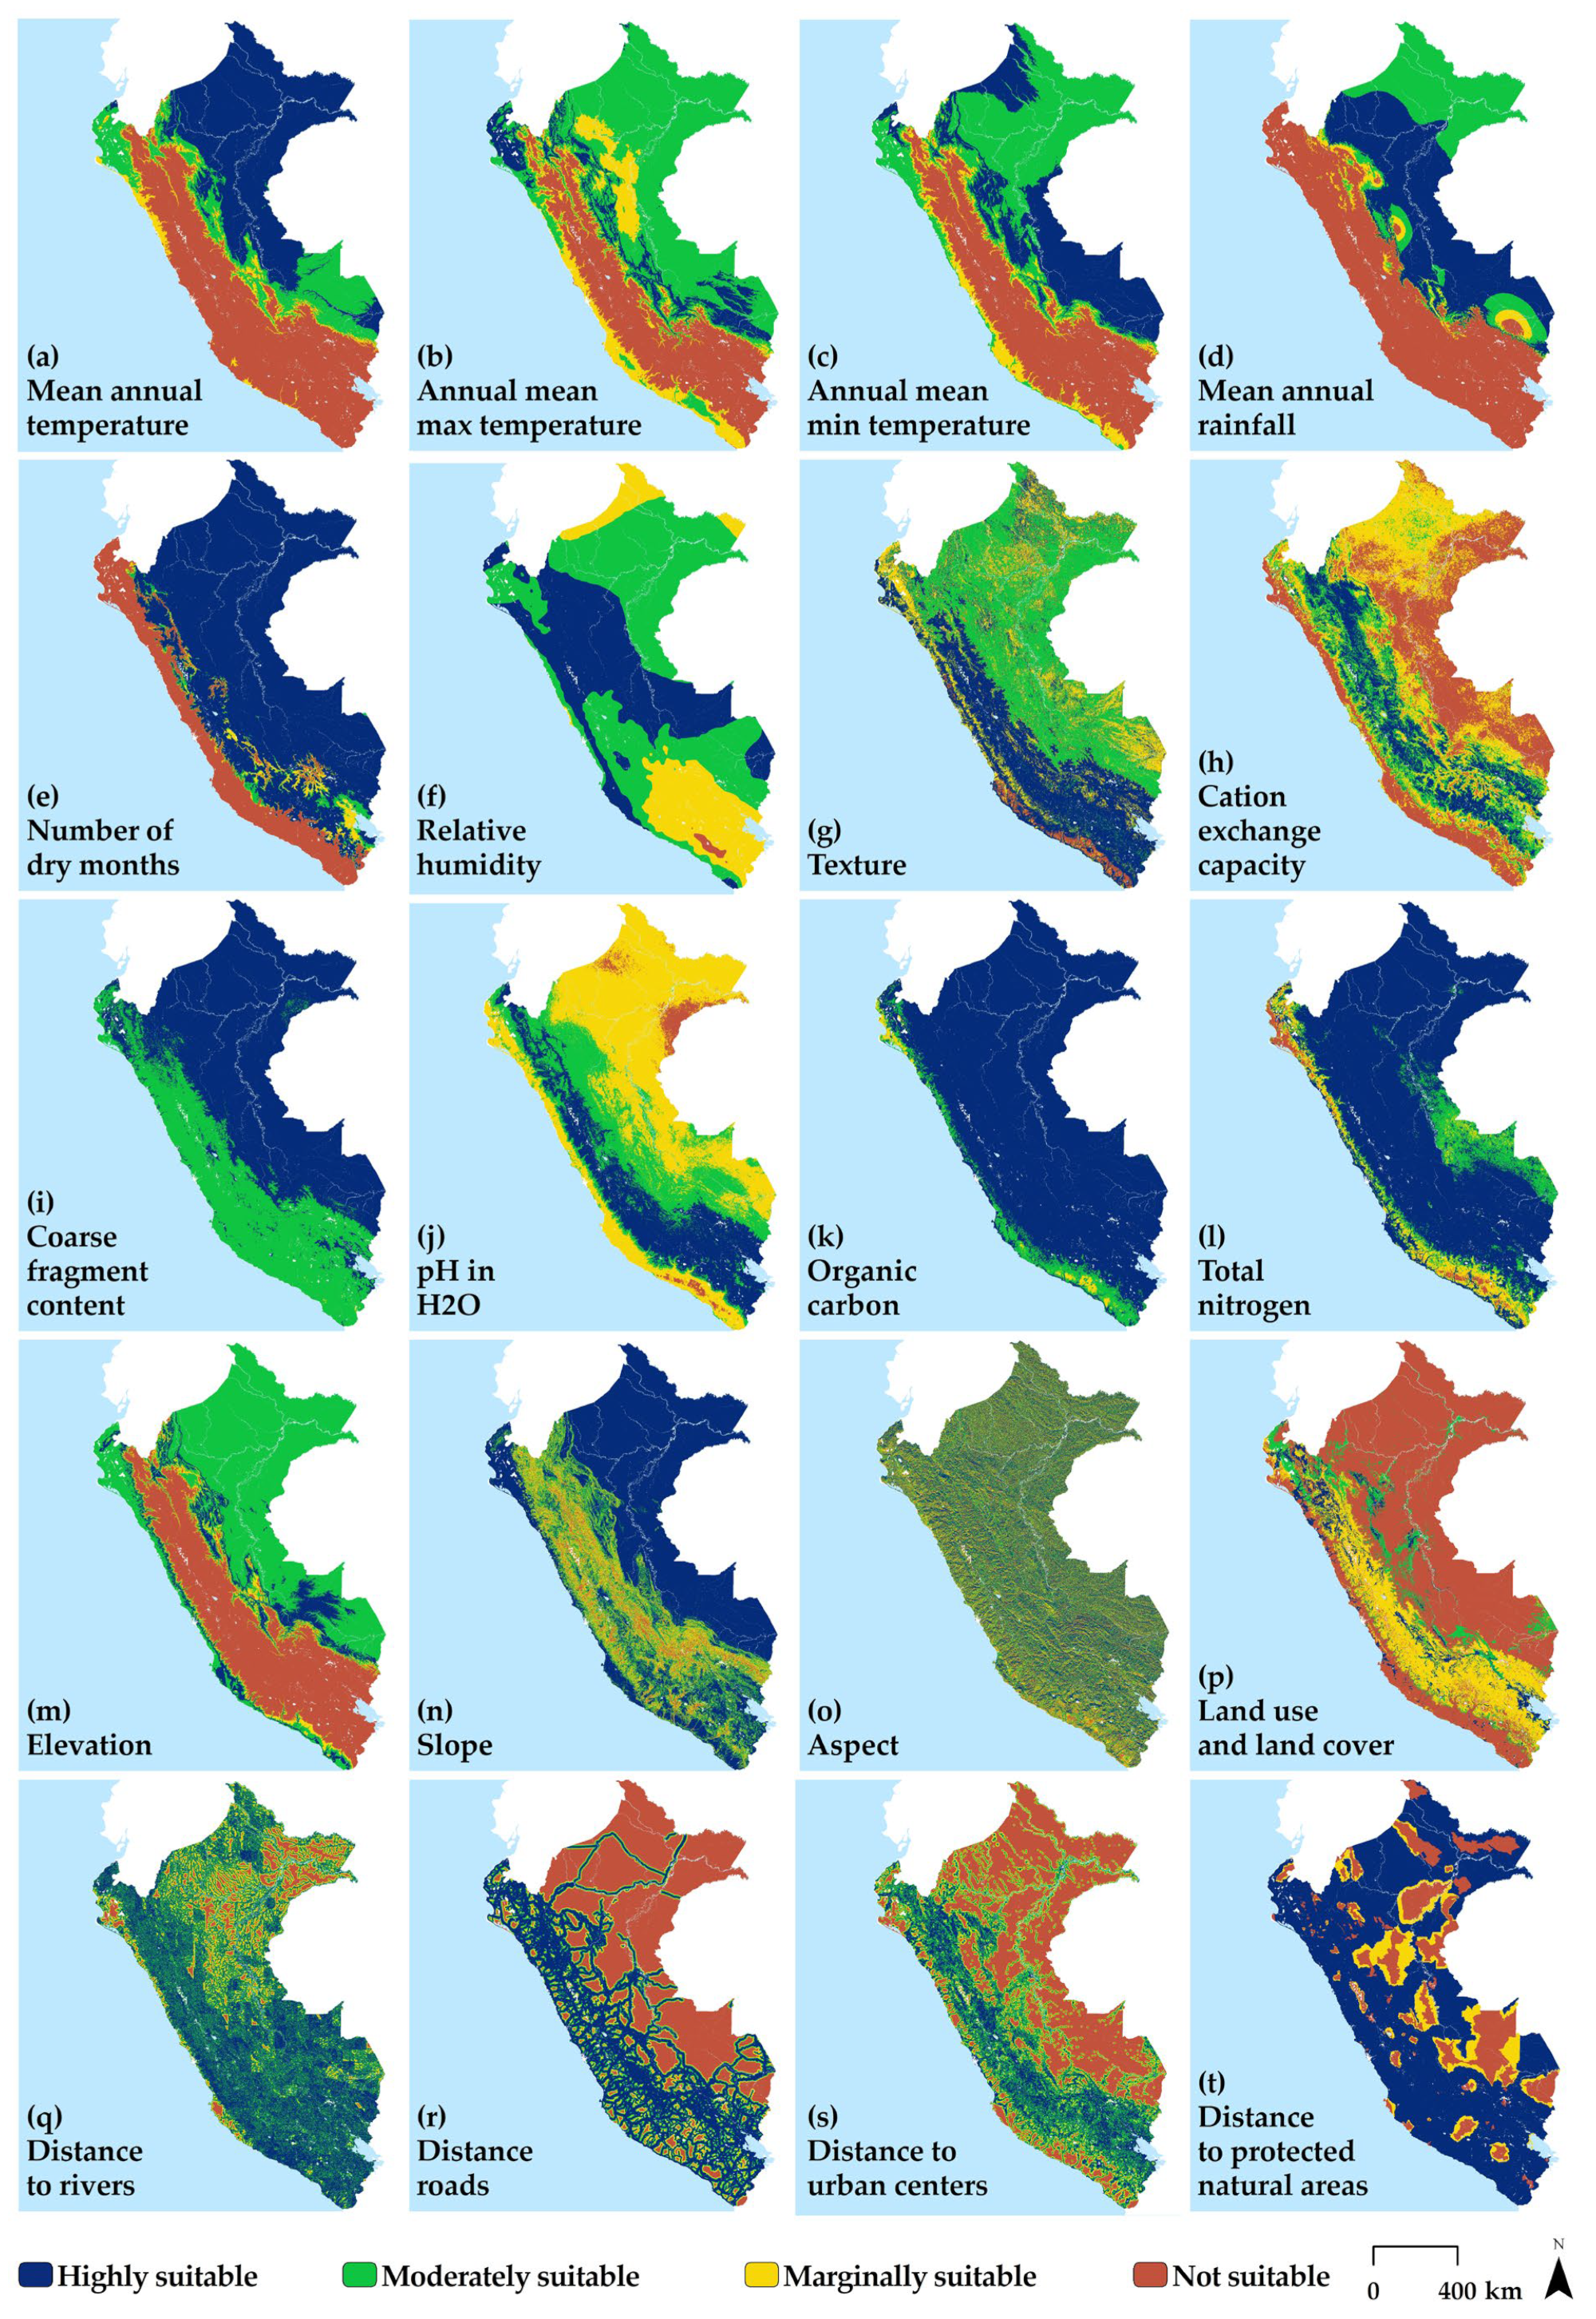
3.1.1. Suitability Map of Subcriteria
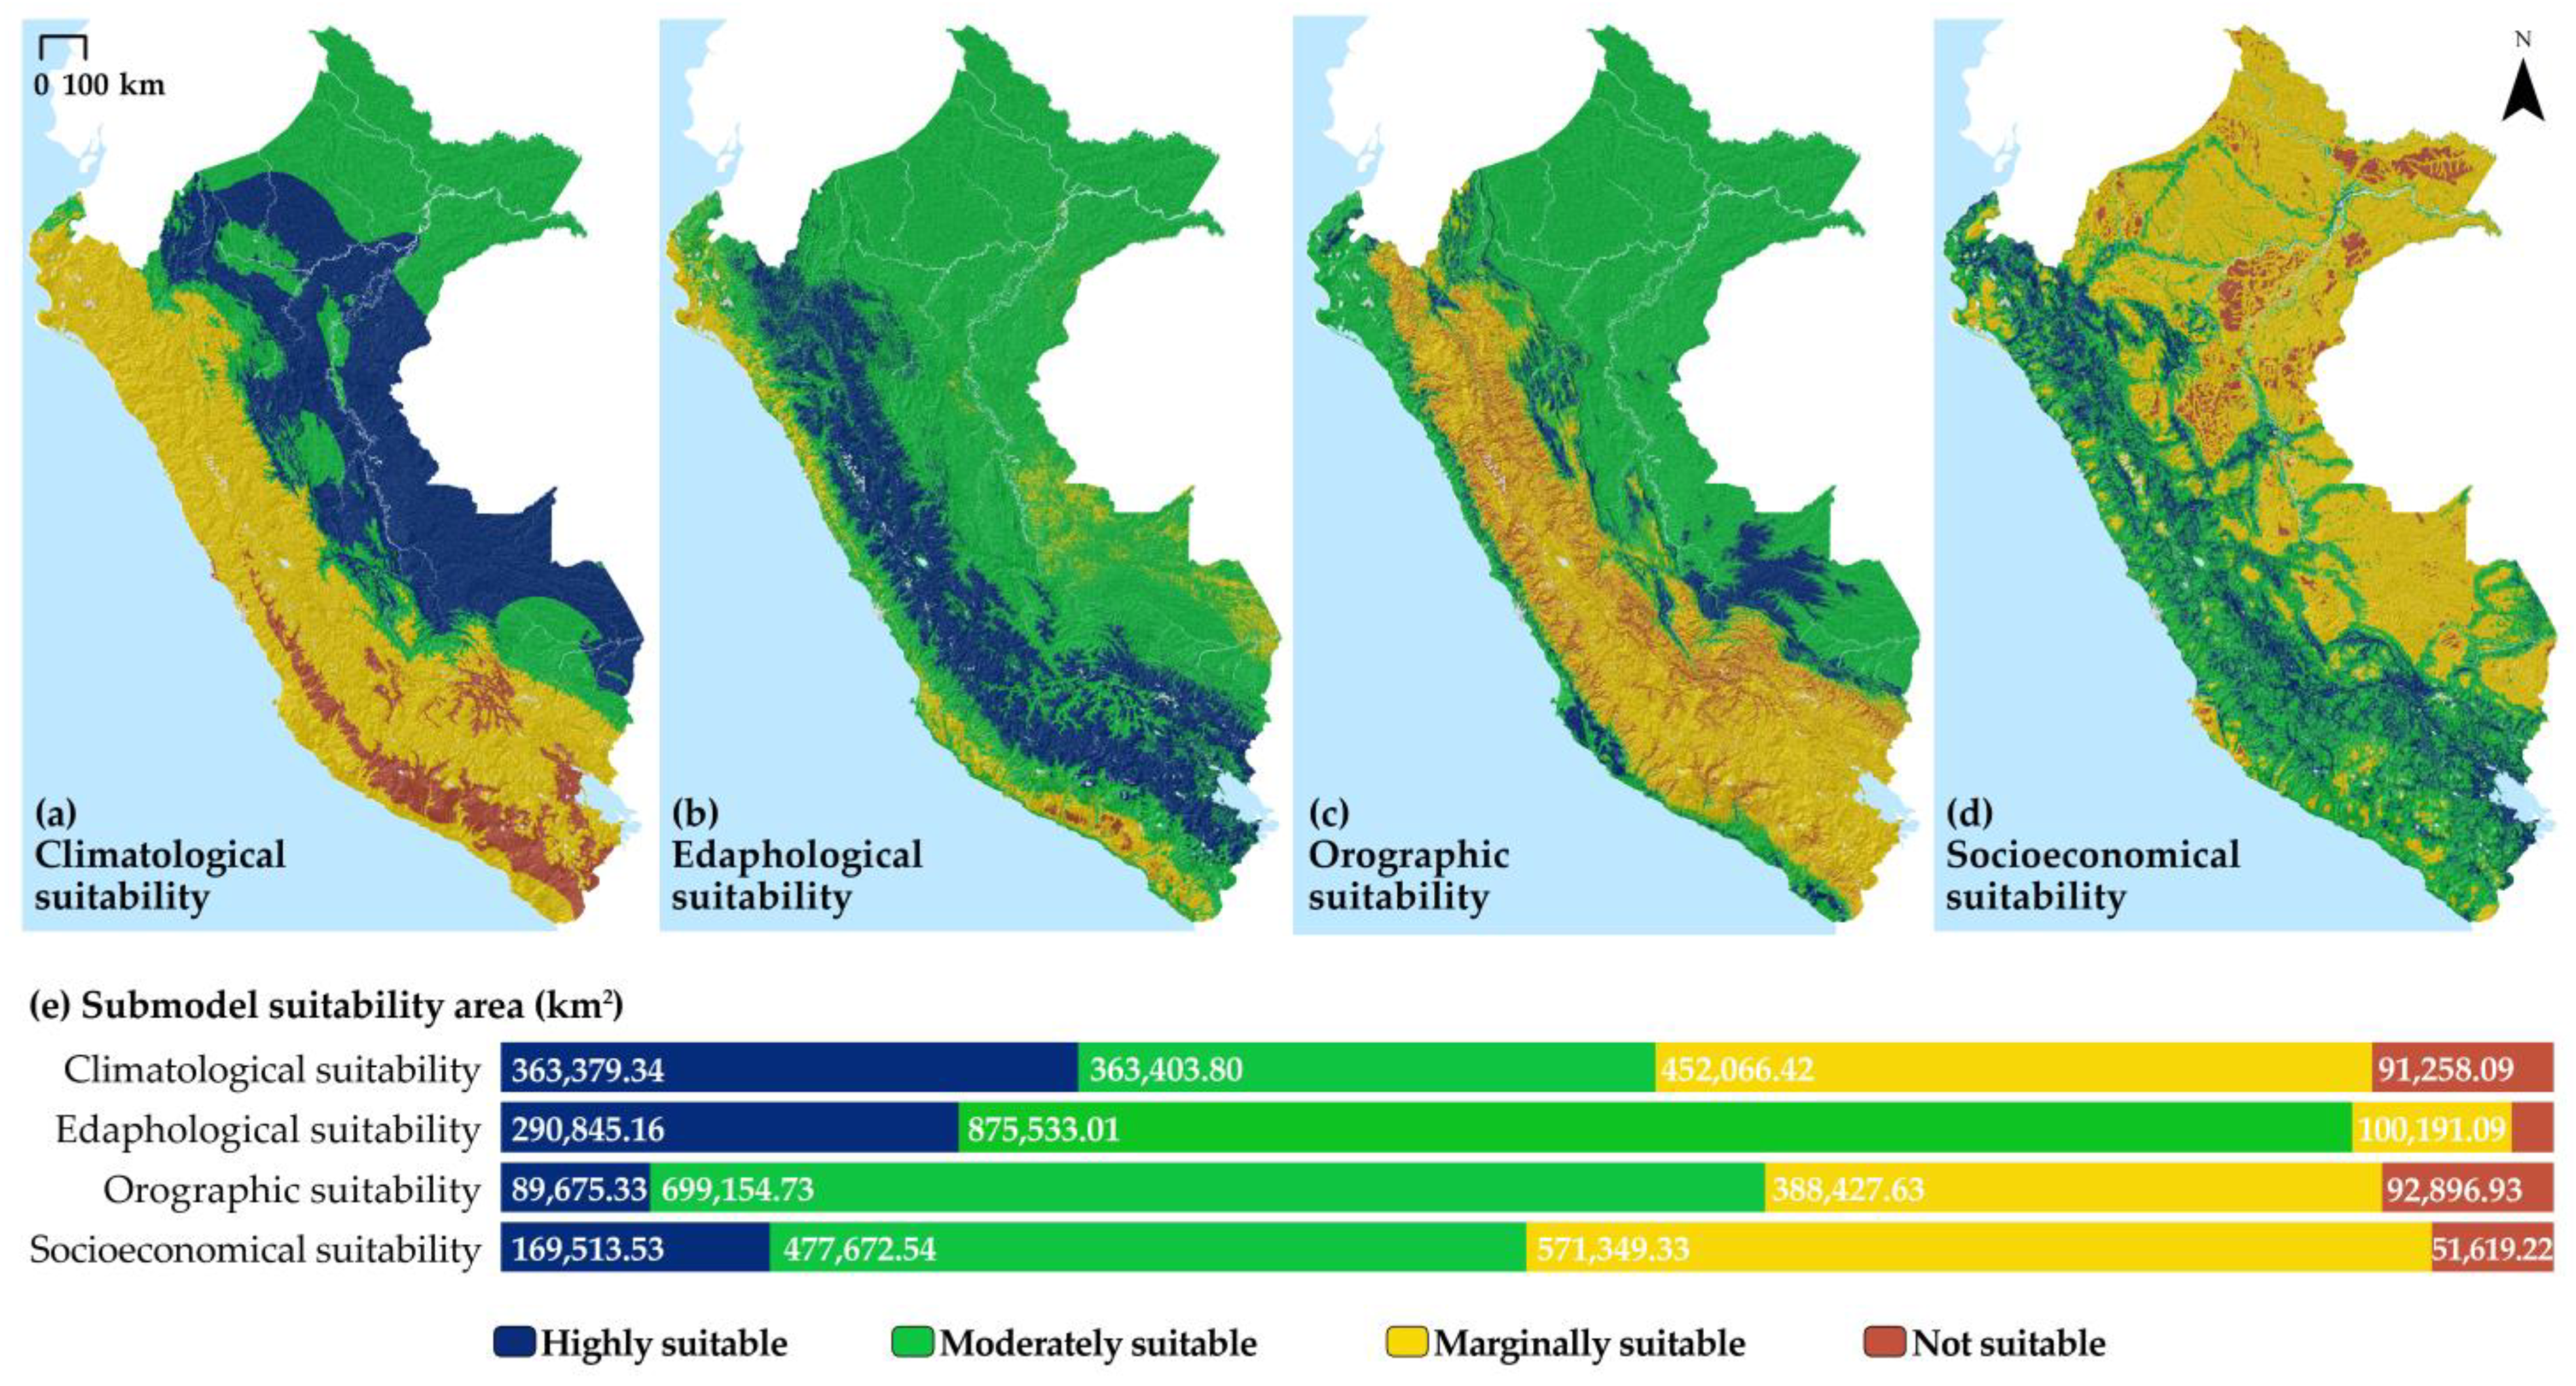
3.1.2. Submodels and Land Suitability Models
3.2. Maximum Entropy Model—Maxent
3.2.1. Model Performance and Importance of Sub-Criteria
3.2.2. Potential Distribution
3.3. Model Based on AHP–MaxEnt
3.3.1. Importance and/or Weights of Subcriteria
3.3.2. Land Suitability Model
4. Discussion
5. Conclusions
Author Contributions
Funding
Data Availability Statement
Acknowledgments
Conflicts of Interest
Appendix A

| Criteria/Subcriteria | Highly Suitable | Moderately Suitable | Marginally Suitable | Not Suitable | ||||
|---|---|---|---|---|---|---|---|---|
| km2 | % | km2 | % | km2 | % | km2 | % | |
| Climatological | ||||||||
| Mean annual temperature | 495,696.05 | 38.5 | 211,336.61 | 16.4 | 61,939.16 | 4.8 | 501,135.87 | 38.9 |
| Annual mean min temperature | 323,401.20 | 25.1 | 433,151.18 | 33.6 | 95,775.96 | 7.4 | 417,779.31 | 32.4 |
| Annual mean max temperature | 124,463.94 | 9.7 | 610,457.37 | 47.4 | 177,066.49 | 13.7 | 358,119.86 | 27.8 |
| Mean annual rainfall | 402,160.95 | 31.2 | 275,838.57 | 21.4 | 46,432.18 | 3.6 | 545,675.95 | 42.3 |
| Number of dry months | 970,538.09 | 75.3 | 39,724.27 | 3.1 | 38,972.61 | 3.0 | 220,872.67 | 17.1 |
| Relative humidity | 422,733.62 | 32.8 | 604,382.27 | 46.9 | 236,748.40 | 18.4 | 6319.39 | 0.5 |
| Edaphological at 0.30 m | ||||||||
| pH in H2O | 284,809.84 | 22.1 | 333,425.91 | 25.9 | 615,584.49 | 47.8 | 36,363.58 | 2.8 |
| Texture | 463,633.52 | 36.0 | 534,435.04 | 41.5 | 250,084.29 | 19.4 | 22,031.38 | 1.7 |
| Coarse fragment content | 812,754.45 | 63.1 | 456,692.84 | 35.4 | 736.40 | 0.1 | 0.0 | 0.0 |
| Organic carbon | 1,178,174.42 | 91.4 | 78,533.32 | 6.1 | 13,476.01 | 1.0 | 0.0 | 0.0 |
| CEC | 190,558.84 | 14.8 | 221,422.78 | 17.2 | 418,014.65 | 32.4 | 440,187.65 | 34.2 |
| Total nitrogen | 1,025,291.05 | 79.6 | 144,885.17 | 11.2 | 79,769.70 | 6.2 | 20,238.07 | 1.6 |
| Orographic | ||||||||
| Elevation | 112,490.36 | 8.7 | 662,751.90 | 51.4 | 56,421.60 | 4.4 | 438,500.97 | 34.0 |
| Slope | 814,094.16 | 63.2 | 210,170.69 | 16.3 | 199,388.82 | 15.5 | 46,510.98 | 3.6 |
| Aspect | 464,149.07 | 36.0 | 327,161.32 | 25.4 | 320,736.76 | 24.9 | 158,118.11 | 12.3 |
| Socioeconomical | ||||||||
| LULC | 73,007.50 | 5.7 | 117,842.57 | 9.1 | 254,814.97 | 19.8 | 824,499.95 | 64.0 |
| Distance to urban centers | 259,032.66 | 20.1 | 323,477.46 | 25.1 | 160,753.82 | 12.5 | 526,900.84 | 40.9 |
| Distance to roads | 465,633.65 | 36.1 | 153,914.95 | 11.9 | 87,072.91 | 6.8 | 563,562.33 | 43.7 |
| Distance to rivers | 615,475.80 | 47.8 | 437,734.36 | 34.0 | 148,793.14 | 11.5 | 68,180.82 | 5.3 |
| Distance to protected natural areas | 911,644.79 | 70.7 | 0.00 | 0.0 | 133,880.37 | 10.4 | 224,658.54 | 17.4 |
| Regions | Highly Suitable | Moderately Suitable | Marginally Suitable | Not Suitable | Non-Classified | |||||
|---|---|---|---|---|---|---|---|---|---|---|
| km2 | % | km2 | % | km2 | % | km2 | % | km2 | % | |
| Amazonas | 2627.36 | 6.7 | 34,035.21 | 86.6 | 2366.54 | 6.0 | 0.00 | 0.0 | 277.35 | 0.7 |
| Ancash | 0.00 | 0.0 | 24,959.06 | 69.4 | 9987.54 | 27.8 | 0.00 | 0.0 | 1015.65 | 2.8 |
| Apurímac | 0.00 | 0.0 | 14,305.92 | 67.8 | 6729.24 | 31.9 | 0.00 | 0.0 | 78.99 | 0.4 |
| Arequipa | 0.00 | 0.0 | 21,537.55 | 34.0 | 40,332.23 | 63.8 | 496.06 | 0.8 | 890.04 | 1.4 |
| Ayacucho | 12.82 | 0.0 | 27,761.70 | 63.8 | 15,582.39 | 35.8 | 3.90 | 0.0 | 143.01 | 0.3 |
| Cajamarca | 255.28 | 0.8 | 26,147.56 | 79.1 | 6502.76 | 19.7 | 0.00 | 0.0 | 139.07 | 0.4 |
| Callao | 0.00 | 0.0 | 51.47 | 36.4 | 7.45 | 5.3 | 0.00 | 0.0 | 82.49 | 58.3 |
| Cusco | 2351.81 | 3.3 | 52,497.77 | 72.8 | 16,216.07 | 22.5 | 0.00 | 0.0 | 1010.49 | 1.4 |
| Huancavelica | 0.00 | 0.0 | 16,789.43 | 76.1 | 5165.07 | 23.4 | 0.00 | 0.0 | 110.54 | 0.5 |
| Huánuco | 1928.73 | 5.2 | 31,166.61 | 83.8 | 3852.00 | 10.4 | 0.00 | 0.0 | 253.19 | 0.7 |
| Ica | 0.00 | 0.0 | 8653.51 | 41.0 | 12,269.83 | 58.2 | 0.79 | 0.0 | 156.63 | 0.7 |
| Junín | 2128.12 | 4.8 | 36,898.31 | 83.9 | 4512.84 | 10.3 | 0.00 | 0.0 | 458.03 | 1.0 |
| La Libertad | 0.00 | 0.0 | 15,465.58 | 61.1 | 9700.39 | 38.3 | 0.00 | 0.0 | 130.00 | 0.5 |
| Lambayeque | 0.00 | 0.0 | 7683.17 | 53.6 | 6359.99 | 44.3 | 0.00 | 0.0 | 299.15 | 2.1 |
| Lima | 0.00 | 0.0 | 20,490.05 | 58.6 | 13,274.72 | 37.9 | 0.00 | 0.0 | 1225.23 | 3.5 |
| Loreto | 708.86 | 0.2 | 367,167.06 | 97.9 | 331.10 | 0.1 | 0.00 | 0.0 | 6908.97 | 1.8 |
| Madre De Dios | 1340.31 | 1.6 | 82,533.63 | 97.0 | 640.25 | 0.8 | 0.00 | 0.0 | 531.67 | 0.6 |
| Moquegua | 0.00 | 0.0 | 3993.39 | 25.3 | 11,551.11 | 73.1 | 82.89 | 0.5 | 179.92 | 1.1 |
| Pasco | 646.19 | 2.7 | 21,202.58 | 87.9 | 2092.50 | 8.7 | 0.00 | 0.0 | 172.68 | 0.7 |
| Piura | 0.00 | 0.0 | 20,674.83 | 57.3 | 13,867.65 | 38.5 | 0.00 | 0.0 | 1522.58 | 4.2 |
| Puno | 4.57 | 0.0 | 53,726.91 | 79.1 | 13,068.23 | 19.2 | 0.00 | 0.0 | 1163.11 | 1.7 |
| San Martin | 4732.75 | 9.3 | 40,866.60 | 80.2 | 5099.64 | 10.0 | 0.00 | 0.0 | 262.27 | 0.5 |
| Tacna | 0.00 | 0.0 | 3835.20 | 23.8 | 11,919.89 | 74.1 | 46.4 | 0.3 | 281.58 | 1.8 |
| Tumbes | 0.00 | 0.0 | 4169.10 | 88.9 | 410.28 | 8.7 | 0.00 | 0.0 | 110.89 | 2.4 |
| Ucayali | 2700.82 | 2.6 | 101,423.98 | 96.3 | 143.18 | 0.1 | 0.00 | 0.0 | 1073.78 | 1.0 |
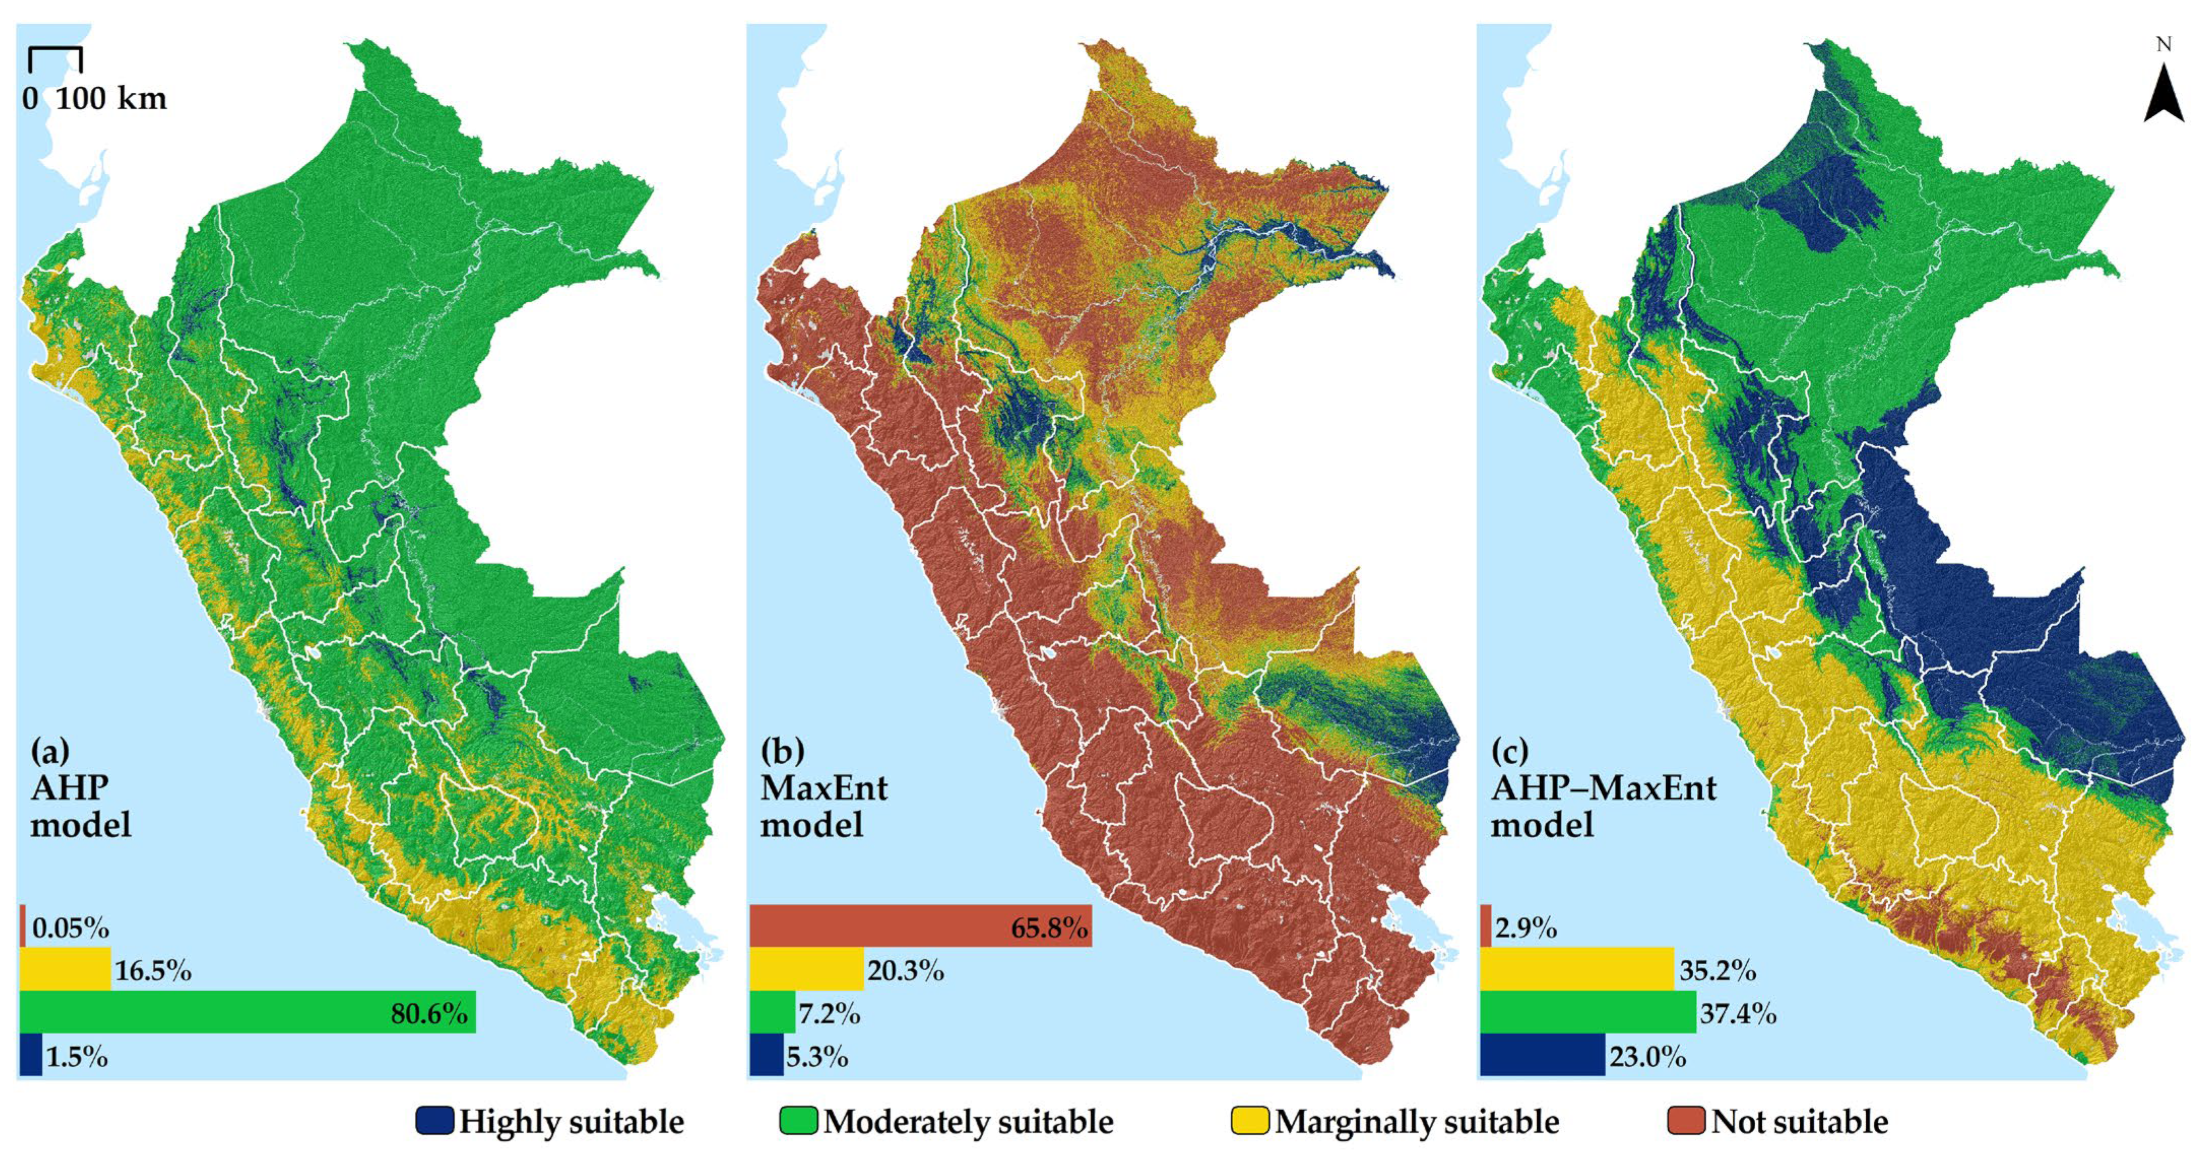
| Perú | 19,437.63 | 1.5 | 1,038,036.17 | 80.6 | 211,982.87 | 16.5 | 630.04 | 0.05 | 18,477.30 | 1.4 |
| Regions | Highly Suitable | Moderately Suitable | Marginally Suitable | Not Suitable | Non-Classified | |||||
|---|---|---|---|---|---|---|---|---|---|---|
| km2 | % | km2 | % | km2 | % | km2 | % | km2 | % | |
| Amazonas | 4107.07 | 10.4 | 8039.43 | 20.5 | 11,974.36 | 30.5 | 14,908.26 | 37.9 | 277.35 | 0.7 |
| Ancash | 39.34 | 0.1 | 80.84 | 0.2 | 231.55 | 0.6 | 34,594.89 | 96.2 | 1015.63 | 2.8 |
| Apurímac | 0.00 | 0.0 | 0.00 | 0.0 | 0.00 | 0.0 | 21,035.16 | 99.6 | 78.99 | 0.4 |
| Arequipa | 0.05 | 0.0 | 0.45 | 0.0 | 5.34 | 0.0 | 62,360.05 | 98.6 | 890.00 | 1.4 |
| Ayacucho | 16.90 | 0.0 | 161.15 | 0.4 | 516.10 | 1.2 | 42,666.66 | 98.1 | 143.02 | 0.3 |
| Cajamarca | 1694.55 | 5.1 | 1000.71 | 3.0 | 2436.93 | 7.4 | 27,773.40 | 84.0 | 139.07 | 0.4 |
| Callao | 0.12 | 0.1 | 0.06 | 0.0 | 1.27 | 0.9 | 57.46 | 40.6 | 82.49 | 58.3 |
| Cusco | 751.75 | 1.0 | 3591.87 | 5.0 | 6685.78 | 9.3 | 60,036.25 | 83.3 | 1010.48 | 1.4 |
| Huancavelica | 0.00 | 0.0 | 0.00 | 0.0 | 4.8 | 0.0 | 21,949.70 | 99.5 | 110.54 | 0.5 |
| Huánuco | 174.66 | 0.5 | 1651.59 | 4.4 | 7839.97 | 21.1 | 27,281.12 | 73.3 | 253.18 | 0.7 |
| Ica | 0.00 | 0.0 | 0.23 | 0.0 | 3.36 | 0.0 | 20,920.58 | 99.2 | 156.60 | 0.7 |
| Junín | 774.32 | 1.8 | 3557.1 | 8.1 | 6441.02 | 14.6 | 32,766.83 | 74.5 | 458.02 | 1.0 |
| La Libertad | 25.58 | 0.1 | 88.28 | 0.3 | 267.96 | 1.1 | 24,784.18 | 98.0 | 129.98 | 0.5 |
| Lambayeque | 0.00 | 0.0 | 9.32 | 0.1 | 444.94 | 3.1 | 13,588.92 | 94.7 | 299.13 | 2.1 |
| Lima | 51.86 | 0.1 | 115.09 | 0.3 | 311.33 | 0.9 | 33,286.51 | 95.1 | 1225.20 | 3.5 |
| Loreto | 19,827.18 | 5.3 | 31,559.59 | 8.4 | 140,822.04 | 37.5 | 175,998.12 | 46.9 | 6909.06 | 1.8 |
| Madre De Dios | 26,285.36 | 30.9 | 23,172.08 | 27.2 | 22,018.65 | 25.9 | 13,038.19 | 15.3 | 531.59 | 0.6 |
| Moquegua | 0.00 | 0.0 | 0.00 | 0.0 | 0.76 | 0.0 | 15,626.63 | 98.9 | 179.92 | 1.1 |
| Pasco | 450.47 | 1.9 | 2859.58 | 11.9 | 6003.89 | 24.9 | 14,627.35 | 60.7 | 172.67 | 0.7 |
| Piura | 19.48 | 0.1 | 132.9 | 0.4 | 1079.19 | 3.0 | 33,310.93 | 92.4 | 1522.57 | 4.2 |
| Puno | 3149.39 | 4.6 | 1572.31 | 2.3 | 2668.18 | 3.9 | 59,409.85 | 87.4 | 1163.09 | 1.7 |
| San Martin | 9829.90 | 19.3 | 9625.48 | 18.9 | 13,939.97 | 27.4 | 17,303.63 | 34.0 | 262.27 | 0.5 |
| Tacna | 0.00 | 0.0 | 0.00 | 0.0 | 0.12 | 0.0 | 15,801.38 | 98.2 | 281.57 | 1.8 |
| Tumbes | 103.31 | 2.2 | 110.1 | 2.3 | 382.53 | 8.2 | 3983.41 | 84.9 | 110.91 | 2.4 |
| Ucayali | 485.92 | 0.5 | 5462.94 | 5.2 | 37,255.24 | 35.4 | 61,063.97 | 58.0 | 1073.69 | 1.0 |
| Perú | 67,787.22 | 5.3 | 92,791.09 | 7.2 | 261,335.27 | 20.3 | 848,173.42 | 65.8 | 18,477.03 | 1.4 |
| Regions | Highly Suitable | Moderately Suitable | Marginally Suitable | Not Suitable | Non-Classified | |||||
|---|---|---|---|---|---|---|---|---|---|---|
| km2 | % | km2 | % | km2 | % | km2 | % | km2 | % | |
| Amazonas | 11,913.73 | 30.3 | 16,080.17 | 40.9 | 11,035.21 | 28.1 | 0.00 | 0.0 | 277.35 | 0.7 |
| Ancash | 0.00 | 0.0 | 3698.66 | 10.3 | 31,241.36 | 86.9 | 6.57 | 0.0 | 1015.65 | 2.8 |
| Apurímac | 0.00 | 0.0 | 28.43 | 0.1 | 20,915.26 | 99.1 | 91.48 | 0.4 | 78.99 | 0.4 |
| Arequipa | 0.00 | 0.0 | 2344.36 | 3.7 | 38,506.10 | 60.9 | 21,515.40 | 34 | 890.04 | 1.4 |
| Ayacucho | 131.31 | 0.3 | 1424.91 | 3.3 | 38,317.92 | 88.1 | 3486.68 | 8.0 | 143.01 | 0.3 |
| Cajamarca | 543.78 | 1.6 | 6555 | 19.8 | 25,801.48 | 78.1 | 5.33 | 0.0 | 139.07 | 0.4 |
| Callao | 0.00 | 0.0 | 33.31 | 23.6 | 25.61 | 18.1 | 0.00 | 0.0 | 82.49 | 58.3 |
| Cusco | 10,873.61 | 15.1 | 12,867.98 | 17.9 | 46,907.22 | 65.1 | 416.84 | 0.6 | 1010.49 | 1.4 |
| Huancavelica | 0.00 | 0.0 | 139.20 | 0.6 | 21,609.48 | 97.9 | 205.81 | 0.9 | 110.54 | 0.5 |
| Huánuco | 9342.31 | 25.1 | 8066.40 | 21.7 | 19,533.25 | 52.5 | 5.38 | 0.0 | 253.19 | 0.7 |
| Ica | 0.00 | 0.0 | 1985.98 | 9.4 | 18,077.74 | 85.8 | 860.42 | 4.1 | 156.63 | 0.7 |
| Junín | 5109.47 | 11.6 | 12,203.67 | 27.7 | 26,226.12 | 59.6 | 0.00 | 0.0 | 458.03 | 1.0 |
| La Libertad | 0.00 | 0.0 | 5857.69 | 23.2 | 19,301.92 | 76.3 | 6.36 | 0.0 | 130.0 | 0.5 |
| Lambayeque | 0.00 | 0.0 | 12,371.14 | 86.3 | 1670.14 | 11.6 | 1.89 | 0.0 | 299.15 | 2.1 |
| Lima | 0.00 | 0.0 | 1266.71 | 3.6 | 32,163.85 | 91.9 | 334.21 | 1.0 | 1225.23 | 3.5 |
| Loreto | 60,526.92 | 16.1 | 307,662.24 | 82.0 | 17.90 | 0.0 | 0.00 | 0.0 | 6908.94 | 1.8 |
| Madre De Dios | 75,261.35 | 88.5 | 8251.35 | 9.7 | 1001.44 | 1.2 | 0.00 | 0.0 | 531.72 | 0.6 |
| Moquegua | 0.00 | 0.0 | 218.60 | 1.4 | 9533.01 | 60.3 | 5875.78 | 37.2 | 179.92 | 1.1 |
| Pasco | 7173.36 | 29.7 | 7435.32 | 30.8 | 9332.53 | 38.7 | 0.06 | 0.0 | 172.68 | 0.7 |
| Piura | 0.00 | 0.0 | 26,559.96 | 73.6 | 7978.70 | 22.1 | 3.84 | 0.0 | 1522.58 | 4.2 |
| Puno | 5435.40 | 8.0 | 6332.45 | 9.3 | 54,856.01 | 80.7 | 175.86 | 0.3 | 1163.10 | 1.7 |
| San Martin | 18,009.91 | 35.3 | 23,806.63 | 46.7 | 8882.46 | 17.4 | 0.00 | 0.0 | 262.27 | 0.5 |
| Tacna | 0.00 | 0.0 | 739.35 | 4.6 | 10,382.87 | 64.6 | 4679.27 | 29.1 | 281.57 | 1.8 |
| Tumbes | 0.00 | 0.0 | 4538.01 | 96.8 | 41.36 | 0.9 | 0.00 | 0.0 | 110.89 | 2.4 |
| Ucayali | 92,224.56 | 87.5 | 12,022.37 | 11.4 | 21.05 | 0.0 | 0.00 | 0.0 | 1073.78 | 1.0 |
| Perú | 296,545.69 | 23 | 482,489.88 | 37.4 | 453,379.97 | 35.2 | 37,671.17 | 2.9 | 18,477.30 | 1.4 |
References
- García, L.J.; Romero, C.M.; Ortiz, L.A. Caracterización y Zonificación de Áreas Potenciales para el Cultivo de Cacao en Colombia; CORPOICA: Bogotá, Colombia, 2004; ISBN 978-958-8536-05-7. [Google Scholar]
- Sánchez, V.; Zambrano, J.; Iglesias, C. La Cadena de Valor del Cacao en América Latina y el Caribe; INIAP: Quito, Ecuador, 2019; ISBN 978-9942-36-465-4.
- Reyes, T.D.; Salera, S.B.; Llegunas, W.U.; Cabelin, J.P. Comparative Analysis of Two Methods for Site Suitability Assessment of Cacao (Theobroma Cacao Lin.) in Bohol, Central Visayas, Philippines. Ecosyst. Dev. J. 2020, 10, 56–67. [Google Scholar]
- FAO. Zonificación Agro-Ecológica: Guía General; FAO: Roma, Italy, 1997; Volume 73, ISBN 925303890X. [Google Scholar]
- Rono, F.; Mundia, C.C. GIS Based Suitability Analysis for Coffee Farming in Kenya. Int. J. Geomatics Geosci. 2016, 6, 1722–1733. [Google Scholar]
- González, G.H.A.; Hernández, S.J.R. Agroecological Zoning of Coffea Arabica in the Atoyac de Álvarez Municipality, Guerrero State, México. Investig. Geogr. 2016, 2016, 105–118. [Google Scholar] [CrossRef] [Green Version]
- Mighty, M.A. Site Suitability and the Analytic Hierarchy Process: How GIS Analysis Can Improve the Competitive Advantage of the Jamaican Coffee Industry. Appl. Geogr. 2015, 58, 84–93. [Google Scholar] [CrossRef]
- Ayehu, G.T.; Besufekad, S.A. Land Suitability Analysis for Rice Production: A GIS Based Multi-Criteria Decision Approach. Am. J. Geogr. Inf. Syst. 2015, 4, 95–104. [Google Scholar] [CrossRef]
- Fasina, A.S.; Raji, A.; Oluwatosin, G.A.; Omoju, O.J.; Oluwadare, D.A. Properties, Genesis, Classification, Capability and Sustainable Management of Soils from South-Western Nigeria. Int. J. Soil Sci. 2015, 10, 142–152. [Google Scholar] [CrossRef] [Green Version]
- Ayorinde, K.; Lawal, R.M.; Muibi, K. Land Suitability Assessment for Cocoa Cultivation in Ife Central Local Government Area, Osun State. Int. J. Sci. Eng. Res. 2015, 3, 139–144. [Google Scholar] [CrossRef] [Green Version]
- Alabi, T.; Sonder, K.; Oduwole, O.; Okafor, C. A Multi-Criteria GIS Site Selection for Sustainable Cocoa Development in West Africa: A Case Study of Nigeria. Int. J. Appl. Geospat. Res. 2012, 3, 73–87. [Google Scholar] [CrossRef] [Green Version]
- Buggenhout, E. Assessment of Soil Quality for Organic Cocoa Cultivation in Southern Sao Tomé; Universiteit Gent: Gent, Belgium, 2018. [Google Scholar]
- Abdelrahman, M.A.E.; Natarajan, A.; Hegde, R. Assessment of Land Suitability and Capability by Integrating Remote Sensing and GIS for Agriculture in Chamarajanagar District, Karnataka, India. Egypt. J. Remote Sens. Sp. Sci. 2016, 19, 125–141. [Google Scholar] [CrossRef] [Green Version]
- Yalew, S.G.; van Griensven, A.; van der Zaag, P. AgriSuit: A Web-Based GIS-MCDA Framework for Agricultural Land Suitability Assessment. Comput. Electron. Agric. 2016, 128, 1–8. [Google Scholar] [CrossRef]
- Aldababseh, A.; Temimi, M.; Maghelal, P.; Branch, O.; Wulfmeyer, V. Multi-Criteria Evaluation of Irrigated Agriculture Suitability to Achieve Food Security in an Arid Environment. Sustainability 2018, 10, 803. [Google Scholar] [CrossRef] [Green Version]
- Malczewski, J. GIS-Based Multicriteria Decision Analysis: A Survey of the Literature. Int. J. Geogr. Inf. Sci. 2006, 20, 703–726. [Google Scholar] [CrossRef]
- Saaty, T.L. How to Make a Decision: The Analytic Hierarchy Process. Eur. J. Oper. Res. 1990, 48, 9–26. [Google Scholar] [CrossRef]
- Madrigal-Martínez, S.; Puga-Calderón, R.J. Aptitud de La Tierra y Análisis de Sensitividad En La Planificación Del Cultivo Del Manzano En El Valle Mala, Perú. Bioagro 2018, 30, 11–12. [Google Scholar]
- Salas, R.; Gómez, F.D.; Silva, L.J.O.; Rojas, B.N.B.; Oliva, M.; Terrones Murga, R.E.; Iliquín, T.D.; Barboza, C.E.; Barrena, G.M.Á. Land Suitability for Coffee (Coffea Arabica) Growing in Amazonas, Peru: Integrated Use of AHP, GIS and RS. ISPRS Int. J. Geo-Inf. 2020, 9, 673. [Google Scholar] [CrossRef]
- Iliquín, D.; Salas, L.R.; Rojas, B.N.B.; Silva, L.J.O.; Gómez, F.D.; Oliva, M.; Quiñones, H.L.; Terrones, M.R.E.; Barboza, C.E.; Barrena, G.M.Á. Land Suitability Analysis for Potato Crop in the Jucusbamba and Tincas Microwatersheds (Amazonas, NW Peru): AHP and RS–GIS Approach. Agronomy 2020, 10, 1898. [Google Scholar] [CrossRef]
- Sarkar, S.; Parihar, S.M.; Dutta, A. Fuzzy Risk Assessment Modelling of East Kolkata Wetland Area: A Remote Sensing and GIS Based Approach. Environ. Model. Softw. 2016, 75, 105–118. [Google Scholar] [CrossRef]
- Phillips, S.; Anderson, R.P.; Schapire, R.E. Maximum Entropy Modeling of Species Geographic Distributions. Ecol. Modell. 2006, 190, 231–252. [Google Scholar] [CrossRef] [Green Version]
- Rodríguez-Merino, A.; García-Murillo, P.; Fernández-Zamudio, R. Combining Multicriteria Decision Analysis and GIS to Assess Vulnerability within a Protected Area: An Objective Methodology for Managing Complex and Fragile Systems. Ecol. Indic. 2020, 108, 105738. [Google Scholar] [CrossRef]
- Falconer, L.; Telfer, T.C.; Ross, L.G. Investigation of a Novel Approach for Aquaculture Site Selection. J. Environ. Manag. 2016, 181, 791–804. [Google Scholar] [CrossRef] [PubMed] [Green Version]
- Noviello, M.; Cafarelli, B.; Calculli, C.; Sarris, A.; Mairota, P. Investigating the Distribution of Archaeological Sites: Multiparametric vs. Probability Models and Potentials for Remote Sensing Data. Appl. Geogr. 2018, 95, 34–44. [Google Scholar] [CrossRef]
- Torres, L.E.A.; Hernández, H.R.; Muñoz Robles, C.A.; Leija Loredo, E.G. Distribución y Conservación de Quercus Oleoides Schltdl. & Cham. en la Reserva de la Biosfera Sierra del Abra Tanchipa. Rev. Mex. Ciencias For. 2019, 10. [Google Scholar] [CrossRef] [Green Version]
- Rojas-Briceño, N.B.; Salas López, R.; Leiva, S.; García, L.; Sanchez, H.; Goñas, M.; Silva López, J.O.; Oliva-Cruz, M. Importancia de Criterios en la Zonificación del Territorio para el Cultivo del Cacao Mediante Analytic Hierarchy Process. 2022; Unpublished article, under revision. [Google Scholar]
- INEI. Perú: Perfil Sociodemográfico. Informa Nacional. Censos Nacionales 2017: XII de Población, VII de Vivienda y III de Comunidades Indígenas; INEI: Lima, Perú, 2018.
- Merchán-Benavides, S.; Delgado-Vera, C.; Aguirre-Munizaga, M.; Vergara-Lozano, V.; Lagos-Ortiz, K.; Martínez-Carriel, T. Agro-Ecological Zoning of Cacao Cultivation Through Spatial Analysis Methods: A Case Study Taura, Naranjal. Adv. Intell. Syst. Comput. 2019, 901, 88–98. [Google Scholar] [CrossRef]
- Ritung, S.; Wahyunto; Agus, F.; Hidayat, H. Land Suitability Evaluation with a Case Map of Aceh Barat District; Indonesian Soil Research Institute and World Agroforestry Centre: Bogor, Indonesia, 2007. [Google Scholar]
- Djaenudin, D.; Hidayat, A.; Suhardjo, H. Petunjuk Teknis Evaluasi Lahan Untuk Komoditas Pertanian; Edisi Kedua Tahun: Bogor, Indonesia, 2011; ISBN 9786028977319. [Google Scholar]
- Sys, C.; Van Ranst, E.; Debaveye, J.; Beernaert, F. Land Evaluation. Part III: Crop Requirements. In Agricultural Publications; GADC: Brussels, Belgium, 1993; Volume 7. [Google Scholar]
- MINAGRI. Estudio del Cacao en el Perú y el Mundo: Un Análisis de la Producción y el Comercio; MINAGRI: Lima, Perú, 2016.
- Arvelo, S.M.A.; González, L.D.; Maroto, A.S.; Delgado, L.T.; Montoya, L.P. Manual Técnico del Cultivo de Cacao Buenas Prácticas para América Latina; IICA: San José, Costa Rica, 2017; ISBN 9789292487324. [Google Scholar]
- Leguía, E.; Soudre, M.; Rugnitz, M. Predicción y Evaluación del Impacto del Cambio Climático Sobre los Sistemas Agroforestales en la Amazonia Peruana y Andina Ecuatoriana; IIAP: Iquitos, Perú; ICRAF: Pucallpa, Perú, 2010.
- Ortega, A.S.; Páez, G.T.; Feria, T.P.; Muñoz, J. Climate Change and the Risk of Spread of the Fungus from the High Mortality of Theobroma Cocoa in Latin America. Neotrop. Biodivers. 2017, 3, 30–40. [Google Scholar] [CrossRef]
- Bunn, C.; Lundy, M.; Wiegel, J.; Castro-Llanos, F. Impacto del Cambio Climático en la Producción de Cacao para Centroamérica y el Caribe—Atlas; CIAT: Cali, Colombia, 2019. [Google Scholar]
- de Sousa, K.; van Zonneveld, M.; Holmgren, M.; Kindt, R.; Ordoñez, J.C. The Future of Coffee and Cocoa Agroforestry in a Warmer Mesoamerica. Sci. Rep. 2019, 9, 8828. [Google Scholar] [CrossRef] [Green Version]
- Ceccarelli, V.; Fremout, T.; Zavaleta, D.; Lastra, S.; Imán Correa, S.; Arévalo-Gardini, E.; Rodriguez, C.A.; Cruz Hilacondo, W.; Thomas, E. Climate Change Impact on Cultivated and Wild Cacao in Peru and the Search of Climate Change-Tolerant Genotypes. Divers. Distrib. 2021, 27, 1462–1476. [Google Scholar] [CrossRef]
- Fick, S.E.; Hijmans, R.J. WorldClim 2: New 1-Km Spatial Resolution Climate Surfaces for Global Land Areas. Int. J. Climatol. 2017, 37, 4302–4315. [Google Scholar] [CrossRef]
- New, M.; Lister, D.; Hulme, M.; Makin, I. A High-Resolution Data Set of Surface Climate over Global Land Areas. Clim. Res. 2002, 21, 1–25. [Google Scholar] [CrossRef] [Green Version]
- Hengl, T.; De Jesus, J.M.; Heuvelink, G.B.M.; Gonzalez, M.R.; Kilibarda, M.; Blagotić, A.; Shangguan, W.; Wright, M.N.; Geng, X.; Bauer-Marschallinger, B.; et al. SoilGrids250m: Global Gridded Soil Information Based on Machine Learning. PLoS ONE 2017, 12, e0169748. [Google Scholar] [CrossRef] [Green Version]
- Buchhorn, M.; Smets, B.; Bertels, L.; De Roo, B.; Lesiv, M.; Tsendbazar, N.-E.; Herold, M.; Fritz, S. Copernicus Global Land Service: Land Cover 100m: Collection 3: Epoch 2019: Globe, version V3.0.1; [Conjunto de Datos]; Laboratory of Geo-Information Science and Remote Sensing: Wegeningen, The Netherlands, 2020. [Google Scholar] [CrossRef]
- MINAM. Mapa Nacional de Ecosistemas del Perú: Memoria Descriptiva; Dirección General de Ordenamiento Territorial Ambiental: Lima, Perú, 2019.
- MINEDU. Descarga de Información Espacial del MED. Available online: http://sigmed.minedu.gob.pe/descargas/ (accessed on 15 April 2021).
- MTC. Descarga de Datos Espaciales. Available online: https://portal.mtc.gob.pe/estadisticas/descarga.html (accessed on 2 April 2021).
- SERNANP. Servicio Nacional de Áreas Naturales Protegidas por el Estado. Servicios y Recursos. Available online: http://geo.sernanp.gob.pe (accessed on 10 August 2020).
- Bagnouls, F.; Gaussen, H. Documents pour les cartes des productions végétales. In Saison Sèche et Indice Xérothermique; Généralités Series; Faculté des Sciences: Toulouse, France, 1953; Tome 3; Volume 1, Article 8. [Google Scholar]
- Quiñones, L.; Barrena, M.; Gosgot, W.; Salas, R.; Milla, M. Estimación de La Radiación Solar Diaria Para La Ciudad de Bagua, Región Amazonas, Perú. Sel. Matemát. 2019, 6, 320–328. [Google Scholar] [CrossRef] [Green Version]
- Rojas-Briceño, N.B. Idoneidad del Territorio Para el Cultivo Sostenible de Cacao (Theobroma cacao L.) en Perú. Master’s Thesis, Universidad Nacional Toribio Rodríguez de Mendoza de Amazonas, Chachapoyas, Peru, 2022. [Google Scholar]
- MINAM. Definiciones Conceptuales de los Ecosistemas del Perú; Dirección General de Diversidad Biológica: Lima, Perú, 2019.
- GRA; IIAP. Zonificación Ecológica y Económica (ZEE) del Departamento de Amazonas; IIAP: Iquitos, Perú, 2010. [Google Scholar]
- Rojas, B.N.B.; Barboza, C.E.; Maicelo, Q.J.L.; Oliva, C.S.M.; Salas, L.R. Deforestación en la Amazonía Peruana: Índices de Cambios de Cobertura y Uso del Suelo Basado en SIG. Bol. Asoc. Geogr. Esp. 2019, 81, 1–34. [Google Scholar] [CrossRef]
- Saaty, T.L. Fundamentals of the Analytie Hierarehy Process. In The Analytic Hierarchy Process in Natural Resource and Environmental Decision Making; Schmoldt, D.L., Kangas, J., Mendoza, G.A., Pesonen, M., Eds.; Springer Science+Business Media, B.Y.: Berlin/Heidelberg, Germany, 2001; pp. 15–36. ISBN 978-94-015-9799-9. [Google Scholar]
- FAO. A Framework for Land Evaluation; FAO: Roma, Italy, 1976; Volume 32, ISBN 9251001111. [Google Scholar]
- Lara, E.L.; Rasche, L.; Schneider, U.A. Modeling Land Suitability for Coffea Arabica L. in Central America. Environ. Model. Softw. 2017, 95, 196–209. [Google Scholar] [CrossRef]
- Calle, Y.C.R.; Salas, L.R.; Cruz, S.M.O.; Barboza, C.E.; Silva, L.J.O.; Iliquín, T.D.; Rojas, B.N.B. Land Suitability for Sustainable Aquaculture of Rainbow Trout (Oncorhynchus Mykiss) in Molinopampa (Peru) Based on RS, GIS, and AHP. ISPRS Int. J. Geo-Inf. 2020, 9, 28. [Google Scholar] [CrossRef] [Green Version]
- Oliva-Cruz, M.; Goñas, M.; García, L.M.; Rabanal-Oyarse, R.; Alvarado-Chuqui, C.; Escobedo-Ocampo, P.; Maicelo-Quintana, J.L. Phenotypic Characterization of Fine-Aroma Cocoa from Northeastern Peru. Int. J. Agron. 2021, 2021, 2909909. [Google Scholar] [CrossRef]
- Boria, R.A.; Olson, L.E.; Goodman, S.M.; Anderson, R.P. Spatial Filtering to Reduce Sampling Bias Can Improve the Performance of Ecological Niche Models. Ecol. Modell. 2014, 275, 73–77. [Google Scholar] [CrossRef]
- Dormann, C.F.; Elith, J.; Bacher, S.; Buchmann, C.; Carl, G.; Carré, G.; García, M.J.R.; Gruber, B.; Lafourcade, B.; Leitão, P.J.; et al. Collinearity: A Review of Methods to Deal with It and a Simulation Study Evaluating Their Performance. Ecography 2013, 36, 27–46. [Google Scholar] [CrossRef]
- Leroy, B.; Meynard, C.N.; Bellard, C.; Courchamp, F. Virtualspecies, an R Package to Generate Virtual Species Distributions. Ecography 2016, 39, 599–607. [Google Scholar] [CrossRef] [Green Version]
- Meza, G.; Barboza, C.E.; Torres, G.C.; Cotrina, S.D.A.; Guzman, V.B.K.; Oliva, M.; Bandopadhyay, S.; Salas, L.R.; Rojas, B.N.B. Predictive Modelling of Current and Future Potential Distribution of the Spectacled Bear (Tremarctos Ornatus) in Amazonas, Northeast Peru. Animals 2020, 10, 1816. [Google Scholar] [CrossRef] [PubMed]
- Cotrina, D.A.; Barboza, C.E.; Rojas, B.N.B.; Oliva, M.; Torres, G.C.; Amasifuen, G.C.A.; Bandopadhyay, S. Distribution Models of Timber Species for Forest Conservation and Restoration in the Andean-Amazonian Landscape, North of Peru. Sustainability 2020, 12, 7945. [Google Scholar] [CrossRef]
- Rojas, N.B.R.; Cotrina, S.D.A.; Barboza, C.E.; Barrena, G.M.Á.; Sarmiento, F.O.; Sotomayor, D.A.; Oliva, M.; Salas, L.R. Current and Future Distribution of Five Timber Forest Species in Amazonas, Northeast Peru: Contributions towards a Restoration Strategy. Diversity 2020, 12, 305. [Google Scholar] [CrossRef]
- Araujo, M.; Pearson, R.; Thuiller, W.; Erhard, M. Validation of Species-Climate Impact Models under Climate Change. Glob. Chang. Biol. 2005, 11, 1504–1513. [Google Scholar] [CrossRef] [Green Version]
- Phillips, S.J.; Dudík, M. Modeling of Species Distributions with Maxent: New Extensions and a Comprehensive Evaluation. Ecography 2008, 31, 161–175. [Google Scholar] [CrossRef]
- Baniya, N. Land Suitability Evaluation Using Gis for Vegetable Crops in Kathmandu Valley/Nepal. Ph.D. Thesis, Humboldt University zu Berlin, Berlin, Germany, 2008. [Google Scholar]
- Vasu, D.; Srivastava, R.; Patil, N.G.; Tiwary, P.; Chandran, P.; Kumar Singh, S. A Comparative Assessment of Land Suitability Evaluation Methods for Agricultural Land Use Planning at Village Level. Land Use Policy 2018, 79, 146–163. [Google Scholar] [CrossRef]
- Zhang, S.; Liu, X.; Li, R.; Wang, X.; Cheng, J.; Yang, Q.; Kong, H. AHP-GIS and MaxEnt for Delineation of Potential Distribution of Arabica Coffee Plantation under Future Climate in Yunnan, China. Ecol. Indic. 2021, 132, 108339. [Google Scholar] [CrossRef]
- Mugiyo, H.; Chimonyo, V.G.P.; Sibanda, M.; Kunz, R.; Masemola, C.R.; Modi, A.T.; Mabhaudhi, T. Evaluation of Land Suitability Methods with Reference to Neglected and Underutilised Crop Species: A Scoping Review. Land 2021, 10, 125. [Google Scholar] [CrossRef]
- Kamkar, B.; Dorri, M.A.; Da Silva, J.A.T. Assessment of Land Suitability and the Possibility and Performance of a Canola (Brassica napus L.)—Soybean (Glycine max L.) Rotation in Four Basins of Golestan Province, Iran. Egypt. J. Remote Sens. Sp. Sci. 2014, 17, 95–104. [Google Scholar] [CrossRef] [Green Version]
- Feng, L.; Wang, H.; Ma, X.; Peng, H.; Shan, J. Modeling the Current Land Suitability and Future Dynamics of Global Soybean Cultivation under Climate Change Scenarios. Field Crops Res. 2021, 263, 108069. [Google Scholar] [CrossRef]
- Chen, W.; Pourghasemi, H.R.; Kornejady, A.; Zhang, N. Landslide Spatial Modeling: Introducing New Ensembles of ANN, MaxEnt, and SVM Machine Learning Techniques. Geoderma 2017, 305, 314–327. [Google Scholar] [CrossRef]
- Cabrera, J.S.; Lee, H.S. Flood Risk Assessment for Davao Oriental in the Philippines Using Geographic Information System-based Multi-criteria Analysis and the Maximum Entropy Model. J. Flood Risk Manag. 2020, 13, e12607. [Google Scholar] [CrossRef] [Green Version]
- Dedeoğlu, M.; Dengiz, O. Generating of Land Suitability Index for Wheat with Hybrid System Aproach Using AHP and GIS. Comput. Electron. Agric. 2019, 167, 105062. [Google Scholar] [CrossRef]
- Duc, T.T. Using GIS and AHP Technique for Land-Use Suitability Analysis. In Proceedings of the International Symposium on Geoinformatics for Spatial Infrastructure Development in Earth and Allied Sciences, Ho Chi Minh, Vietnam, 9–11 November 2006; pp. 1–6. [Google Scholar]
- Herzberg, R.; Pham, T.G.; Kappas, M.; Wyss, D.; Tran, C.T.M. Multi-Criteria Decision Analysis for the Land Evaluation of Potential Agricultural Land Use Types in a Hilly Area of Central Vietnam. Land 2019, 8, 90. [Google Scholar] [CrossRef] [Green Version]
- Rofner, N.F. Cadmium in Soil and Cacao Beans of Peruvian and South American Origin. Rev. Fac. Nac. Agron. Medellín 2021, 74, 9499–9515. [Google Scholar] [CrossRef]
- García, L.; Angulo Castro, F.; Hernández-Amasifuen, A.D.; Corazon-Guivin, M.A.; Alburquerque Vásquez, J.; Guerrero-Abad, J.C.; Arellanos, E.; Veneros, J.; Rojas-Briceño, N.B.; Chavez Quintana, S.; et al. Global Studies of Cadmium in Relation to Theobroma Cacao: A Bibliometric Analysis from Scopus (1996-2020). Sci. Agropecu. 2021, 12, 611–622. [Google Scholar] [CrossRef]
- Settou, B.; Settou, N.; Gouareh, A.; Negrou, B.; Mokhtara, C.; Messaoudi, D. A High-Resolution Geographic Information System-Analytical Hierarchy Process-Based Method for Solar PV Power Plant Site Selection: A Case Study Algeria. Clean Technol. Environ. Policy 2021, 23, 219–234. [Google Scholar] [CrossRef]
- Rahman, H.U.; Raza, M.; Afsar, P.; Alharbi, A.; Ahmad, S.; Alyami, H. Multi-Criteria Decision Making Model for Application Maintenance Offshoring Using Analytic Hierarchy Process. Appl. Sci. 2021, 11, 8550. [Google Scholar] [CrossRef]
- Phillips, S.; Aneja, V.P.; Kang, D.; Arya, S.P. Modelling and Analysis of the Atmospheric Nitrogen Deposition in North Carolina. Int. J. Glob. Environ. Issues 2006, 6, 231–252. [Google Scholar] [CrossRef] [Green Version]
- Phillips, S.; Dudík, M.; Schapire, R. A Maximum Entropy Approach to Species Distribution Modeling. In Proceedings of the Twenty-First International Conference on Machine Learning, Banff, AB, Canada, 4–8 July 2004; pp. 655–662. [Google Scholar]
- MINAM. GEOBOSQUES: Bosque y Pérdida de Bosque. Available online: http://geobosques.minam.gob.pe/geobosque/view/perdida.php (accessed on 6 October 2020).
- Pokorny, B.; Robiglio, V.; Reyes, M.; Vargas, R.; Patiño Carrera, C.F. The Potential of Agroforestry Concessions to Stabilize Amazonian Forest Frontiers: A Case Study on the Economic and Environmental Robustness of Informally Settled Small-Scale Cocoa Farmers in Peru. Land Use Policy 2021, 102, 105242. [Google Scholar] [CrossRef]
- Díaz-Valderrama, J.R.; Leiva-Espinoza, S.T.; Catherine Aime, M. The History of Cacao and Its Diseases in the Americas. Phytopathology 2020, 110, 1604–1619. [Google Scholar] [CrossRef]
- MIDAGRI. Resolución Ministerial. N° 0322-2020-MIDAGRI. Oficializan el Mapa Nacional de Superficie Agrícola del Perú—El Peru; MIDAGRI: Lima, Peru, 2020.


| Criteria (1st Hierarchy AHP) | Subcriteria (2nd Hierarchy AHP) | Model in Which It Was Used | Spatial Database | ||
|---|---|---|---|---|---|
| AHP | MaxEnt | AHP–MaxEnt | |||
| Climatological | Bio1: Mean annual temperature | x | x | x | [40] |
| Bio2–Bio11: bioclimatics derived from temperature | x | [40] | |||
| Bio12: Mean annual rainfall | x | x | x | [40] | |
| Bio13–Bio19: bioclimatics derived from precipitation | x | [40] | |||
| Annual mean max temperature | x | x | [40] | ||
| Annual mean min temperature | x | x | [40] | ||
| Number of dry months | x | x | [40] | ||
| Relative humidity | x | x | x | [41] | |
| Solar radiation | x | [40] | |||
| Edaphological at 0.30 m | pH in H2O | x | x | x | [42] |
| Coarse fragment content | x | x | x | [42] | |
| Organic carbon | x | x | x | [42] | |
| Texture | x | x | [42] | ||
| Total nitrogen | x | x | x | [42] | |
| CEC—Cation exchange capacity | x | x | x | [42] | |
| Bulk density | x | [42] | |||
| Proportion of sand particles | x | [42] | |||
| Proportion of silt particles | x | [42] | |||
| Proportion of clay particles | x | [42] | |||
| Orographic | Elevation | x | x | x | CGIAR |
| Slope | x | x | x | CGIAR | |
| Aspect | x | x | x | CGIAR | |
| Socioeconomical | LULC—Land Use and Land Cover | x | [43,44] | ||
| Distance to urban centers | x | [45] | |||
| Distance to roads | x | [46] | |||
| Distance to rivers | x | [45] | |||
| Distance to protected natural areas | x | [47] | |||
| Criteria/Subcriteria | Land Suitability Classes (3rd Hierarchy AHP) | |||||
|---|---|---|---|---|---|---|
| Highly Suitable | Moderately Suitable | Marginally Suitable | Not Suitable | Adapted From | ||
| Climatological | ||||||
| Mean annual temperature (°C) | 25–28 | 22–25/28–32 | 20–22/32–35 | <20/>35 | [10,29,30,31] | |
| Annual mean min temperature (°C) | 18–21 | 15–18/>21 | 12–15 | <12 | [11,12,32] | |
| Annual mean max temperature (°C) | 28–30 | 30–32/25–28 | >32/22–25 | <22 | [11,12,32] | |
| Mean annual rainfall (mm) | 1600–2500 | 2500–3500/1400–1600 | 1200–1400/3500–4400 | <1200/>4400 | [30,31] | |
| Number of dry months | 0–2 | 3 | 4 | >4 | [12,32] | |
| Relative humidity (%) | 70–80 | 80–85/60–70 | 85–90/50–60 | >90/<50 | [11,33,34] | |
| Edaphological at 0.30 m | ||||||
| pH in H2O | 6–7 | 5–6/7–7.6 | 4.2–5/7.6–8.2 | <4.2/>8.2 | [29,30,31,32,34] | |
| Texture 1 | SiCL, CL, SiL | L, SCL, SC | Si, SL, C | LS, S, SiC | [30,31,32] | |
| Coarse fragment content (%) | <15 | 15–35 | 35–55 | >55 | [10,30,31] | |
| Organic carbon (%) | >1.5 | 0.8–1.5 | <0.8 | – | [30,31,32] | |
| CEC (cmol/kg) | >24 | 20–24 | 16–20 | <16 | [10] | |
| Total nitrogen (%) | >0.18 | 0.15–0.18 | 0.1–0.15 | <0.1 | [10] | |
| Orographic | ||||||
| Elevation (m asl) | 400–800 | 0–400/800–1200 | 1200–1600 | >1600 | [1,34] | |
| Slope (%) | <8 | 8–16 | 16–30 | >30 | [29,30,31,32] | |
| Aspect | N, NE, NW, Flat | W, E | SE, SW | S | [19,56] | |
| Socioeconomical | ||||||
| LULC | CGLS-LC100 2 | 40 | 20 | 30 | 0, 50–90, >100 | [19] |
| Ecosystems of Peru | Agricultural area | – | Secondary vegetation | Urban/built | [20] | |
| Agricultural Map of Peru | Agriculture | – | – | – | ||
| ZEE | Agriculture | – | Cattle raising | Urban/built | [20] | |
| Global urban borders | – | – | – | Urban/built | ||
| Distance to roads (km) | National-axis | 0–6 | 6–9 | 9–12 | >12 | [19,20] |
| Departmental | 0–4 | 4–8 | 8–10 | >10 | [19,20] | |
| Local | 0–2 | 2–4 | 4–8 | >8 | [19,20] | |
| Distance to rivers (km) | 0–0.5 | 0.5–2 | 2–5 | >5 | [19] | |
| Distance to urban centers (km) | Urban areas | 0–3 | 3–6 | 6–10 | >10 | [19] |
| Population centers | 0–1 | 1–3 | 3–5 | >5 | [19] | |
| Distance to protected natural areas | Out | – | Buffer zone | Within | [19] | |
| AHP Model 1,2 | MaxEnt Model 1 | AHP–MaxEnt Model 1 | ||||||
|---|---|---|---|---|---|---|---|---|
| Bio12: Mean annual rainfall | 9.9 |  | Bio19: Precipitation of coldest quarter | 41.4 |  | Annual mean min temperature | 40.7 |  |
| Elevation | 9.7 |  | Elevation | 23.6 |  | Number of dry months | 14.2 |  |
| CEC | 7.1 |  | Bio12: Mean annual rainfall | 6.0 |  | Elevation | 10.4 |  |
| Relative humidity | 6.7 |  | Bio4: Temperature seasonality | 5.7 |  | Relative humidity | 7.4 |  |
| Texture | 6.0 |  | Slope | 4.2 |  | pH in H2O | 5.6 |  |
| Number of dry months | 5.8 |  | Proportion of silt particles | 3.0 |  | Bio1: Mean annual temperature | 4.2 |  |
| Total nitrogen | 5.5 |  | Coarse fragment content | 3.0 |  | Bio12: Mean annual rainfall | 3.3 |  |
| Distance to rivers | 5.0 |  | Aspect | 3.0 |  | Aspect | 2.5 |  |
| Bio1: Mean annual temperature | 4.6 |  | Organic carbon | 2.6 |  | CEC | 2.1 |  |
| Annual mean min temperature | 4.6 |  | CEC | 2.5 |  | Slope | 2.1 |  |
| Slope | 4.6 |  | Bulk density | 2.0 |  | Texture | 2.0 |  |
| pH in H2O | 4.5 |  | Proportion of sand particles | 1.5 |  | Organic carbon | 1.7 |  |
| Annual mean max temperature | 4.1 |  | Total nitrogen | 1.5 |  | Coarse fragment content | 1.5 |  |
| Organic carbon | 4.1 |  | Bio1: Mean annual temperature | * | Total nitrogen | 1.3 |  | |
| LULC | 4.1 |  | Bio2, Bio3, Bio5–Bio11, Bio13–Bio18 | * | Annual mean max temperature | 1.1 |  | |
| Distance to roads | 3.6 |  | Relative humidity | * | ||||
| Distance to PNA | 3.4 |  | Solar radiation | * | ||||
| Aspect | 2.7 |  | pH in H2O | * | ||||
| Distance to urban centers | 2.1 |  | Proportion of clay particles | * | ||||
| Coarse fragment content | 2.0 |  | ||||||
| AHP Model | MaxEnt Model | AHP–MaxEnt Model | ||||||
|---|---|---|---|---|---|---|---|---|
| San Martin | 4732.75 |  | Madre De Dios | 26,285.36 |  | Ucayali | 92,224.56 |  |
| Ucayali | 2700.82 |  | Loreto | 19,827.18 |  | Madre De Dios | 75,261.35 |  |
| Amazonas | 2627.36 |  | San Martin | 9829.90 |  | Loreto | 60,526.92 |  |
| Cusco | 2351.81 |  | Amazonas | 4107.07 |  | San Martin | 18,009.91 |  |
| Junín | 2128.12 |  | Puno | 3149.39 |  | Amazonas | 11,913.73 |  |
| Huánuco | 1928.73 |  | Cajamarca | 1694.55 |  | Cusco | 10,873.61 |  |
| Madre De Dios | 1340.31 |  | Junín | 774.32 |  | Huánuco | 9342.31 |  |
| Loreto | 708.86 |  | Cusco | 751.75 |  | Pasco | 7173.36 |  |
| Pasco | 646.19 |  | Ucayali | 485.92 | Puno | 5435.40 |  | |
| Cajamarca | 255.28 | Pasco | 450.47 | Junín | 5109.47 |  | ||
| Ayacucho | 12.82 | Huánuco | 174.66 | Cajamarca | 543.78 |  | ||
| Puno | 4.57 | Tumbes | 103.31 | Ayacucho | 131.31 | |||
| Ancash | 0 | Lima | 51.86 | Ancash | 0 | |||
| Apurímac | 0 | Ancash | 39.34 | Apurímac | 0 | |||
| Arequipa | 0 | La Libertad | 25.58 | Arequipa | 0 | |||
| Callao | 0 | Piura | 19.48 | Callao | 0 | |||
| Huancavelica | 0 | Ayacucho | 16.90 | Huancavelica | 0 | |||
| Ica | 0 | Callao | 0.12 | Ica | 0 | |||
| La Libertad | 0 | Arequipa | 0.05 | La Libertad | 0 | |||
| Lambayeque | 0 | Apurímac | 0 | Lambayeque | 0 | |||
| Lima | 0 | Huancavelica | 0 | Lima | 0 | |||
| Moquegua | 0 | Ica | 0 | Moquegua | 0 | |||
| Piura | 0 | Lambayeque | 0 | Piura | 0 | |||
| Tacna | 0 | Moquegua | 0 | Tacna | 0 | |||
| Tumbes | 0 | Tacna | 0 | Tumbes | 0 | |||
Publisher’s Note: MDPI stays neutral with regard to jurisdictional claims in published maps and institutional affiliations. |
© 2022 by the authors. Licensee MDPI, Basel, Switzerland. This article is an open access article distributed under the terms and conditions of the Creative Commons Attribution (CC BY) license (https://creativecommons.org/licenses/by/4.0/).
Share and Cite
Rojas-Briceño, N.B.; García, L.; Cotrina-Sánchez, A.; Goñas, M.; Salas López, R.; Silva López, J.O.; Oliva-Cruz, M. Land Suitability for Cocoa Cultivation in Peru: AHP and MaxEnt Modeling in a GIS Environment. Agronomy 2022, 12, 2930. https://doi.org/10.3390/agronomy12122930
Rojas-Briceño NB, García L, Cotrina-Sánchez A, Goñas M, Salas López R, Silva López JO, Oliva-Cruz M. Land Suitability for Cocoa Cultivation in Peru: AHP and MaxEnt Modeling in a GIS Environment. Agronomy. 2022; 12(12):2930. https://doi.org/10.3390/agronomy12122930
Chicago/Turabian StyleRojas-Briceño, Nilton B., Ligia García, Alexander Cotrina-Sánchez, Malluri Goñas, Rolando Salas López, Jhonsy O. Silva López, and Manuel Oliva-Cruz. 2022. "Land Suitability for Cocoa Cultivation in Peru: AHP and MaxEnt Modeling in a GIS Environment" Agronomy 12, no. 12: 2930. https://doi.org/10.3390/agronomy12122930