1. Introduction
In marketing, insight has emerged as a multidisciplinary field whose objective is to assess consumers’ cognitive and emotional responses to marketing presentations, and stimuli [
1,
2]. Business models are not established in many Peruvian organizations, limiting their ability to achieve their strategic objectives. With the emergence of the technological revolution, these organizations are using projections to meet their objectives in order to attract and retain new customers.
Vetoncilla Maestre [
3] mentioned the need to introduce experience based on historical data into marketing plans, which provides feedback and improves the strategy. However, this has not yet been implemented in most Peruvian universities’ marketing plans and has not been deployed in advertising directed to the potential customer. On the other hand, social networks and digital channels have given the user/customer a new potential, which is to interact with other people who work for the seller, providing information that was not achieved through traditional means. For this reason, the Internet revolution has transformed the way of selling and other interactions that result in profits for both the seller and the buyer [
4].
There is a problem of lack of information from admission promoters in Peruvian universities, which makes the marketing system inefficient. Therefore, an innovative formula is sought to know the customer through elements such as the information provided by digital channels in order to obtain a more in-depth knowledge of the customer. This paper proposes a marketing strategy that seeks to change how the University presents academic services. This study was conducted at the Universidad Peruana Unión (UPeU), where there is no smart marketing strategy to attract and retain potential customers, which will help position the brand and could lead to greater future profitability. In particular, a model called RECONAC (Retention, Conversion, and Acquisition) is proposed to guide the interaction and adoption among customer acquisition, conversion, and retention.
The remainder of the paper is organized as follows.
Section 2 provides a literature review on the marketing strategy components.
Section 3 shows the dynamics of the proposed marketing strategy for university students’ interaction and adoption.
Section 4 presents the results that were obtained based on the proposal. Finally,
Section 5 provides the main conclusions and some possibilities for future work.
2. Theoretical Framework
2.1. Antecedents
Schmidt [
5] analyzed and evaluated the websites of different hotels in Spain, Brazil, and Portugal to determine the factors that make the digital channel a medium with personalized, direct advertising with key information about the service or product, which positively impacts new customers’ acquisition, retention, and the volume of sales.
Later, Castillo [
6] conducted another study to develop a model to achieve “customer-centered management”; this model consisted of improving the client’s participation in the sales process through an offer, where the design of the product, including its price and characteristics, was more personalized. Participation is improved through the use of online and offline channels. Likewise, they aimed to generate customer satisfaction through their participation in the sales process, which is related to the trust generated, consequently, with attitudinal loyalty [
6,
7]. In this study, they surveyed 495 women, wanting to understand the post-sale experience in order to understand essential factors in the purchase decision. They also used
insight techniques as an emotional factor in their model.
Sivasubramaniyam et al. [
8] presented an investigation of the explanatory level that uses the validity and reliability of the satisfaction measure by performing a factorial analysis, in terms of the preferences of characteristics of travelers who tend to feel satisfied when they use their usual means to travel, understanding the factors that make them feel satisfied with the services they rent during their experience. On the other hand, Izquierdo Yusta et al. [
9] mentioned that the process of adopting a tourism service achieved client retention thanks to the strategy based on the technology acceptance model service, which reported 759 satisfied tourists for the service provided through the Internet.
2.2. Loyalty and Self-Realization
Maslow’s theory holds that a person has the ability to achieve his or her growth and freedom to choose his or her destiny. In this theory, human needs are ordered hierarchically in the form of a pyramid, starting with basic needs and then the deepest ones until reaching self-realization [
10]. Therefore, considering Maslow’s theory, it is essential to provide customers with objective information about the product, responding to their needs.
Some cases have been reported in the literature in which Maslow’s philosophy has been used to build customer loyalty. Schlesinger et al. [
11] mentioned that the interaction between graduates and the university was significant; in a survey conducted, they obtained a good perception of the loyalty of the graduates and a good relationship between the graduates and the organization. Meanwhile, Villarejo-Ramos et al. [
12] found that adults have a greater affinity for online shopping; they applied a latent class model that allowed them to establish three profiles based on adult Internet users’ interaction.
2.3. Brand Adoption
According to Klaric [
13], the way the user perceives the brand will determine the adoption process’s depth. This process has a bidirectional depth on the customer’s side, which starts from the customer’s perception of the product and the person who designs the advertising information when it is delivered. The customer’s perception of the product involves its level of adoption and acceptance, ranging from the basic (logical) to the deep (emotional). On the other hand, whoever designs the advertising information delves into the product’s presentation levels. Presentation levels are intended to satisfy basic needs described by Maslow and even respond to needs of which the user had not even been aware. According to Klaric [
13], the levels of brand adoption that respond to the needs established by Maslow are described as follows.
Basic insight: It responds to the needs stipulated in the first level of Maslow’s pyramid. The information gives the functionality of the product and its logic in its benefits.
Low insight: It seeks to present aspects that mark the difference from other products, adding some emotional elements.
Deep insight: It seeks the independence of the person in relation to the problem he/she needs to satisfy, to understand the depth of the human subconscious according to the upper level of Maslow’s pyramid. In addition, the emotional element is capitalized and seeks to respond to the human brain’s need for self-realization; this type of perception often becomes a symbolic code, which in some way becomes a general characteristic of consumer behavior.
2.4. Design Key Performance Indicator and the Strategic Part
Google Analytics is the most widely used digital analytics tool for websites in the world [
14]. Key performance indicators (KPIs) are a method by which the performance of something can be calculated [
15]. A website can be evaluated by numerical KPI values, which can be calculated and compared over time. KPIs show each website’s strengths and weaknesses and significantly help maintain, improve, and optimize websites.
One of the purposes of a strategic plan is integrating KPIs [
16]. Järvinen and Karjaluoto [
17] established that a business becomes intelligent to the extent that it integrates with its management using key indicators that enable diagnoses of the processes. In this sense, it is important to set a process that can be measured for the progress of business objectives, ensuring the marketing strategy’s success.
On the other hand, García-Fernández [
18] mentioned that a business indicator defines and measures progress towards goals; in addition, it allows innovation in the decision process, which is based on knowledge management and helps in quality decision making. The activities related to the design of the KPI are the following:
Measurement: This consists of modeling indicators on tools that capture information from digital media, departments, or other sources about consumption, customer behavior, and attitudes towards the brand.
Analysis: This function is directly related to the ability to observe the data and obtain timely conclusions; it is important to have sufficient information and tools that can take advantage of this condition.
Report: This can express the results in graphs, numbers, and with a frequency according to the need and urgency of the analysis.
2.5. Measurement Indicators
Chivu and Antoce [
19] applied the conversion rate indicator to manage the integration between the knowledge applied to marketing campaigns and the monitoring with this knowledge’s feedback. This indicator is calculated based on the number of transactions and the traffic of published product information. In addition, Gupta et al. [
20] mentioned customer adoption, which is measured through KPI, using some decision technologies that make business growth measurable.
2.6. Insight
Psychology and anthropology have contributed significantly to marketing since these areas of knowledge develop an analysis of the human being from the focus of their personality, brain behavior, and activated areas of stimuli. All this added to their tastes and emotions, which have been the source to redefine the marketing objectives, apply new methods and techniques that have redesigned and customized the final product, achieving a better consumer experience and an improved relationship with the brand, so it is worthwhile to propose new strategies considering all these theories [
21,
22,
23].
In terms of brand positioning, the generation of memory in published content is closely related to emotion and attention, which was applied by Tapia-Frade and Martín-Guerra [
24] in studies associated with the analysis of consumers’ minds. This was corroborated by Castro [
25], who used used tools such as contrast and color in their insight model as a basis for formulating visible information, as a stimulus to improve levels of attention.
In addition, Sebastian [
2] highlighted that insight allows the decision-making process to be explored through tools that analyze the impulses of the human brain, such as higher-level knowledge, because it is not mixed with subjective data at the time of receiving image stimuli about the product, which allows for better knowledge of the customer and activation of various areas.
Likewise, Roth [
26] addressed the consumer’s insight through a comparative study between different strategies, from classical to neuroscientific ones. Specifically, using encephalography, he stated that the customer’s selection process among different product options is emotional and driven by the experiences that the consumer associates with a type of product and relates it to its benefits.
There are several ways to study insight; in this sense, the goal is for the subconscious’s information to efficiently reach the conscious. According to Pradeep [
27], our senses receive about eleven million bits of information per second, which passes and is stored in the subconscious. Our conscious system, the one that processes the information, can only receive 40 bits of information per second. With insight, it is trying to achieve reaching those 40 bits of information.
3. Methodology
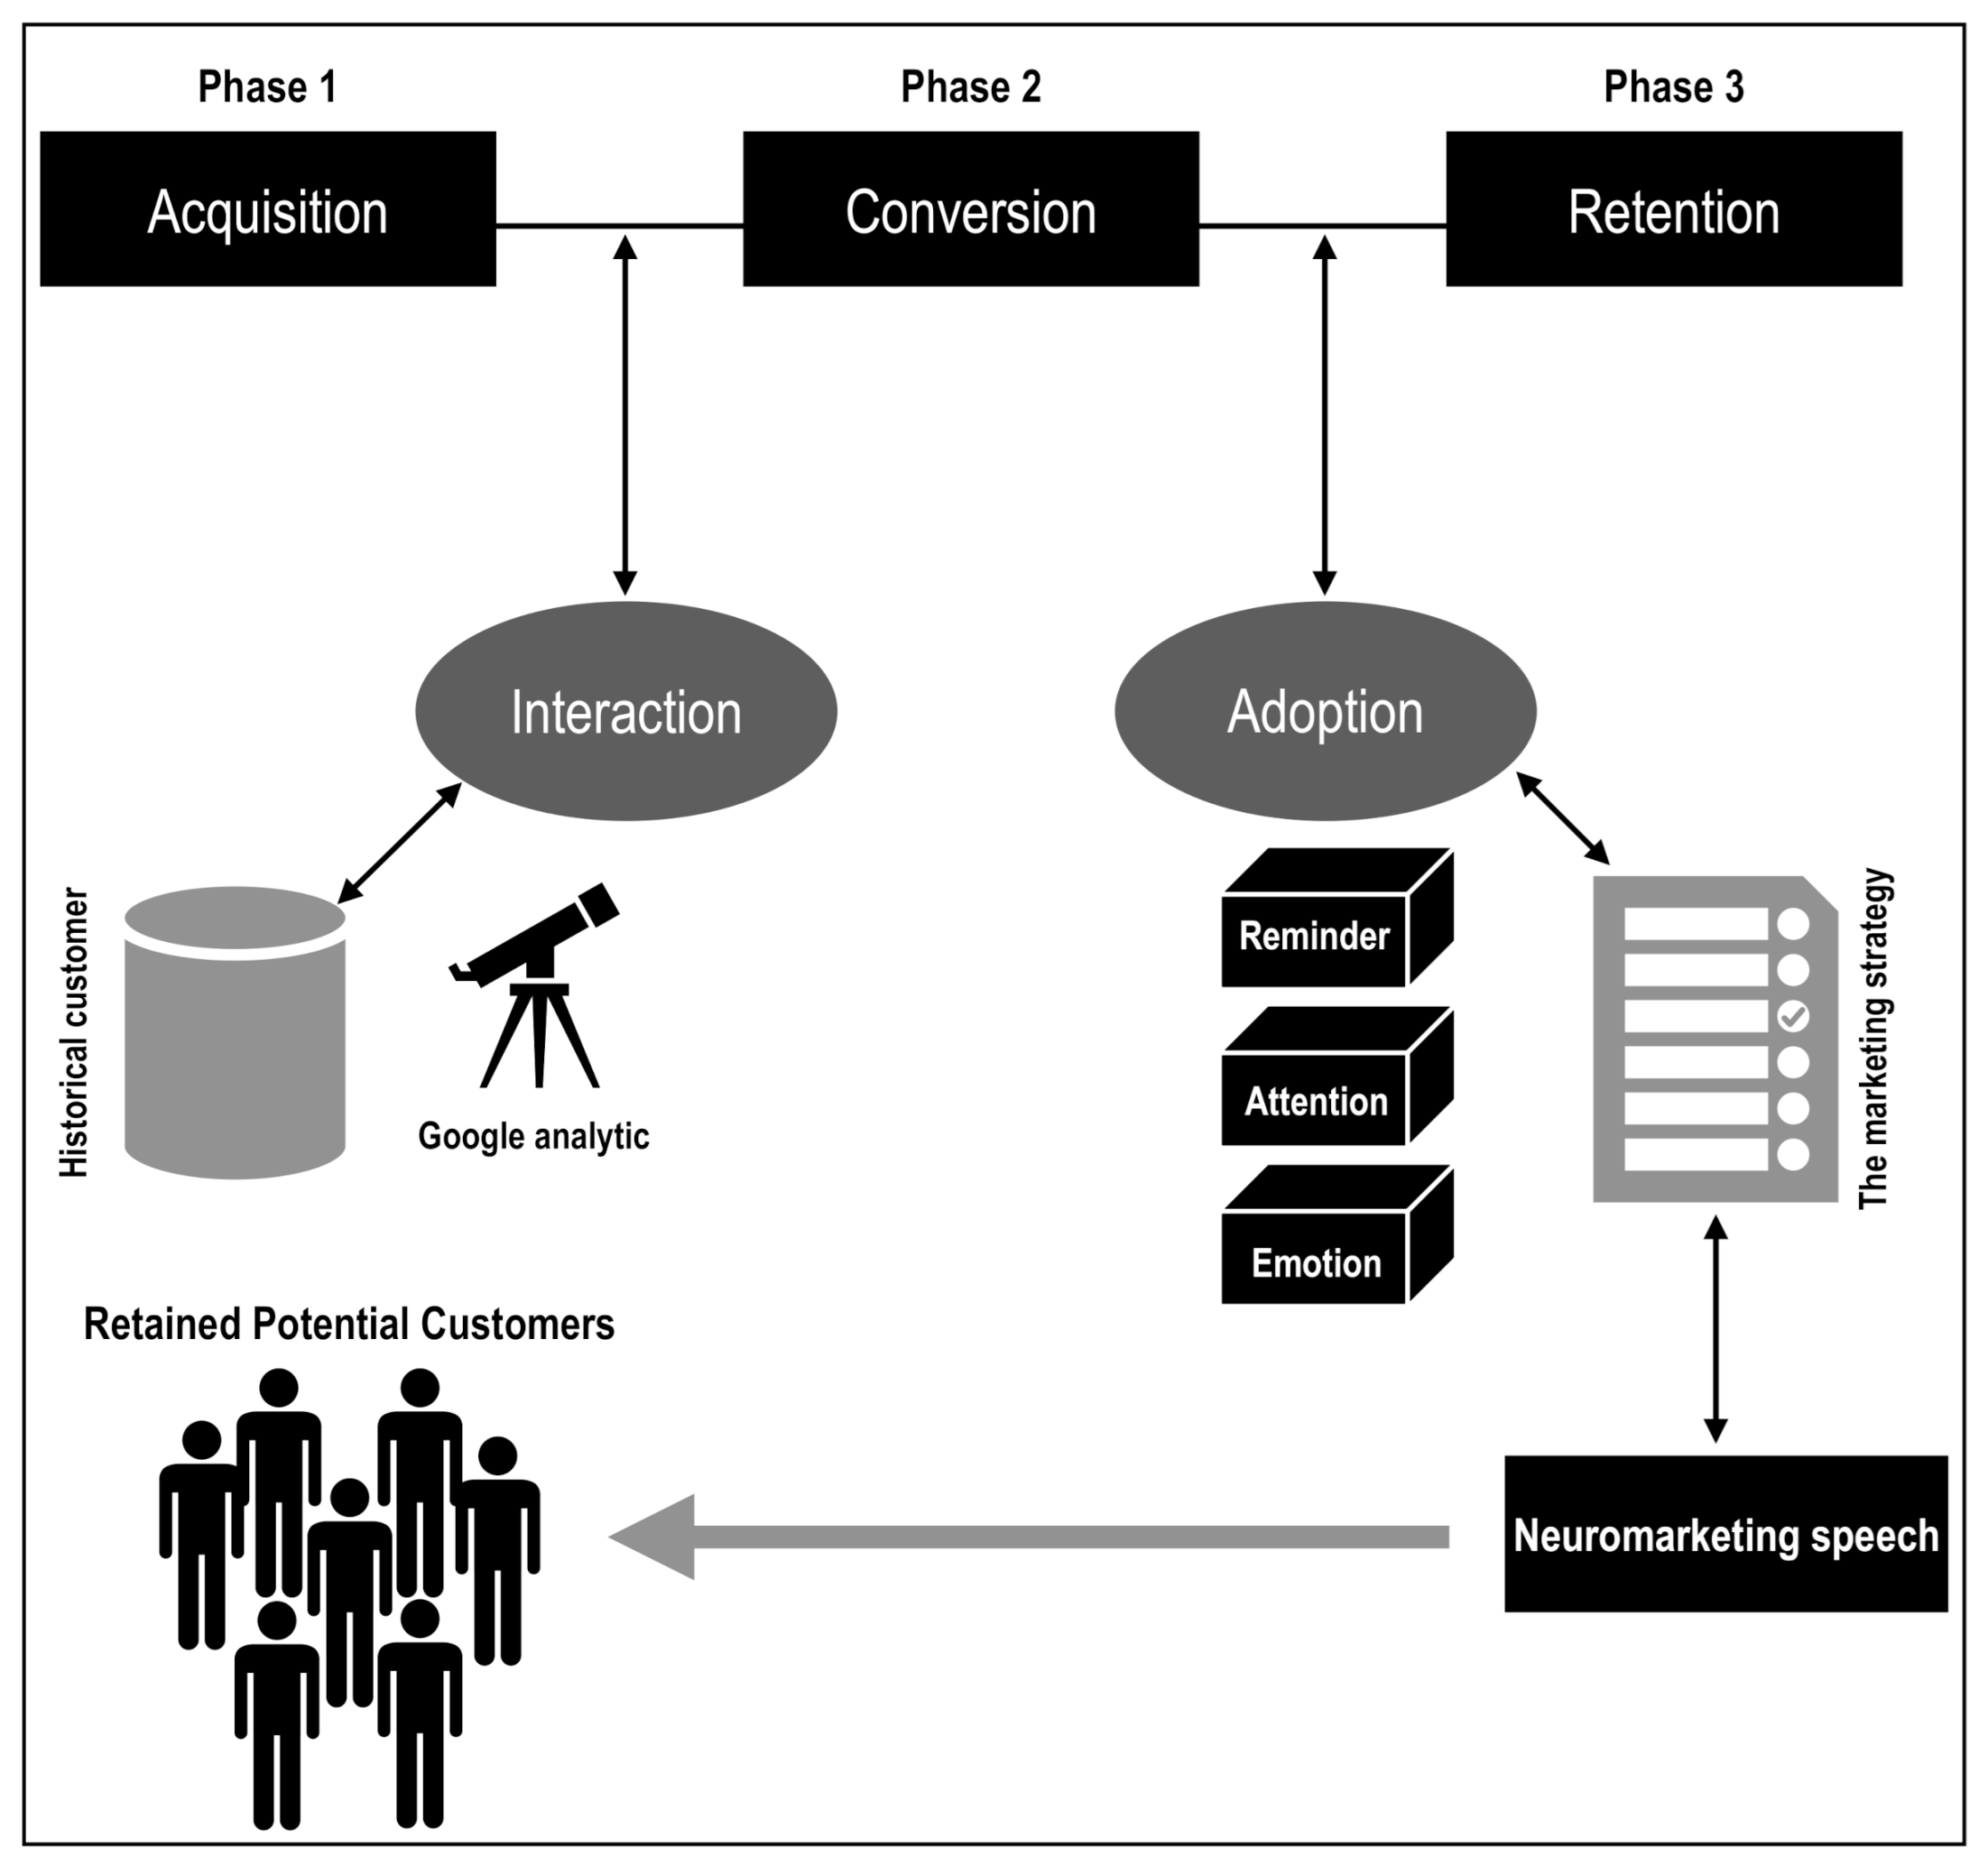
This paper proposes a funnel to achieve the retention of potential customers, which interact with the UPeU through digital channels. In particular, a model called RECONAC (Retention, Conversion, and Acquisition) is proposed to guide the interaction and adoption between among acquisition, conversion, and retention.
Figure 1 shows the proposed model, where, between acquisition and conversion, there is interaction with potential clients, and between, conversion and retention, there is adoption, which is supported by the marketing strategy (insight) that is deployed in three constructs: remembrance, attention, and emotion.
According to the marketing framework, the mathematical formula that describes the customer retention was used, which is defined by , whose correspondence rule is retained client, where A means attention, is emotion, and R is remembrance, with values 0 and 1 denoting not retained client and retained client, respectively. The marketing strategy had a test period. In that sense, before implementing the proposal in the channel, it is necessary to perform a pre-test to measure the channel’s interaction and adoption, using Google Analytics KPIs; thus, the user interaction before the strategy is disclosed. Based on the pre-test results, a marketing strategy was designed for the channel. Subsequently, implementing the new features in the digital channel, a test period called post-test was carried out, where the user interacts, giving improvements in the Google Analytics indicators. In this post-test improvement process, digital analytics was used, consisting of KPI Google Analytics’ goals strategy + RECONAC.
3.1. Model Indicators
The following are the indicators of the model:
TimeOnPage provides the amount of time the user spends on our web page.
Depth is expressed in the number of pages, which is the user’s path when he or she searches each page through the links provided.
BounceRate results in the number of people leaving the site after visiting our home page: BounceRate = bounces/ga = entrances.
Goalconversionrateall is the number of goals reached by a user in his or her session (the measure is given according to the user).
Goalcompletionsall is how many visitors completed all the required elements when a goal is defined (the measure is given according to the goal).
GoalValue s is the monetary value to reach an achieved objective; this variable counts the number of objectives that have generated profits. If the value is 3, this is multiplied by 5 dollars; therefore, the result is 15 dollars earned in that session.
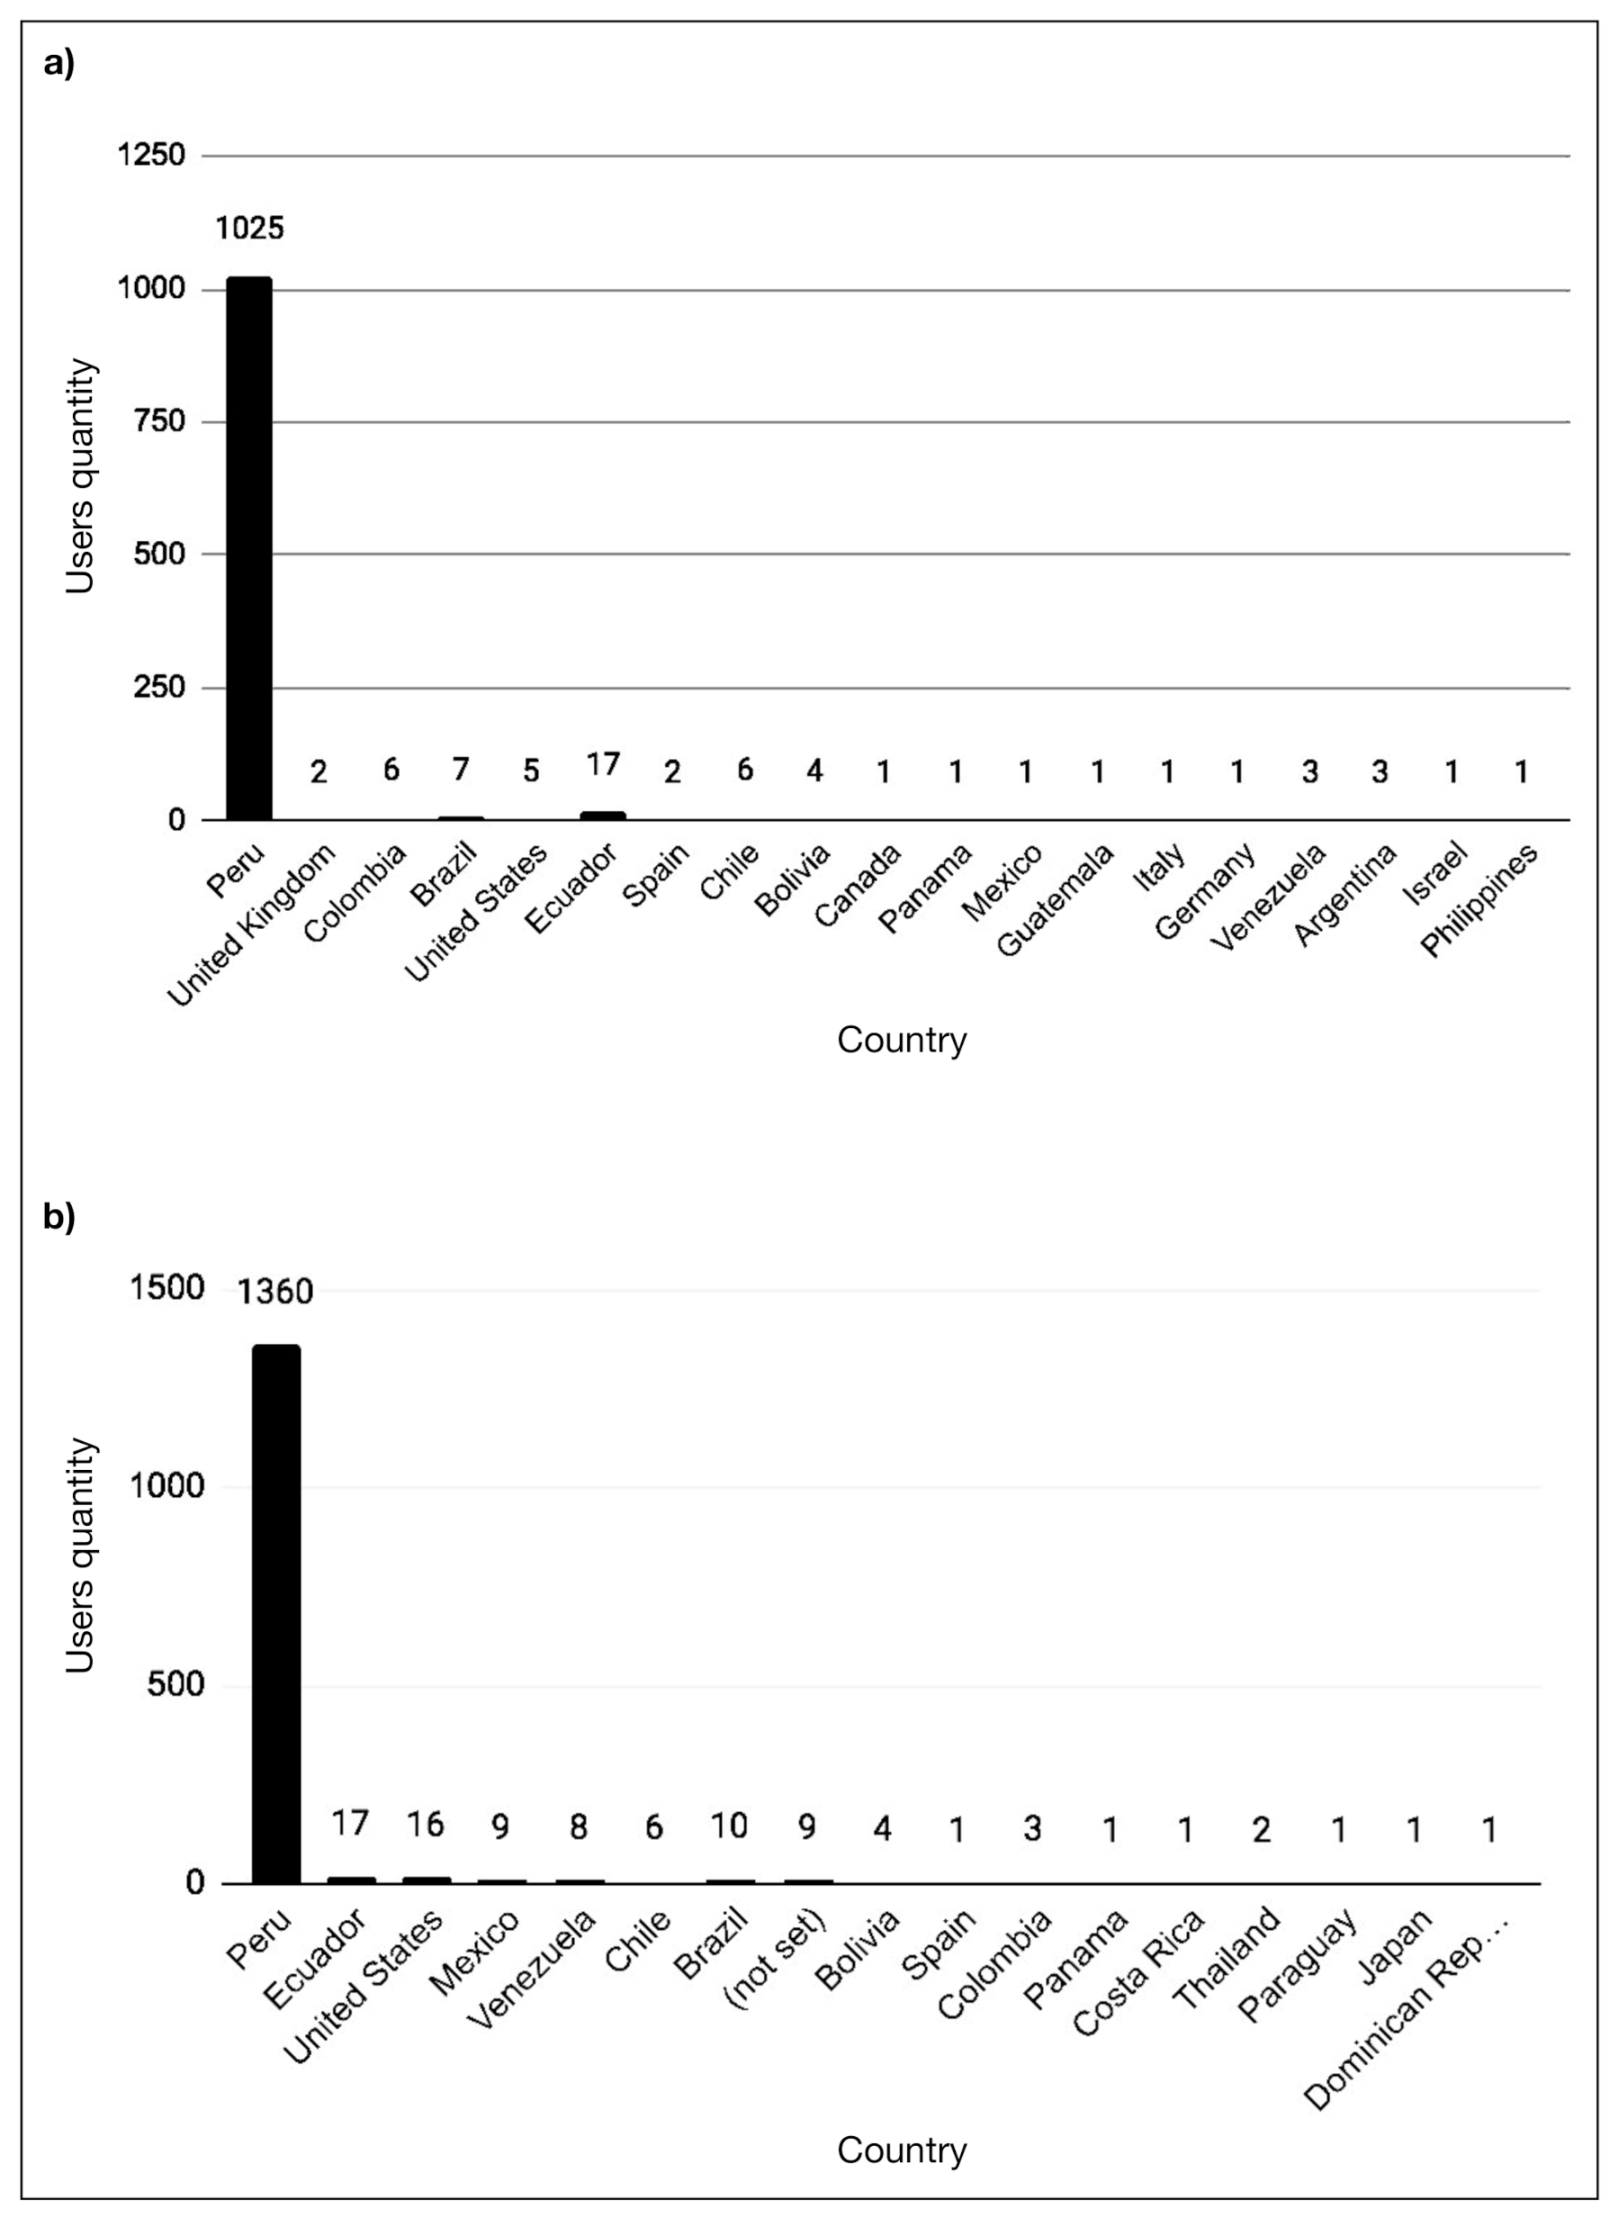
3.2. Sample
In the present study, a non-probabilistic sampling was used. The pre-test was measured from January to March 2018, in which 1088 interactions with the web were obtained. The post-test was conducted from April to December 2018, and 1450 interactions were obtained. In both cases, the sample consisted of potential customers interested in studying a professional career in computing. In addition, the users coming from the pre- and post-test had the demographic description shown in
Figure 2.
3.3. Operationalization of Variables and Indicators
The quality of interaction and adoption by potential customers is a dependent variable. Rodríguez-Martínez et al. [
28] gave an exact conceptualization about the variable under study, which consists of relevant aspects that the user observes through the website’s characteristics, the channel where they usually interact. These factors are related to the information architecture and usability criteria and allow practical access and knowledge of the environment.
The independent variable is the marketing strategy expressed in customer insight. It consists of taking into account the psycho-physiological responses of consumers as variables in the decision-making process. It is a question of studying and understanding the effects of advertising on the brain and the extent to which it affects the behavior of potential customers [
29]. In this sense, one of this work’s contributions is that surveys are not used, which can sometimes be a subjective instrument. The non-subjectivity of the users is important in marketing studies, and, for that reason, the automated
Goals provided by Google Analytics was used as a source of information regarding user interaction.
3.4. Research Instrument
A Google questionnaire validated by expert review was used, which considered the categories of attention, recall, and emotion, as well as aspects of acquisition, conversion, and retention indicators (see
Figure 3). In addition, the reliability of the instrument was analyzed using Cronbach’s alpha coefficient, obtaining a value of 0.97, confirming its reliability.
3.5. Statistical Analysis
The variables provided in
Section 3.1 were statistically summarized using absolute frequencies and proportions; besides, point estimates were used. The fit to a normal distribution was evaluated with the Shapiro–Wilk test. Likewise, Student’s
t-test was used to evaluate the differences before and after implementing the proposed marketing strategy, which was statistically significant (
p-value < 0.05). All analyses were performed using SPSS 23 statistical software.
4. Results
4.1. Strata
At the pre- and post-test levels, the Google Analytics criteria were used to determine two strata, as shown in
Table 1 and
Table 2, respectively.
4.2. The Time the Customer Spends in the Pre- and Post-Testing Phase
This describes the number of seconds a user was in our information channel.
Table 3 shows that the average page time per session in pre- and post-test is 130.57 and 164.52 s, respectively, which makes a difference of averages of 33.95 s, representing a 20.6% increase in the efficiency of marketing’s emotional strategy.
4.3. Pages Visited per Session (Client Conversion Process)
In
Table 4, it can be seen that the number of pages visited per session in pre- and post-test is 102 and 160, respectively, which makes a difference in averages of 58 visits, representing 36.25% for the efficiency of marketing’s emotional strategy.
4.4. Number of Visits That Achieved a Digital Goal
The confidence generated by the published information, with a favorable reaction when observing that the needs are answered in the published message about the service, reveals a high conversion rate, which is shown in the actions that the client makes in the digital channel, such as providing their personal data, interpreted as an objective achieved.
Table 5 shows that the number of visits that completed all the post-test objectives was 28, which represents 46.43% for the efficiency of marketing’s emotional strategy and can be considered a very good increase.
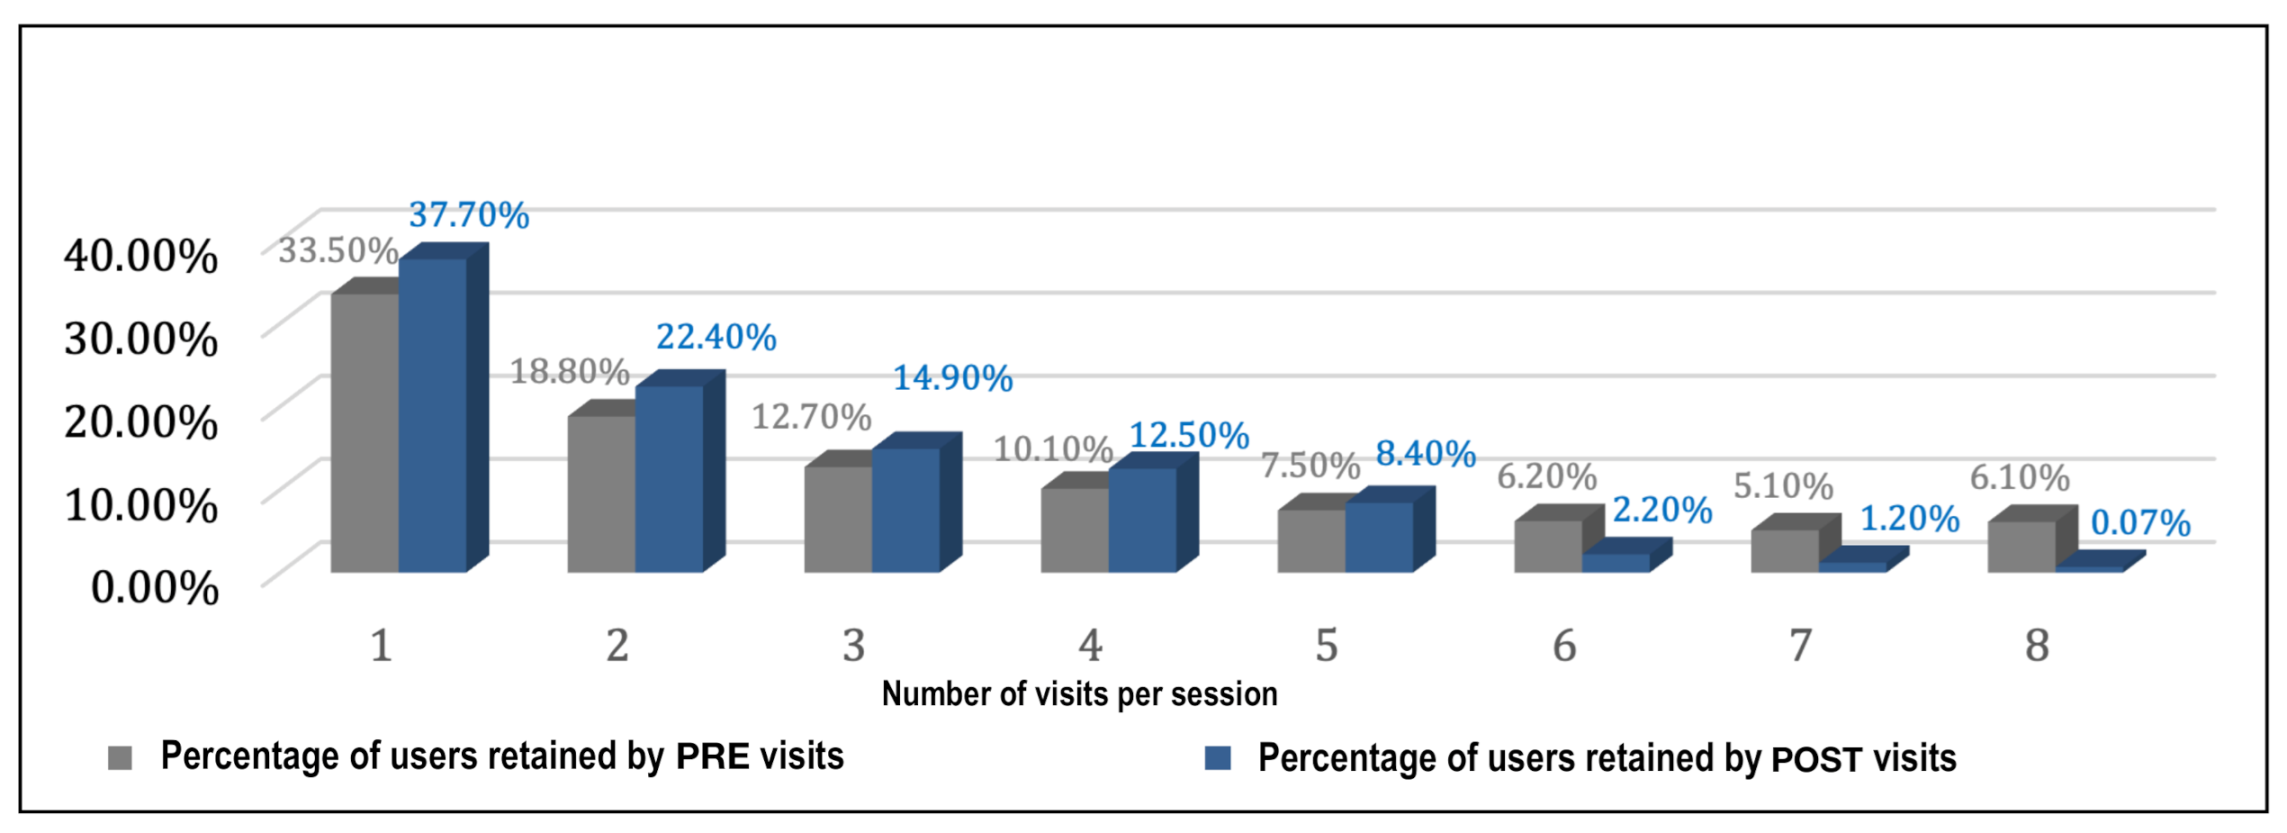
4.5. Retained Clients
Table 6 shows the retention of clients per page visit, in percentage terms; this confirms the marketing model’s relevance and its influence on users’ interaction (see
Figure 4). In this sense, three hypotheses were put forward, supported by a model of structural equations. The first one has to do with the intelligent and emotional strategy of marketing: If the institution implements the emotional intelligence strategy of marketing supported by a structural equation model, then there will be an increased user acquisition potential for the degree programs at the UPeU in Lima.
Likewise, the second one has to do with marketing’s Intelligent Attention Strategy: If the marketing intelligent attention strategy is implemented, supported by a structural equation model, then the number of objectives achieved by a user in his/her session will increase at the UPeU in Lima.
Finally, the third hypothesis is focused on the intelligent strategy of reminders, which is part of marketing: If the intelligent marketing reminder strategy is implemented, supported by a structural equation model, then the number of page views per user in their session will increase at the UPeU in Lima.
As a result of the proposed method, of the 1450 potential clients at the three UPeU sites, 58.7% visited 2 pages, 22% visited 4 pages, 6.8% visited 3 pages, 5.5% visited 6 pages, 2.8% visited 8 pages, 2.1% visited 5 pages, 0.6% visited 10 pages, 0.3% visited 12 pages, 0.2% visited 11 pages, and and 0.1% each visited 9, 14, 15, 18, and 42 pages. This confirms that the marketing model was relevant in the interaction and adoption of potential clients at the three university locations.
5. Conclusions
In this work, a new method called RECONAC is proposed to achieve user insight. Google Analytics metrics and goals were used to improve the proposal. The study’ variables were analyzed through structural equations, with the information provided by data analysis and modeling of an advertising proposal based on marketing strategies. The digital channel handles information that appeals to the user’s remembrance and inspires them to get a career according to their needs. Thanks to user post-sale experience, their retention is achieved, and they become brand evangelists.
The results obtained confirm the marketing model’s relevance in adopting and interacting with the UPeU’s potential clients in its three locations. The proposed model managed to increase website users’ acquisition who are potential customers for institutional purposes. One indicator is in the significantly influenced time on pages per session, leading to a 36.25% efficiency increase for the process. Likewise, this improvement increased the channel’s performance, as measured through the increase in the number of objectives achieved, which were modeled through Google Analytics.
Finally, it is concluded that the proposed marketing strategy significantly influenced the number of users who completed all objectives with a 46.43% effectiveness of the process. Likewise, the retention of potential clients from the three university sites was improved.
Author Contributions
Conceptualization, J.S.-G. and J.J.S.; methodology, J.S.-G. and J.L.L.-G.; software, J.L.L.-G.; validation, H.A.-G. and J.S.-G.; formal analysis, J.L.L.-G. and J.E.T.-C.; investigation, J.S.-G.; and writing—review and editing, J.S.-G., H.A.-G., J.E.T.-C., J.J.S. and J.L.L.-G. All authors have read and agreed to the published version of the manuscript.
Funding
This research received external funding by Universidad Peruana Unión.
Institutional Review Board Statement
Not applicable.
Informed Consent Statement
Not applicable.
Data Availability Statement
Not applicable.
Conflicts of Interest
The authors declare no conflict of interest.
References
- Fisher, C.E.; Chin, L.; Klitzman, R. Defining neuromarketing: Practices and professional challenges. Harv. Rev. Psychiatry 2010, 18, 230–237. [Google Scholar] [CrossRef]
- Sebastian, V. Neuromarketing and evaluation of cognitive and emotional responses of consumers to marketing stimuli. Procedia-Soc. Behav. Sci. 2014, 127, 753–757. [Google Scholar] [CrossRef] [Green Version]
- Vetoncilla Maestre, J.E. Construction process of communication insight into a brand of ’national’ soda. Alma Máter 2015, 2, 81–93. [Google Scholar]
- Mas, J.M.; Gómez, A. Social partners in the digital ecosystem: WWill business organizations, trade unions and government organizations survive the digital revolution? Technol. Forecast. Soc. Chang. 2021, 162, 120349. [Google Scholar] [CrossRef]
- Schmidt, S. Evaluación de los Sitios Web de los Hoteles e Implicaciones para la Gestión del Marketing Hotelero. Ph.D. Thesis, Universitat de les Illes Balears, Palma, Spain, 2006. [Google Scholar]
- Castillo, A.C. Análisis de un Modelo de Diferenciación Efectiva en Base a la Optimización de la Lealtad de Clientes en el Sector Turístico. Ph.D. Thesis, Universitat Politècnica de València, Valencia, Spain, 2012. [Google Scholar]
- Rodas-Areiza, J.A.; Montoya-Restrepo, L.A. Methodological proposal for the analysis and measurement of sensory marketing integrated to the consumer experience. Dyna 2018, 85, 54–59. [Google Scholar] [CrossRef]
- Sivasubramaniyam, R.D.; Sargisson, R.J.; Charlton, S.G. Satisfaction from satisficing: Understanding commuters’ satisficing tendencies. Transp. Res. Interdiscip. Perspect. 2020, 6, 100158. [Google Scholar] [CrossRef]
- Izquierdo Yusta, A.; Martínez Ruiz, M.P.; Jiménez Zarco, A.I. Condicionantes económicos de la adopción de una innovación por parte del consumidor: Análisis de la compra de servicios online. Innovar 2010, 20, 173–186. [Google Scholar]
- Crespo-Pereira, V.; Martinez-Fernandez, V.A.; Garcia-Soidan, P. The neuromarketing professional in the Spanish audiovisual sector. Prof. Inf. 2016, 25, 209–216. [Google Scholar]
- Schlesinger, M.W.; Taulet, A.C.; Bonillo, M.Á.I.; Fernández, R.S. Un enfoque de marketing de relaciones a la educación como un servicio: Aplicación a la Universidad de Valencia. INNOVAR. Rev. Cienc. Adm. Soc. 2014, 24, 113–125. [Google Scholar] [CrossRef]
- Villarejo-Ramos, Á.F.; Rondán-Cataluna, F.J.; Revilla-Camacho, M.Á. Tipología de compradores online mayores de 55 anos. Innovar 2016, 26, 61–72. [Google Scholar] [CrossRef]
- Klaric, J. Estamos Ciegos, 1st ed.; Planeta: Lima, Perú, 2012; Available online: http://bvc.cea-atitlan.org.gt/id/eprint/482 (accessed on 7 January 2021).
- Ahmed, H.; Jilani, T.A.; Haider, W.; Abbasi, M.A.; Nand, S.; Kamran, S. Establishing standard rules for choosing best KPIs for an e-commerce business based on google analytics and machine learning technique. Int. J. Adv. Comput. Sci. Appl. 2017, 8, 12–24. [Google Scholar] [CrossRef] [Green Version]
- Saura, J.R.; Palos-Sánchez, P.; Cerdá Suárez, L.M. Understanding the digital marketing environment with KPIs and web analytics. Future Internet 2017, 9, 76. [Google Scholar] [CrossRef] [Green Version]
- Clifton, B. Advanced Web Metrics with Google Analytics; John Wiley & Sons: Hoboken, NJ, USA, 2012. [Google Scholar]
- Järvinen, J.; Karjaluoto, H. The use of Web analytics for digital marketing performance measurement. Ind. Mark. Manag. 2015, 50, 117–127. [Google Scholar] [CrossRef] [Green Version]
- García-Fernández, M. Influencia de la gestión de la calidad en los resultados de innovación a través de la gestión del conocimiento. Un estudio de casos. Innovar 2016, 26, 45–64. [Google Scholar] [CrossRef]
- Chivu, C.; Antoce, A.O. A review of the conversion rate in monitoring the marketing performance of retail wine shops. Sci. Pap. Ser. B Hortic. 2014, LVIII, 145–151. [Google Scholar]
- Gupta, S.; Leszkiewicz, A.; Kumar, V.; Bijmolt, T.; Potapov, D. Digital analytics: Modeling for insights and new methods. J. Interact. Mark. 2020, 51, 26–43. [Google Scholar] [CrossRef]
- de Oliveira, J.H.C.; Giraldi, J.D.M.E.; dos Santos, R.D.O.J. Opening the “Black Box” in the Consumer’s Mind: Understanding What is Neuromarketing. Int. J. Bus. Manag. 2014, 9, 96. [Google Scholar] [CrossRef] [Green Version]
- Ariely, D.; Berns, G.S. Neuromarketing: The hope and hype of neuroimaging in business. Nat. Rev. Neurosci. 2010, 11, 284–292. [Google Scholar] [CrossRef] [Green Version]
- Khushaba, R.N.; Wise, C.; Kodagoda, S.; Louviere, J.; Kahn, B.E.; Townsend, C. Consumer neuroscience: Assessing the brain response to marketing stimuli using electroencephalogram (EEG) and eye tracking. Expert Syst. Appl. 2013, 40, 3803–3812. [Google Scholar] [CrossRef]
- Tapia-Frade, A.; Martín-Guerra, E. Neurociencia y publicidad. Un experimento sobre atención y emoción en publicidad televisiva. Innovar 2017, 27, 81–92. [Google Scholar] [CrossRef]
- Castro, W.R.A. Un caso. Cuad. Admin. 2013, 29, 17–27. [Google Scholar]
- Roth, V. The Potential of Neuromarketing as a Marketing Tool; University of Twente: Enschede, The Netherlands, 2014; Available online: http://purl.utwente.nl/essays/65342 (accessed on 7 January 2021).
- Pradeep, A.K. The Buying Brain: Secrets for Selling to the Subconscious Mind; John Wiley & Sons: Hoboken, NJ, USA, 2010. [Google Scholar]
- Rodríguez-Martínez, R.; Codina, L.; Pedraza-Jiménez, R. Indicadores para la evaluación de la calidad en cibermedios: Análisis de la interacción y de la adopción de la Web 2.0. Rev. Esp. Doc. Cient. 2012, 35, 61–93. [Google Scholar] [CrossRef] [Green Version]
- Hsu, L.; Chen, Y.J. Neuromarketing, subliminal advertising, and hotel selection: An EEG study. Australas. Market. J. AMJ 2020, 28, 200–208. [Google Scholar]
| Publisher’s Note: MDPI stays neutral with regard to jurisdictional claims in published maps and institutional affiliations. |
© 2021 by the authors. Licensee MDPI, Basel, Switzerland. This article is an open access article distributed under the terms and conditions of the Creative Commons Attribution (CC BY) license (http://creativecommons.org/licenses/by/4.0/).


 ,
, 


