
Model-Driven Approach of Virtual Interactive Environments for Enhanced User Experience
by
 , , and
Héctor Cardona-Reyes
1,* ,
,
Jaime Muñoz-Arteaga
2,
Andres Mitre-Ortiz
3 and
Klinge Orlando Villalba-Condori
4
1
CONACYT Research Fellow, CIMAT, Zacatecas 98160, Mexico
2
Autonomous University of Aguascalientes, Aguascalientes 20131, Mexico
3
Center for Research in Mathematics, Quantum Knowledge City, Zacatecas 98160, Mexico
4
Vice-Rectorate of Research of the Universidad Católica de Santa María, Arequipa 1350, Peru
*
Author to whom correspondence should be addressed.
Appl. Sci. 2021, 11(6), 2804; https://doi.org/10.3390/app11062804
Submission received: 24 February 2021
/
Revised: 13 March 2021
/
Accepted: 17 March 2021
/
Published: 21 March 2021
(This article belongs to the Collection Software Engineering: Computer Science and System)
Abstract
:The video game and entertainment industry has been growing in recent years, particularly those related to Virtual Reality (VR). Therefore, video game creators are looking for ways to offer and improve realism in their applications in order to improve user satisfaction. In this sense, it is of great importance to have strategies to evaluate and improve the gaming experience in a group of people, without considering the fact that users have different preferences and, coupled with this, also seeks to achieve satisfaction in each user. In this work, we present a model to improve the user experience in a personal way through reinforcement learning (RL). Unlike other approaches, the proposed model adjusts parameters of the virtual environment in real-time based on user preferences, rather than physiological data or performance. The model design is based on the Model-Driven Architecture (MDA) approach and consists of three main phases: analysis phase, design phase, and implementation phase. As results, a simulation experiment is presented that shows the transitions between undesired satisfaction states to desired satisfaction states, considering an approach in a personal way.
1. Introduction
Nowadays, video games are not only oriented to entertainment. Their portability and availability on multiple platforms allow them to be considered for diverse applications in various disciplines. Authors such as Boyle et al. [1] present video games aimed at Science, Technology, Engineering, and Mathematics (STEM) Forsyth et al. [2], Coller and Scott [3], Joiner et al. [4], and Pichierri et al. [5] mention some of them that are oriented to companies with a knowledge acquisition purpose. Among the most popular today, we can find video games oriented to the health field, which cover exercise, rehabilitation [6,7], quality of life [8], and advanced life support training [9]. These were considered to be entertaining and address affective, cognitive, and physiological states. In addition, they are often considered a pleasurable and rewarding activity [10,11], enhancing interest in a method that keeps users at the edge of their performance.
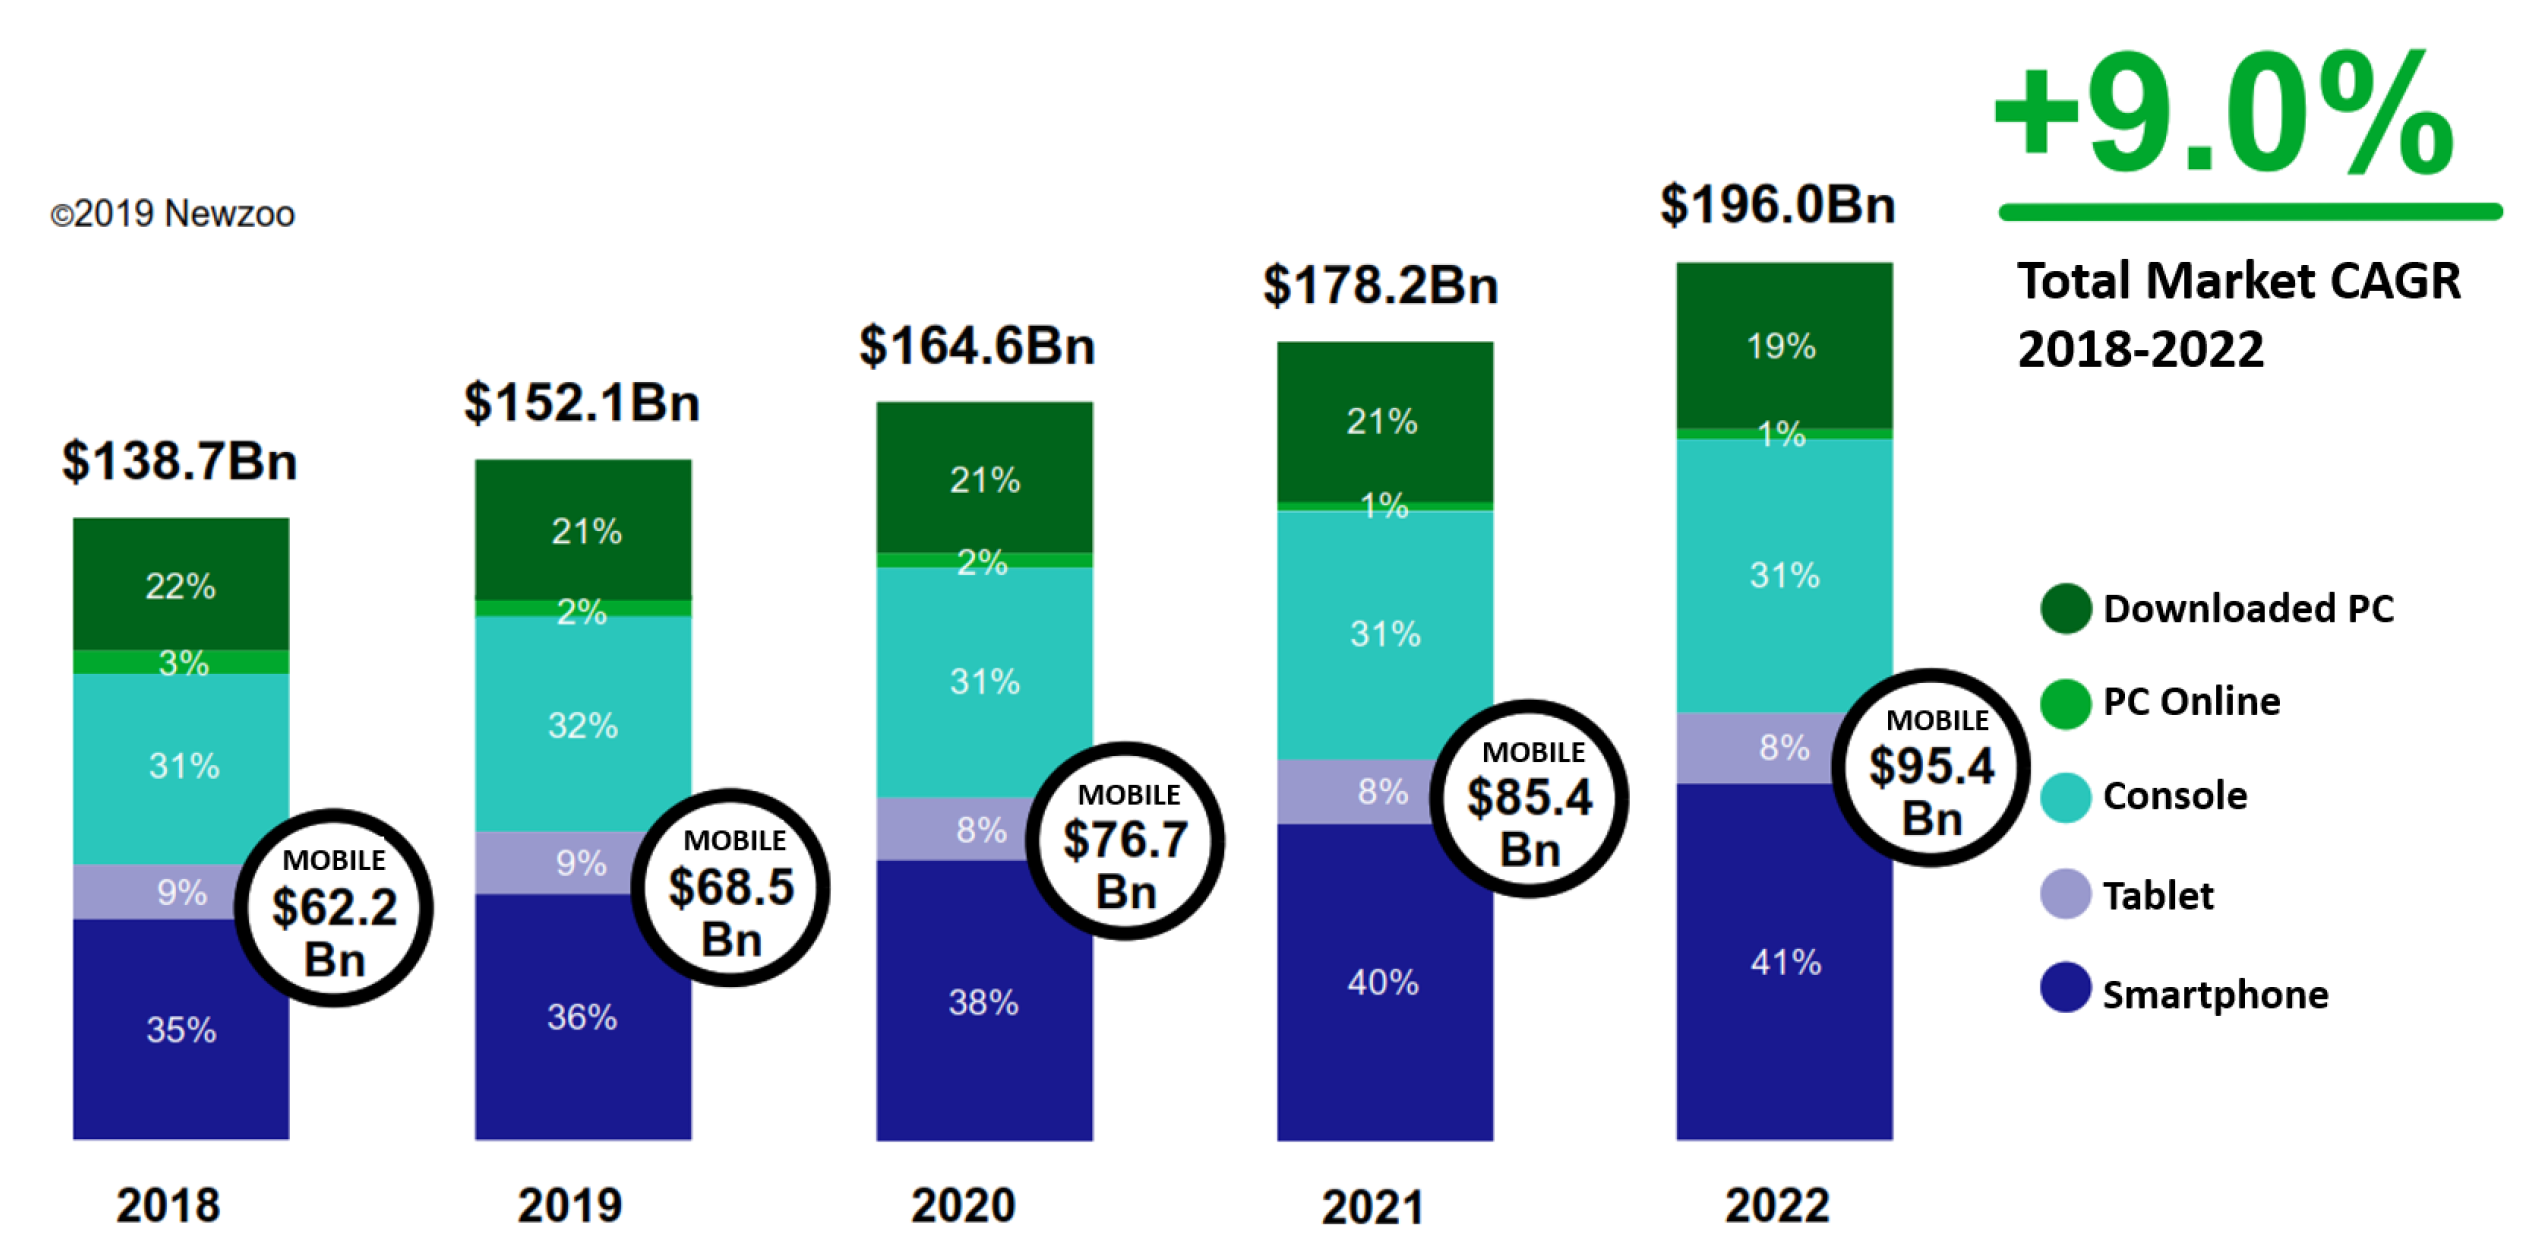
In the field of entertainment, the video game industry is one of the industries with the highest revenues worldwide. Being one of the preferred activities for young and old. Video games in 2019 reported revenues of more than $152.1 billion, with a year-on-year increase of +9.6%. By 2022, it has an estimate of $196.0 billion with a Compound Annual Growth Rate (CAGR) of +9.0% from 2018 to 2022 [12]. As shown in Figure 1.
Video games are considered a deeply engaging activity because of their focus on elevating user experience (UX), engagement, presence, immersion, flow, psychological absorption, and dissociation. Currently, VR plays an important role in the new generation of video games, as it offers novel forms of interaction making them even more attractive to users. Among the advantages of virtual reality is that it provides presence and telepresence, which refers to the feeling of being in an environment in an immersive way. This technology has been widely applied to different disciplines, such as entertainment [13], education [14], and health [15]. Authors such as Neri et al. [16] have presented the positive effects of using virtual reality in older adults so that they can improve their mobility skills and balance measurements, in addition to obtaining positive effects concerning balance and fear of falling Neri et al. [16]. Virvou and Katsionis [17] presented a study in which they measured the usability of virtual reality in an educational game context, the results of this evaluation concluded that the virtual reality video game was usable and enjoyable for students.
In other fields of application in which virtual environments can be mentioned, we can find authors such as Lokka and Çöltekin [18] who propose a design of memorable 3D geovisualizations for the acquisition of spatial knowledge during virtual navigation. In this proposal, a study is carried out in which realistic and abstract geovisualizations are proposed in order to verify learning in different contexts. This study allowed us to know the behavior of the users before the different types of geovisualizations and how they use their cognitive skills and experience to solve navigation tasks. Hruby et al. [19] analyzed the basic characteristics of highly immersive virtual environments (HIVE). These proposed environments offer a level of detail to the user that allows him/her to have a lived experience. In addition, the concepts used in cartography such as scale and time are introduced and are brought to virtual reality. One of the objectives of this work is to identify the characteristics of HIVE that can be used in geo-visualization applications Keil et al. [20]. It offers an alternative so that developers can use geospatial data in virtual environments, allowing one to produce cartographic applications in which digital elevation information, data models can be considered, and that can also simulate constructions, represent places, or specific situations. Offering new forms of interaction to users through immersive virtual environments. As can be seen, various growing industries are adopting solutions based on virtual reality, which is why it is necessary to have strategies in the field of user experience. Interaction with virtual environments has a great physiological impact on users that can generate positive or negative results (for example, boredom and disinterest), so the user experience must be cautious. On the other hand, it is important to have a design of virtual environments that can provide support to researchers and designers so that they can improve the user experience and encourage more researchers to carry out more studies in the area.
Under this context, the use of model-based strategies oriented to software development brings several advantages for the designers [21]. Due to the complexity of software artifacts, it is necessary to establish various levels of abstraction for proper identification of the profiles involved and thus define the development phases and objectives. In addition, having software that can meet user expectations requires that it can constantly evolve because there are a variety of stakeholders involved and a degree of mediation is required to describe the technical aspects of the development. Systems development under a model-driven approach includes software capable of automatically discovering the properties of its environment and adapting to that environment by various means, including dynamic modification of its own behavior [22]. This work presents a model for the design of virtual environments under Model-Driven Architecture (MDA). This proposed model has the purpose of producing virtual environments where the user’s personal adjustment of parameters can be considered by means of the reinforcement learning technique, so that these environments can be adapted to the consumer’s preferences.
This work is composed of the following sections. Section 2 presents a literature review on the topic of UX in virtual environments, particularly the functionalities of modeling tools. Section 3 presents a literature review of work using a model-based approach to solution development. Section 4 advocates a new UX improvement model under the MDA approach. Section 5 implements the proposed model in a case study and the results are presented in Section 6. Section 7 discusses the implementation results. Finally, conclusions and future work are presented in Section 8.
2. Background
2.1. Virtual Environments
Virtual environments offer various forms of interaction and immersion, which allows them to be considered in various fields of application involving simulation and training under different scenarios represented by virtual worlds. In this sense, we can find several classifications of these environments.
- Augmented Reality (AR) virtual environments provide the user with a semi-immersive, non-intrusive experience and have a wide range of applications such as video games [23], in construction [24], and applications for mobile devices [25], object tracking and recognition, among others. The glasses contain a screen placed in front of the human eye and produce a virtual image, allowing the user to naturally experience a mixture of virtual information from the real world [26].
- Virtual Reality (VR), according to Jerald [27], is defined as a digital environment generated by a computer that can experience and interact as if that environment were real. Virtual reality environments contribute to the presence and telepresence [27]; this refers to the feeling of being in an environment in an immersive way. This technology is widely applied to different fields such as entertainment [13], education [14], and healthcare [15]. VR encompasses a variety of users, such as older adults [16] where the use of VR environments is suggested to improve balance and mobility compared to conventional and untreated interventions, and children and youth where the usability of VR is studied in an educational gaming context. Some evaluations show that VR games are useful and enjoyable in students [17].
- Mixed Reality (MR), according to Speicher et al. [28], is classified into four strands: that which may or may not include VR, a combination of AR and VR, the ability to combine the two technologies in one system or mobile device, and as an enhancement of AR. That is, it includes physical interaction with virtual elements.
2.2. Player and Video Game Aspects
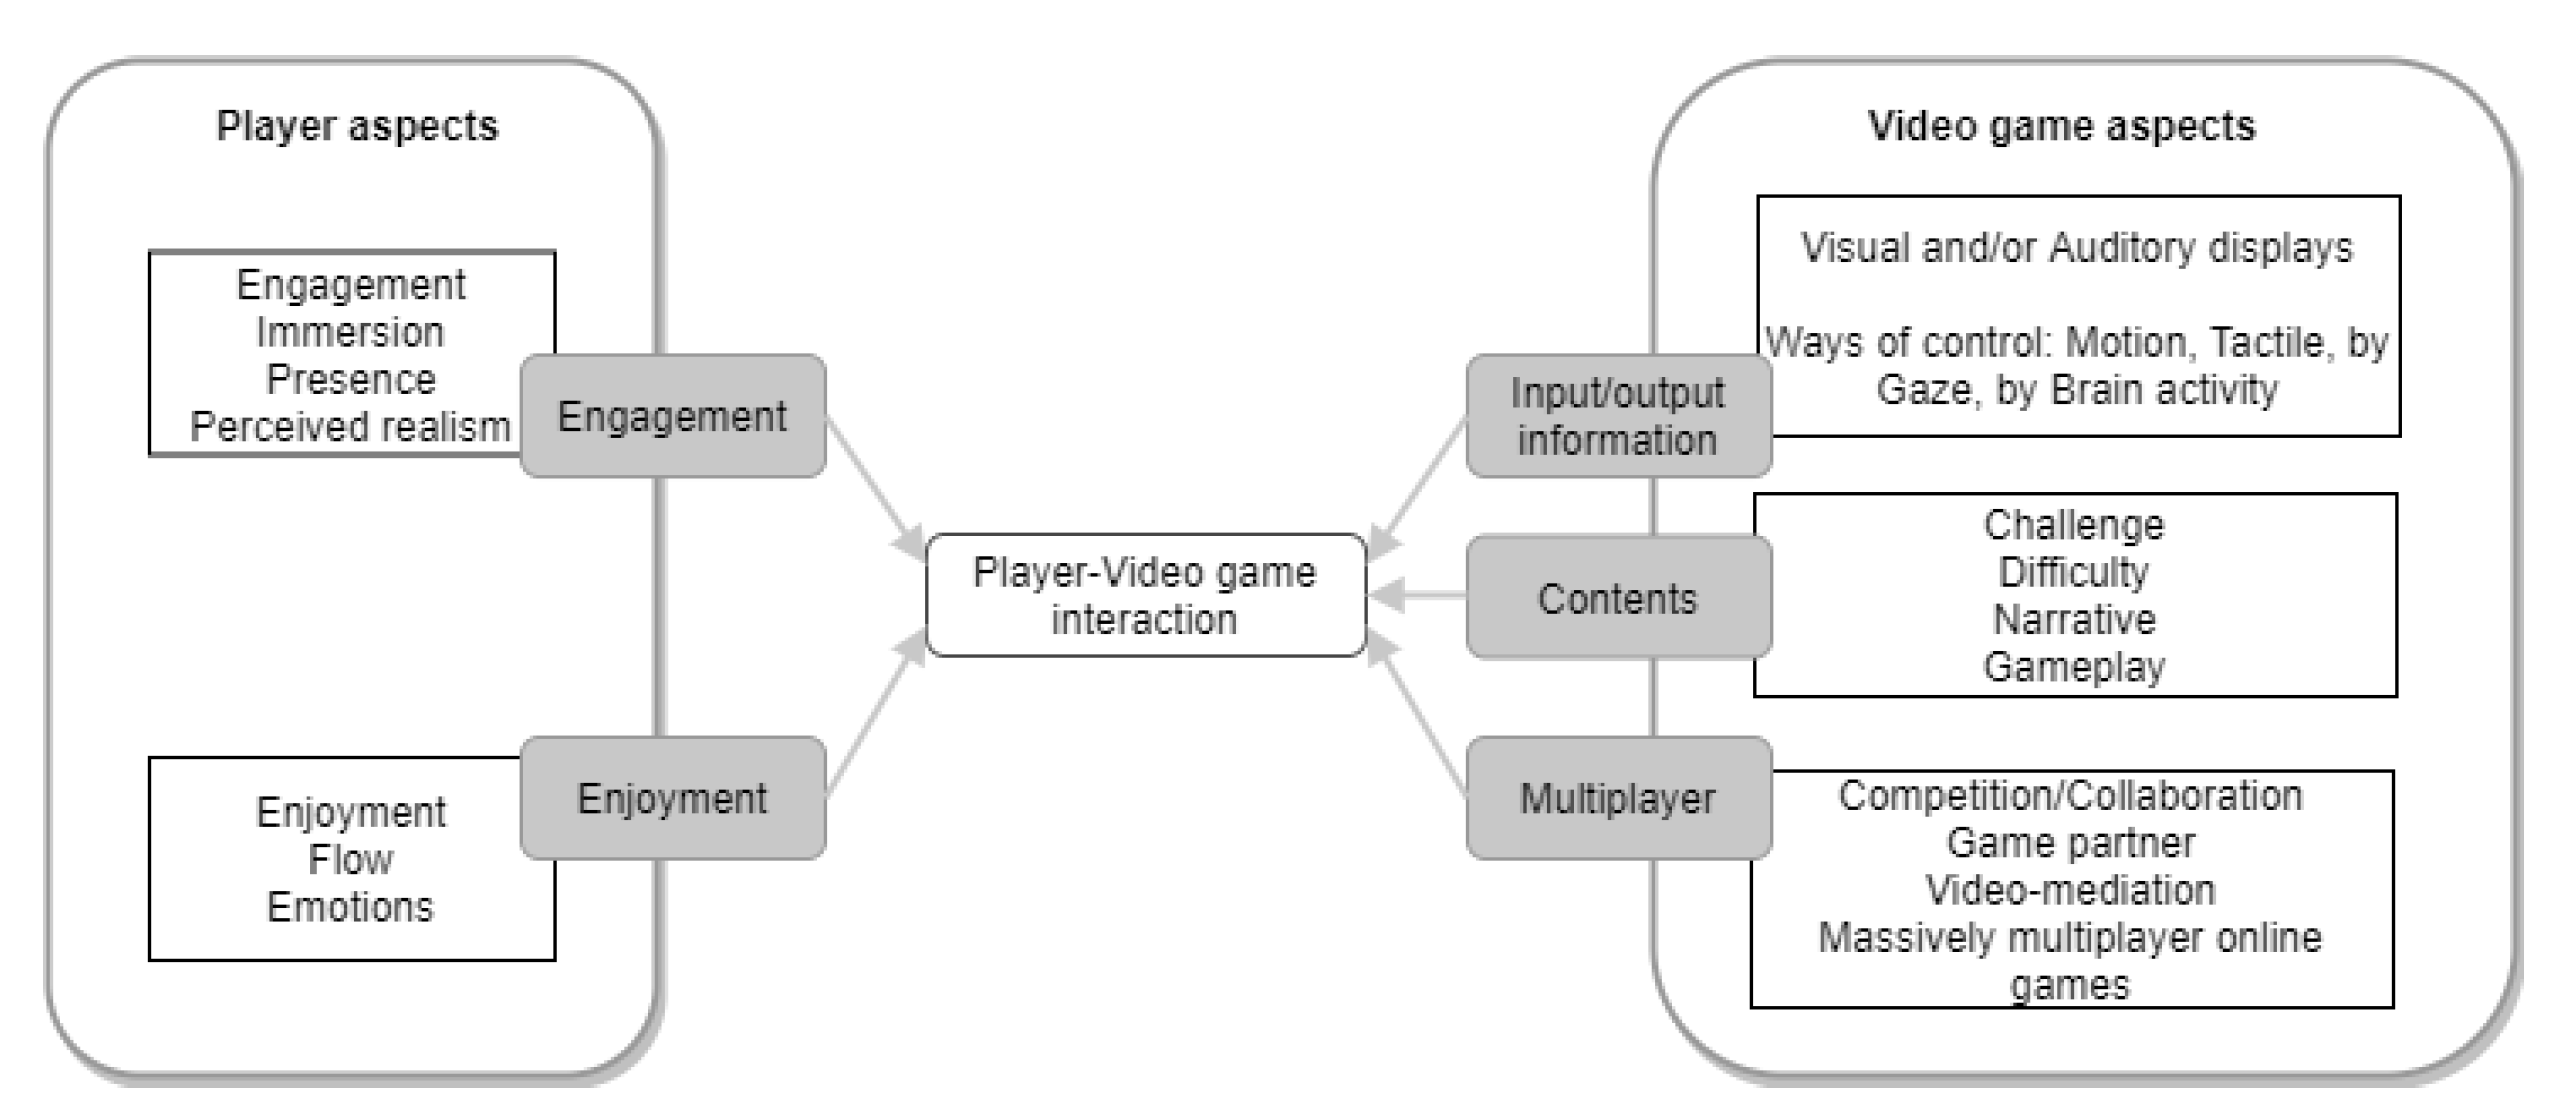
According to Caroux et al. [29], player–video game interactions are interactions that influence the technical aspects of video games, and they also influence the participation and enjoyment of players. Regarding the design of video games, the aim is to offer the user the best possible experience. In this sense, Caroux mentions the lack of strategies that allow a correct definition of player–video game interactions, so he proposes a list of aspects of player–video game interaction, as shown in Figure 2. With this, Caroux intends to contribute elements to researchers and developers so that they can better understand the role of the aspects and their practical implications to optimize the interactions between the player and the video game.
2.3. Reinforcement Learning
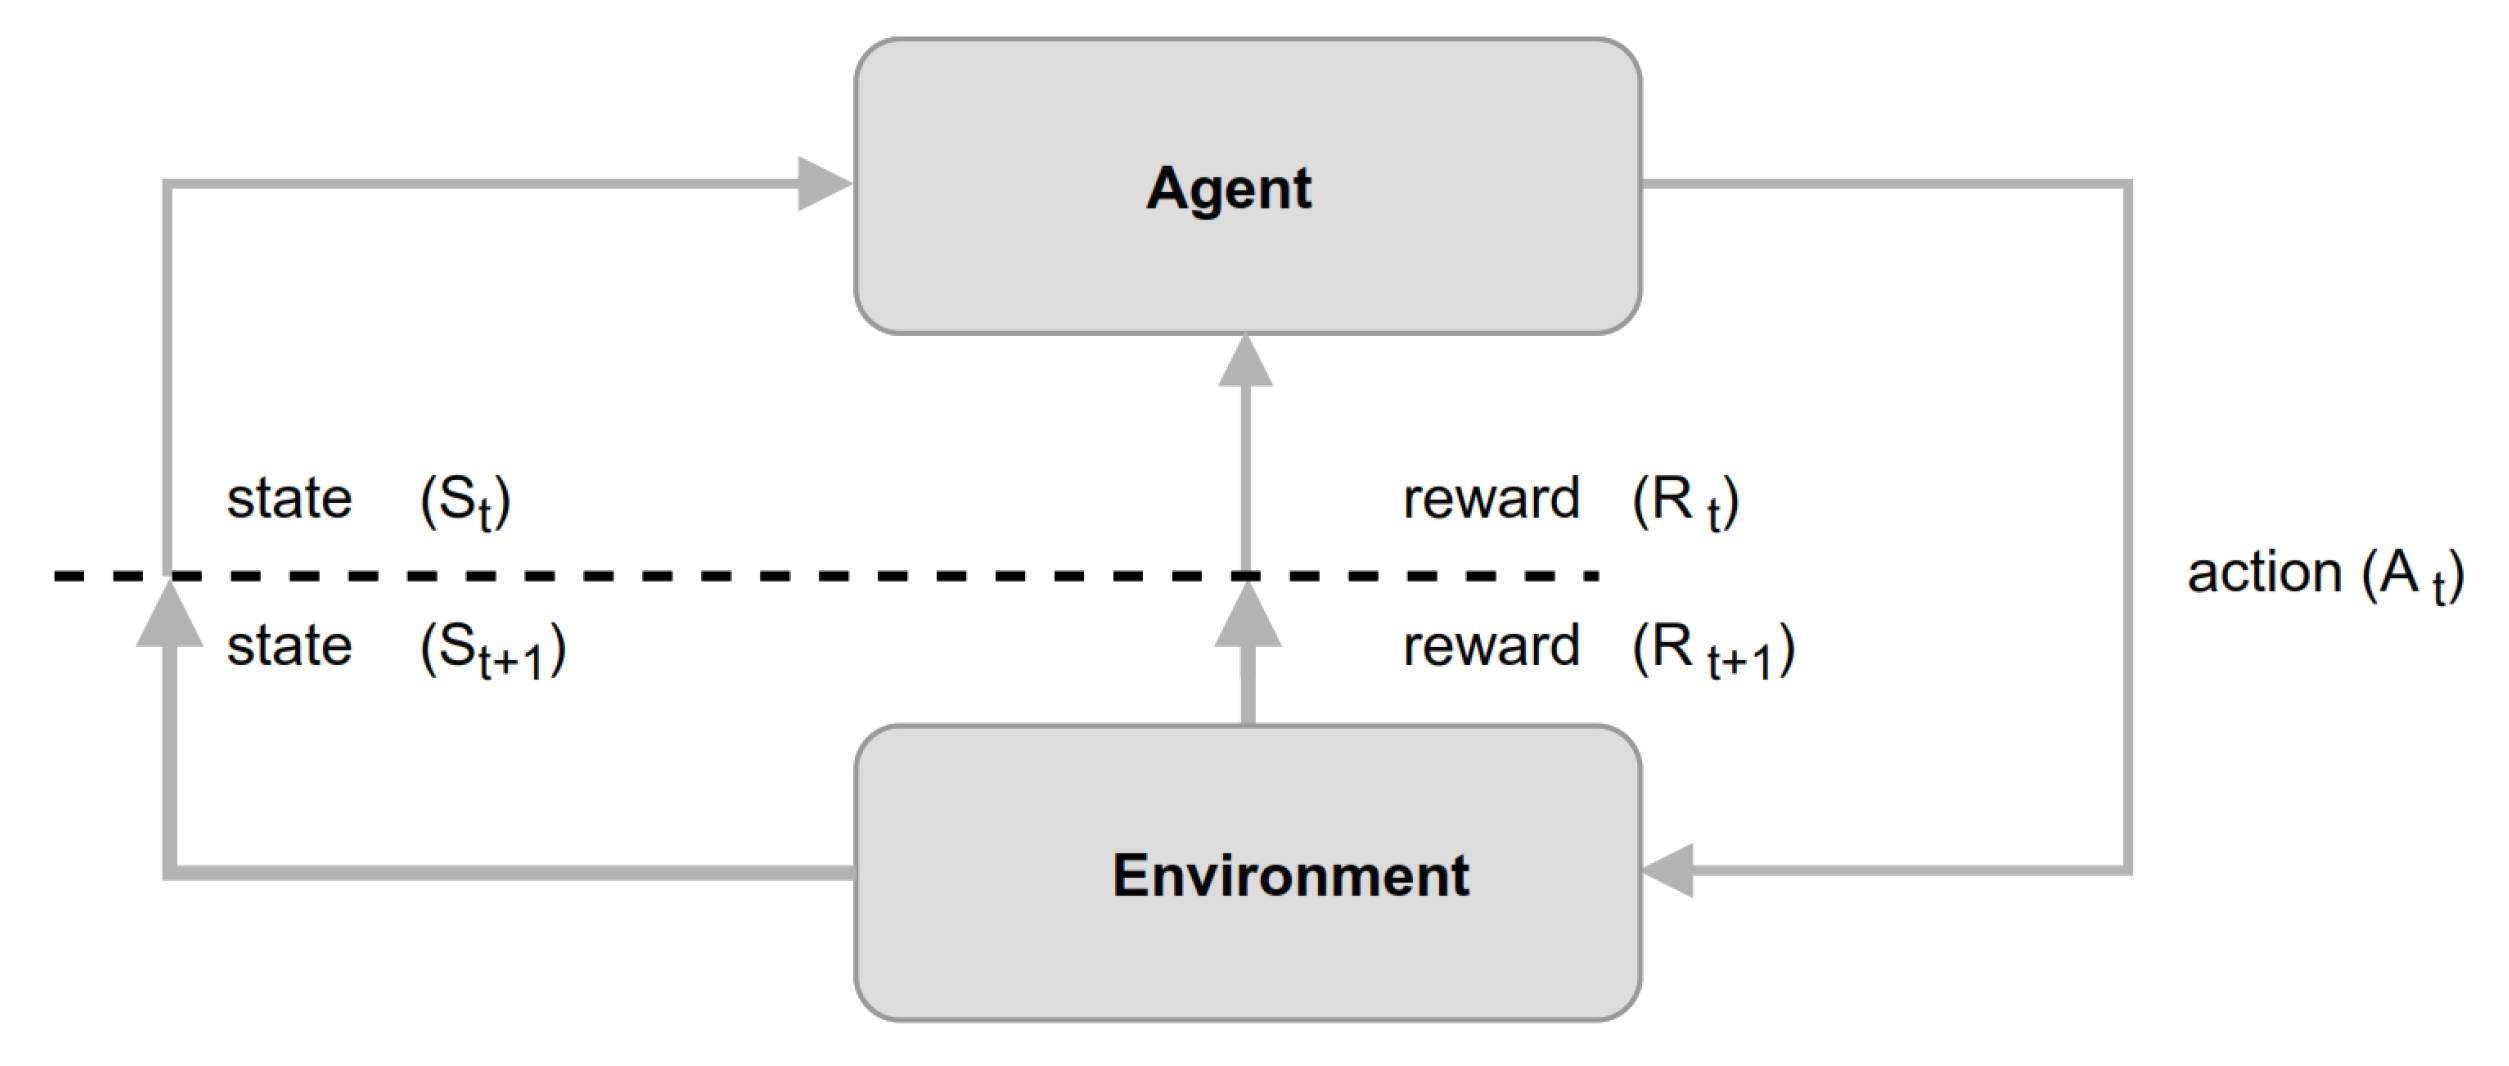
Reinforcement Learning (RL) is a machine learning technique for sequential decision-making systems [30]. The goal is to control a system to maximize a numerical performance measure (a reward) over the long-term through a set of actions by an agent, as presented in Figure 3. These algorithms do not require a dataset, instead they provide partial information to an agent and find a policy that returns the maximum measured numerical performance. In the area of RL, there are algorithms of Dynamic Programming (DP) and Temporal-Difference (TD) algorithms. DP requires knowledge of a model of the world (e.g., Markov decision process) and TD methods that learn directly from experience (resampling), without a model of the dynamics of the environment (i.e., does not require knowledge of the world). One of the most widely used algorithms is Q-learning, which takes model-free (i.e., it is not based on transition probabilities) and out-of-policy (the agent follows any policy) incremental learning until it converges to the optimal policy [31]. This algorithm has been applied to several problems in control systems, games, and robotics [32]. It differs from other RL algorithms in that it does not require knowledge of a model or training data, and it finds the optimal solution by calculating values for the action-value function (Equation (1)) until it converges.
2.4. Model-Driven Architecture (MDA)
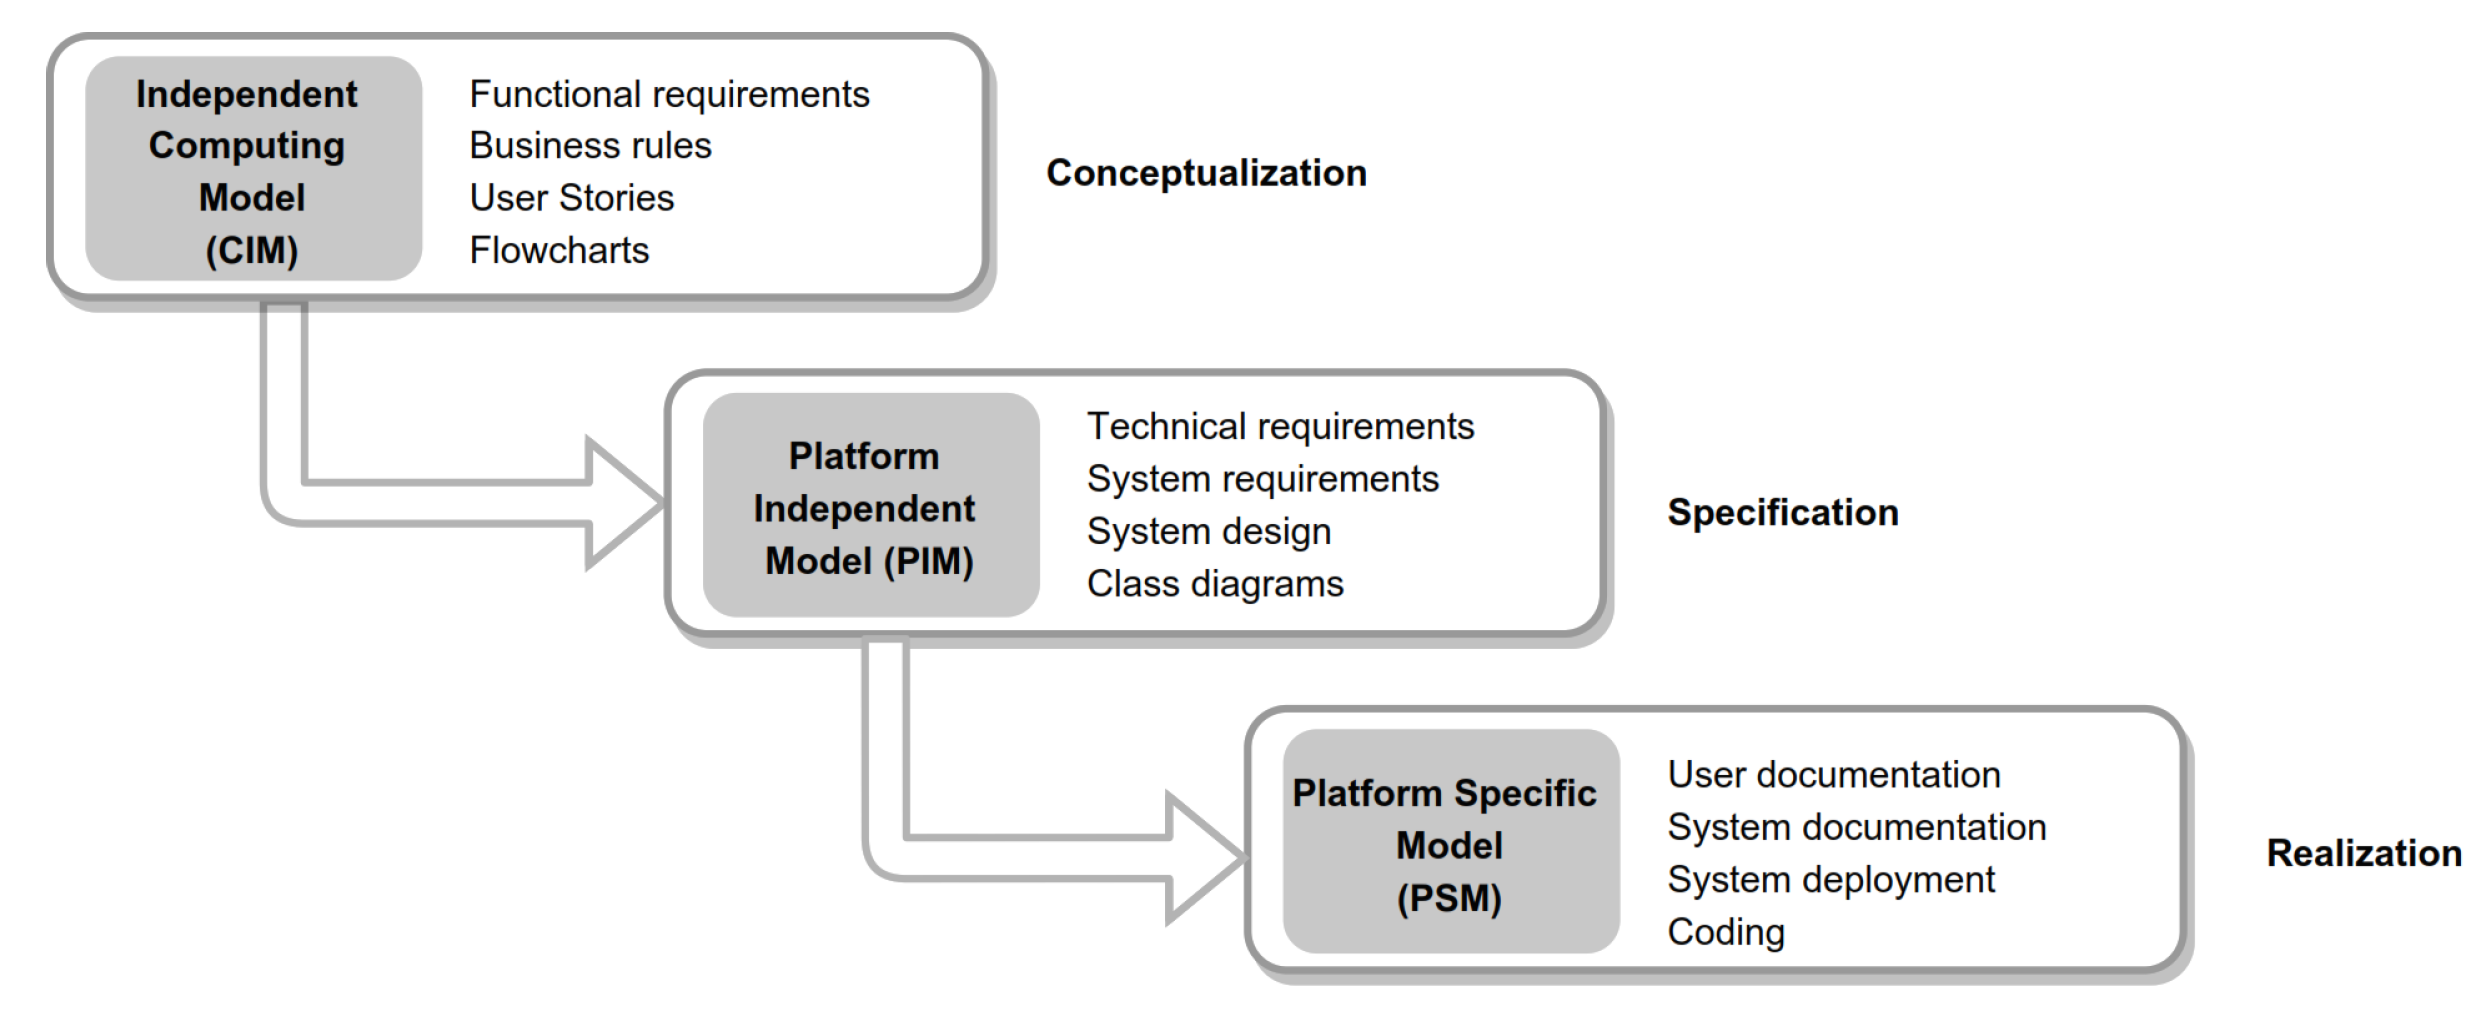
From a Human–Computer Interaction approach, Model-Driven Architecture (MDA) is a technique in software design that separates the business from the system for a specific platform. MDA allows working on different application domains and technology platforms allowing to transform platform-independent models to produce specific models. This approach is flexible, increases the level of abstraction, enables integration and maintenance, and reuse.
MDA provides a set of instructions for structuring specifications, which is based on transformations between interconnected models (Figure 4):
- The Computer-Independent Model (CIM) provides a formal representation of the system from a high-level perspective. The objective is to present the basic structure of the system (e.g., functional and non-functional requirements, business rules, user stories, etc.), this is known as the business model.
- The Platform-Specific Model (PSM) implements the designed artifacts of the PIM model. It is characterized by system documentation and system coding.
3. Related Work
In the literature, we can find several strategies for software and video game development under a model-driven approach [35,36,37,38]. Some of these proposals focus on reducing the number of errors, the time required, and development costs, thua favoring higher productivity [39]. Other works include factors such as usability and user experience, where the model-driven approach allows establishing traceability throughout the development process. Some of these works are presented below. Fernandez et al. [40] proposes an approach for video game development based on MDA where rapid iterations are generated at the beginning of the development, and independent and platform-specific models can be evaluated to identify and correct usability problems before reaching the final code generation stage of the video-game. The use of model-based approaches helps designers and developers to have traceability mechanisms that are difficult to find in traditional development approaches.
Works such as Valdez et al. [41] use the model-based approach to increase productivity through the reuse of standardized models, which helps to simplify the development process and the generation of best practices in the domain application. Valdez proposes a platform that aims to facilitate the development of video games under the model-based engineering approach through the use of domain-specific languages (DSL). This is a declarative language focused on solving problems over a particular domain. It allows models to be clearly expressed using a DSL whose language is specifically designed to meet the specific needs of the application domain.
Authors such as Abrahao et al. [42] focus on aspects of usability and playability, as these are important aspects that allow the user to learn and use the video game, and consequently, to make it attractive. Abrahão identified that the evaluations of these aspects are performed in the later stages of the development cycle, so a model-driven approach can offer an alternative for their detection and correction, due to their intrinsic traceability mechanisms. Thus, platform-independent and platform-specific models can be evaluated to correct usability problems before the generation of the final video game code.
This literature review allows highlighting the importance of having strategies under model-based approaches that allow for the generation of virtual environments in which the parameters that help to provide a better user experience can be identified and validated throughout the development life cycle.
4. Model to Evaluate and Improve User Experience
This section presents a model that allows virtual environments to be adapted to the user’s preferences in a personal way [43,44,45,46]. This is intended to improve satisfaction and avoid negative outcomes while interacting with the virtual environment. The model considers RL and MDA strategies in its design. In the literature, we can find approaches that only focus on evaluating and improving the game experience [44,45,47] without considering the fact that all users have different preferences, and therefore achieving the satisfaction of each one differs. Likewise, other approaches adjust the game based on physiological data, which state that difficulty levels are related to user states. High levels of difficulty lead to anxiety, frustration, and stress, and low levels of difficulty lead to apathy, boredom, and relaxation. Contradictory to this, some users may enjoy states of anxiety, and just as many may be satisfied with states of apathy and relaxation [48].
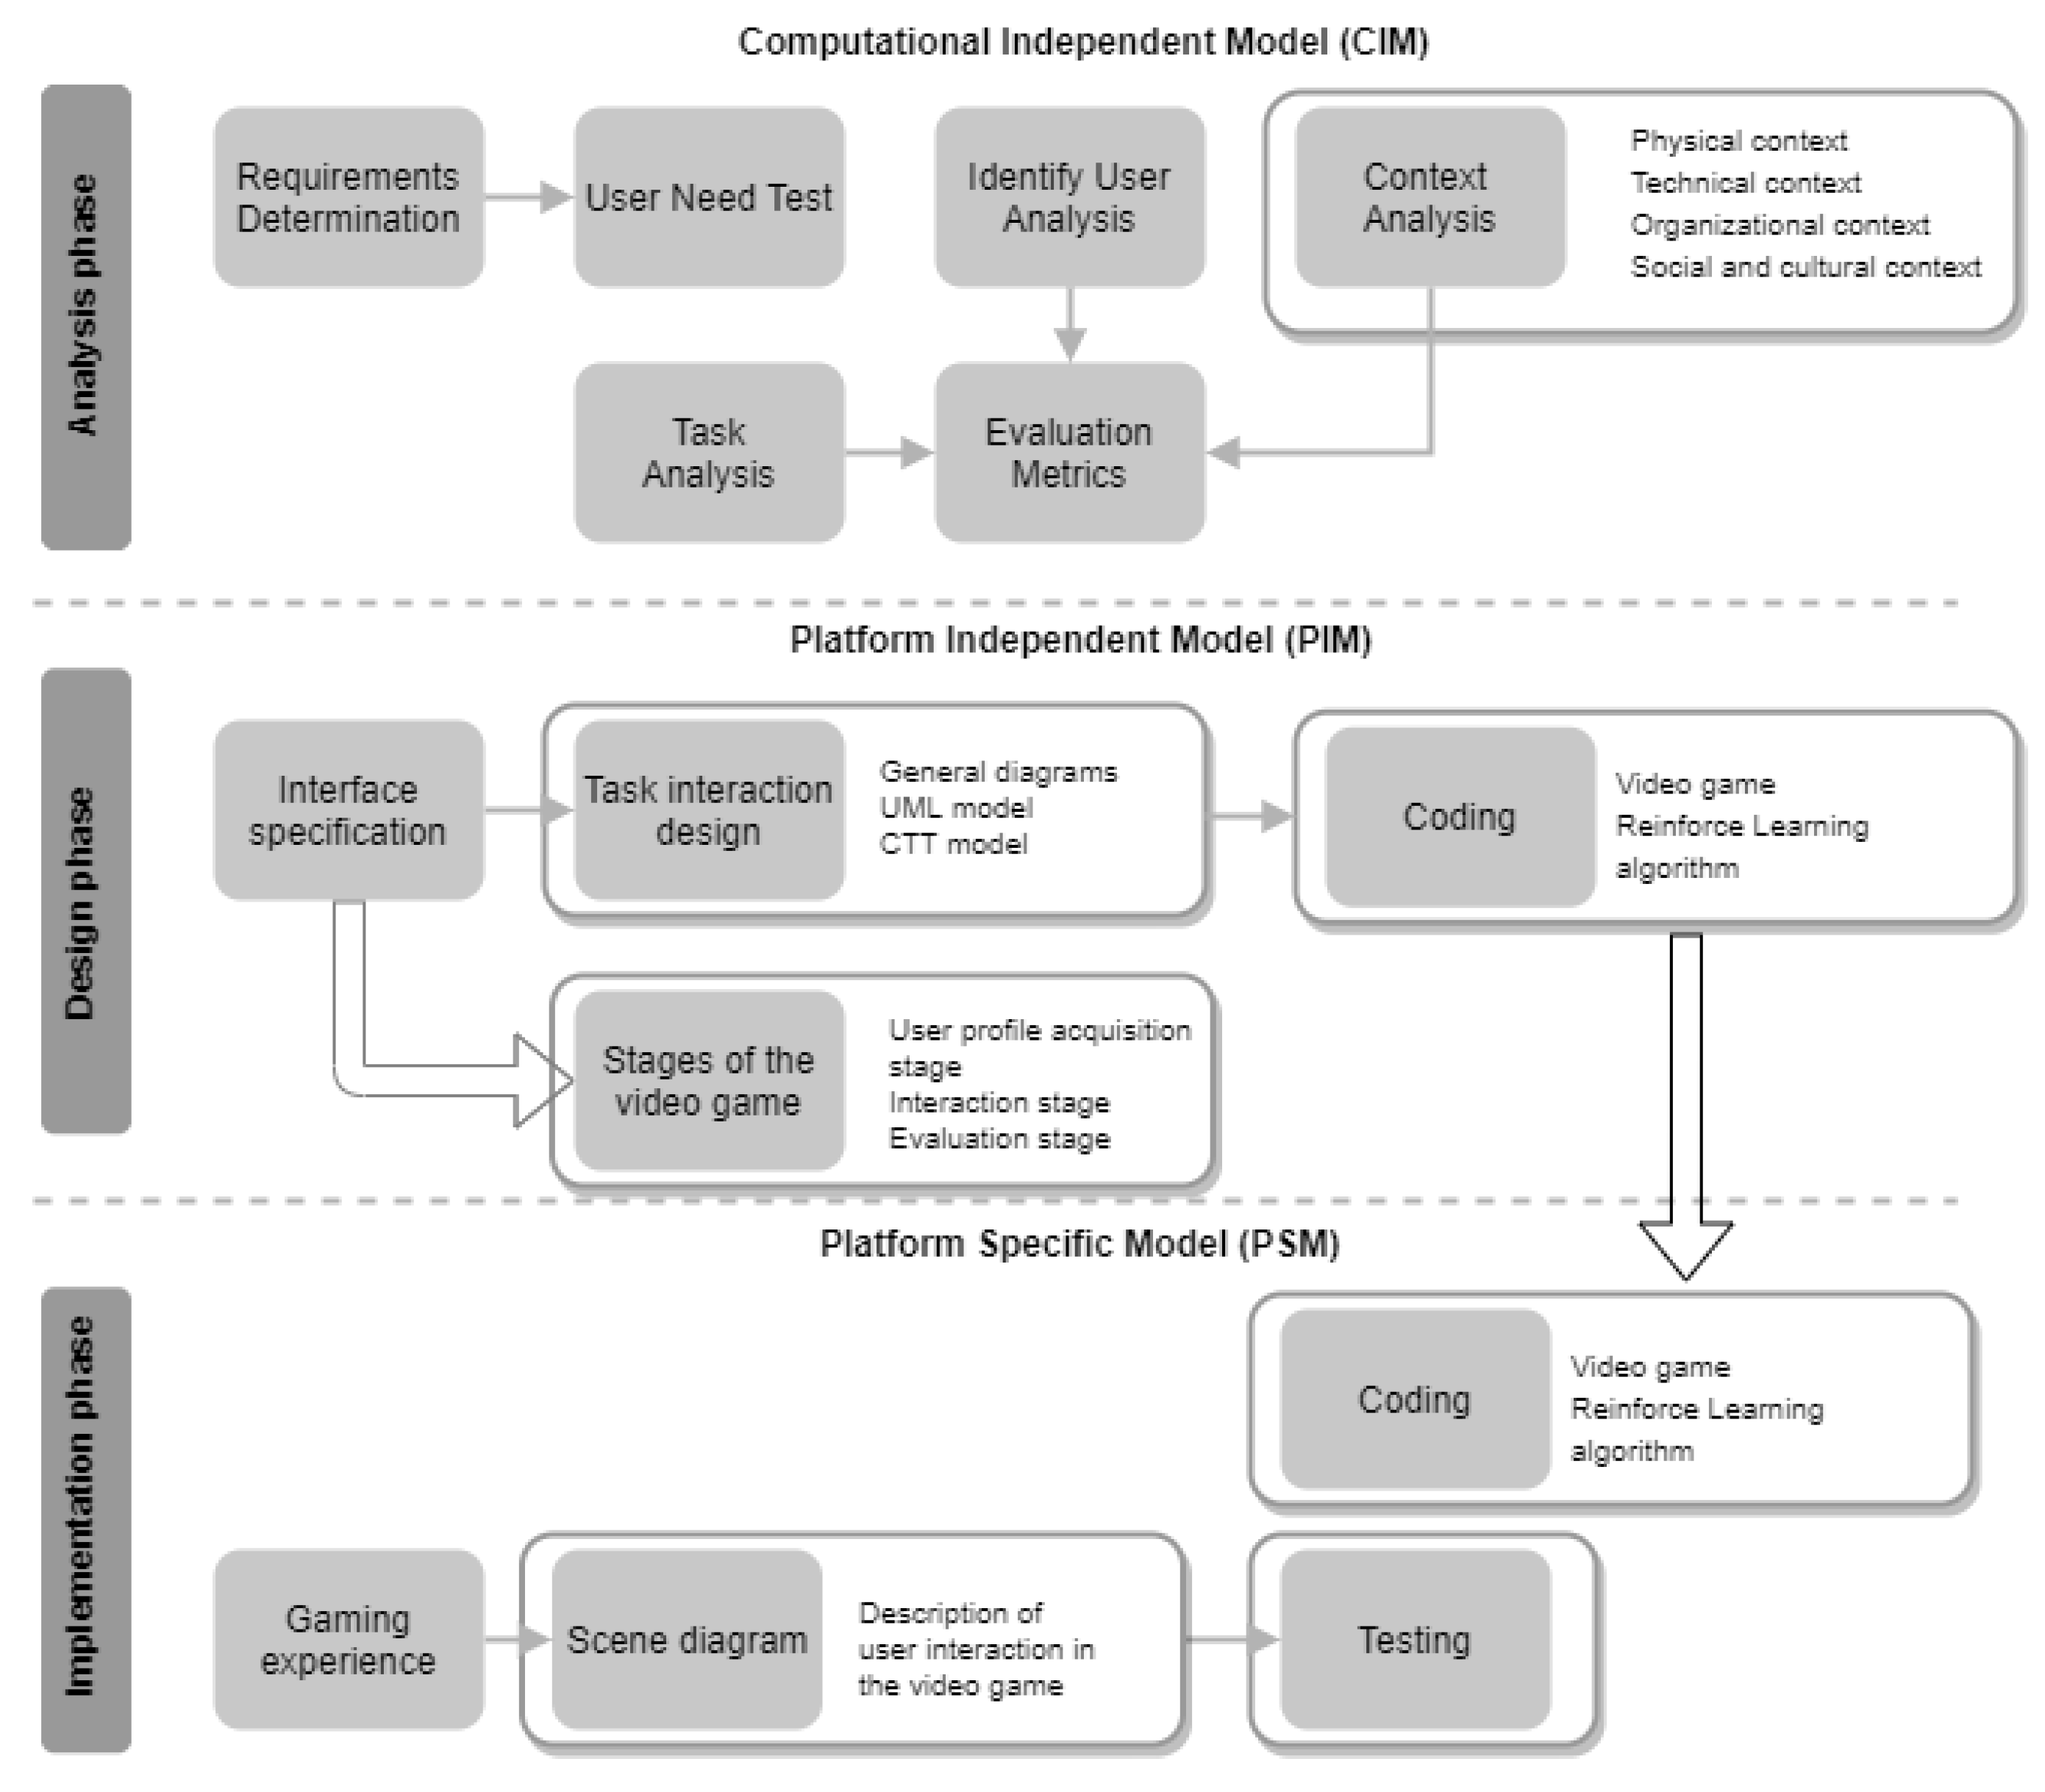
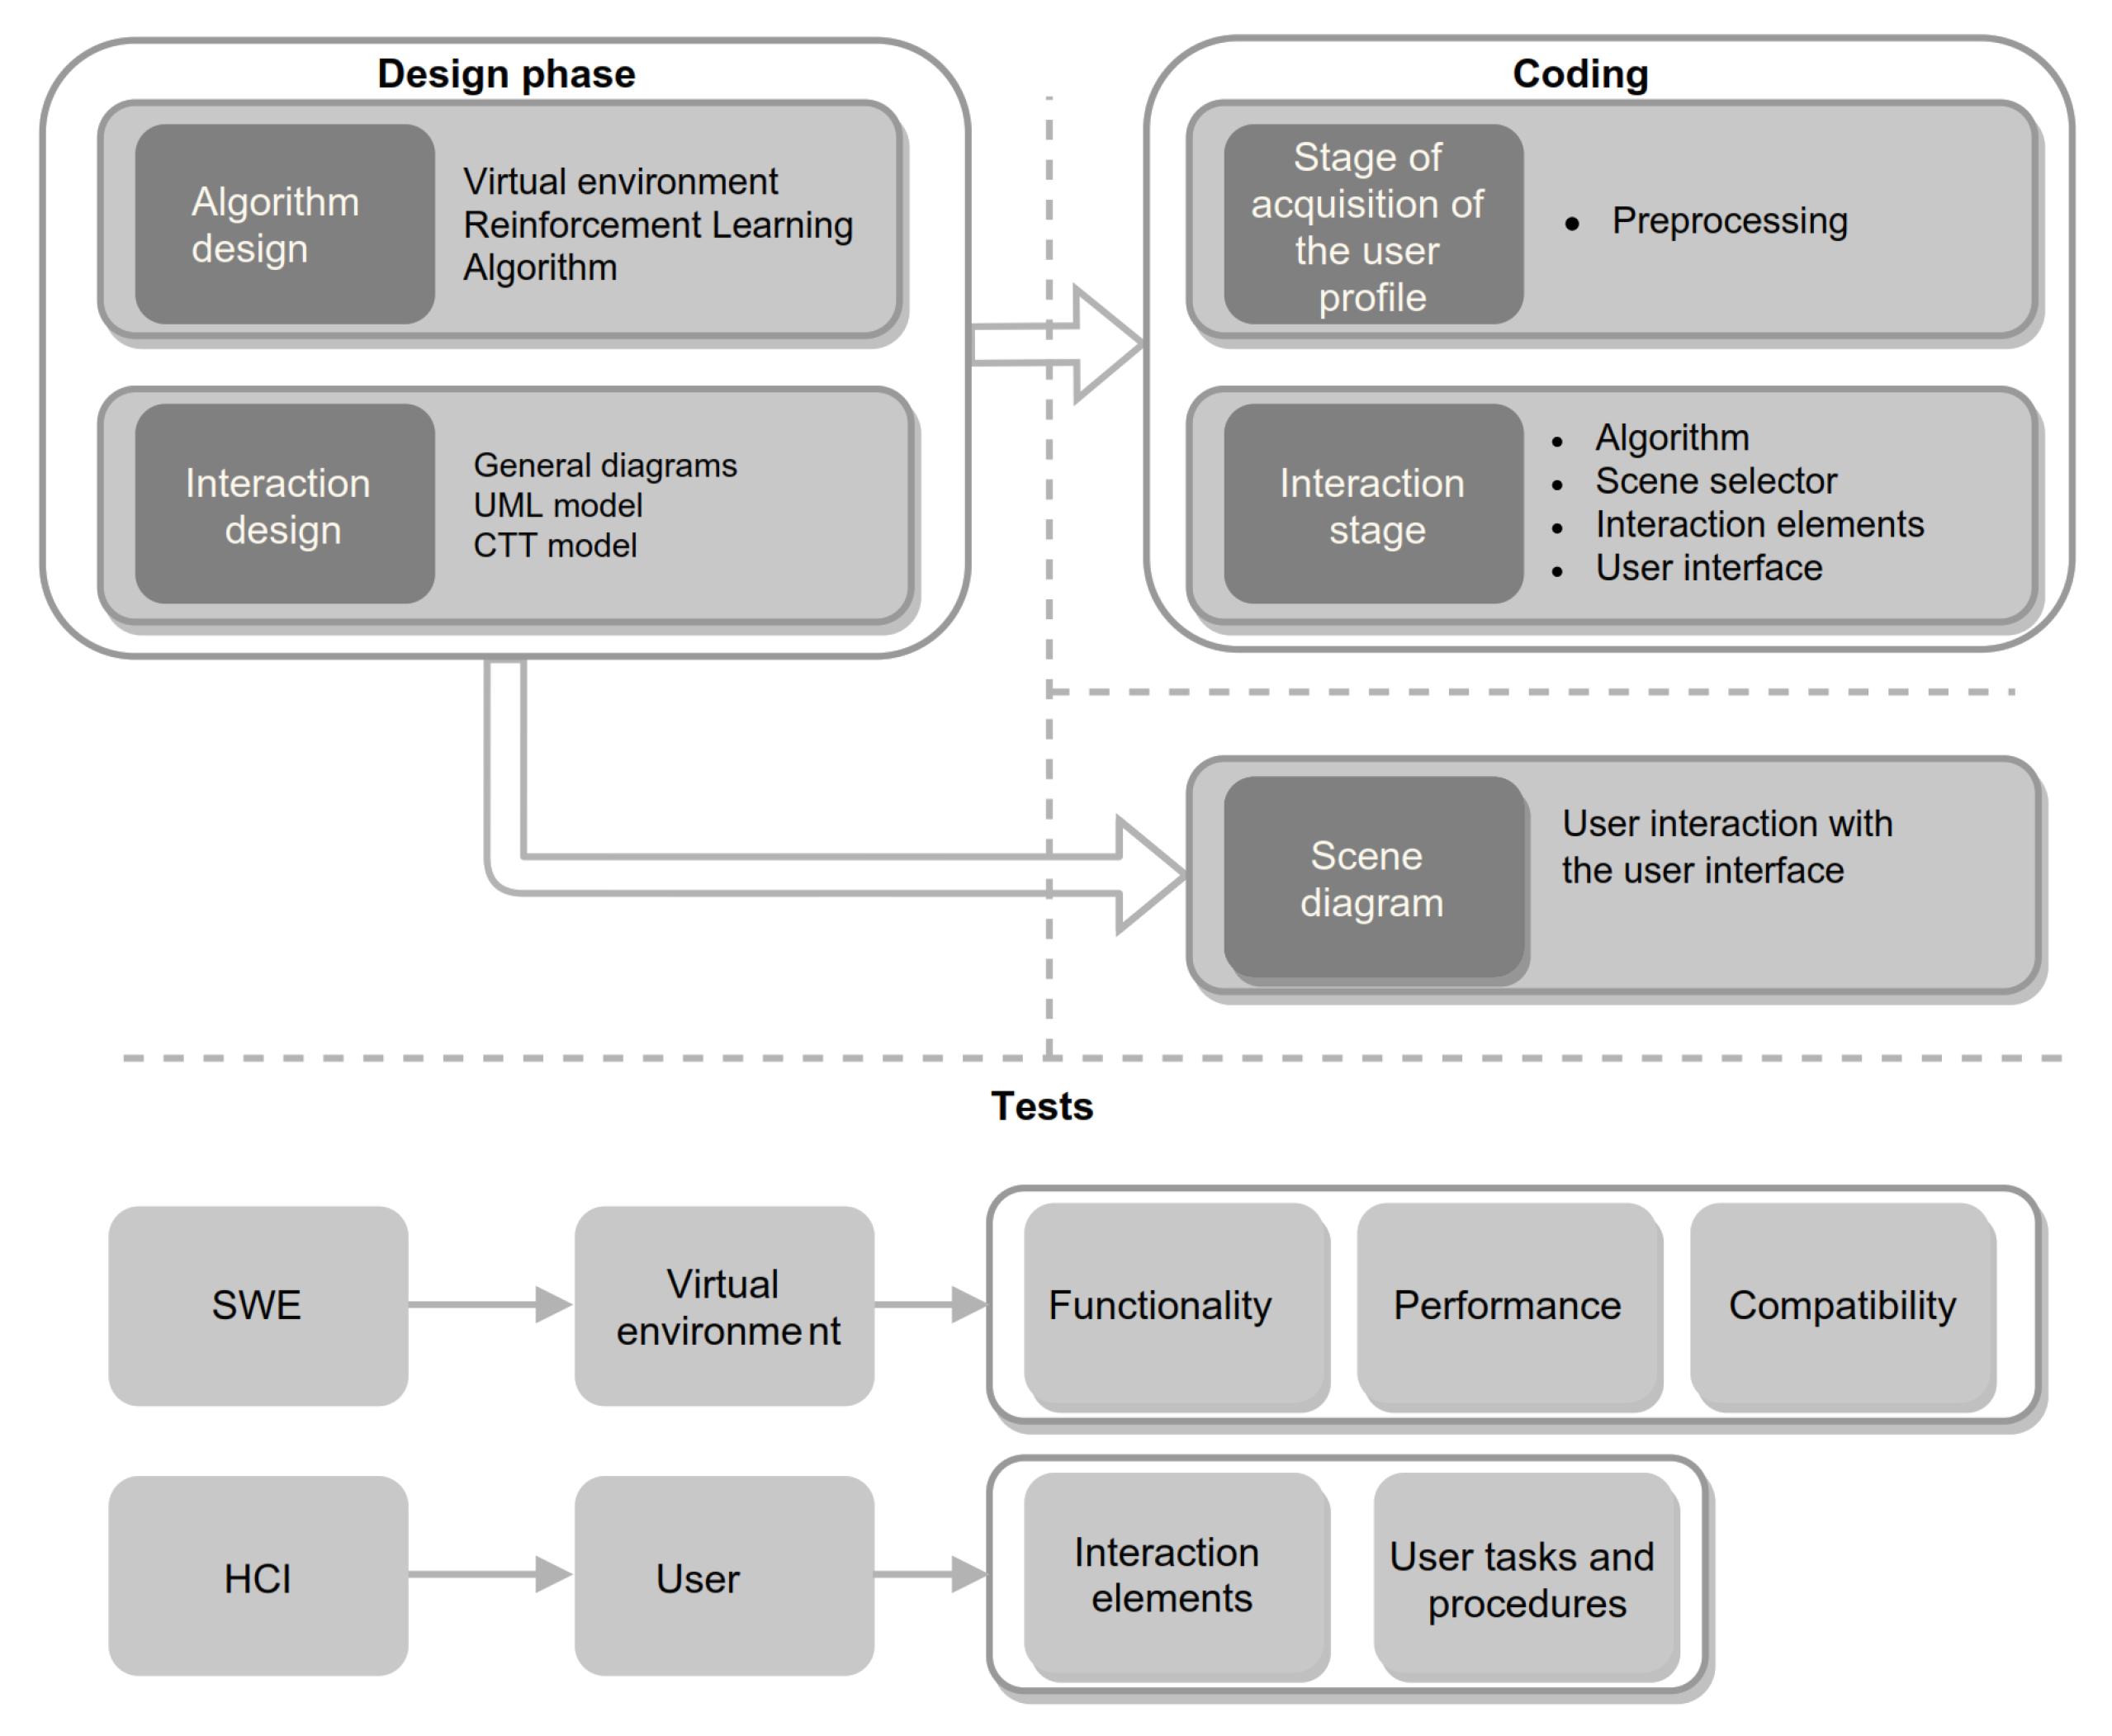
For the design of the proposed model in Figure 5, it takes as a basis the fundamentals of the MDA approach for the design of virtual environments that can be adapted to the user’s needs. The proposed model is composed of the following phases: the Computation-Independent Model (CIM) established as an analysis phase, in this phase the system and user tasks are defined, as well as the context tools. The Platform-Independent Model (PIM) is described as a design phase, in this phase the virtual environment interface and design diagrams—general system diagrams, UML model, and CTT notation—are required to define the interaction between elements and the process. The Platform-Specific Model (PSM), as the implementation phase, which consists of the virtual environment experience, the description of the user interaction, and a testing stage from a Software Engineering (SWE) and Human–Computer Interaction (HCI) [49] perspective. Each phase of the proposed model is described in detail below.
4.1. Analysis Phase
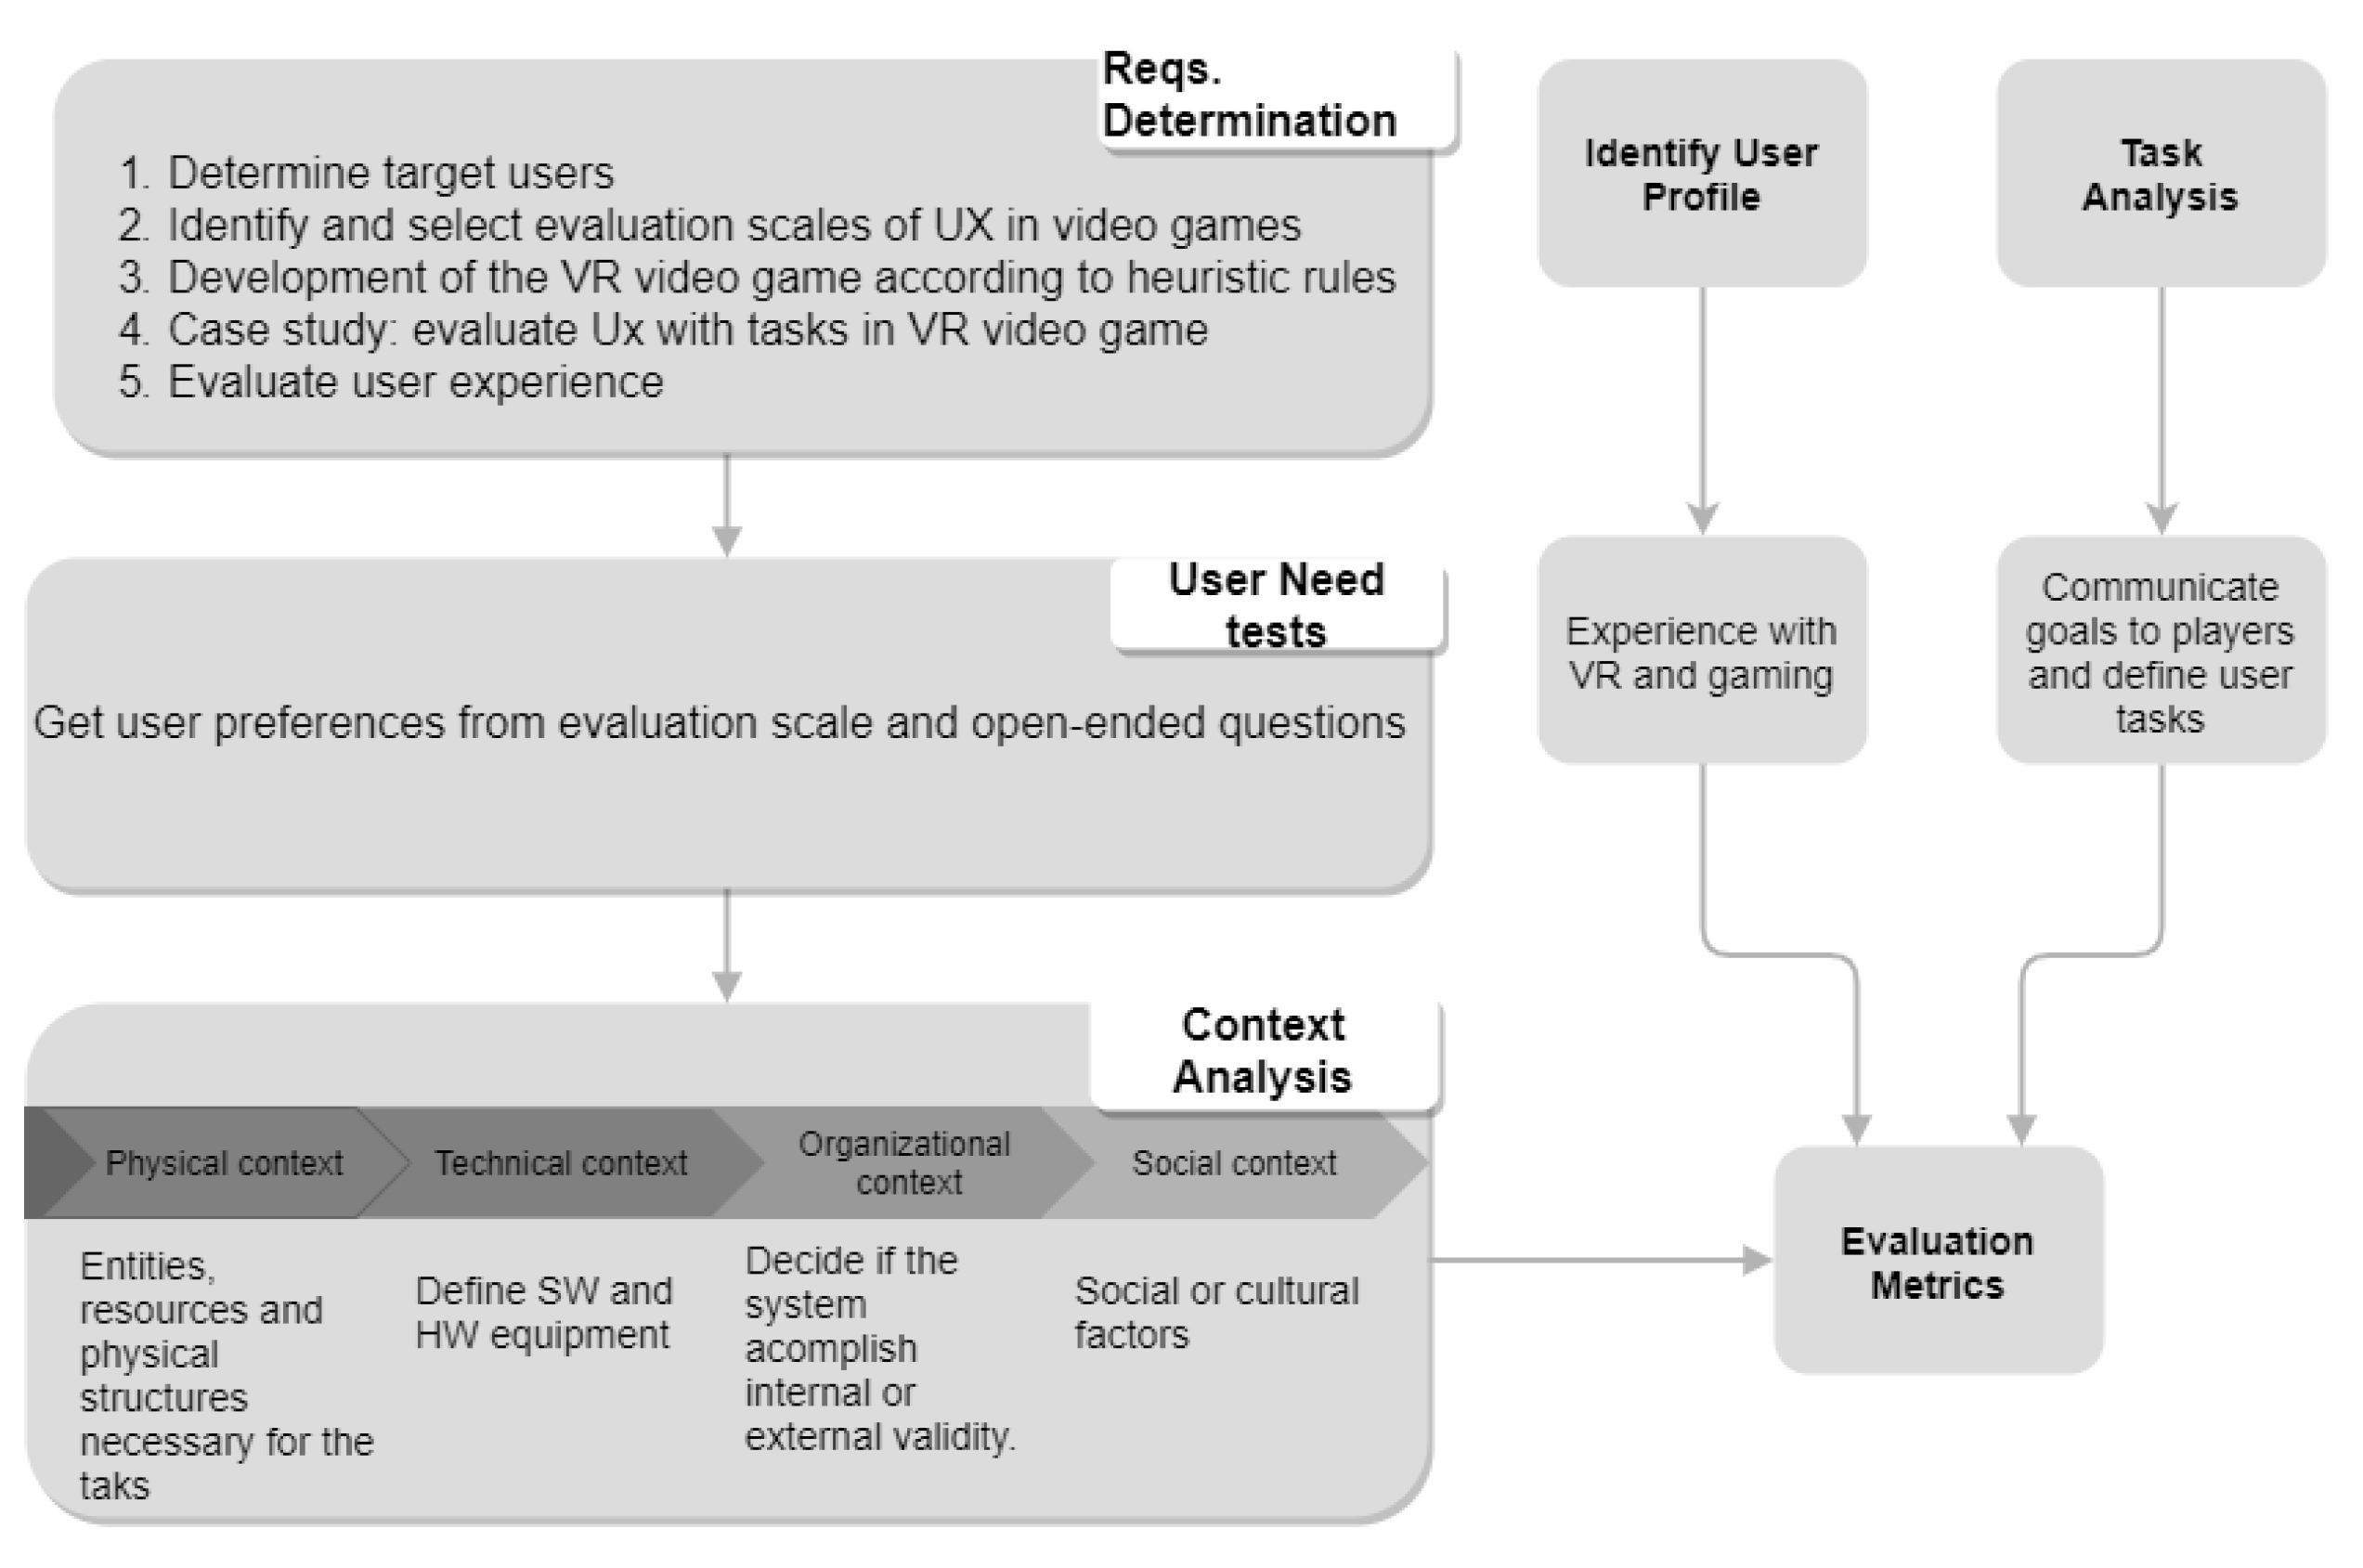
As illustrated in Figure 6. This phase starts with the development process to establish the modeling in the context of the virtual environment requirements. It is mainly composed of the determination of the requirements of the virtual environment, the determination of the user’s needs, and the context on which the virtual environment will be executed. The parts that make up the analysis stage are described below.
4.1.1. Requirements Determination
It consists of following a series of steps, which include the following.
- Determine the objective of the application, either for entertainment or learning applications (e.g., complex, serious, or educational video games).
- Identify and select the UX evaluation scales according to the previously defined objective considering covering most of the player and video game aspects [29].
- Develop a virtual environment according to the heuristic rules. The virtual environment has to be realized based on a guide of heuristic evaluations to ensure its usability.
- Evaluate the user experience with targeted tasks in virtual environments. It is necessary to define tasks or objectives that users must complete and to propose the development of experiments or case studies to evaluate them.
4.1.2. User Need Tests
Determining user needs consists of a series of test definitions that consider the various interactions with the virtual environment. For example, testing the usability of a product in a development cycle, the different hardware technologies or virtual environments, and the activities that the player will perform. These user tests can be carried out through small interactions or iterative processes applied in HCI experiments or under standards such as ISO 9241-210 “Ergonomics of human–system interaction—Part 210: Human-centered design for interactive system”. They can also be carried out through the integration of agile methods which helps their management during the application of the model [50].
4.1.3. Identify User Profile
It is necessary to focus on the right users, this means identifying the target market for the virtual environment and the application of the model. It is important to work with enough users to know most of their needs and to work with those who use the [50] application; for example, a work environment focuses on users who are more productive or who use the technology of interest. Here, the user profiles are defined, for this, demographic information is required such as age, gender, and experience with virtual environments. From this, experiments or case studies can be defined, either between-subject or within-subject tests, leading to different interpretations of hypothesis testing.
4.1.4. Context Analysis and Task Analysis
The context analysis should be described from a physical, technical, organizational, and social context; from a physical context, specify the resources to be used for the model; technical, choose the tools and programs needed to carry out the model application; organizational, investigate when an observed effect is due to the configuration conditions or if the results are generalizable to other situations; and social, human factors to be observed, e.g., the group of people, ethnicity, and performance to be measured of the user [51]. On the other hand, in task analysis the objectives or instructions are communicated to the users.
4.1.5. Evaluation Metrics
Based on the analysis of context, tasks, and users, evaluation metrics can be defined. These evaluation metrics can be addressed with hypothesis testing using statistical analysis, which depends on the experimental design. For example, taking into account whether the application of the model consists of between-subjects or on-subjects experimentation, the order effect, the independent and dependent variables, the procedure, etc. On the other hand, these evaluation metrics can also be addressed with questionnaire design, either Likert scales, open-ended questions, and closed-ended questions; this helps to collect data information from the user profile or the application to be further processed with statistical methods to evaluate the performance of the model [51,52].
4.2. Design Phase
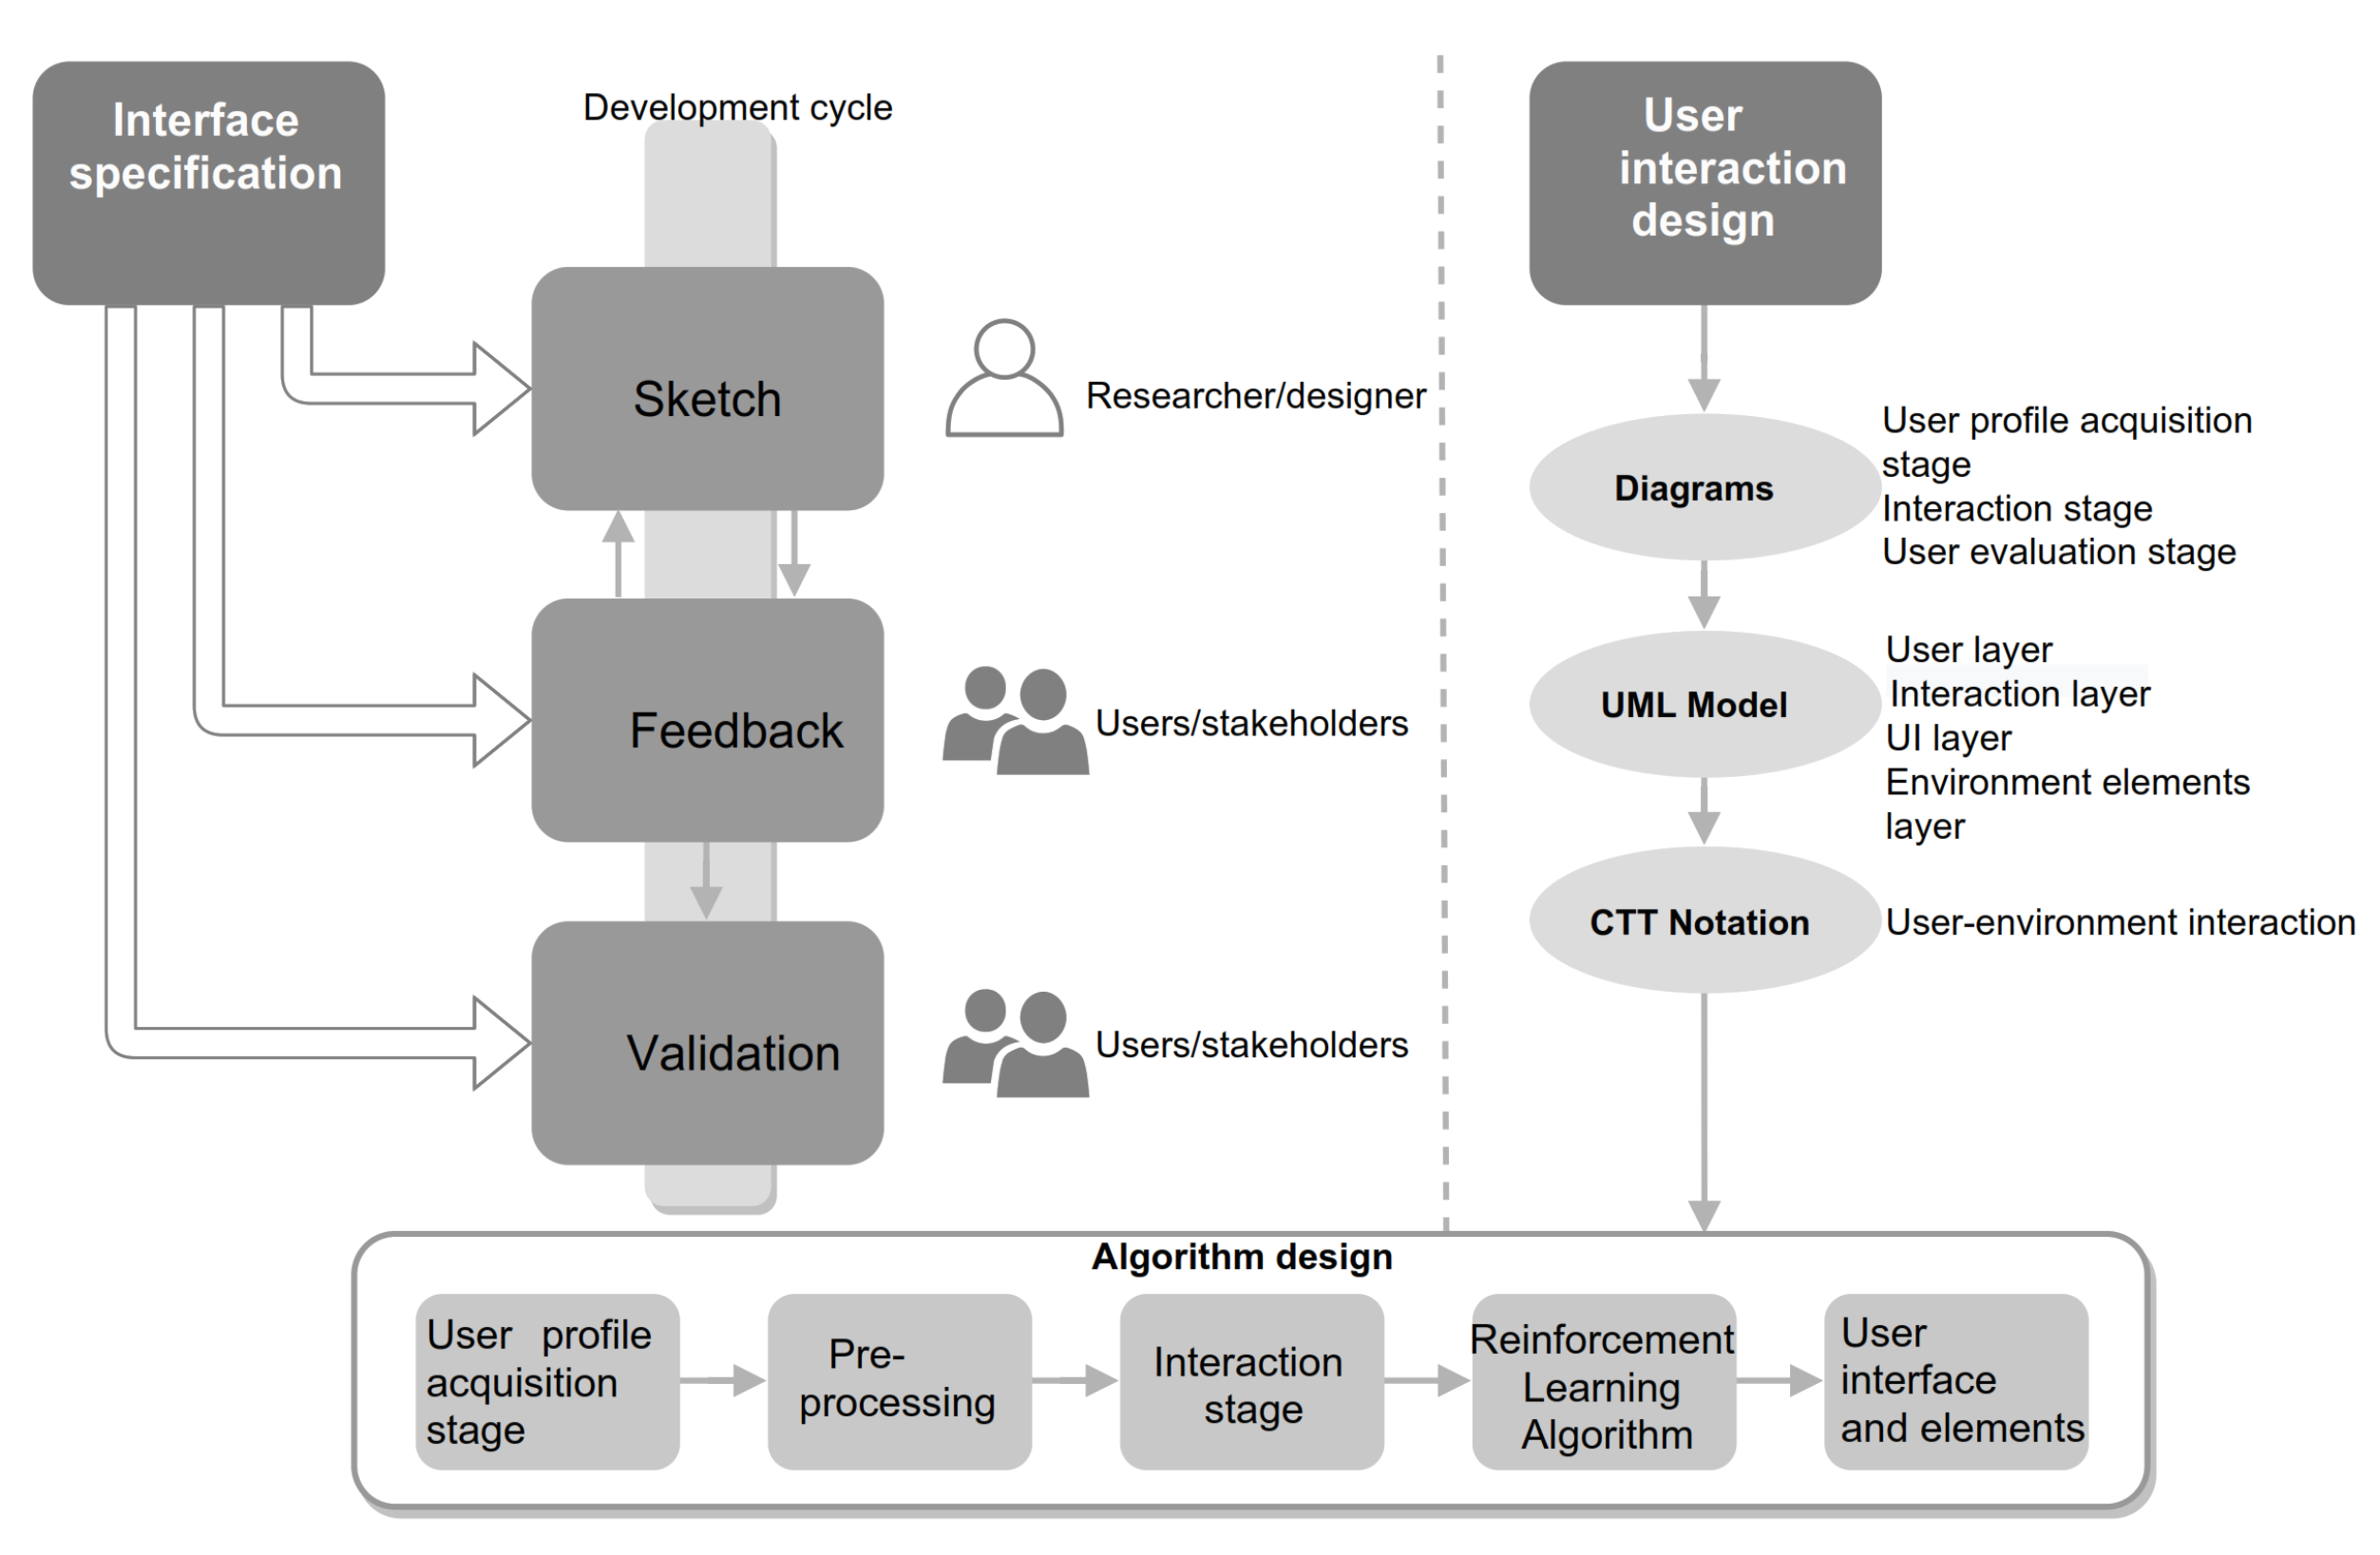
As illustrated in Figure 7, the following describes the parts of the design phase which is specified as follows.
According to Figure 7, the interface is specified and then an interaction design of the virtual environment is presented. The interface specification and interaction design are based on the user acquisition stage of the user profile, user interaction, and user evaluation.
4.2.1. Interface Specification
The interface specification concentrates on a representation of the environment. It consists of making a sketch of the user interface. For example, designing the menus, visual, auditory, or interactive elements. Once the sketch is done, it is followed by feedback, either through user testing or comments from stakeholders and experts (stakeholders). Then, interface validation is performed. The interface specification can be carried out in the form of a development cycle for user-centered designs or agile methods [51].
4.2.2. User Interaction Design
In user interaction (formal representation of the environment), general diagrams of the environment are made as part of the system design (UML models [53]) to represent the structure and interaction between system elements, and a Concur Task Tree (CTT) notation [54] that shows the process for representing and completing a task (e.g., the steps a user has to follow to make a record or steps a player has to follow to finish a mission). This allows identifying defects in the analysis phases to refine the requirements or user needs and ensure a proper and documented virtual environment.
4.2.3. Algorithm Design
The core elements of the design phase are based on two stages: user profile acquisition stage, interaction stage.
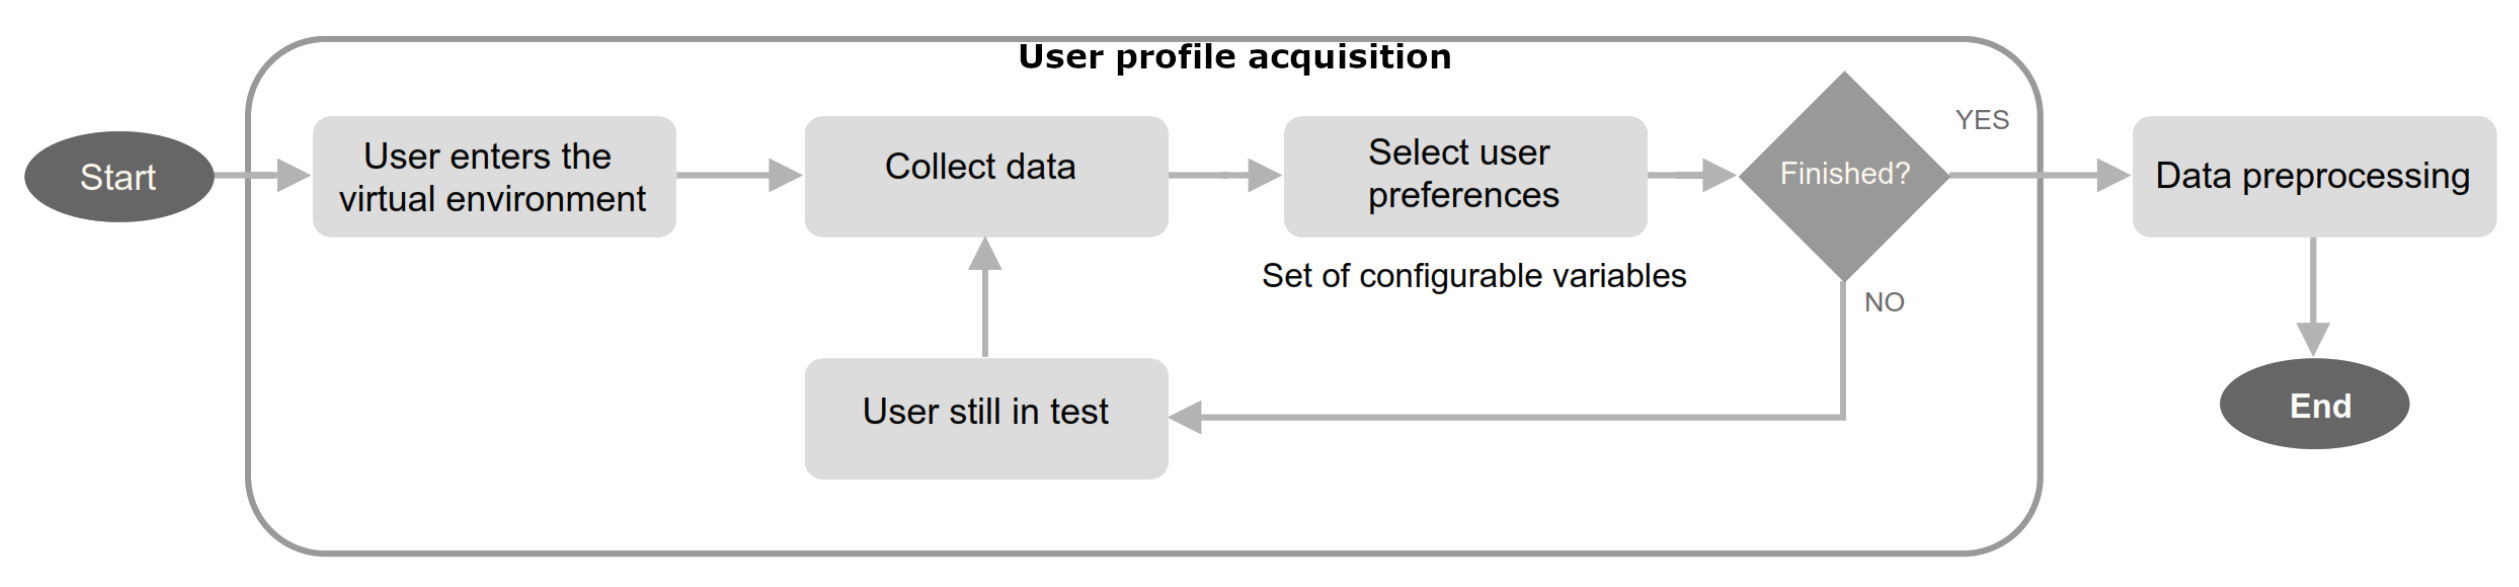
The user profile acquisition stage: To obtain user preferences, a user profile acquisition stage is required (see Figure 8), which consists of generating different states of satisfaction (data preprocessing) from a set of environment customization parameters (e.g., changes in environment elements, difficulty in the environment and time to complete the objectives). To define these states, a testing stage should be considered for a period of time, either in a dynamic demonstration or questions in the user interface.
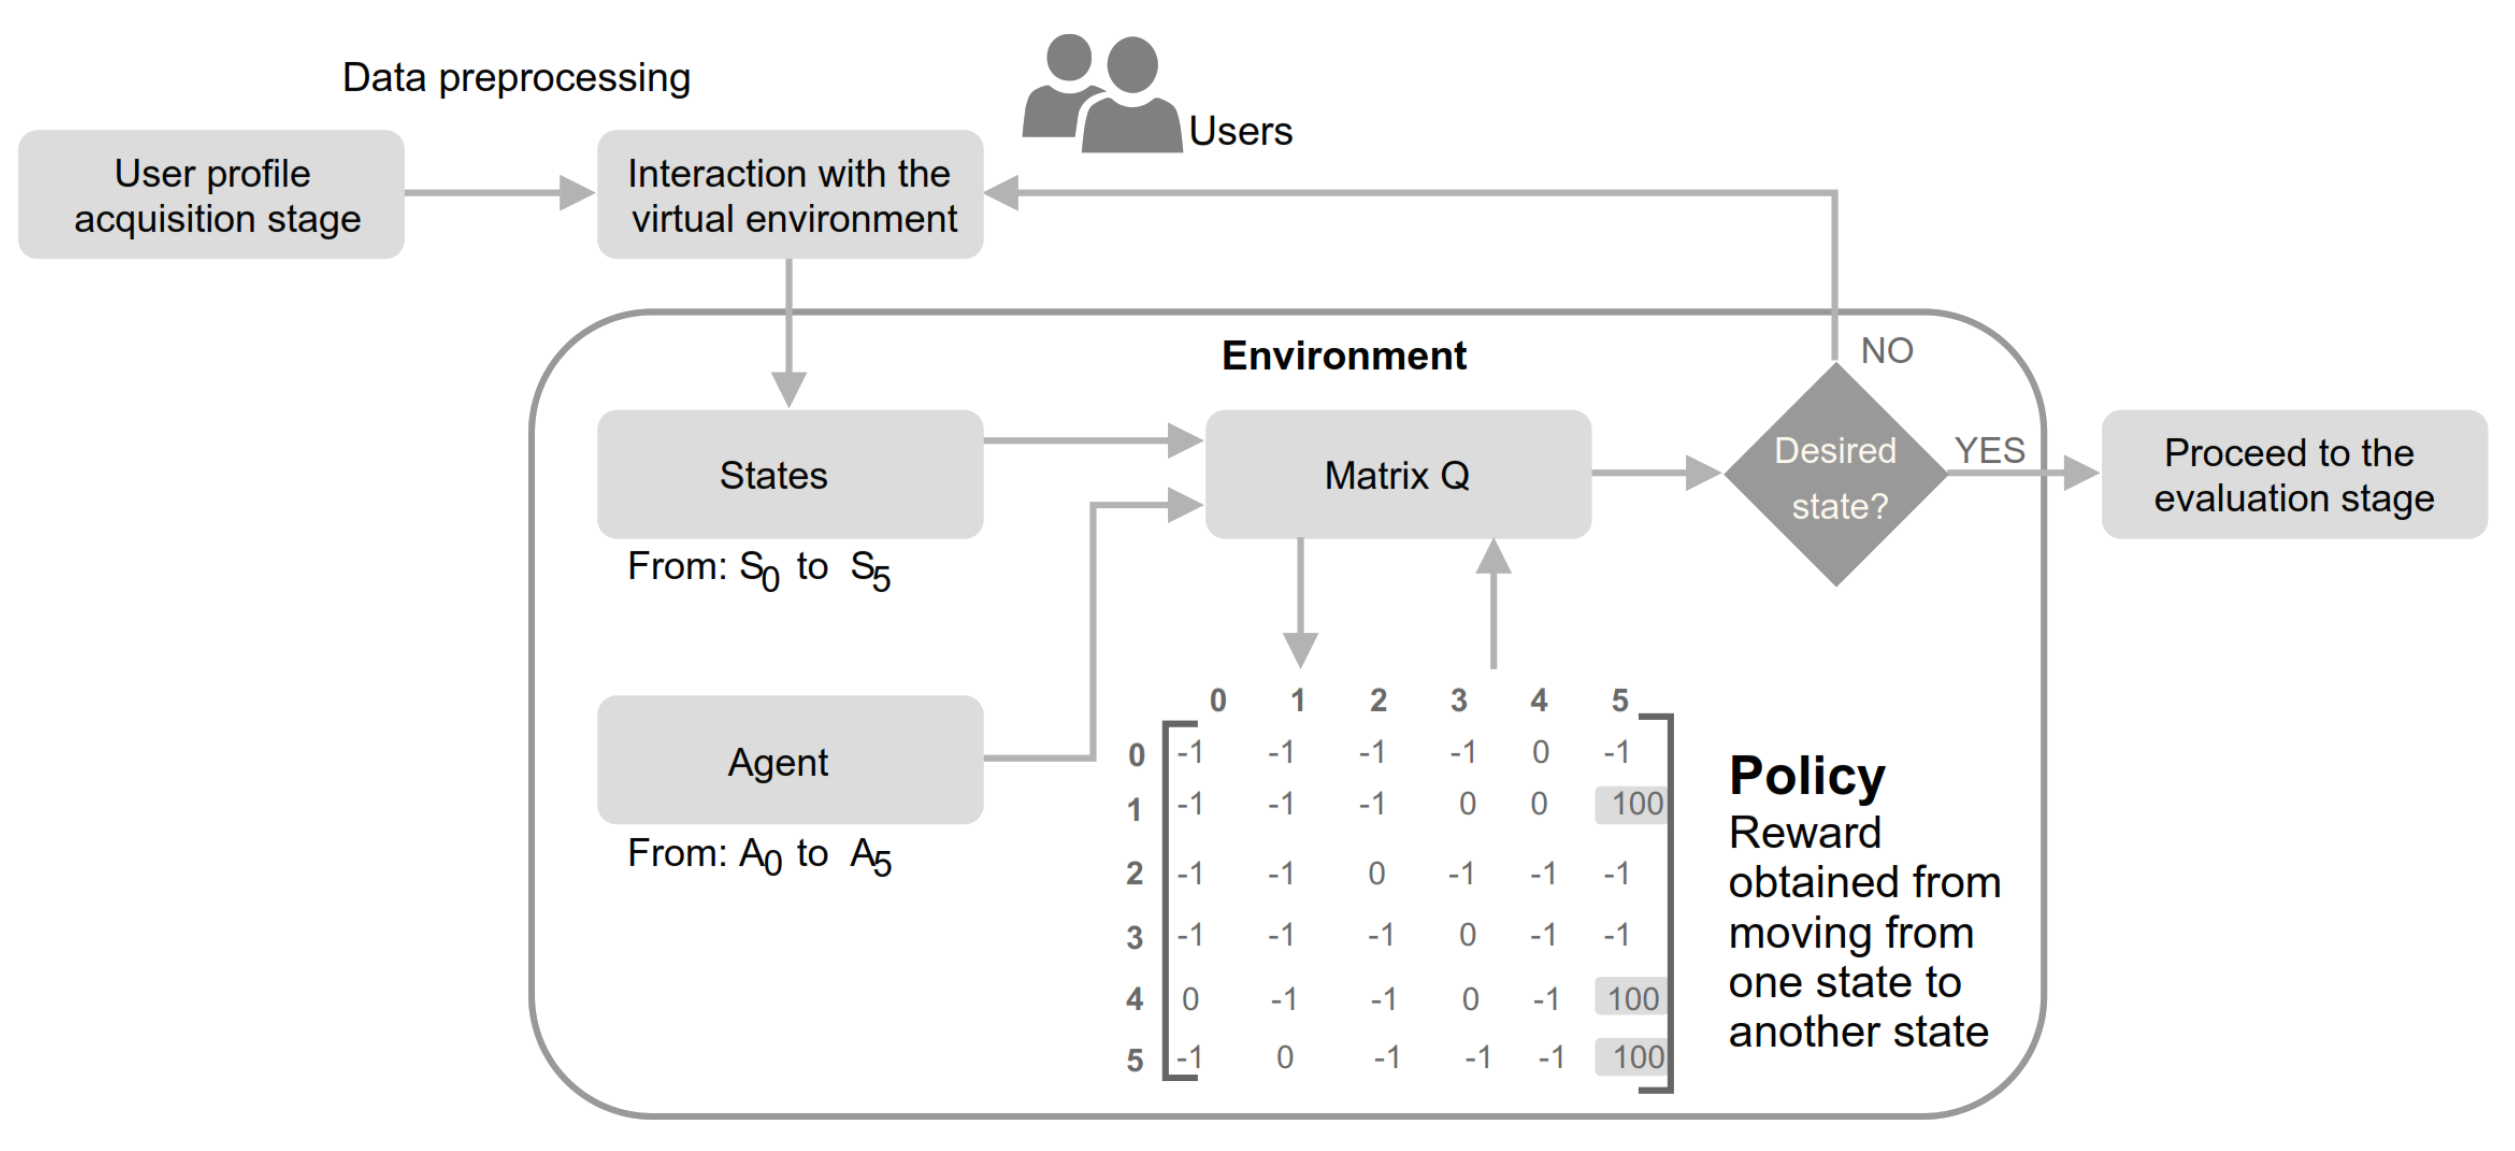
The user interaction stage: it consists of the interaction between the user and the environment, where the reinforcement learning algorithm adjusts the virtual environment in a personal way for each user by switching between states (e.g., missions, levels, or a set of parameters that redefine the difficulty) that are translated into states of user satisfaction. Figure 9 shows how the preprocessed data from the parameters selected in the acquisition stage are passed to the reinforcement learning environment. Within the environment, the Q-learning algorithm [31] moves from one state to another until it brings the user to a state of satisfaction. Once the goal is met, a user experience evaluation stage proceeds.
These must be specified before the development of the virtual environment. Once these stages are defined, the coding is done according to the interaction design established. Part of the algorithm design concerning these stages consists of the preprocessing of the data obtained in the user profile acquisition stage, the selected reinforcement learning algorithms, the scene selectors in case of needing to switch between views within the environment, and the interaction of the environment elements with the users and the user interface.
4.3. Implementation Phase
As presented in Figure 10, during this phase the artifacts designed in the interaction phase are implemented and tested to ensure proper functionality. This phase is composed of two parts: a scene diagram and the test design. The scene diagram presents the flow that exists in the user interface (e.g., composed of visual, auditory elements, and the options of the virtual environment with which the user can interact). On the other hand, the tests consist of evaluating the model from two perspectives: Human–Computer Interaction (HCI) and Software Engineering (SWE). From the HCI context, elements of interaction, tasks, and procedures, and usability are included. From the SWE side, functionality, performance, system, and compatibility are included.
The following section presents the results of a case study and its simulation under the proposed model.
5. Implementation of the Proposed Model
This section presents the implementation of the proposed model of Figure 5 through the development of a virtual environment in which a reinforcement learning algorithm that takes into account the user’s preferences is implemented. Next, the stages proposed for the implementation under the proposed model are described.
5.1. Analysis Phase
The virtual environment consists of a single-player racing video game. The video game is an adaptation of a template named: Karting Microgame, this template is an open project racing game available on the Unity3D platform [55,56]. This template initially consists of a track and 3 laps. Subsequently, the implementations were made to the virtual environment according to the proposed template.
The virtual environment is composed of the design of seven different tracks, as shown in Figure 11. Each track presents a particular design in which the same style of its visual elements is preserved.
The player could control a cart, collect coins, and avoid obstacles. The cart can move in all directions, jump, crash, and skid. In addition, the player has to navigate the whole track to finish the lap. The player starts at the lap control point and has to perform 3 laps to finish a track (see Figure 11). During the game, the player interacts with static and dynamic elements (see Table 1). In addition, the player must avoid obstacles and collect coins that appear along the way. The player collects a coin, a coin counter that appears on the user interface changes, and the player gets a point. The game ends when the user reaches the maximum state of satisfaction.
In the requirements determination, the objective of the application is established to improve the UX in a personal way. User characteristics such as age, gaming experience, and experience in virtual environments are part of the user analysis. This leads to finding different user profiles (e.g., gamer roles). The task analysis was defined according to the video game, proceeding to set the objectives to accomplish the tasks. Then, the context of the video game is described consisting of the physical context, the experimental study was developed in a controlled environment; technical context, the hardware and software tools needed to develop the video game and the experiment were selected; organizational context, the video game was generalized to other situations; and social context, the video game is accessible to all ages and ethnic groups. Finally, RL metrics were defined to evaluate the video game.
5.2. Design Phase
Within the design phase according to the model in Figure 5, the interface specification consisted of sketching the interface and user interaction elements. For this, it was necessary to get feedback from experts in the area where an agile method—scrum [57]—until its validation. The user interface process contemplates the stages of user profile acquisition and interaction. Likewise, these stages are also detailed in the interaction design where the general diagrams, the design of system classes, and the design of user tasks in CTT notation was made. Once the interface specification and interaction design were completed, the algorithm design was performed.
The interaction design through CTT notation represents the different interactions of the virtual environment of the user profile acquisition stage, game stage, and evaluation stage. The represented tasks consist of several steps, as presented in the example in Figure A2 (Appendix A). First, a general diagram of the stages is analyzed to follow a hierarchical structure and locate the tasks.
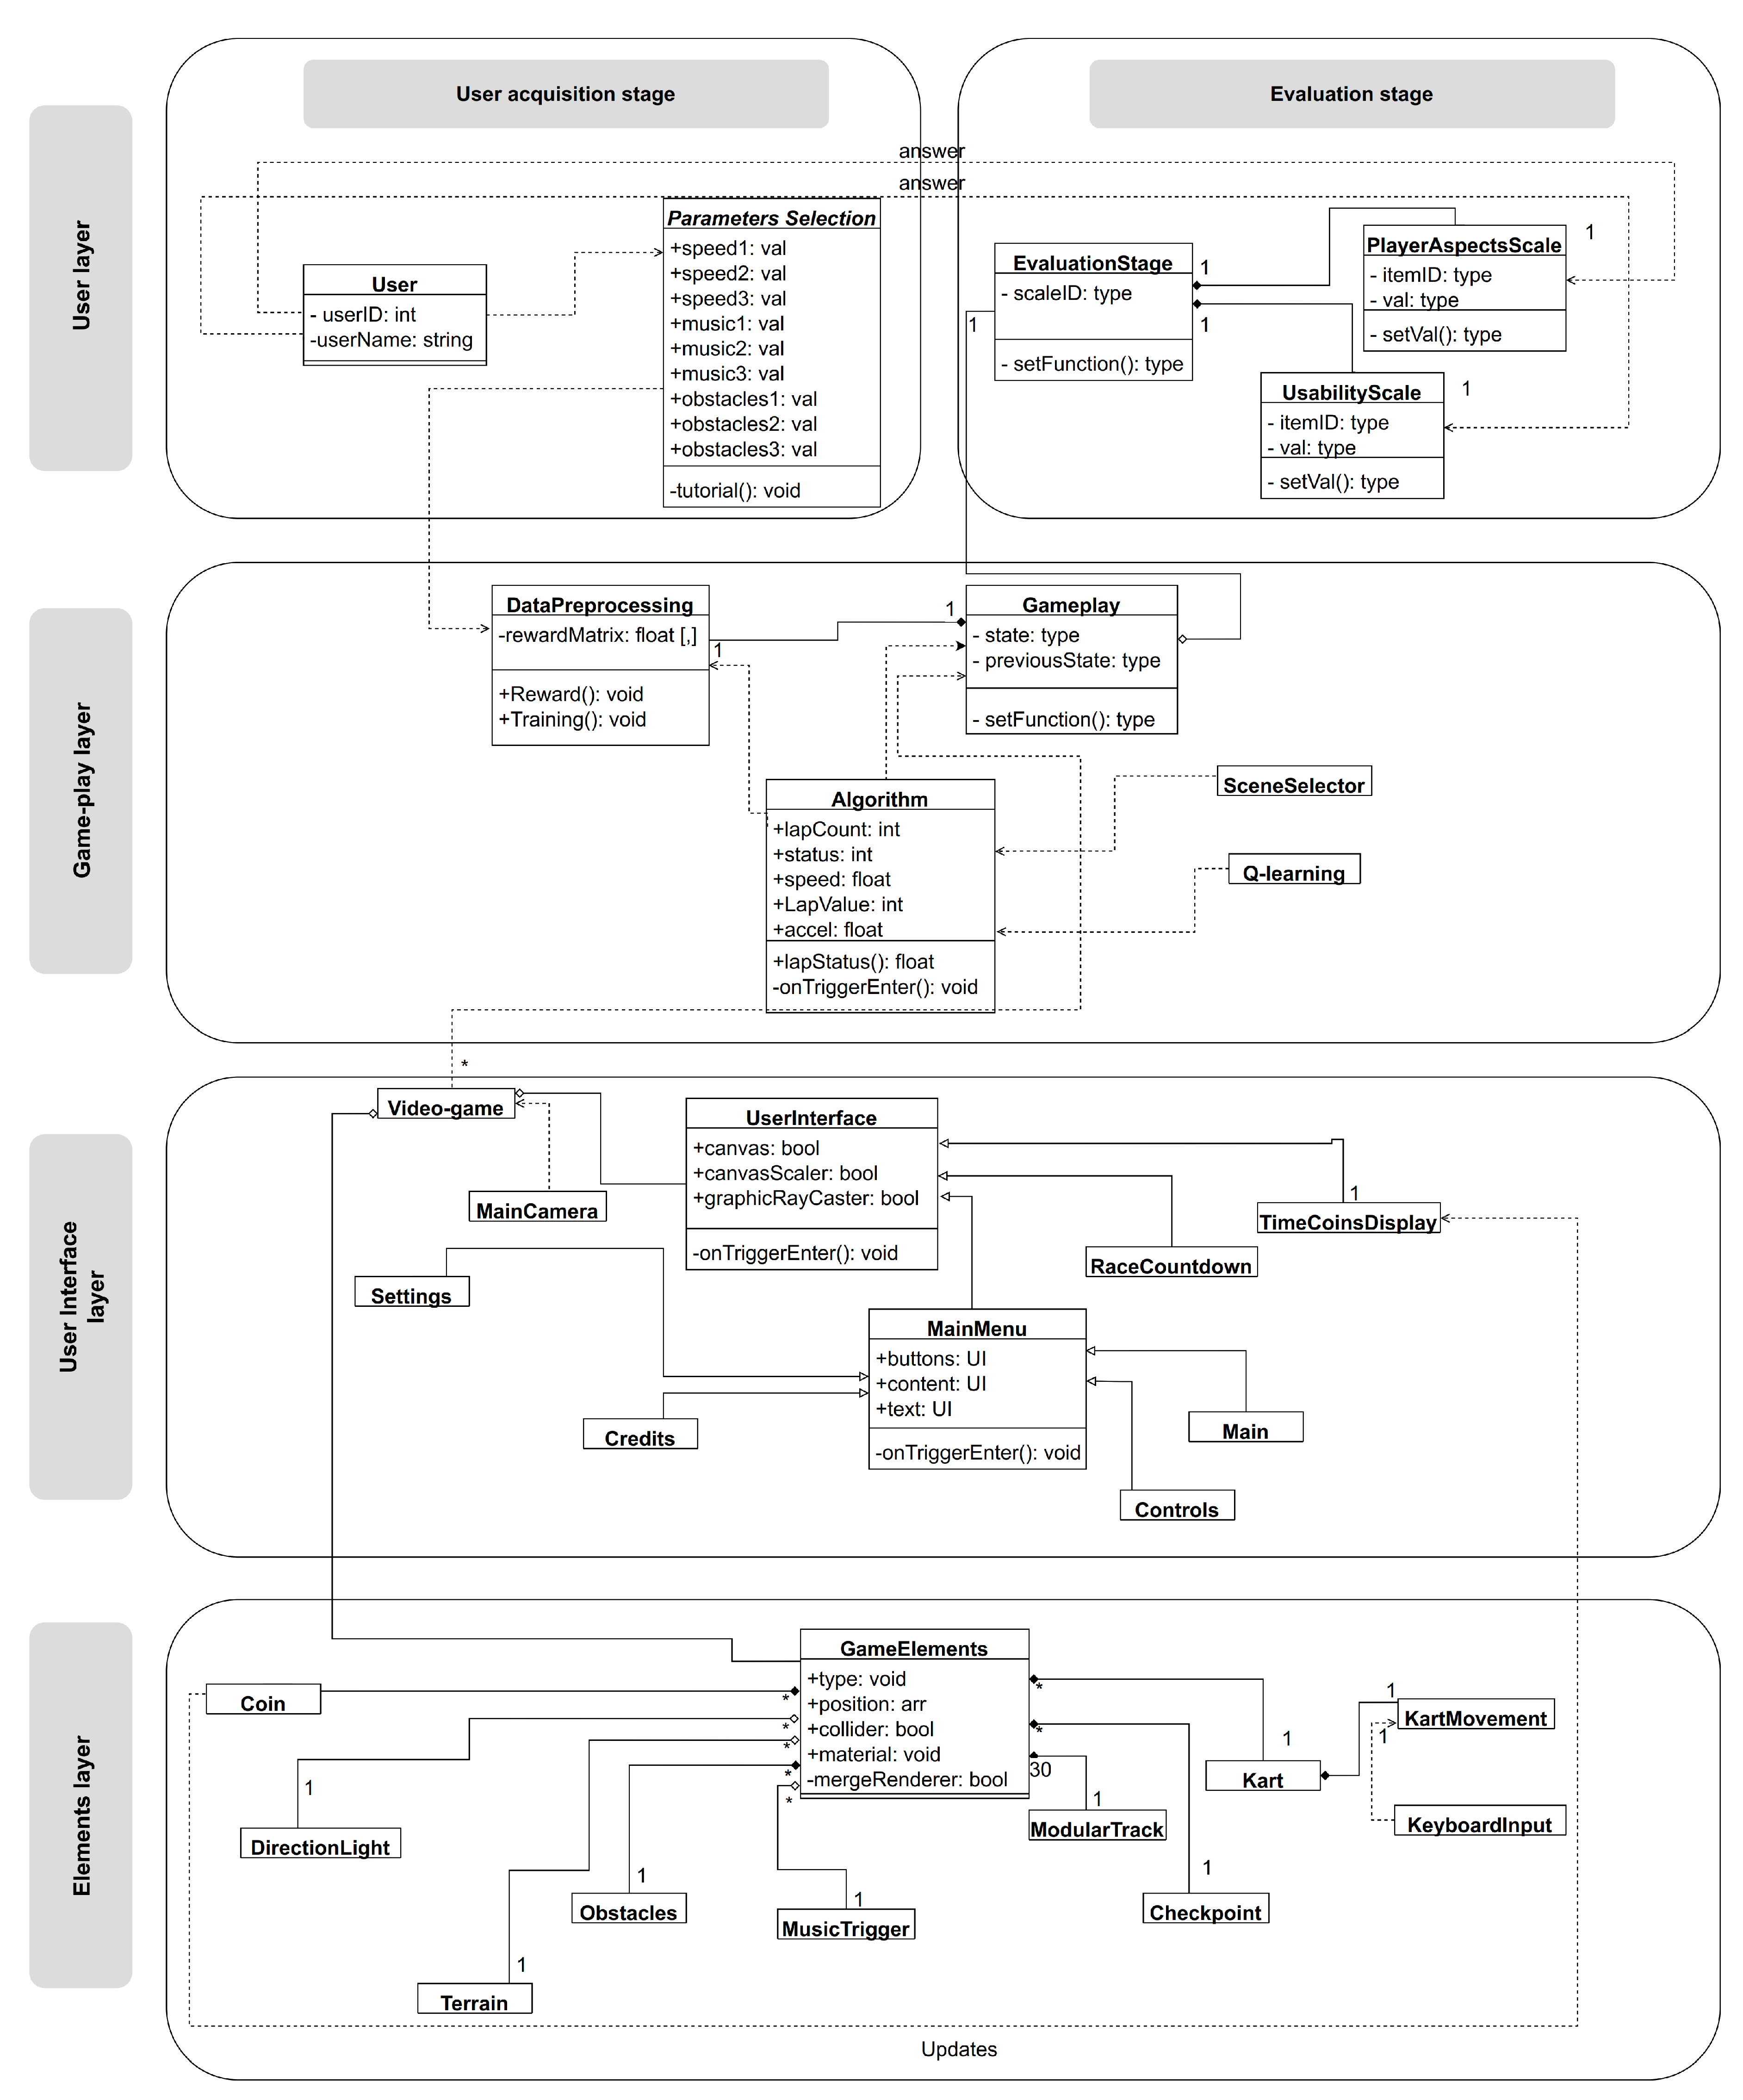
A class diagram of the system allows identifying the interaction between the game elements, the algorithm, and the users. Figure A1 illustrates the interaction between four layers: user, game, user interface, and elements. The first user layer, which is separated into user acquisition and evaluation scales, involves all classes that require user interaction. Next, the game layer contains the classes DataPreprocessing, Algorithm, and Gameplay, then connects them to the user interface layer. This commits the elements that the user observes in the interface, such as MainCamera, MainMenu, TimeCoinDisplay, and so on. The last layer refers to the game elements, these elements are objects that have interaction with the user in the game.
5.2.1. Environment and Algorithm Design
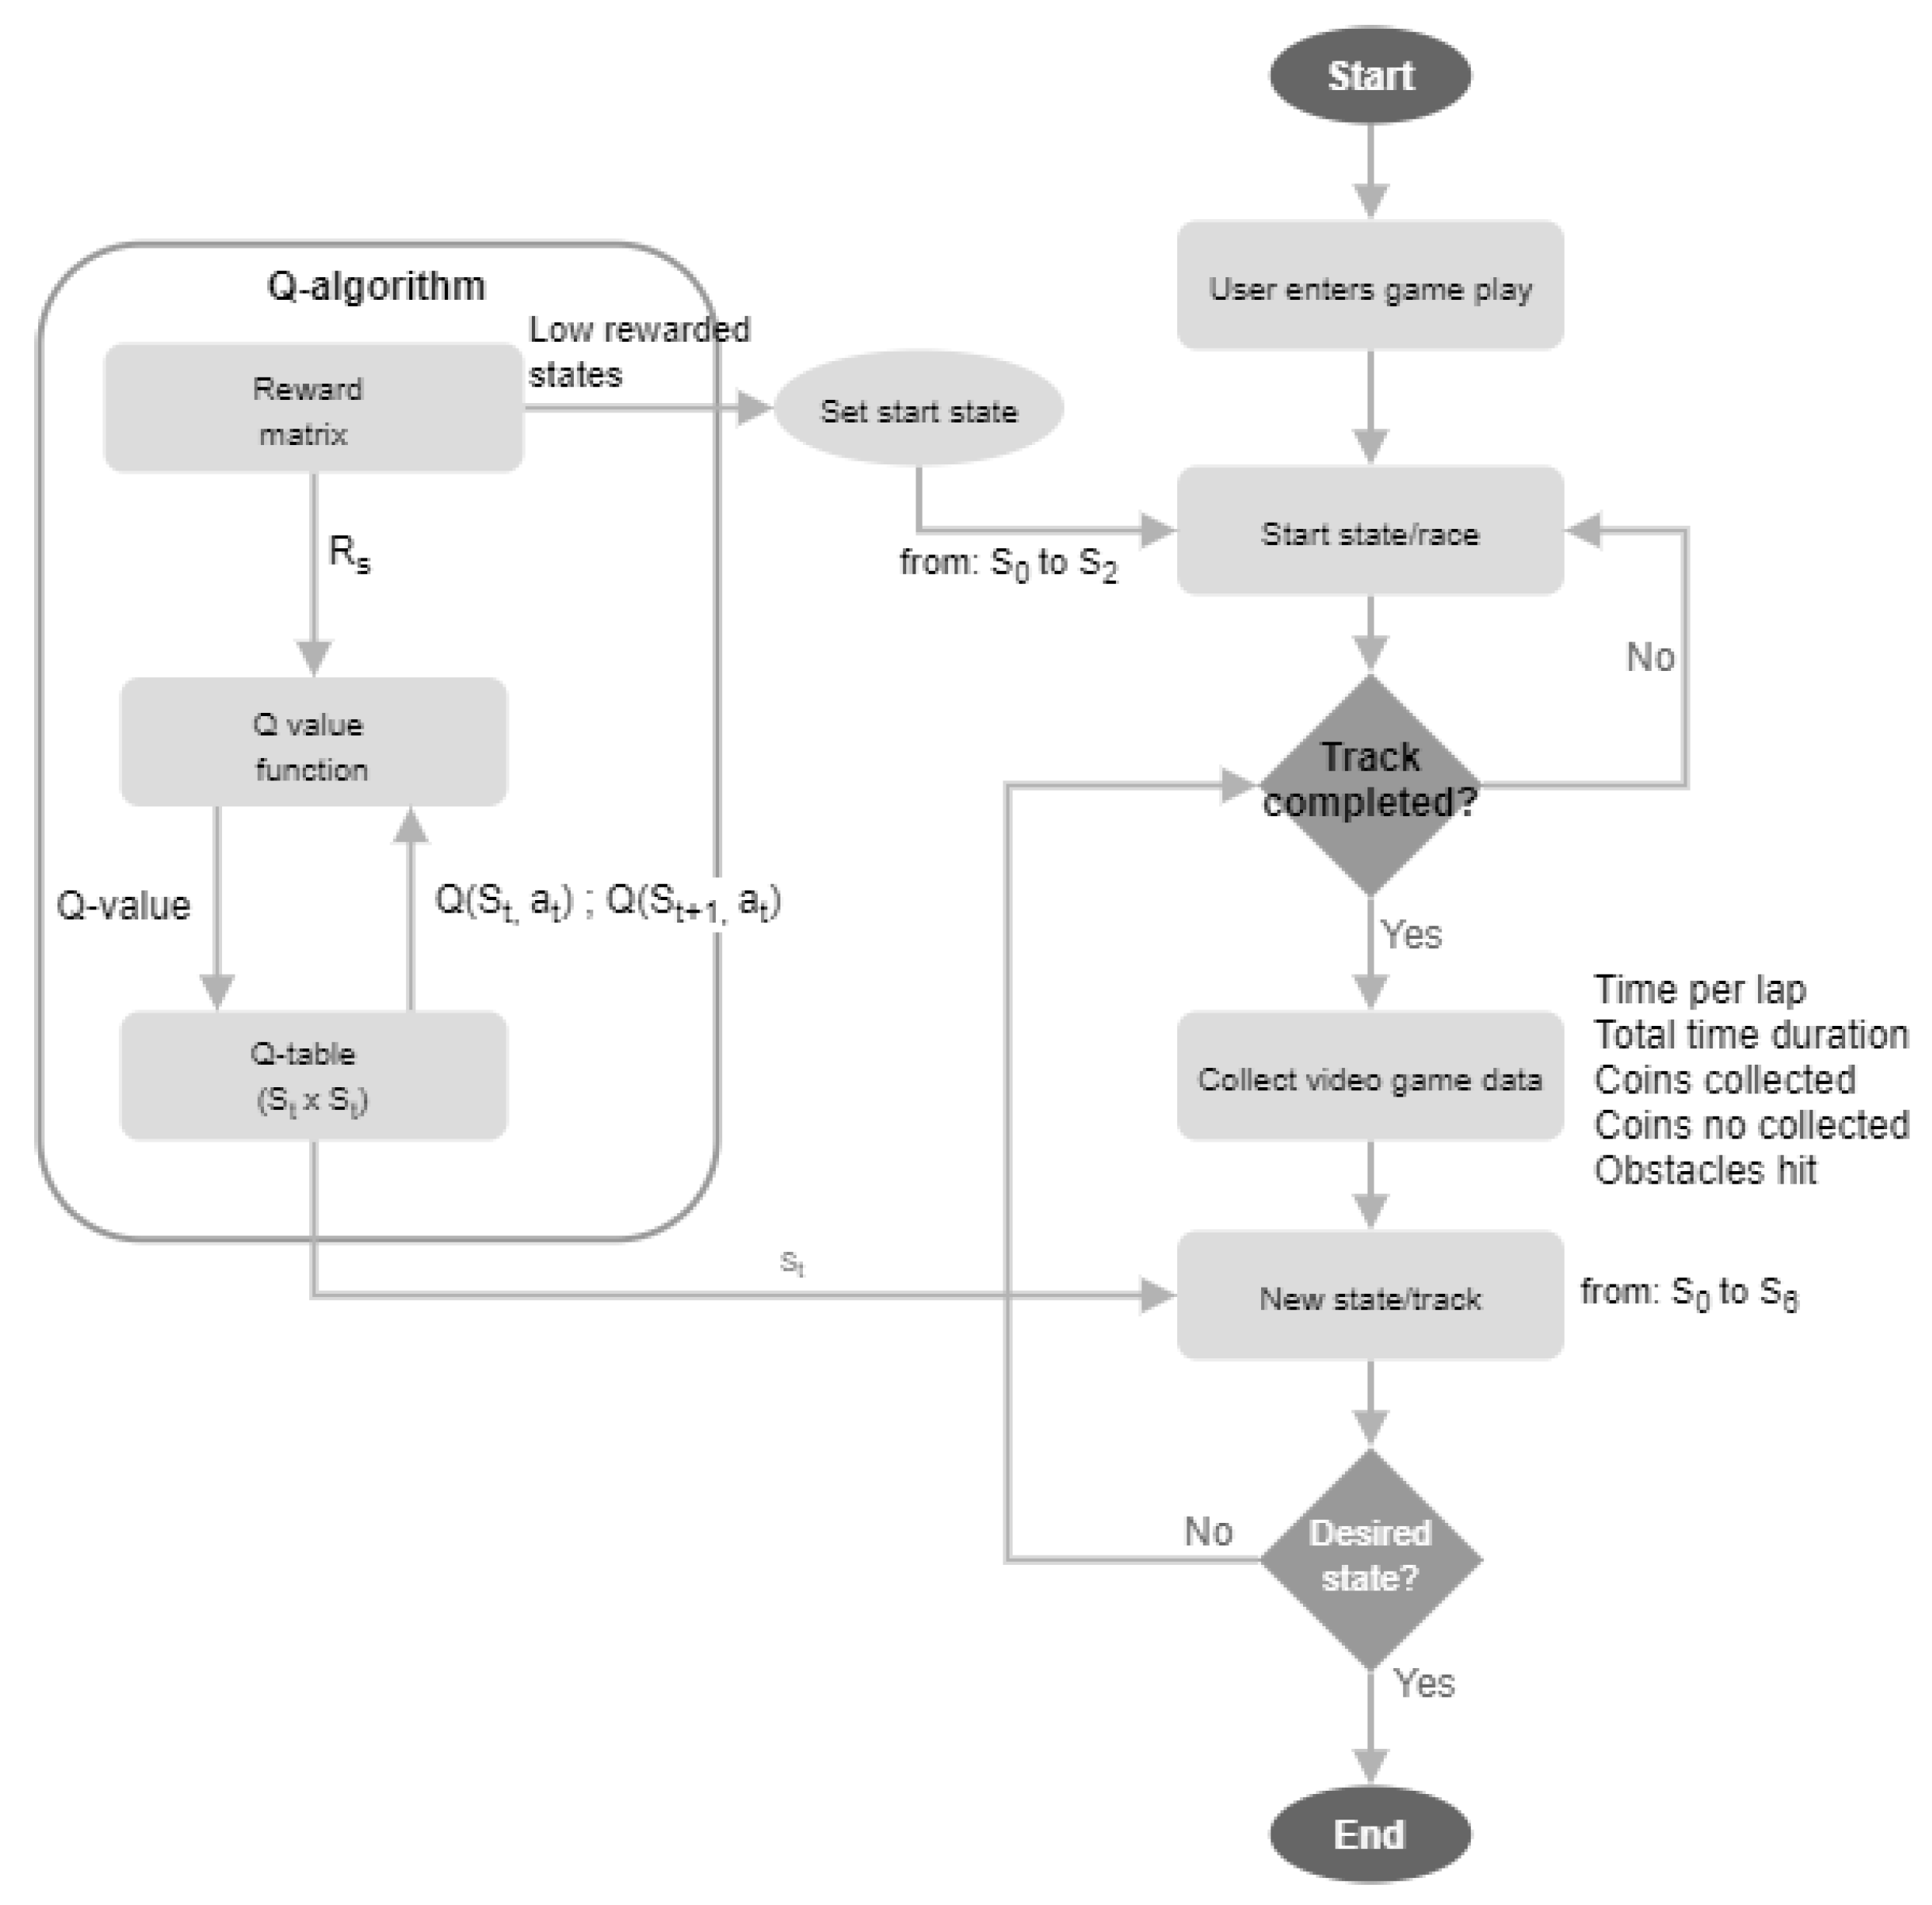
In this stage, the user uses the virtual environment with the goal of the RL algorithm to help improve the UX. Figure 12 illustrates a general diagram of the interaction with the virtual environment. First, the user enters the system, and an unpleasant state/track is randomly assigned to start the interaction. During the track, the user can perform the following interactions: collect coins along the way to obtain scores, avoid obstacles along the way, and complete 3 laps to finish a track. Upon completion of each track, the algorithm transitions to another state/track, from to and collects the data of time per lap, total time duration per track, coins collected, and obstacles hit for further analysis. Once users reach the desired state, interaction with the game concludes.
5.2.2. User Profile Acquisition Stage
At this stage, a set of states were defined based on configurable parameters, such as speed, music, and the number of obstacles (Table 2). To define the states, test sessions were conducted with a duration of 5 min, where the player used the virtual environment, then proceeded to generate the states of satisfaction.
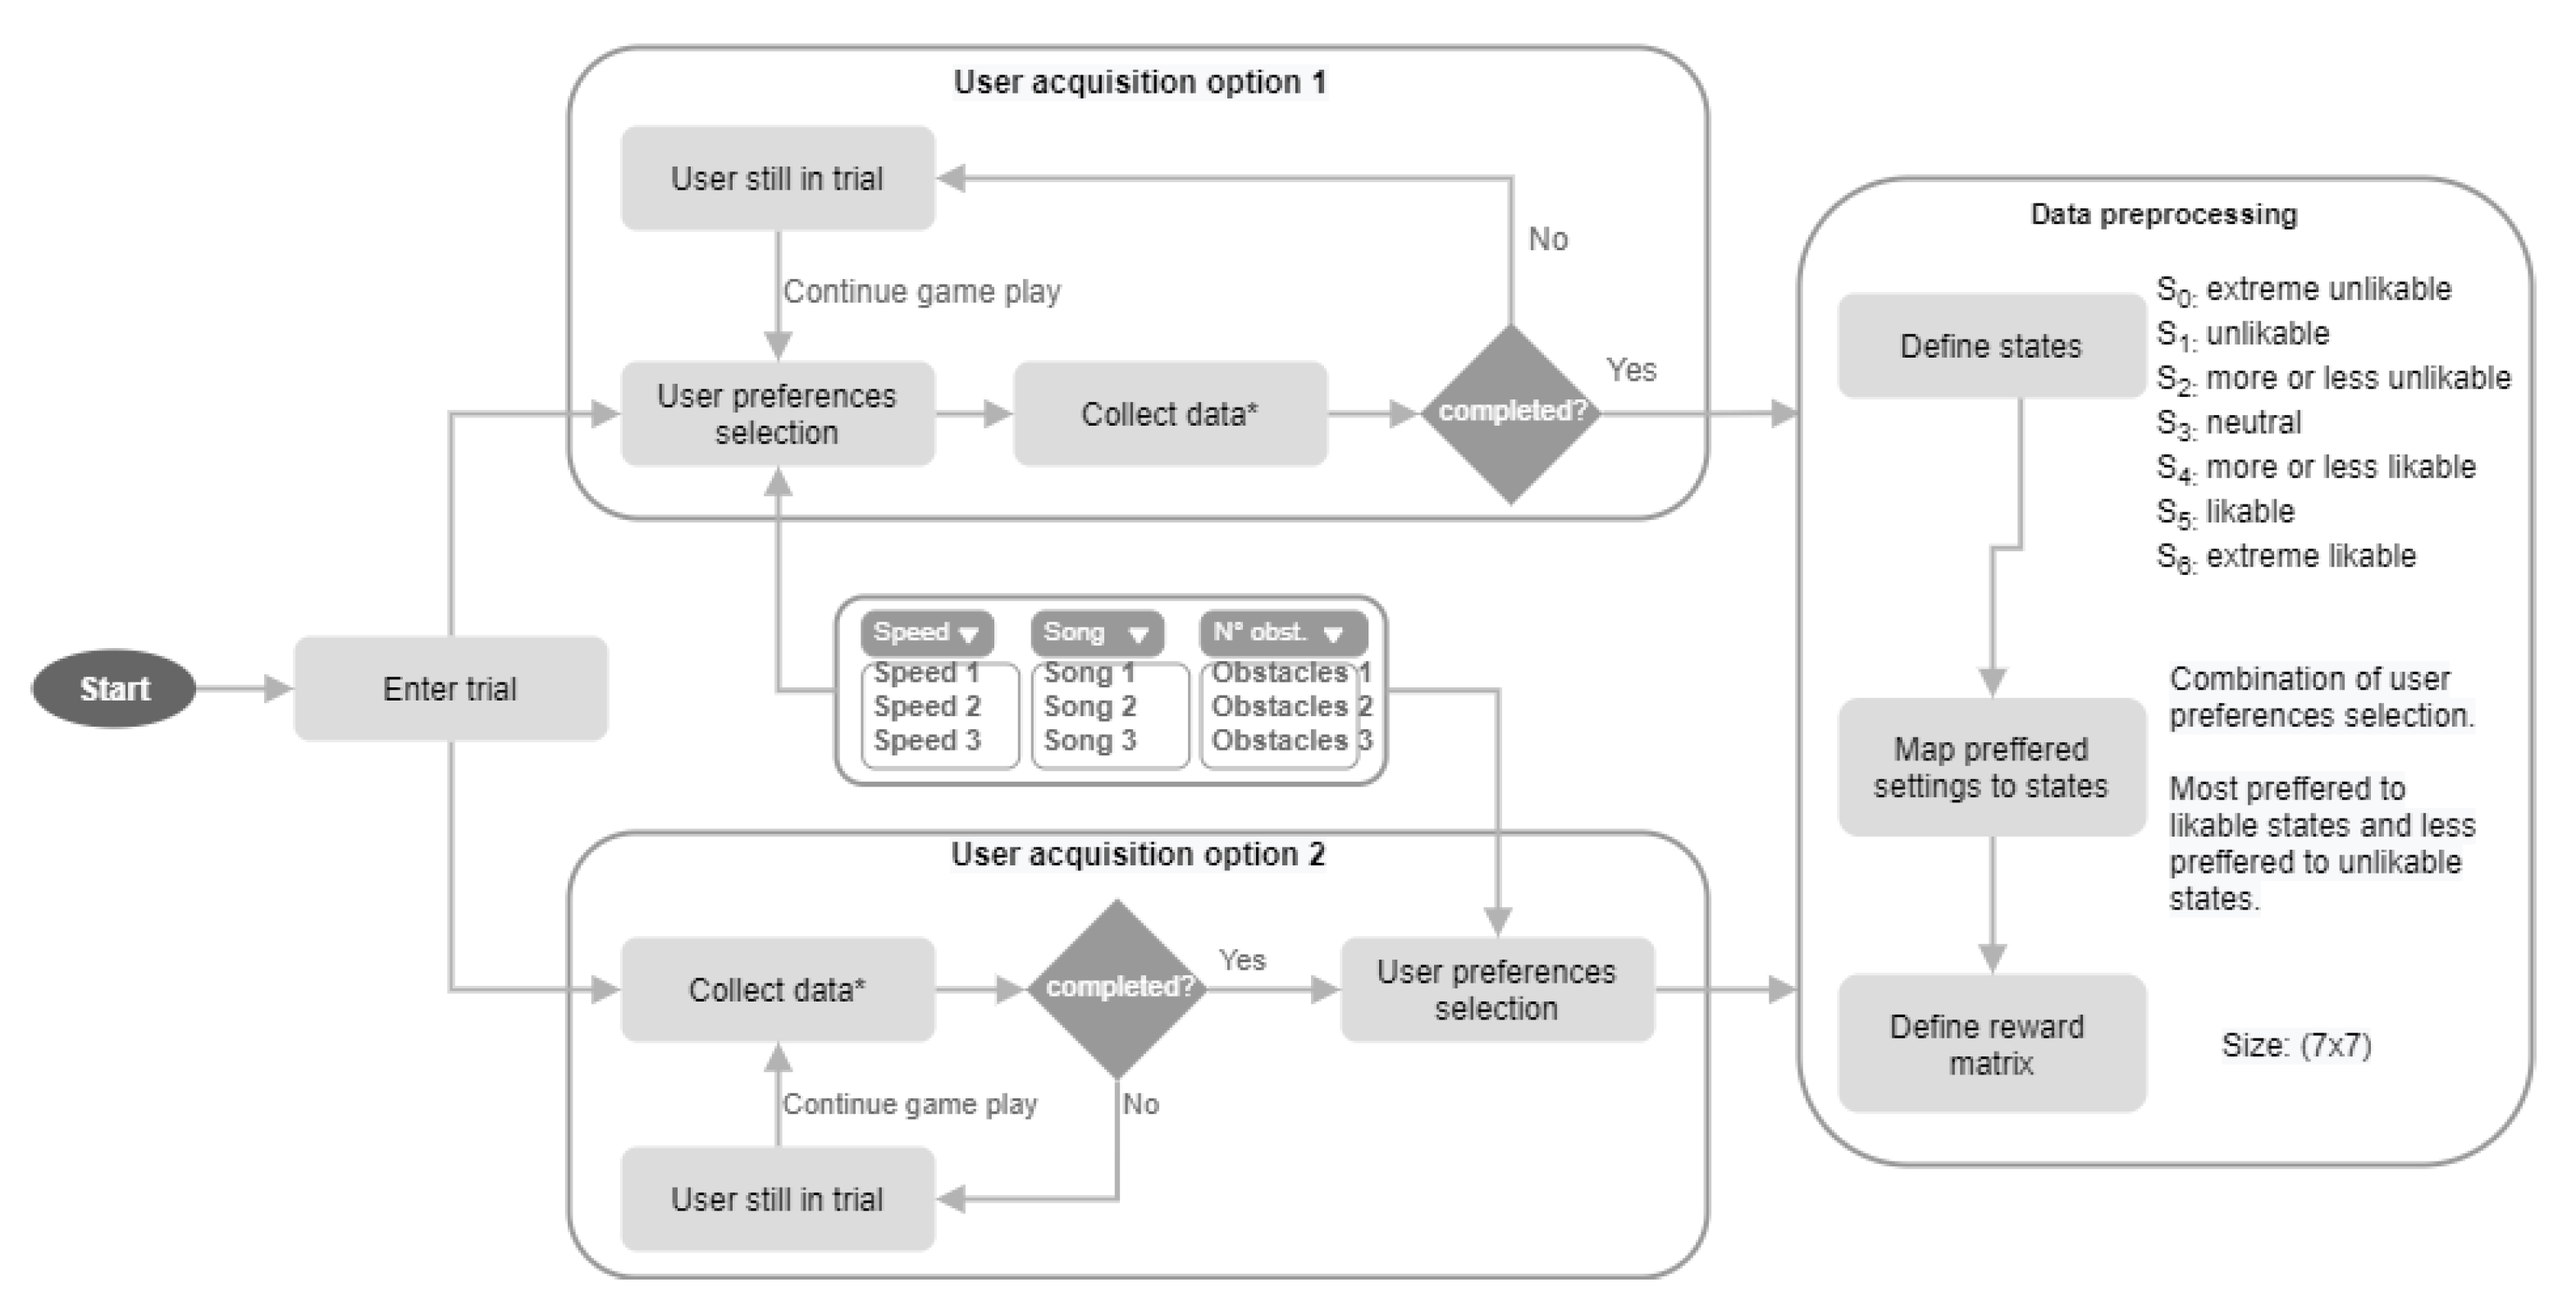
Figure 13 represents the user preferences process. First, the user enters a testing stage and chooses an option to acquire his preferences, said preferences can be obtained from the following options.
- Option 1: the user enters the test and, once in the test, selects the parameters he/she finds satisfactory.
- Option 2: the user enters the test and once it is completed, the user selects the preferred parameters.
Once the user’s preferences are obtained, the data is preprocessed. Here, a combination of the parameters is assigned to a set of satisfaction states —states corresponding to the Q-learning algorithm. Subsequently, a reward matrix (Equation (2)) is generated from the defined states. The mapping of the states with the combination of the parameters is presented in the Table 3.
- extreme unlikable
- unlikable
- more or less unlikable
- neutral
- more or less likable
- likable
- extreme likable
5.3. Implementation Phase
This phase according to the model in Figure 5 contemplates the coding of the algorithm and the video game, presents a scene diagram, and the tests that were performed for the video game.
5.3.1. Coding
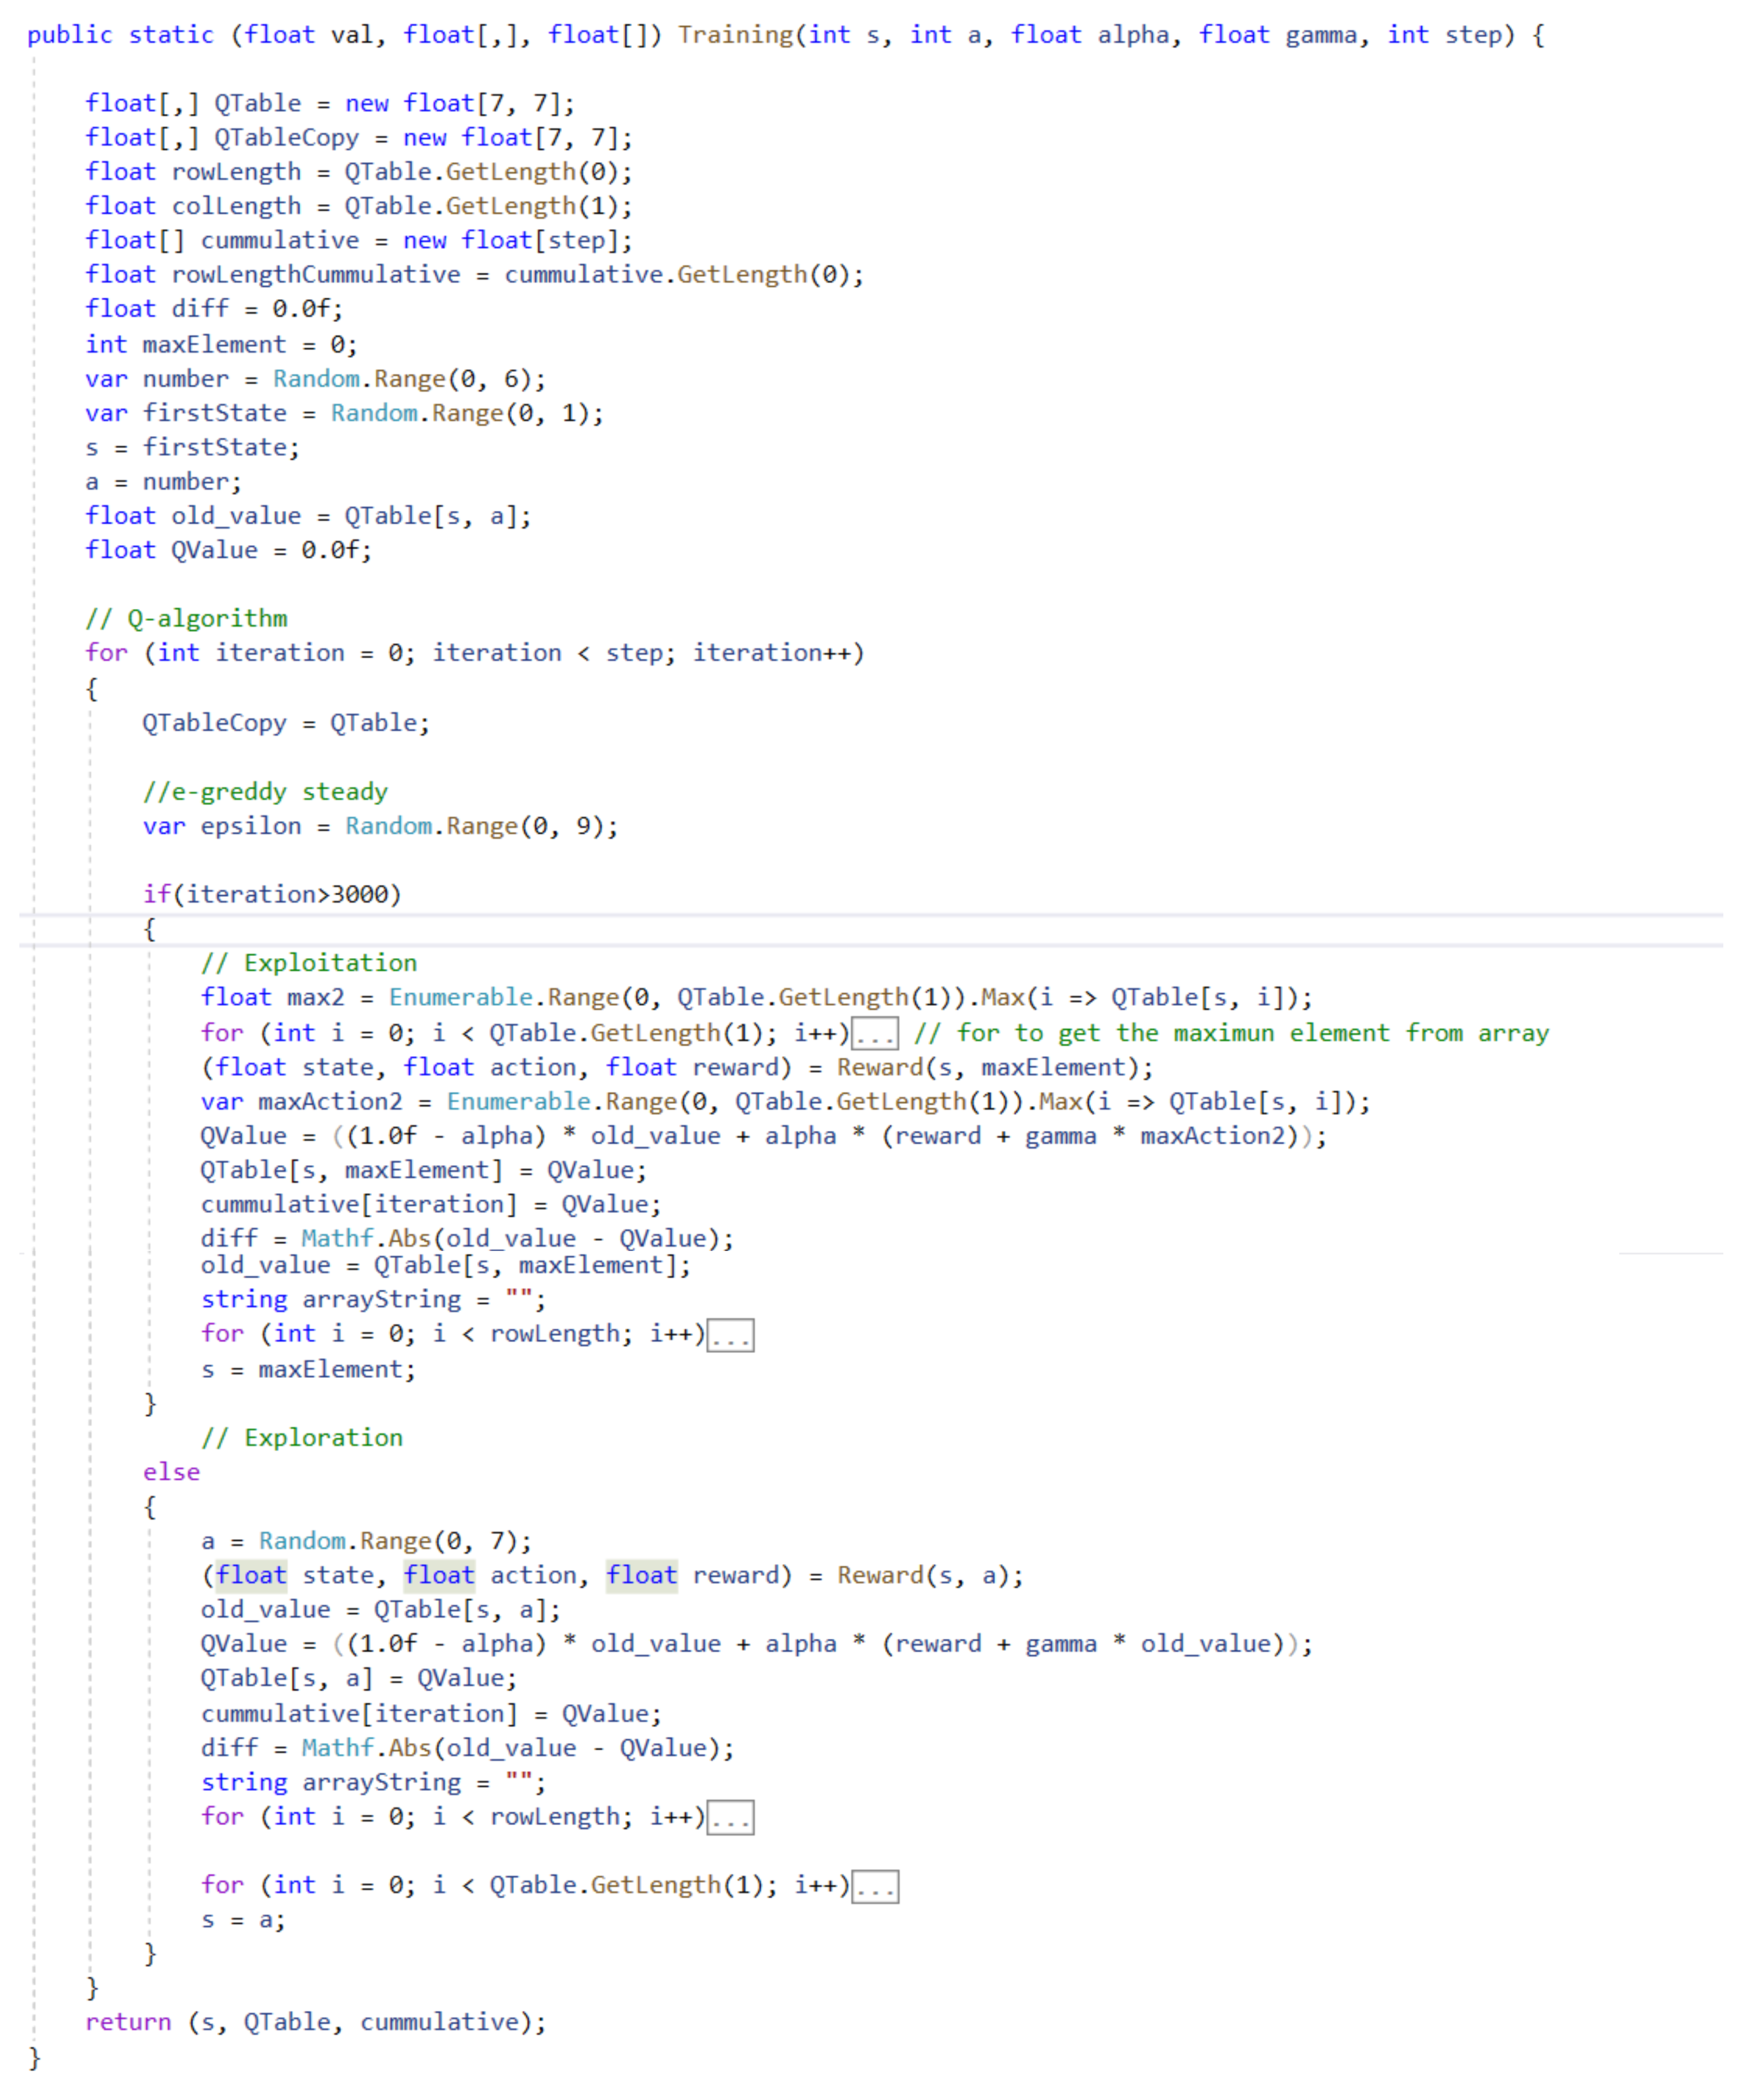
In this stage, the user profile acquisition stage is used as a basis to define the user preferences as an input (speeds, music, and the number of obstacles), and the reward matrix as an output (Figure A3 presents a fragment of the coding of the algorithm in the virtual environment). Through two classes, the data preprocessing is in charge of mapping the preferences to their respective satisfaction states. On the other hand, the interaction stage algorithm is in charge of transitioning the states, elements, and clues of the video game; mainly, this is centered on the Q-learning algorithm, which takes as input the initial state , the reward set R, the learning rate , discount factor rate , and initializes a Q matrix of the values , the only output of the interaction algorithm is the transition of states and tracks.
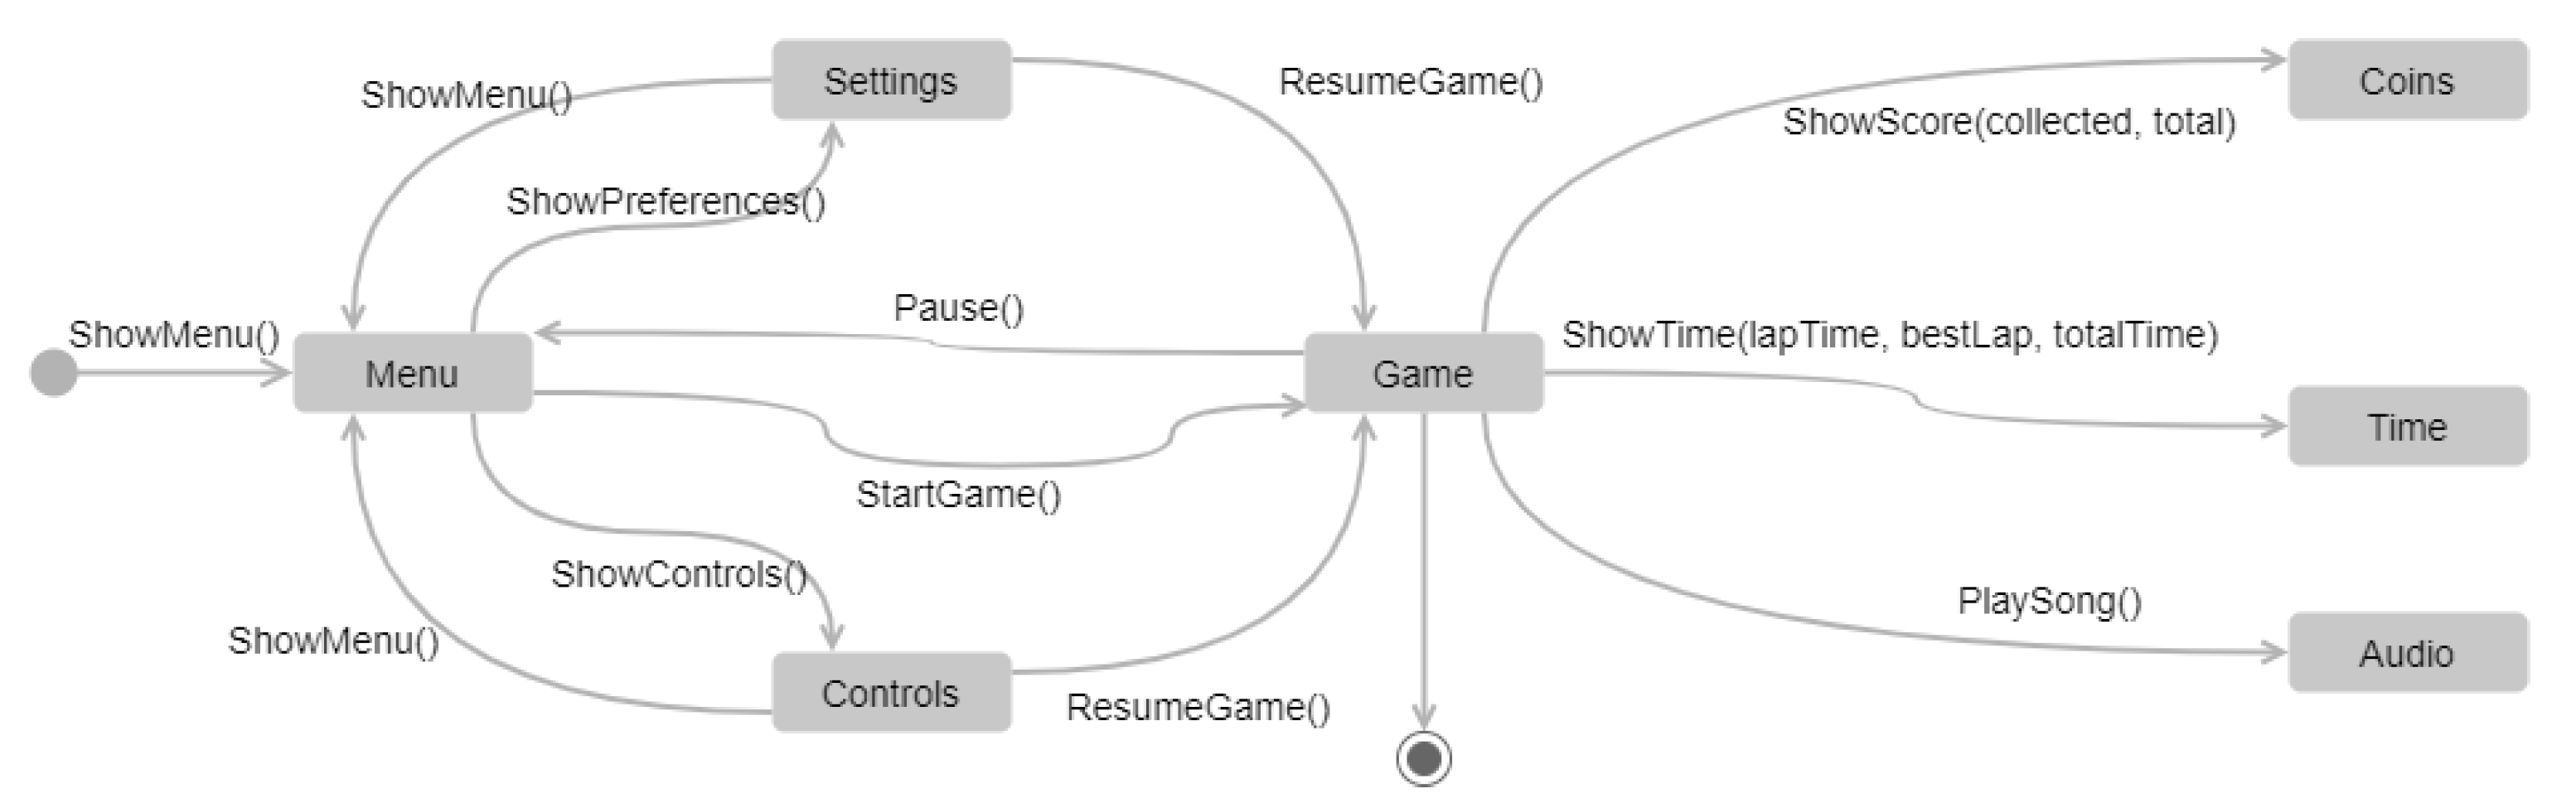
Scene diagram. The scene diagram presented in Figure 14 allows specifying the user’s interaction with the interface. The user has the opportunity to enter a menu and navigate to settings, controls, or return to the game. Within the game, the user can view the total number of coins in the track, coins collected, and the user can view the lap time, best time, and total time per track.
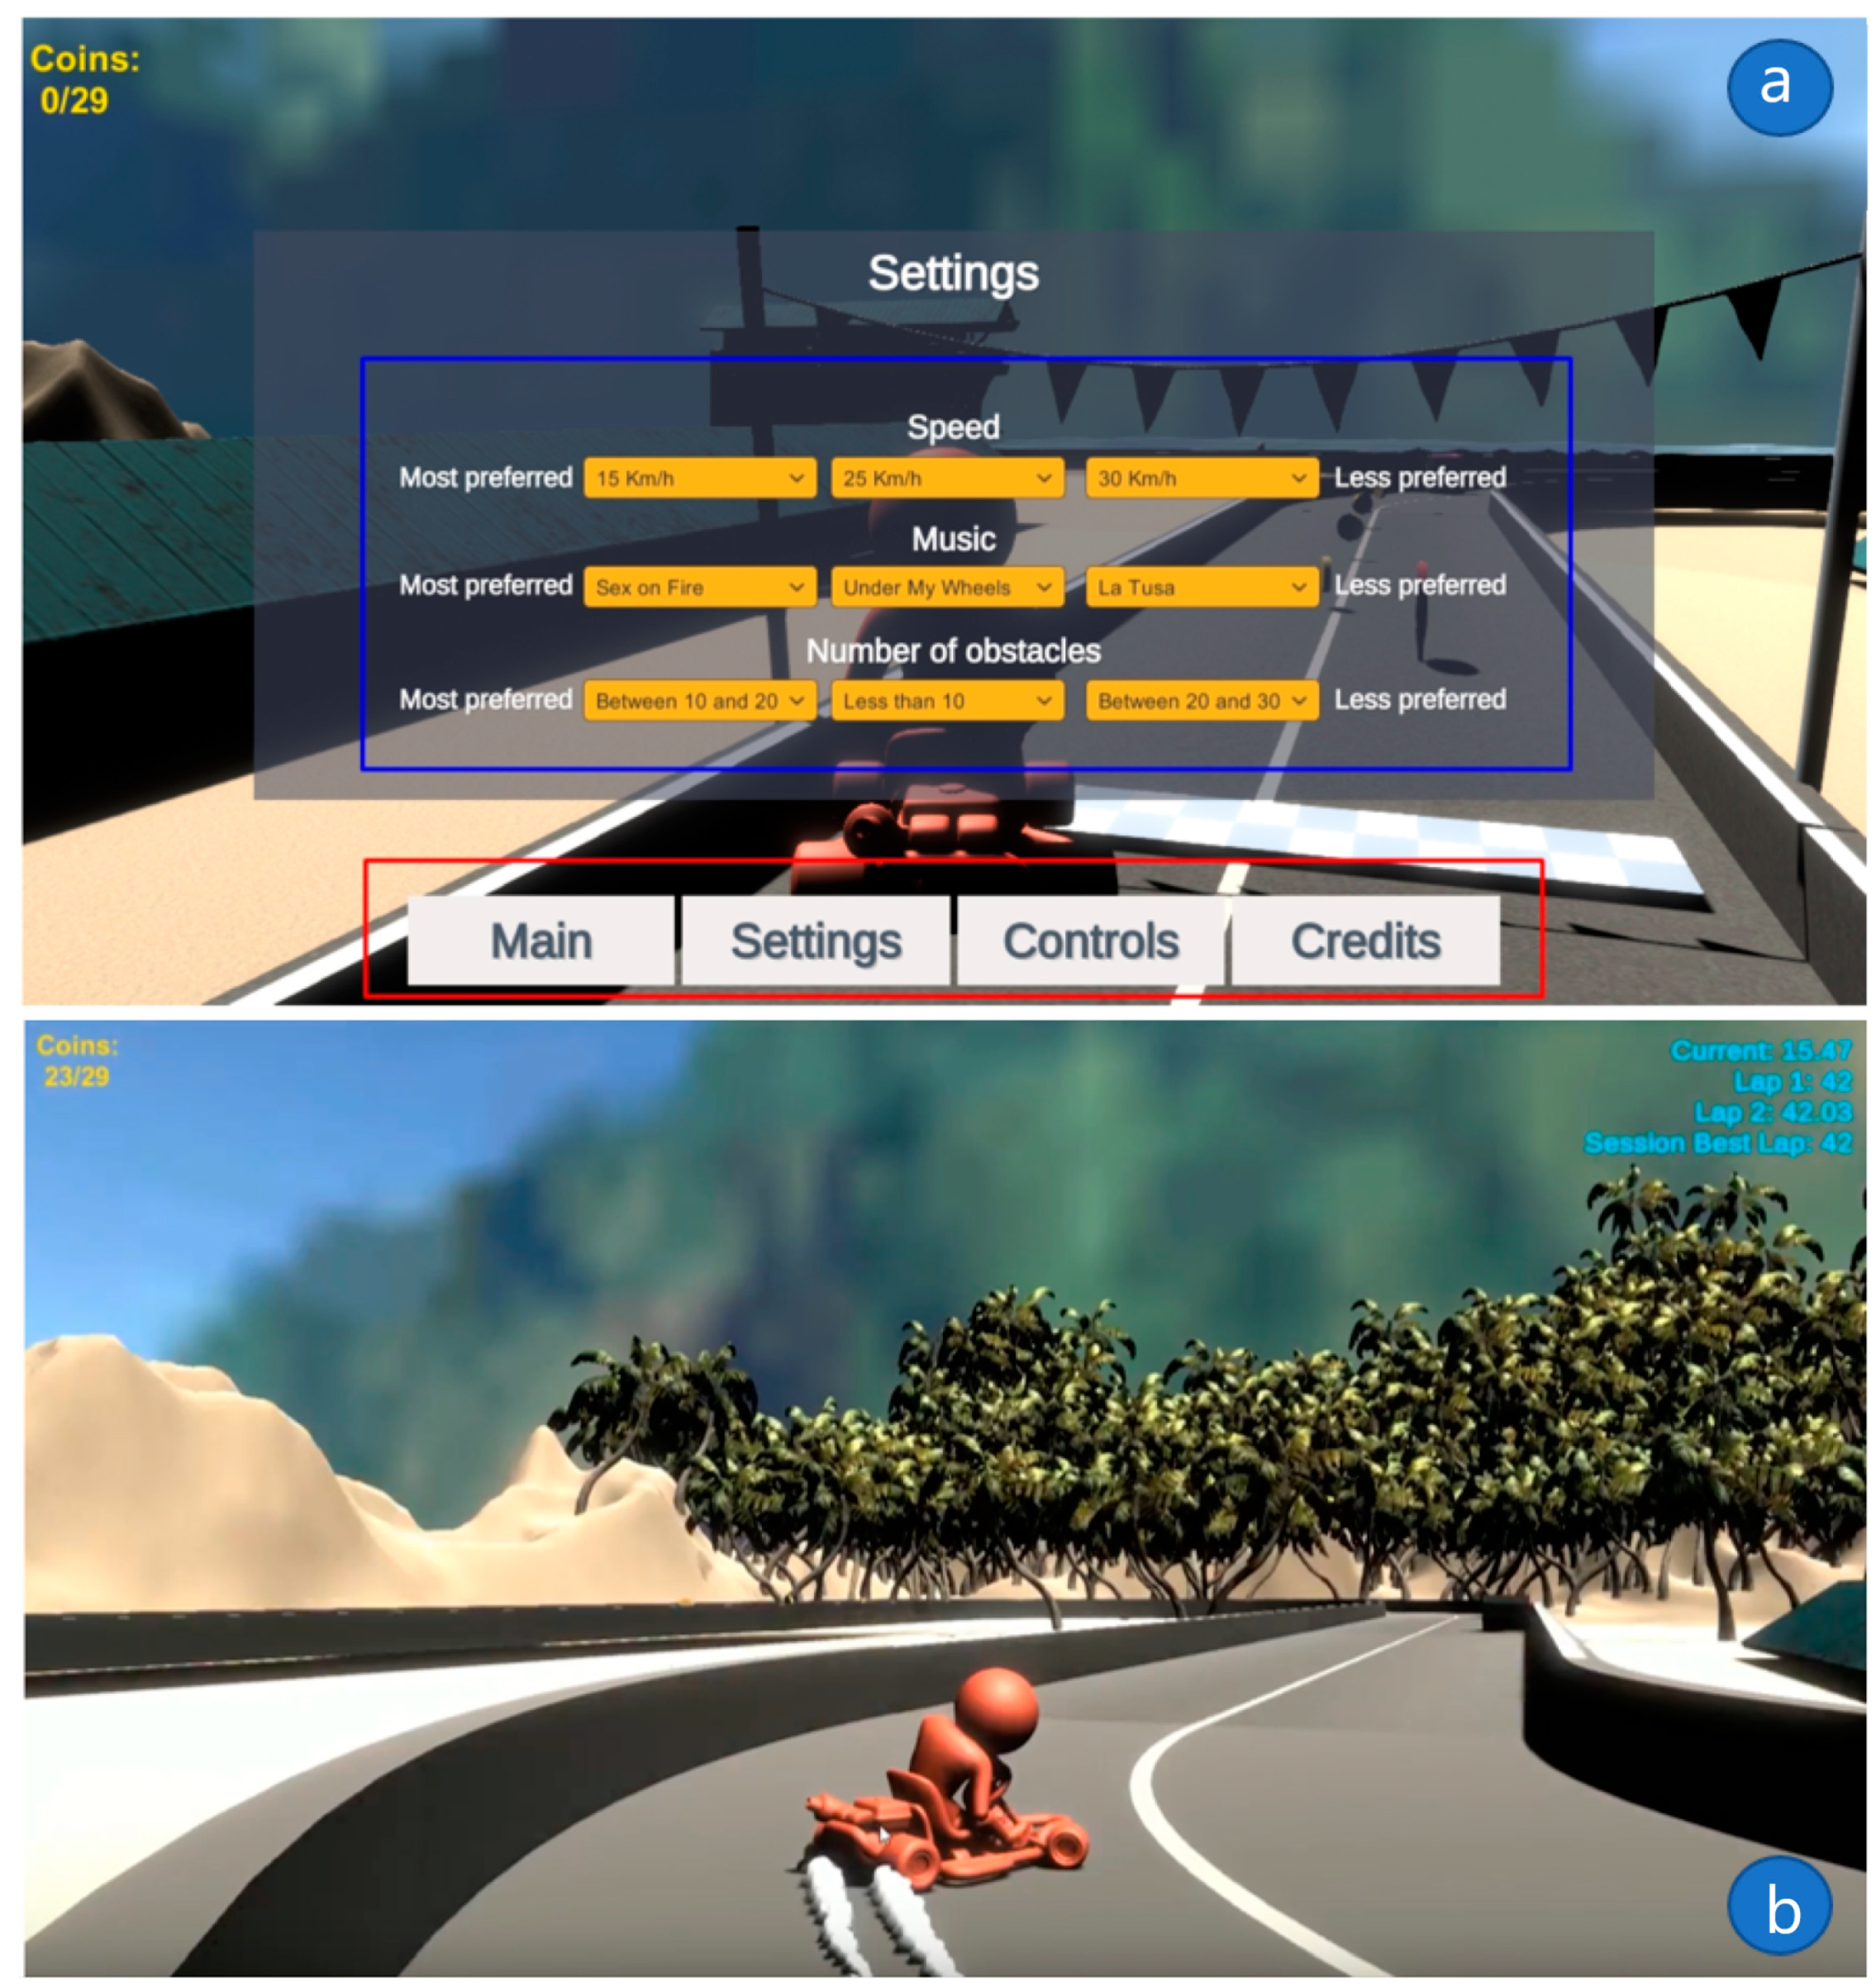
Figure 15a illustrates the user’s profile acquisition interface, and also shows a main rectangle (enclosed in blue) where the player chooses the speed, music, and the number of obstacles. At the bottom of the same image, some buttons are observed wherein “Main”, the instructions of the virtual environment are indicated; “Settings”, user preferences configuration; “Controls”, the controls to move the cart; and “Credits”, developer credits. The track interface Figure 15b presents in the upper right corner feedback information to the user, such as time per lap, current time, and current lap number, in the upper left corner we can find the collected coins and totals in the track.
5.3.2. Tests
The virtual environment was tested under various interaction control inputs.
- Keyboard and joystick input
- Spatial relationships, this test consisted of validating the control inputs with the video game coordinate space in the x, y, and z axes (so that the controls would make the correct movement in the video game).
In addition, performance tests were executed to ensure the proper functioning of the virtual environment, these tests were divided into volume tests, game elements tests, reliability tests, and usability tests. Regarding usability, the tests were performed at various times to find errors during the interaction, all the errors that were found were related to the game elements when the kart collided with objects. Finally, the virtual environment was built to be compatible with several operating systems such as Windows and Mac OS X, in order to perform compatibility tests.
6. Results
The results obtained from the implementation of the model in Figure 5 were the product of three different simulations. The user preferences obtained for each simulation are shown in Table 4. These simulations correspond to the user profile acquisition stage, simulating that three users played during 5 min trials and defined the parameters of speed, music, and the number of obstacles. These tests allowed validating the implementation within the virtual environment of the RL algorithm.
Once the user preference acquisition stage was completed. The Q-learning algorithm through a Q-matrix—two-dimensional array of the maximum rewards obtained from switching from one state to —adjusts the transition between states as a function of a reward matrix (Equation (3)). The reward matrix was obtained for all the simulations, as presented in Table 4.
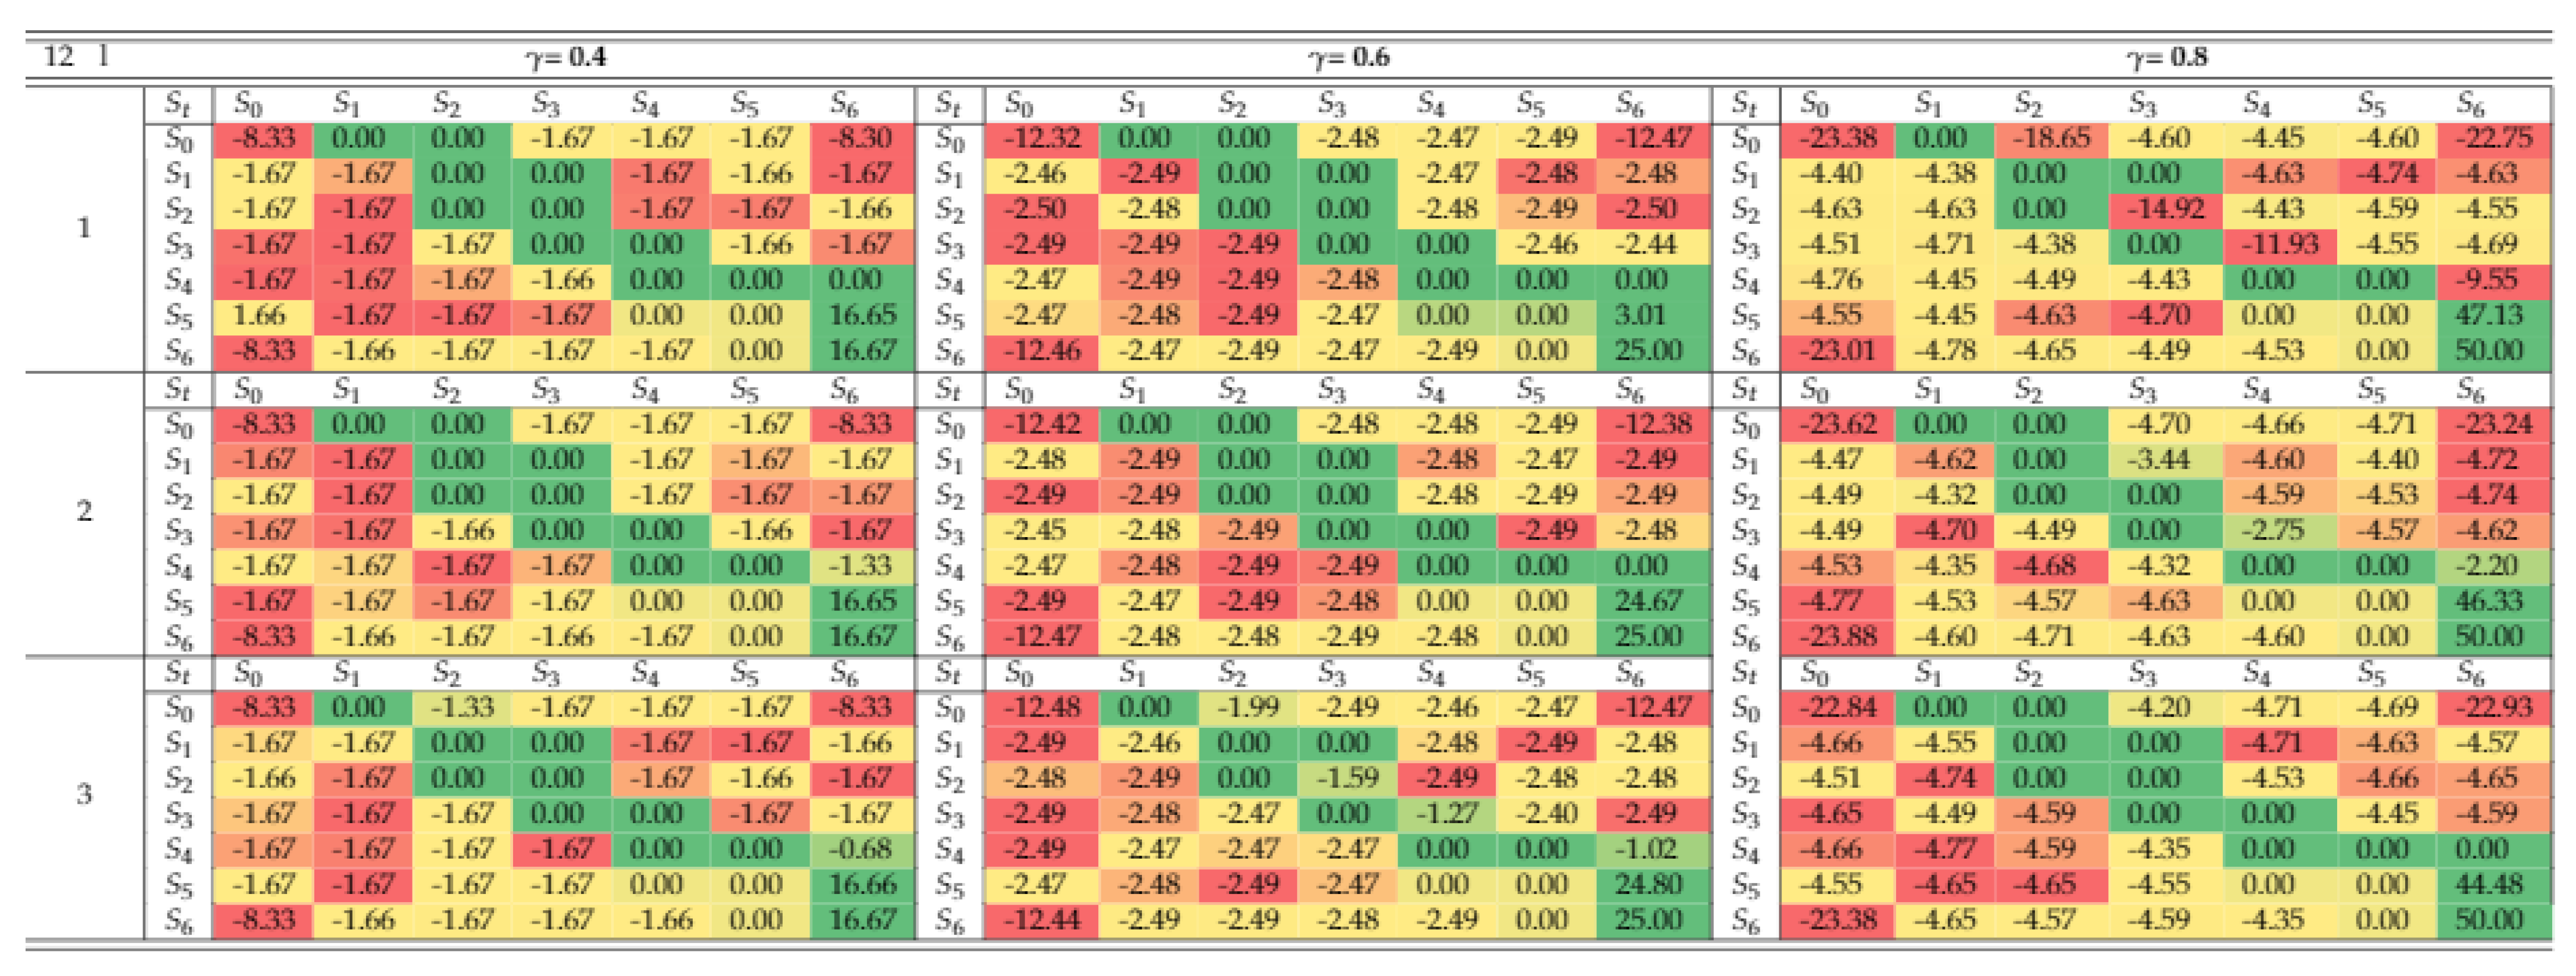
Figure 16 shows the transitions in each state, this depends on the Q-table which is a function of the reward matrix, as shown in Figure 17. According to Figure 16, the user starts in state extremely unlikable () and has the possibility to go to state unlikable () or to state more or less unlikable () because they have the minimum reward, in the algorithm has the option to stay in the same state or transition to the state neutral (), and so on until it reaches the state extremely likable ().
In the simulation of user 2, the same procedure is performed but with less variation of transition between states—two possible paths. Subsequently, in the simulation of user 3, a faster state transition is performed—one path only, this is because as the learning factor increases there is more penalty and results in a faster transition.
Table 5 summarizes the results of the simulations, where the optimal policy is to start at progressively increasing to , thus reaching the extremely pleasant state. The table presents the metrics of reinforcement learning, final average reward, and cumulative reward.
Note that although the cognitive load was not studied in this work, a relationship between the learning rate and the number of states of each user due to the penalty can be observed. This can also be translated in that there is a relationship between the learning rate with the learning time of the users, i.e., a lower number of states represents a lower cognitive load.
Figure 17 shows the results obtained from the simulations for each learning factor (): 0.4, 0.6, and 0.8. This table shows the result of a total of 9 Q-matrix, where colors close to red represent negative values and close to green represent positive values. The algorithm switches from one state to another by taking the next state that gives more reward.
This section presents the results of the case study and the simulation of the model. The simulation results form a table of the algorithm’s metrics, in which the performance and the policy it takes when starting from the state can be observed. Thus, showing a correct transition of the states, from the extremely unpleasant to the extremely pleasant state.
7. Discussion
This work presents a model to adapt virtual environments to users in order to get good experience with the technology. The model allows us to adjust a series of parameters of a virtual environment using a reinforcement learning technique, which adapts to the user’s preferences. The design of the phases of the model based on an MDA architecture is presented, then in the implementation of the model a video game is developed, and the proposed model is applied to a case study with simulations. Here, some advantages related to current proposal.
- Current approach with the study enriches and extends the ongoing debates on the design of user-oriented VR interfaces.
- Unlike related work in MDA aiming at the development of a traditional interactive system, this work recognizes the MDA to be used as an excellent tool to improve the user experience, with which we can have good experiences within virtual environments. In addition, this model also helps virtual environment designers and researchers with related work. The model is based on an MDA architecture, under the phases of analysis, design, and implementation that serve as a guide for stakeholders [58].
- In addition, the simulation results show a correct transition between states of satisfaction, from an extremely unpleasant state to the extremely pleasant one.
- In fact, this work represents a bridge between the Human–Computer Interaction (HCI) [49] development with the HCI research. Thanks to MDA approach is possible to add new algorithms to ongoing in the UX research.
8. Conclusions and Future Work
Currently, researchers and developers are increasingly looking for their applications to take into account the factor that allows them to offer a good user experience. In this sense, the literature offers a large number of proposals that range from offering a good user experience assuming that each user has similar preferences, adjusting these preferences according to their performance. Other proposals are based on physiological data, or assume that the levels of difficulty that are related to the states of the users (for example, high levels of difficulty lead to states of anxiety and low levels of difficulty to states of boredom). One of the great challenges is for these strategies to offer a good user experience that can be incorporated in a way that allows traceability and validation of the environment parameters in the software development cycle.
This work proposes a model under the MDA approach that offers developers and researchers a means to establish the various levels of abstraction for adequate identification of the profiles involved and thus define the development phases of the virtual environment and the objectives. At the same time, this model proposes Reinforcement Learning as a technique to offer a good user experience in virtual environments according to the player’s preferences and the setting of parameters of the environment in a personal way. However, future work is vast, and it is necessary to further emphasize the user-centered approach to the design of the virtual environment, leading to its evaluation and feedback from users.
Author Contributions
Conceptualization, J.M.-A. and K.O.V.-C.; Data curation, H.C.-R.; Formal analysis, H.C.-R. and J.M.-A.; Funding acquisition, K.O.V.-C.; Investigation, H.C.-R. and A.M.-O.; Methodology, H.C.-R. and J.M.-A.; Project administration, H.C.-R.; Resources, J.M.-A.; Software, H.C.-R. and A.M.-O.; Supervision, H.C.-R., J.M.-A. and K.O.V.-C.; Validation, H.C.-R., J.M.-A. and A.M.-O.; Writing—original draft, A.M.-O.; Writing—review & editing, H.C.-R. and J.M.-A. All authors have read and agreed to the published version of the manuscript.
Funding
This research received no external funding.
Acknowledgments
The research work was developed thanks to the research project of RESOLUCIÓN No. 27683-R-2021. We thank the “Universidad Católica de Santa María” for making possible the realization of the research article. The rest of the authors thank to CIMAT for the scholarship given to master student and the membership of the National Researcher System of CONACYT in Mexico.
Conflicts of Interest
The authors declare no conflict of interest.
Appendix A
Figure A1.
System class diagram. The virtual environment is made up of four main layers: user, game, user interface, and game elements. Each class shows the most important attributes and methods.
Figure A1.
System class diagram. The virtual environment is made up of four main layers: user, game, user interface, and game elements. Each class shows the most important attributes and methods.

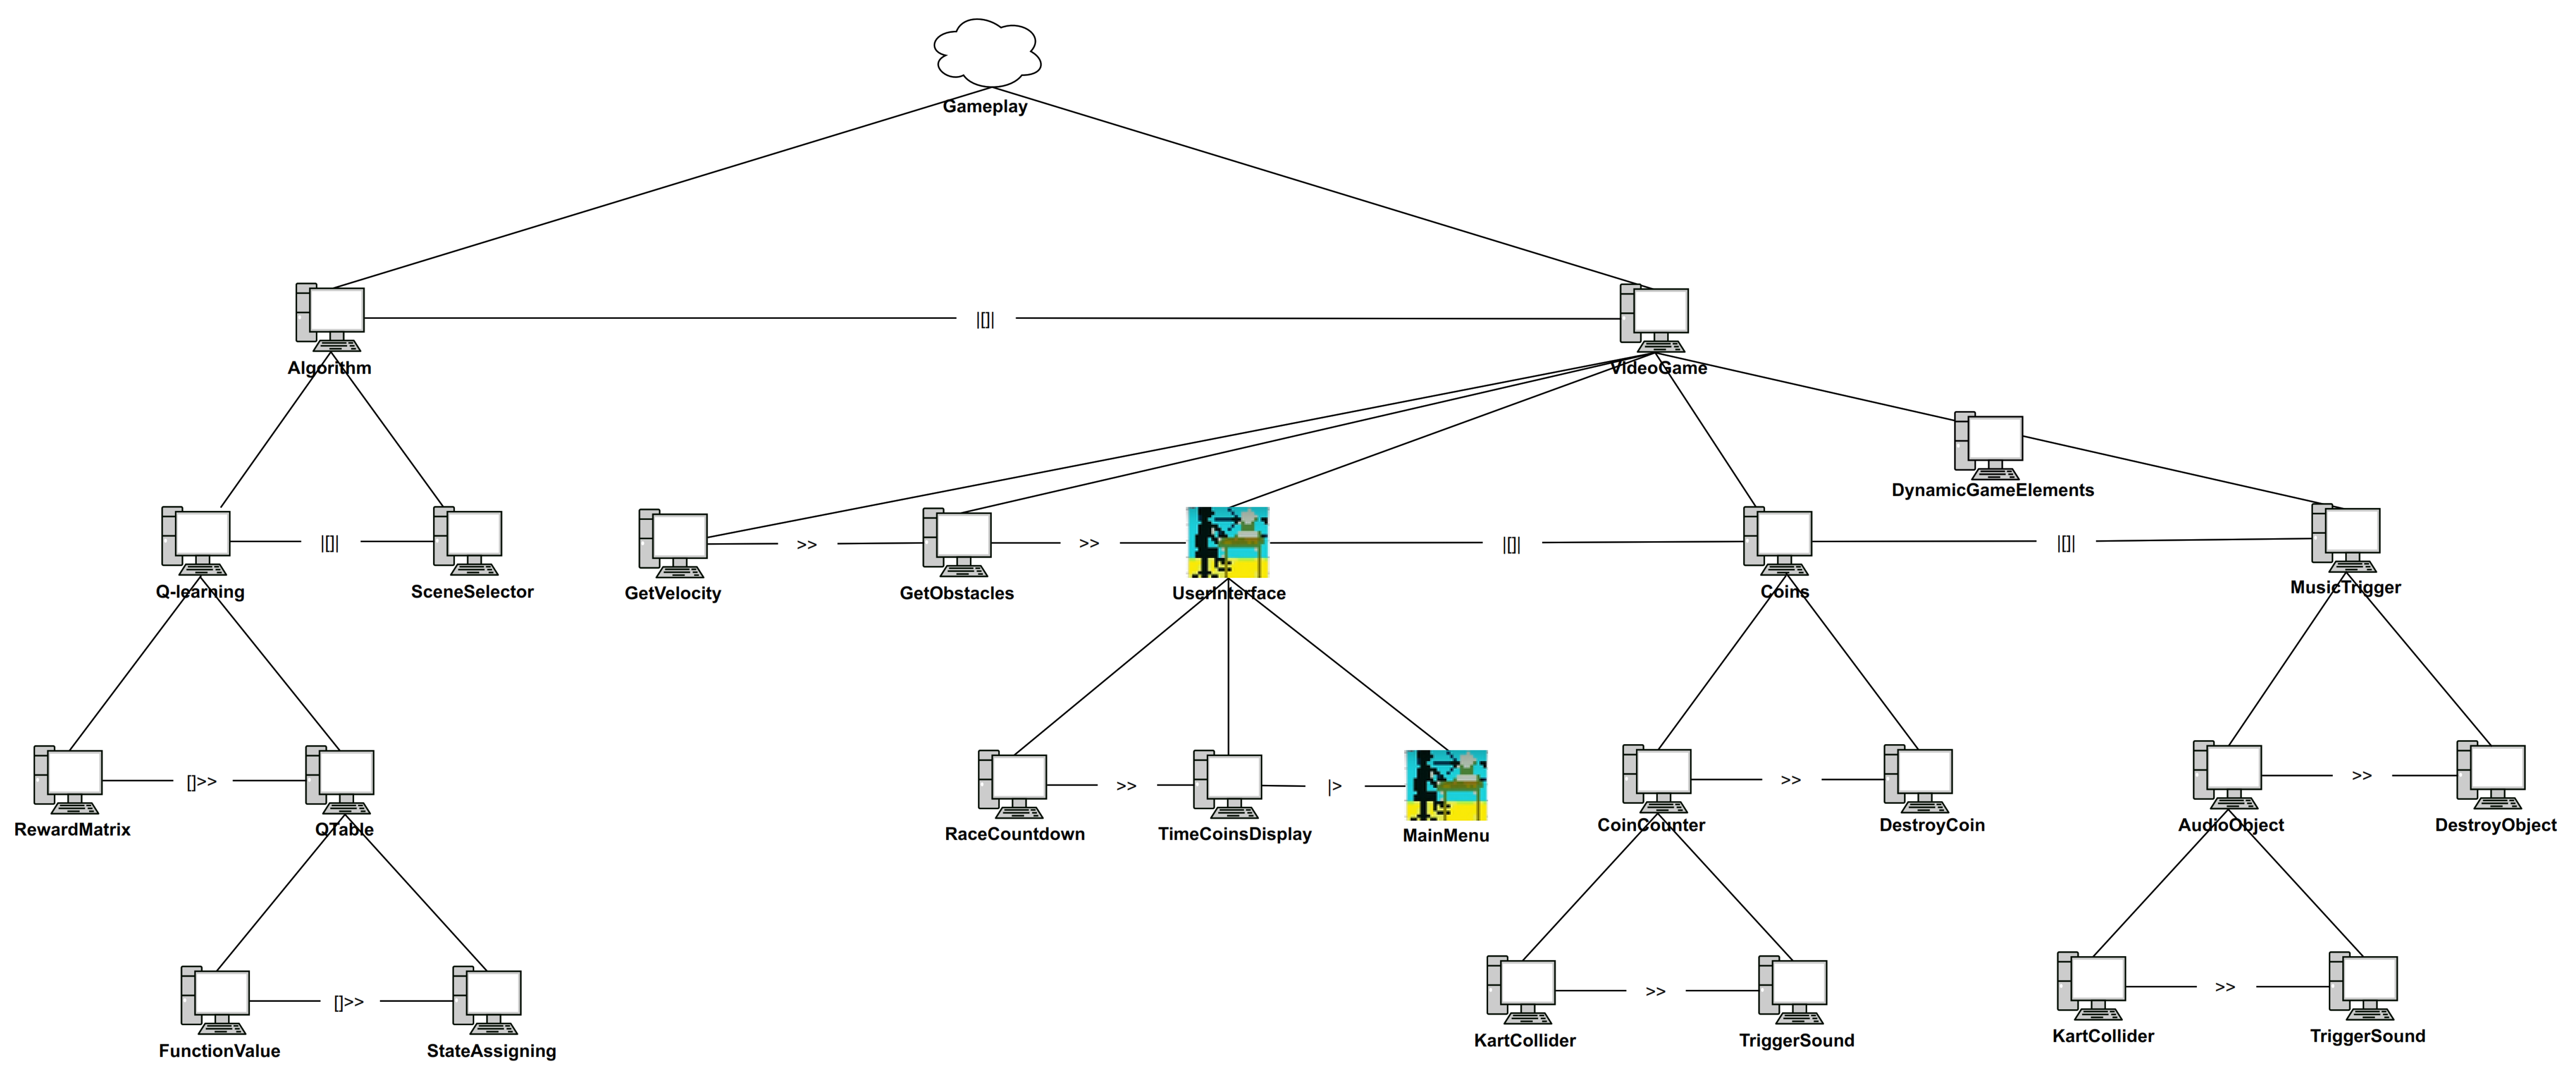
Figure A2.
Task sublevel Gameplay. The algorithm and video game task VideoGame are considered.

Figure A3.
Fragment of the Q-learning algorithm implemented in the virtual environment.

References
- Boyle, E.A.; Hainey, T.; Connolly, T.M.; Gray, G.; Earp, J.; Ott, M.; Lim, T.; Ninaus, M.; Ribeiro, C.; Pereira, J. An update to the systematic literature review of empirical evidence of the impacts and outcomes of computer games and serious games. Comput. Educ. 2016, 94, 178–192. [Google Scholar] [CrossRef]
- Forsyth, C.; Pavlik, P., Jr.; Graesser, A.C.; Cai, Z.; Germany, M.-I.; Millis, K.; Dolan, R.P.; Butler, H.; Halpern, D. Learning Gains for Core Concepts in a Serious Game on Scientific Reasoning. Int. Educ. Data Min. Soc. 2012, 5, 4. [Google Scholar]
- Coller, B.D.; Scott, M.J. Effectiveness of using a video game to teach a course in mechanical engineering. Comput. Educ. 2009, 53, 900–912. [Google Scholar] [CrossRef]
- Joiner, R.; Iacovides, J.; Owen, M.; Gavin, C.; Clibbery, S.; Darling, J.; Drew, B. Digital games, gender and learning in engineering: Do females benefit as much as males? J. Sci. Educ. Technol. 2011, 20, 178–185. [Google Scholar] [CrossRef] [Green Version]
- Pichierri, G.; Murer, K.; de Bruin, E.D. A cognitive-motor intervention using a dance video game to enhance foot placement accuracy and gait under dual task conditions in older adults: A randomized controlled trial. BMC Geriatr. 2012, 12, 74. [Google Scholar] [CrossRef] [PubMed] [Green Version]
- Hurkmans, H.L.; Ribbers, G.M.; Streur-Kranenburg, M.F.; Stam, H.J.; Van Den Berg-Emons, R.J. Energy expenditure in chronic stroke patients playing Wii Sports: A pilot study. J. Neuroeng. Rehabil. 2011, 8, 38. [Google Scholar] [CrossRef] [PubMed] [Green Version]
- Li, K.F.; Sevcenco, A.M.; Yan, E. Telerehabilitation using low-cost video game controllers. In Proceedings of the IEEE 2013 Seventh International Conference on Complex, Intelligent, and Software Intensive Systems, Taichung, Taiwan, 3–5 July 2013; pp. 136–143. [Google Scholar] [CrossRef]
- Chen, P.Y.; Hsieh, W.L.; Wei, S.H.; Kao, C.L. Interactive wiimote gaze stabilization exercise training system for patients with vestibular hypofunction. J. Neuroeng. Rehabil. 2012, 9, 77. [Google Scholar] [CrossRef] [PubMed] [Green Version]
- Cook, N.F.; McAloon, T.; O’Neill, P.; Beggs, R. Impact of a web based interactive simulation game (PULSE) on nursing students’ experience and performance in life support training—A pilot study. Nurse Educ. Today 2012, 32, 714–720. [Google Scholar] [CrossRef]
- Hull, D.C.; Williams, G.A.; Griffiths, M.D. Video game characteristics, happiness and flow as predictors of addiction among video game players: A pilot study. J. Behav. Addict. 2013, 2, 145–152. [Google Scholar] [CrossRef] [Green Version]
- McGonigal, J. Reality Is Broken: Why Games Make Us Better and How They Can Change the World; Penguin: New York, NY, USA, 2011. [Google Scholar]
- Wijman, T. The Global Games Market Will Generate $152.1 Billion in 2019 as the U.S. Overtakes China as the Biggest Market | Newzoo. 2019. Available online: https://newzoo.com/insights/trend-reports/newzoo-global-games-market-report-2019-light-version/ (accessed on 1 November 2019).
- Kodama, R.; Koge, M.; Taguchi, S.; Kajimoto, H. COMS-VR: Mobile virtual reality entertainment system using electric car and head-mounted display. In Proceedings of the 2017 IEEE Symposium on 3D User Interfaces (3DUI), Los Angeles, CA, USA, 18–19 March 2017; pp. 130–133. [Google Scholar] [CrossRef]
- Merchant, Z.; Goetz, E.T.; Cifuentes, L.; Keeney-Kennicutt, W.; Davis, T.J. Effectiveness of virtual reality-based instruction on students’ learning outcomes in K-12 and higher education: A meta-analysis. Comput. Educ. 2014, 70, 29–40. [Google Scholar] [CrossRef]
- Reyes, H.C.; Arteaga, J.M. Multidisciplinary production of interactive environments to support occupational therapies. J. Biomed. Inform. 2016, 63, 90–99. [Google Scholar] [CrossRef]
- Neri, S.G.; Cardoso, J.R.; Cruz, L.; Lima, R.M.; De Oliveira, R.J.; Iversen, M.D.; Carregaro, R.L. Do virtual reality games improve mobility skills and balance measurements in community-dwelling older adults? Systematic review and meta-analysis. Clin. Rehabil. 2017, 31, 1292–1304. [Google Scholar] [CrossRef]
- Virvou, M.; Katsionis, G. On the usability and likeability of virtual reality games for education: The case of VR-ENGAGE. Comput. Educ. 2008, 50, 154–178. [Google Scholar] [CrossRef]
- Lokka, I.E.; Çöltekin, A. Toward optimizing the design of virtual environments for route learning: Empirically assessing the effects of changing levels of realism on memory. Int. J. Digit. Earth 2019, 12, 137–155. [Google Scholar] [CrossRef]
- Hruby, F.; Castellanos, I.; Ressl, R. Cartographic scale in immersive virtual environments. KN-J. Cartogr. Geogr. Inf. 2020, 1–7. [Google Scholar] [CrossRef]
- Keil, J.; Edler, D.; Schmitt, T.; Dickmann, F. Creating Immersive Virtual Environments Based on Open Geospatial Data and Game Engines. KN-J. Cartogr. Geogr. Inf. 2021, 1–13. [Google Scholar] [CrossRef]
- Brambilla, M.; Cabot, J.; Wimmer, M. Model-driven software engineering in practice. Synth. Lect. Softw. Eng. 2017, 3, 1–207. [Google Scholar] [CrossRef]
- Poole, J.D. Model-driven architecture: Vision, standards and emerging technologies. In Proceedings of the Workshop on Metamodeling and Adaptive Object Models (ECOOP 2001), Budapest, Hungary, 18–22 June 2001; Volume 50. [Google Scholar]
- Althoff, T.; White, R.W.; Horvitz, E. Influence of Pokémon Go on physical activity: Study and implications. J. Med. Internet Res. 2016, 18, e315. [Google Scholar] [CrossRef]
- Li, X.; Yi, W.; Chi, H.L.; Wang, X.; Chan, A.P. A critical review of virtual and augmented reality (VR/AR) applications in construction safety. Autom. Constr. 2018, 86, 150–162. [Google Scholar] [CrossRef]
- Lee, M.; Green, R.; Billinghurst, M. 3D natural hand interaction for AR applications. In Proceedings of the IEEE 2008 23rd International Conference Image and Vision Computing, Christchurch, New Zealand, 26–28 November 2008; pp. 1–6. [Google Scholar] [CrossRef] [Green Version]
- Lee, G.Y.; Hong, J.Y.; Hwang, S.; Moon, S.; Kang, H.; Jeon, S.; Kim, H.; Jeong, J.H.; Lee, B. Metasurface eyepiece for augmented reality. Nat. Commun. 2018, 9, 1–10. [Google Scholar] [CrossRef] [PubMed] [Green Version]
- Jerald, J. The VR Book: Human-Centered Design for Virtual Reality; Morgan & Claypool: San Rafael, CA, USA, 2015; p. 637. [Google Scholar]
- Speicher, M.; Hall, B.D.; Nebeling, M. What is mixed reality? In Proceedings of the 2019 CHI Conference on Human Factors in Computing Systems, Glasgow, UK, 4–9 May 2019; Association for Computing Machinery: New York, NY, USA; pp. 1–15. [Google Scholar] [CrossRef]
- Caroux, L.; Isbister, K.; Le Bigot, L.; Vibert, N. Player–video game interaction: A systematic review of current concepts. Comput. Hum. Behav. 2015, 48, 366–381. [Google Scholar] [CrossRef] [Green Version]
- Pan, Z.; Cheok, A.D.; Yang, H.; Zhu, J.; Shi, J. Virtual reality and mixed reality for virtual learning environments. Comput. Graph. 2006, 30, 20–28. [Google Scholar] [CrossRef]
- Watkins, C.J.; Dayan, P. Q-learning. Mach. Learn. 1992, 8, 279–292. [Google Scholar] [CrossRef]
- Riedmiller, M.; Merke, A.; Meier, D.; Hoffmann, A.; Sinner, A.; Thate, O.; Ehrmann, R. Karlsruhe brainstormers-a reinforcement learning approach to robotic soccer. In Robot Soccer World Cup; Springer: Berlin/Heidelberg, Germany, 2000; pp. 367–372. [Google Scholar] [CrossRef]
- Rumbaugh, J.; Jacobson, I.; Booch, G. The Unified Modeling Language; Reference Manual; Object Management Group: Needham, MA, USA, 1999. [Google Scholar]
- Paternò, F. ConcurTaskTrees: An engineered notation for task models. In The Handbook of Task Analysis for Human-Computer Interaction; CRC Press: Mahwah, NJ, USA, 2004; pp. 483–503. [Google Scholar]
- Zhu, M.; Wang, A.I. Model-driven game development: A literature review. ACM Comput. Surv. (CSUR) 2019, 52, 1–32. [Google Scholar] [CrossRef] [Green Version]
- Moreno-Ger, P.; Martínez-Ortiz, I.; Sierra, J.L.; Manjón, B.F. Language-driven development of videogames: The <e-Game> experience. In International Conference on Entertainment Computing; Springer: Berlin, Germany, 2006; pp. 153–164. [Google Scholar] [CrossRef] [Green Version]
- Turki, S.; Soriano, T.; Sghaier, A. An MDA application for a virtual reality environment. In Proceedings of the 2004 IEEE International Conference on Industrial Technology, Hammamet, Tunisia, 8–10 December 2004; Volume 2, pp. 807–812. [Google Scholar] [CrossRef]
- Duval, T.; Blouin, A.; Jézéquel, J.M. When Model Driven Engineering meets virtual reality: Feedback from application to the Collaviz framework. In Proceedings of the 2014 IEEE 7th Workshop on Software Engineering and Architectures for Realtime Interactive Systems (SEARIS), Minneapolis, MN, USA, 30 March 2014; pp. 27–34. [Google Scholar] [CrossRef] [Green Version]
- Núñez-Valdez, E.R.; García-Díaz, V.; Lovelle, J.M.C.; Achaerandio, Y.S.; González-Crespo, R. A model-driven approach to generate and deploy videogames on multiple platforms. J. Ambient Intell. Humaniz. Comput. 2017, 8, 435–447. [Google Scholar] [CrossRef]
- Fernandez, A.; Montero, E.; Insfran, E.; Abrahão, S.; Carsí, J.Á. Early Usability Evaluation in Model-Driven Video Game Development. In Proceedings of the International Conference on Software Engineering Research and Practice (SERP), The Steering Committee of the World Congress in Computer Science, Computer Engineering and Applied Computing (WorldComp), Las Vegas, NV, USA, 16–19 July 2012; p. 1. [Google Scholar]
- Valdez, E.R.N.; Martínez, Ó.S.; Bustelo, B.C.P.G.; Lovelle, J.M.C.; Hernandez, G.I. Gade4all: Developing multi-platform videogames based on domain specific languages and model driven engineering. IJIMAI 2013, 2, 33–42. [Google Scholar] [CrossRef]
- Abrahão, S.; Insfran, E.; Carsí, J.Á.; Fernandez, A. Early usability in model-driven game development. In International Conference on Product-Focused Software Process Improvement; Springer: Berlin, Germany, 2016; pp. 713–722. [Google Scholar] [CrossRef]
- Bian, D.; Wade, J.W.; Swanson, A.; Warren, Z.; Sarkar, N. Physiology-based Affect Recognition during Driving in Virtual Environment for Autism Intervention. In International Conference on Physiological Computing Systems; SCITEPRESS: Angers, France, 2015; pp. 137–145. [Google Scholar] [CrossRef]
- Bian, D.; Wade, J.; Warren, Z.; Sarkar, N. Online engagement detection and task adaptation in a virtual reality based driving simulator for autism intervention. In International Conference on Universal Access in Human-Computer Interaction; Springer: Berlin, Germany, 2016; pp. 538–547. [Google Scholar] [CrossRef]
- Cowley, B.U. Player Profiling and Modelling in Computer and Video Games. Ph.D. Thesis, University of Ulster, Coleraine, UK, 2009. [Google Scholar]
- Finneran, C.M.; Zhang, P. A person–artefact–task (PAT) model of flow antecedents in computer-mediated environments. Int. J. Hum.-Comput. Stud. 2003, 59, 475–496. [Google Scholar] [CrossRef]
- Amico, S. ETNA: A Virtual Reality Game with Affective Dynamic Difficulty Adjustment Based on Skin Conductance. Ph.D. Thesis, University of Illinois, Champaign, IL, USA, 2018. Available online: https://hdl.handle.net/10027/22997 (accessed on 1 November 2019).
- Gabana, D.; Tokarchuk, L.; Hannon, E.; Gunes, H. Effects of valence and arousal on working memory performance in virtual reality gaming. In Proceedings of the IEEE 2017 Seventh International Conference on Affective Computing and Intelligent Interaction (ACII), San Antonio, TX, USA, 23–26 October 2017; pp. 36–41. [Google Scholar] [CrossRef]
- Weyers, B.; Bowen, J.; Dix, A.; Palanque, P. The Handbook of Formal Methods in Human-Computer Interaction; Springer: Berlin, Germany, 2017. [Google Scholar] [CrossRef]
- Lightbown, D. Designing the User Experience of Game Development Tools; CRC Press: Boca Raton, FL, USA, 2015. [Google Scholar]
- MacKenzie, I.S. Human-Computer Interaction: An Empirical Research Perspective; Newnes: Waltham, MA, USA, 2012. [Google Scholar]
- Lewis, J.R. IBM computer usability satisfaction questionnaires: Psychometric evaluation and instructions for use. Int. J. Hum.-Comput. Interact. 1995, 7, 57–78. [Google Scholar] [CrossRef] [Green Version]
- Fowler, M. An Introduction to Systems Analysis Techniques and UML Distilled: A Brief Guide to the Standard Object Modeling Language; Addison-Wesley Professional: Boston, MA, USA, 2004. [Google Scholar]
- Atanasova, M.; Malinova, A. Transforming Concur Task Trees Model into an Abstract User Interface. In Proceedings of the CBU International Conference Proceedings, Prague, Czech Republic, 22–24 March 2017; Volume 5, pp. 1036–1041. [Google Scholar] [CrossRef] [Green Version]
- Engine, U. Unity Real-Time Development Platform | 3D, 2D VR & AR Engine. 2020. Available online: https://unity.com/ (accessed on 1 November 2019).
- Learn, U. Karting Microgame. 2020. Available online: https://learn.unity.com/project/karting-template (accessed on 1 November 2019).
- Schwaber, K.; Beedle, M. Agile Software Development with Scrum; Prentice Hall: Upper Saddle River, NJ, USA, 2002; Volume 1. [Google Scholar]
- Miller, J.; Mukerji, J. MDA Guide Version 1.0.1. 2003. Available online: https://ci.nii.ac.jp/naid/10016795137/ (accessed on 1 November 2019).
Figure 1.
The annual growth rate of the total video game market. Figure by Wijman [12].
Figure 1.
The annual growth rate of the total video game market. Figure by Wijman [12].

Figure 2.
Aspects (gray) of player–video game interaction and their respective concepts (white), by Caroux et al. [29].
Figure 2.
Aspects (gray) of player–video game interaction and their respective concepts (white), by Caroux et al. [29].

Figure 3.
RL scheme. The agent takes an action () from a set of tasks within an environment and this, in turn, changes from one state of the environment to another.
Figure 3.
RL scheme. The agent takes an action () from a set of tasks within an environment and this, in turn, changes from one state of the environment to another.

Figure 4.
Model-Driven Architecture (MDA) scheme.

Figure 5.
Model-driven approach of virtual interactive environments for enhanced user experience.

Figure 6.
Analysis phase of proposed model.

Figure 7.
Design phase of proposed model.

Figure 8.
Elements of the user profile acquisition stage of the design phase.

Figure 9.
Elements of the interaction stage of the design phase.

Figure 10.
Implementation phase of proposed model.

Figure 11.
Tracks proposed for the virtual environment, each of the tracks incorporates various static and dynamic elements.
Figure 11.
Tracks proposed for the virtual environment, each of the tracks incorporates various static and dynamic elements.

Figure 12.
The virtual environment adapts to the user’s preferences by accessing the desired parameters at the user preference acquisition stage.
Figure 12.
The virtual environment adapts to the user’s preferences by accessing the desired parameters at the user preference acquisition stage.

Figure 13.
Related elements in the user profile acquisition stage.

Figure 14.
Scene diagram of the virtual environment user interface.

Figure 15.
(a) Setting user interface. (b) Scene of user interface.

Figure 16.
User simulation state transition. User 1 with a learning rate of 0.4. User 2 with a learning rate of 0.6. User 3 with a learning rate of 0.8.
Figure 16.
User simulation state transition. User 1 with a learning rate of 0.4. User 2 with a learning rate of 0.6. User 3 with a learning rate of 0.8.

Figure 17.
Q-matrix of each simulation of 3 different values of (0.4, 0.6, 0.8). The values of the Q-matrix correspond to the maximum rewards obtained from switching from state to state .
Figure 17.
Q-matrix of each simulation of 3 different values of (0.4, 0.6, 0.8). The values of the Q-matrix correspond to the maximum rewards obtained from switching from state to state .


Table 1.
Description of interactive elements related to the virtual environment.
| Item | Description | Image |
|---|---|---|
| Coin | They appear on the track and when the cart collides with it, it makes a sound and the coin disappears when it is collected. |  |
| Kart | User-controlled car that can move in all possible directions, jump, crash, and skid. |  |
| Gummy Bear | Obstacle on the track, it appears randomly on the track according to the user’s preferences. |  |
| Lollipop | Obstacle on the track, appears randomly on the track according to the user’s preferences. |  |
| Cookie | Obstacle on the track, appears randomly on the track according to the user’s preferences. |  |
| Licorice | Obstacle on the track, appears randomly on the track according to the user’s preferences. |  |
| Road edge | Obstacle on the track, this is part of the tracks so that the kart element uses it as a jump or barrier to avoid advancing. |  |
| Speed pad | It is placed on the track and increases the speed of the kart when passing over it, the effect lasts 1 s. |  |
Table 2.
Customized parameters of the virtual environment. Each variable has 3 different options to select from a total of 24 combinations.
Table 2.
Customized parameters of the virtual environment. Each variable has 3 different options to select from a total of 24 combinations.
| Parameter | Mode | Description |
|---|---|---|
| Speed | S1 | Speed is set at 10 km/h. |
| S2 | The speed is set at 15 km/h. | |
| S3 | The speed is set at 20 km/h. | |
| Music | M1 | Song: Tusa by Karol G and Nicki Minaj |
| M2 | Canción: Sex on Fire de Kings of Leon | |
| M3 | Song: You’ll Be Under My Wheels by The Prodigy | |
| Obstacles | O1 | Less than 10 obstacles on the track |
| O2 | Between 10 and 20 obstacles on the track | |
| O3 | Between 20 and 30 obstacles on the track |
Table 3.
Mapping of the user’s preference selection to the video game states/tracks: speed, music, and the number of obstacles. The parameters are selected at the user profile acquisition stage and are defined in three values: least preferred, neutral preferred, and most preferred.
Table 3.
Mapping of the user’s preference selection to the video game states/tracks: speed, music, and the number of obstacles. The parameters are selected at the user profile acquisition stage and are defined in three values: least preferred, neutral preferred, and most preferred.
| State | Track | Parameters | ||
|---|---|---|---|---|
| Speed | Music | Number of Obstacles | ||
| 0 | least preferred | least preferred | least preferred | |
| 1 | least preferred | neutral preferred | least preferred | |
| 2 | least preferred | neutral preferred | neutral preferred | |
| 3 | neutral preferred | neutral preferred | neutral preferred | |
| 4 | most preferred | neutral preferred | neutral preferred | |
| 5 | most preferred | most preferred | neutral preferred | |
| 6 | most preferred | most preferred | most preferred | |
Table 4.
Relationship of simulations with 3 different types of user preferences.
| Simulation | State | Parameters | ||
|---|---|---|---|---|
| Speed | Music | Number of Obstacles | ||
| 1 | least preferred (S2) | least preferred (M1) | least preferred (O2) | |
| least preferred (S2) | neutral preferred (M2) | least preferred (O2) | ||
| least preferred (S2) | neutral preferred (M2) | neutral preferred (O1) | ||
| neutral preferred (S3) | neutral preferred (M2) | neutral preferred (O1) | ||
| most preferred (S1) | neutral preferred (M2) | neutral preferred (O1) | ||
| most preferred (S1) | most preferred (M3) | neutral preferred (O1) | ||
| most preferred (S1) | most preferred (M3) | most preferred (O3) | ||
| 2 | least preferred (S1) | least preferred (M1) | least preferred (O1) | |
| least preferred (S1) | neutral preferred (M3) | least preferred (O2) | ||
| least preferred (S1) | neutral preferred (M3) | neutral preferred (O2) | ||
| neutral preferred (S2) | neutral preferred (M3) | neutral preferred (O2) | ||
| most preferred (S3) | neutral preferred (M3) | neutral preferred (O2) | ||
| most preferred (S3) | most preferred (M1) | neutral preferred (O2) | ||
| most preferred (S3) | most preferred (M1) | most preferred (O3) | ||
| 3 | least preferred (S3) | least preferred (M2) | least preferred (O3) | |
| least preferred (S3) | neutral preferred (M1) | least preferred (O3) | ||
| least preferred (S3) | neutral preferred (M1) | neutral preferred (O3) | ||
| neutral preferred (S2) | neutral preferred (M1) | neutral preferred (O3) | ||
| most preferred (S1) | neutral preferred (M1) | neutral preferred (O3) | ||
| most preferred (S1) | most preferred (M3) | neutral preferred (O3) | ||
| most preferred (S1) | most preferred (M3) | most preferred (O1) | ||
Corresponding satisfaction states: , extremely unlikable; , unlikable; , more or less unlikable; , neutral; , more or less likable; , likable; extremely likable.
Table 5.
Q-learning metrics from three simulations of the algorithm. The algorithm is tested under three different learning rates (). The final average reward, cumulative reward, and optimal policy are presented.
Table 5.
Q-learning metrics from three simulations of the algorithm. The algorithm is tested under three different learning rates (). The final average reward, cumulative reward, and optimal policy are presented.
| Test | Final Average Reward | Cumulative Reward | Optimal Policy from | |
|---|---|---|---|---|
| Simulation 1 | 0.4 | 14.04 | 28 × | |
| 0.6 | 21.08 | 42 × | ||
| 0.8 | 42.20 | 84 × | ||
| Simulation 2 | 0.4 | 14.03 | 28 × | |
| 0.6 | 21.06 | 42 × | ||
| 0.8 | 42.21 | 84 × | ||
| Simulation 3 | 0.4 | 14.04 | 28 × | |
| 0.6 | 21.04 | 42 × | ||
| 0.8 | 42.18 | 84 × |
Publisher’s Note: MDPI stays neutral with regard to jurisdictional claims in published maps and institutional affiliations. |
© 2021 by the authors. Licensee MDPI, Basel, Switzerland. This article is an open access article distributed under the terms and conditions of the Creative Commons Attribution (CC BY) license (http://creativecommons.org/licenses/by/4.0/).
Share and Cite
MDPI and ACS Style
Cardona-Reyes, H.; Muñoz-Arteaga, J.; Mitre-Ortiz, A.; Villalba-Condori, K.O. Model-Driven Approach of Virtual Interactive Environments for Enhanced User Experience. Appl. Sci. 2021, 11, 2804. https://doi.org/10.3390/app11062804
AMA Style
Cardona-Reyes H, Muñoz-Arteaga J, Mitre-Ortiz A, Villalba-Condori KO. Model-Driven Approach of Virtual Interactive Environments for Enhanced User Experience. Applied Sciences. 2021; 11(6):2804. https://doi.org/10.3390/app11062804
Chicago/Turabian StyleCardona-Reyes, Héctor, Jaime Muñoz-Arteaga, Andres Mitre-Ortiz, and Klinge Orlando Villalba-Condori. 2021. "Model-Driven Approach of Virtual Interactive Environments for Enhanced User Experience" Applied Sciences 11, no. 6: 2804. https://doi.org/10.3390/app11062804
Note that from the first issue of 2016, this journal uses article numbers instead of page numbers. See further details here.