
Intestinal Microbiota in Children with Anemia in Southern Peru through Next-Generation Sequencing Technology
 , and
, and 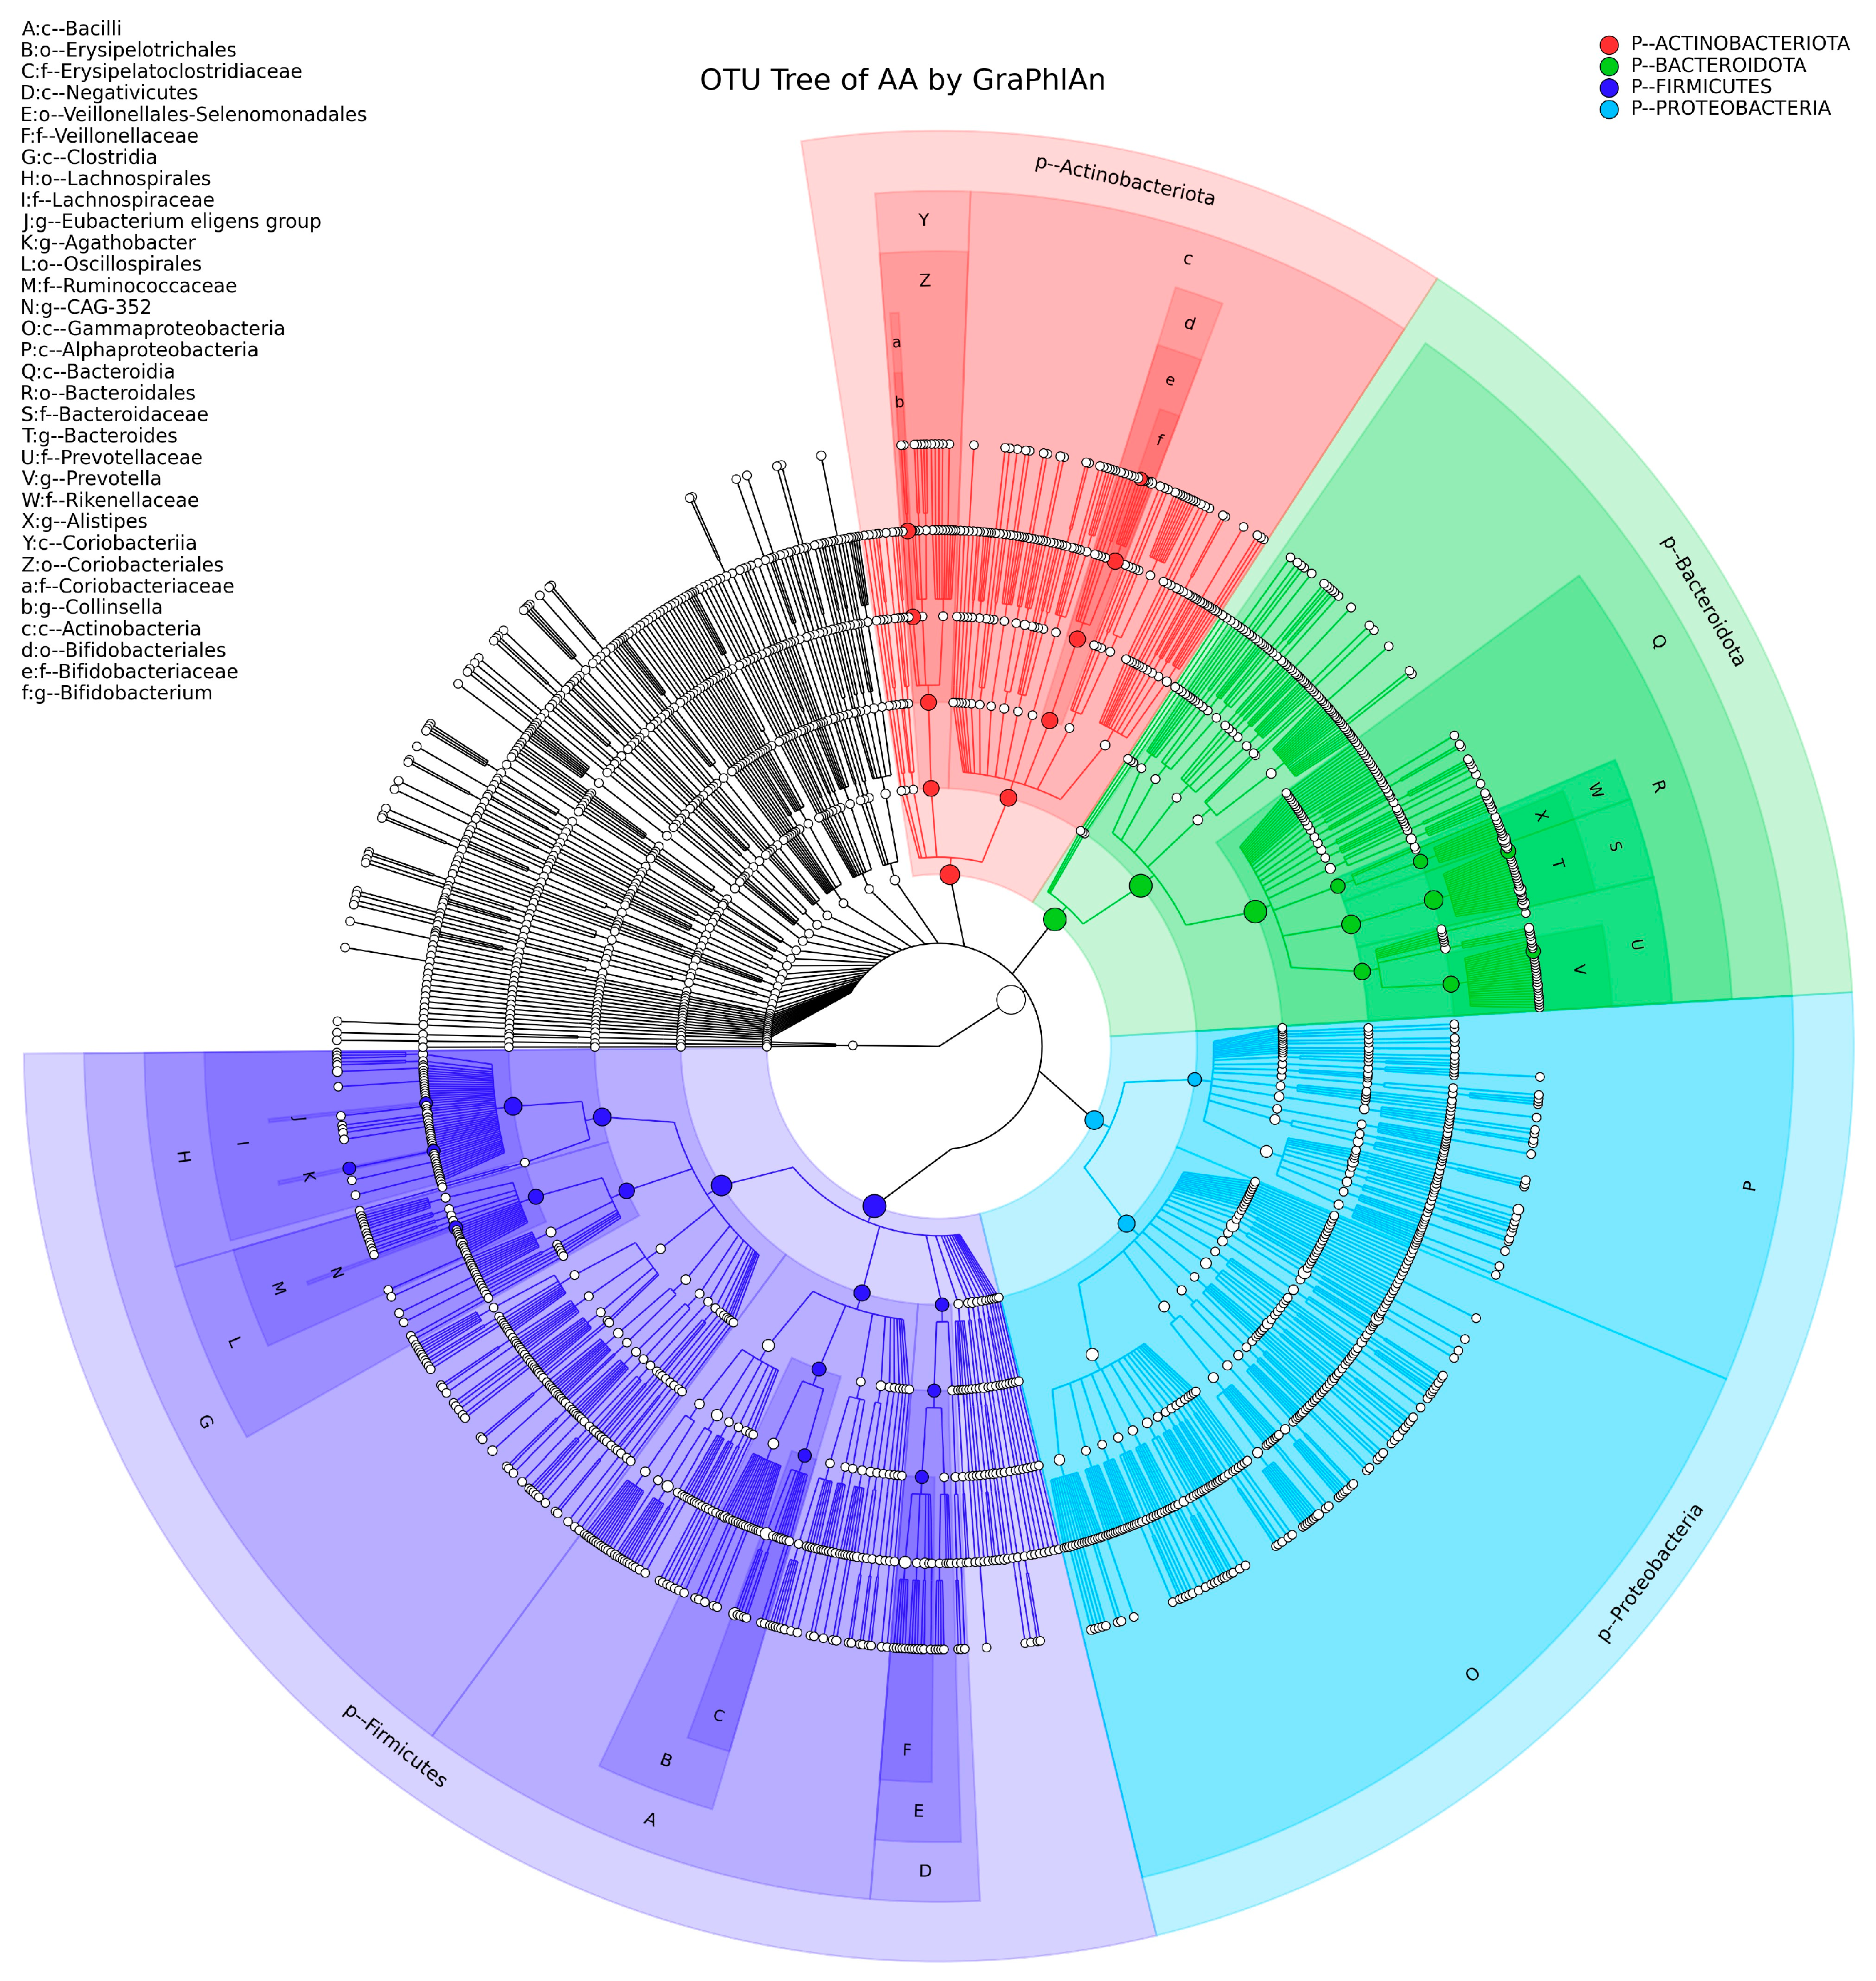
Abstract
:1. Introduction
2. Materials and Methods
2.1. Microbial DNA Extraction
2.2. Sequencing of the V3-V4 Region of the 16S rRNA Gene
2.3. Bioinformatic Analysis
2.4. Statistical Analyses
3. Results
3.1. Predominant Phyla and Genera Identified
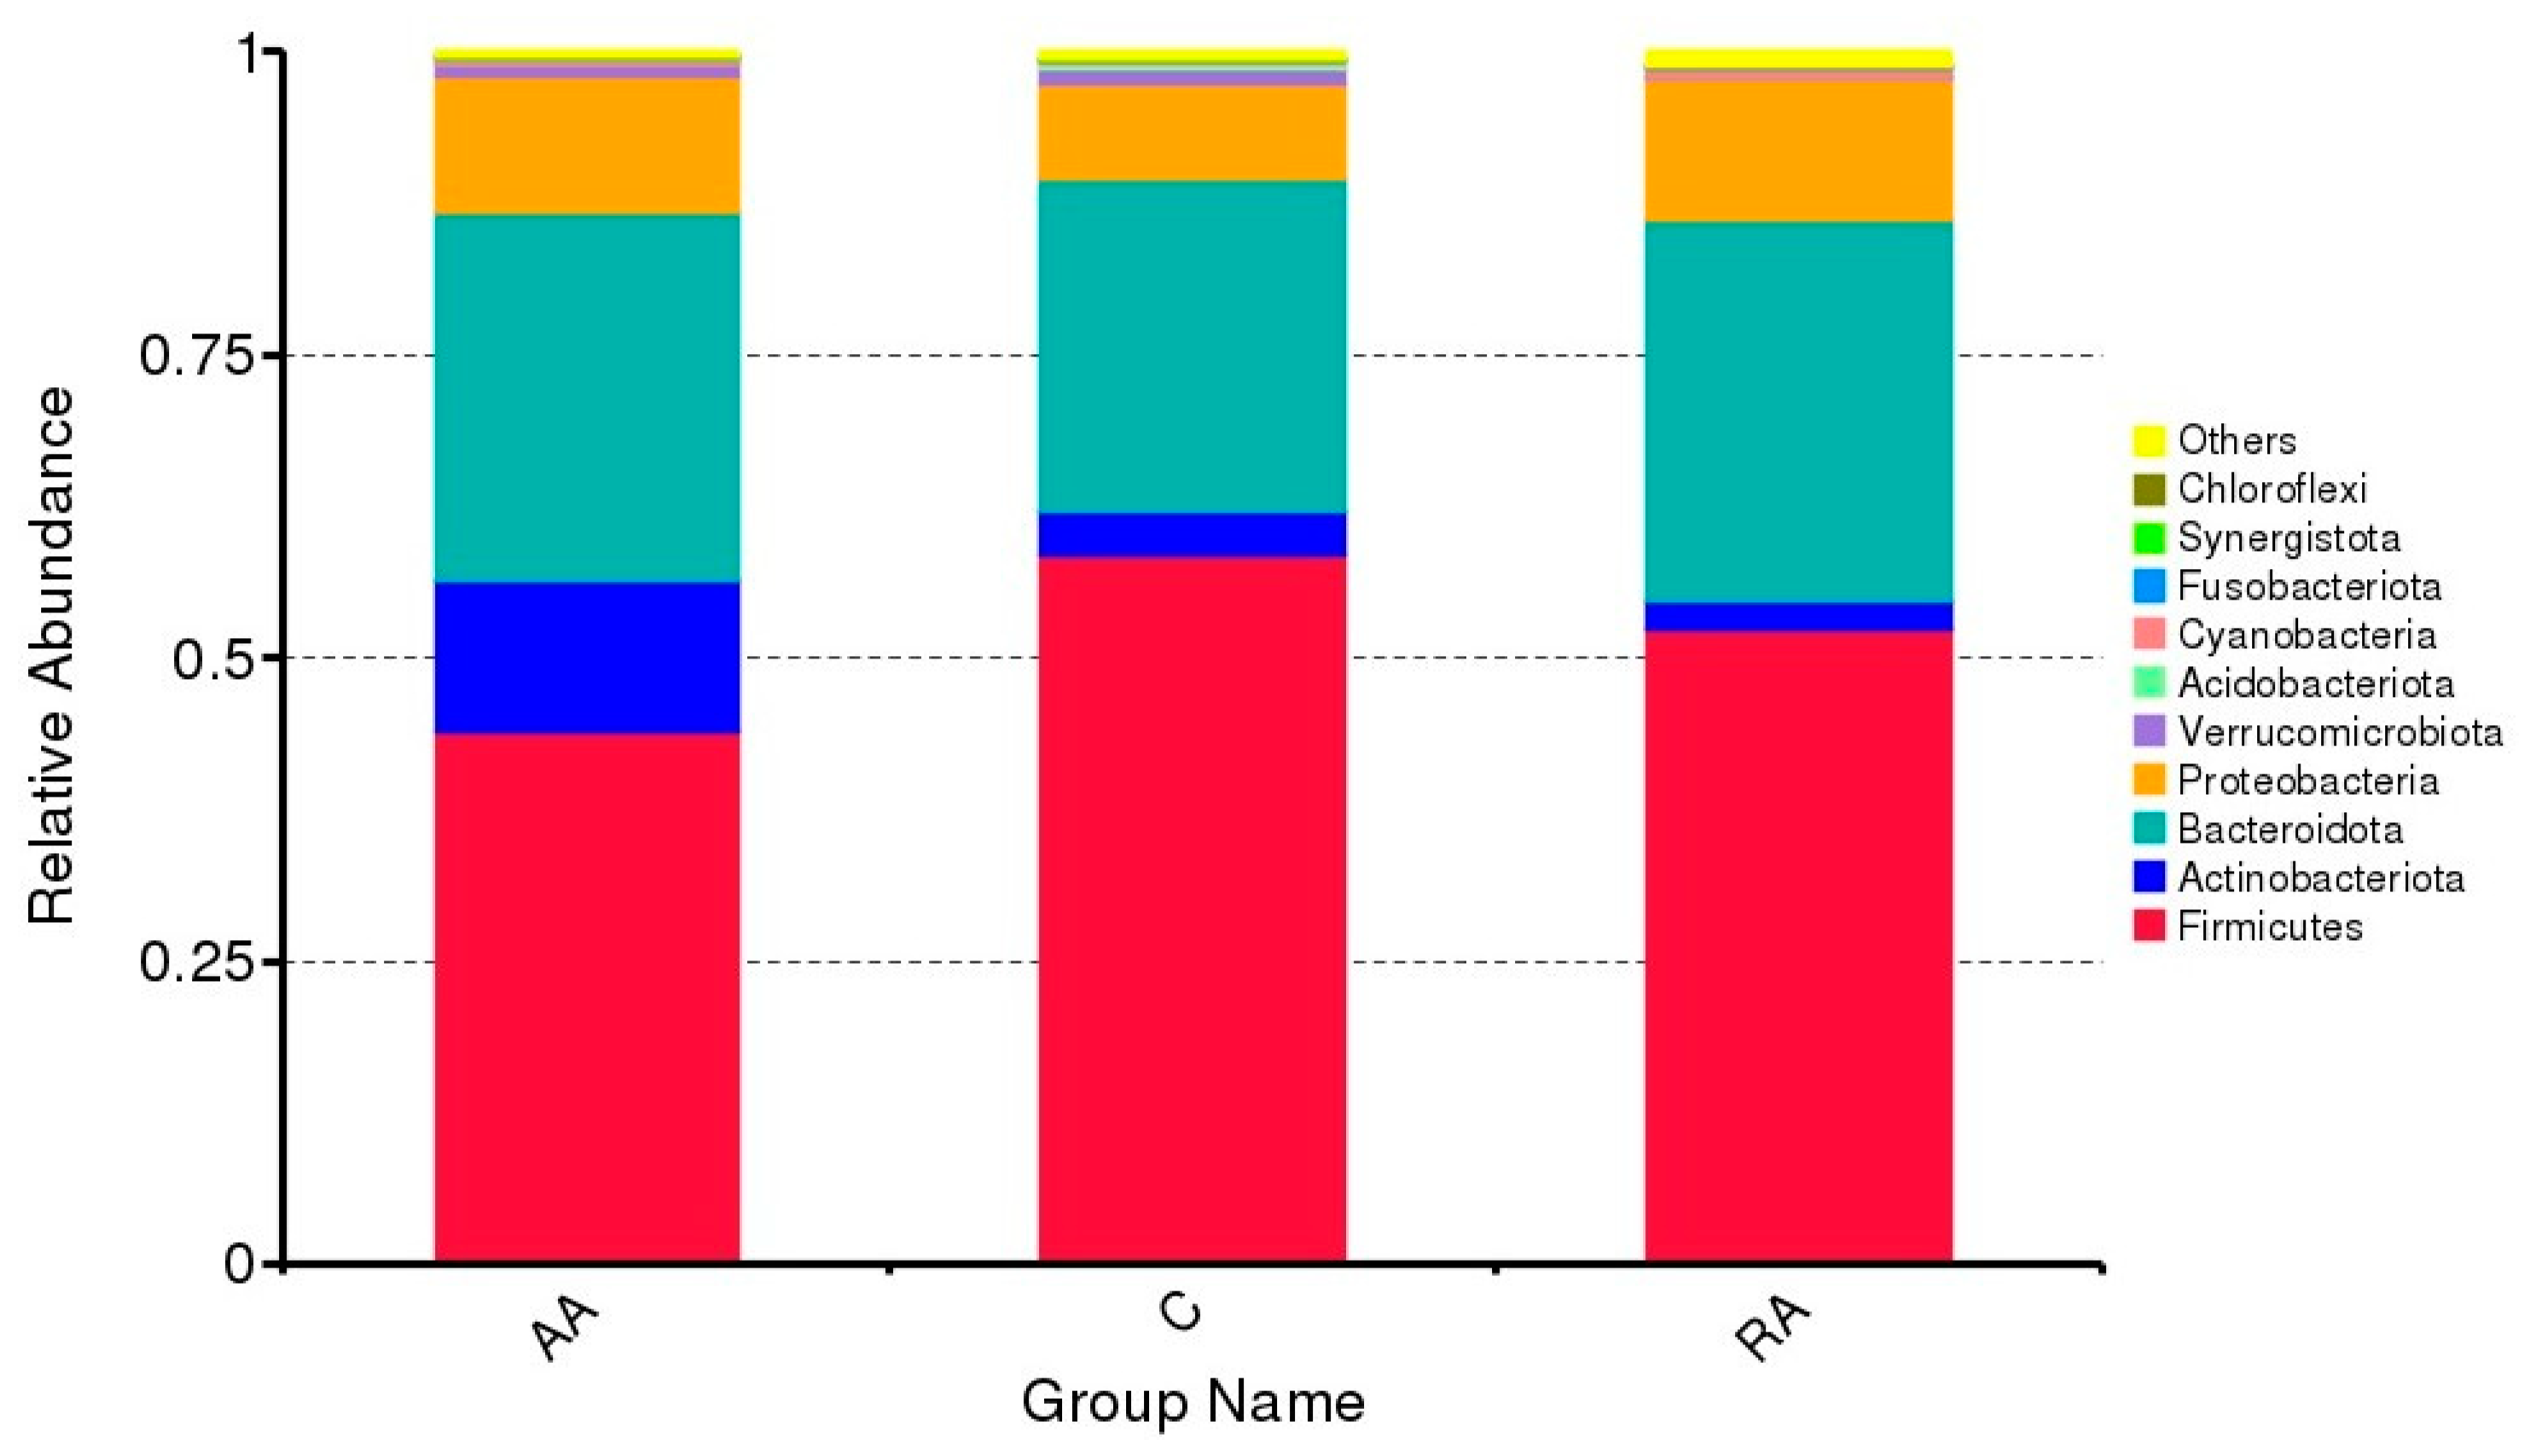
3.2. Relative Abundance of the Main Phyla
3.3. Shared and Unique OTUs
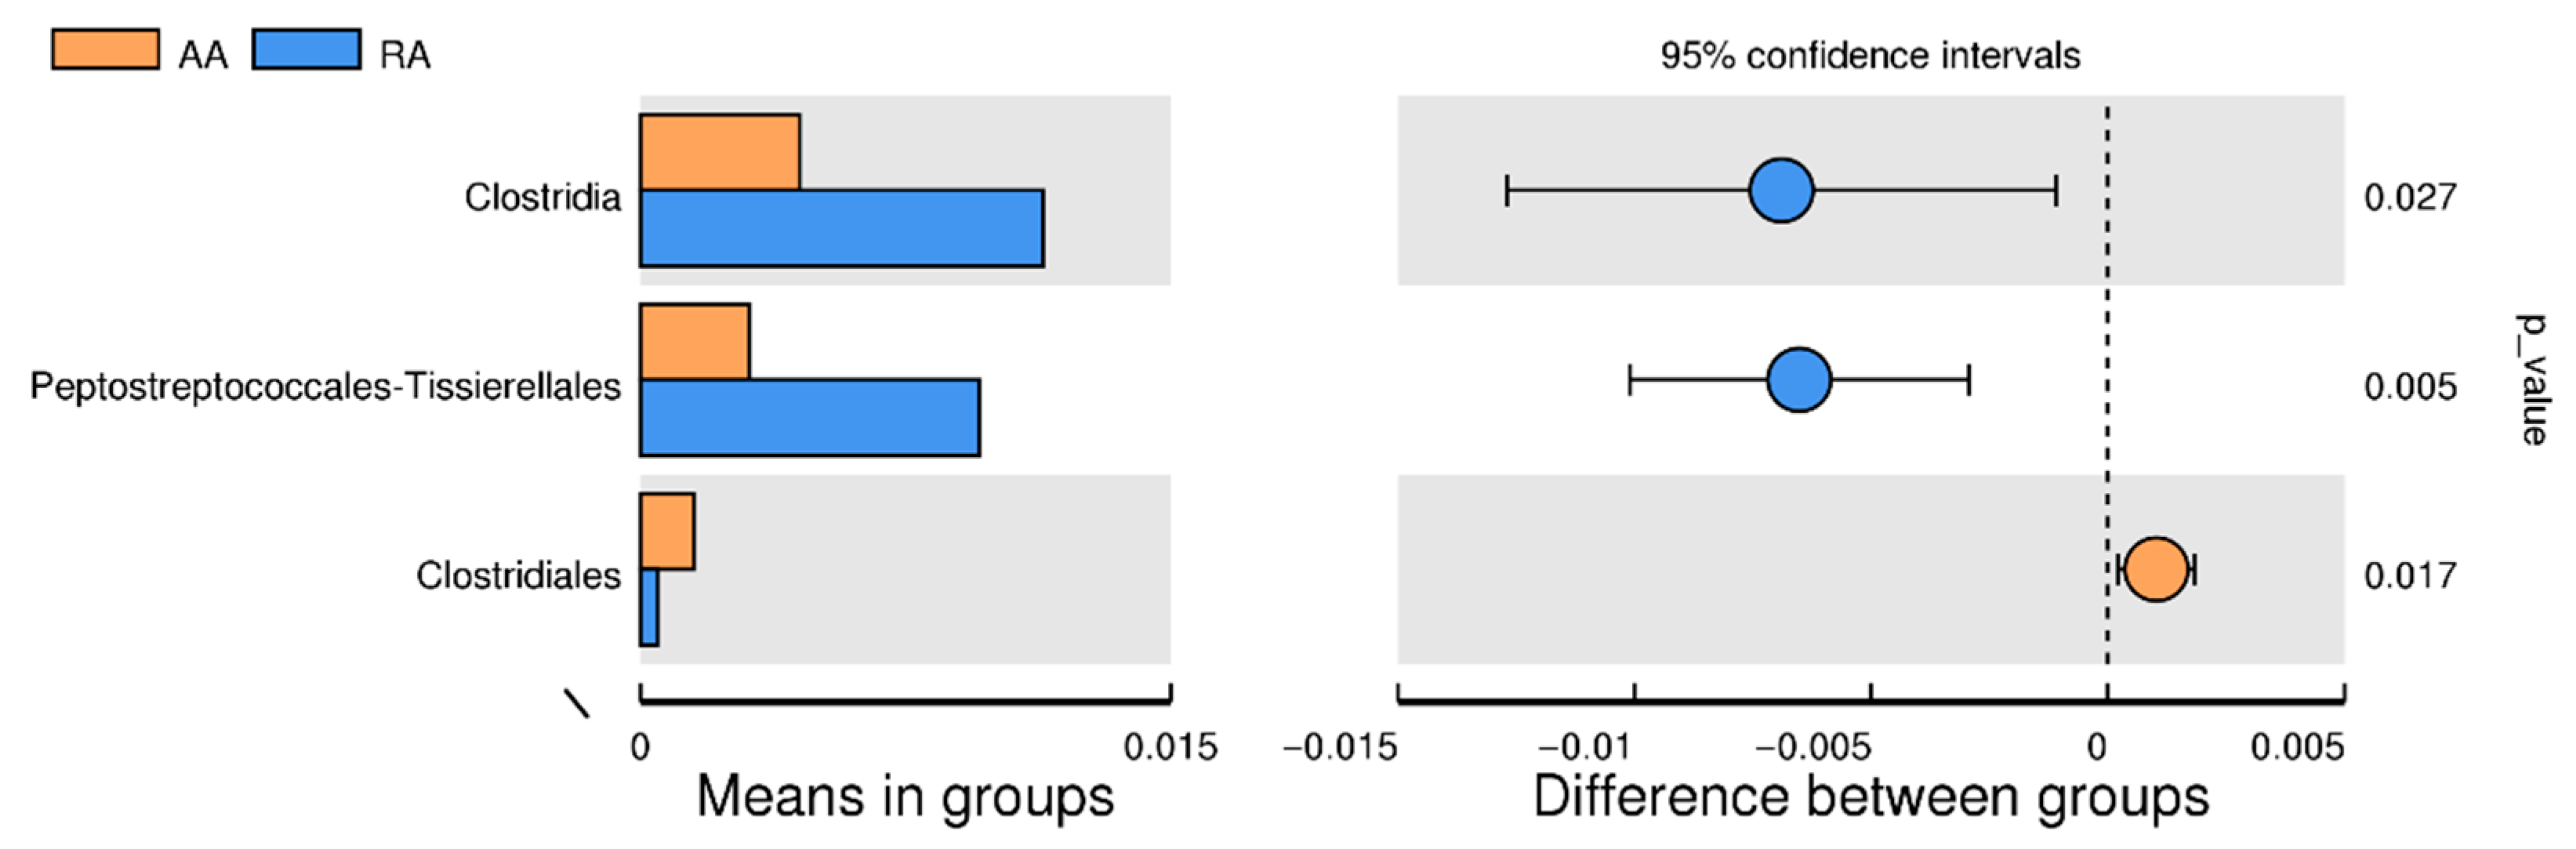
3.4. Significant Difference between AA and RA Groups
3.5. Validity of the Sequencing Data: Rarefaction Curve
3.6. Alpha Diversity of the Gut Microbiota
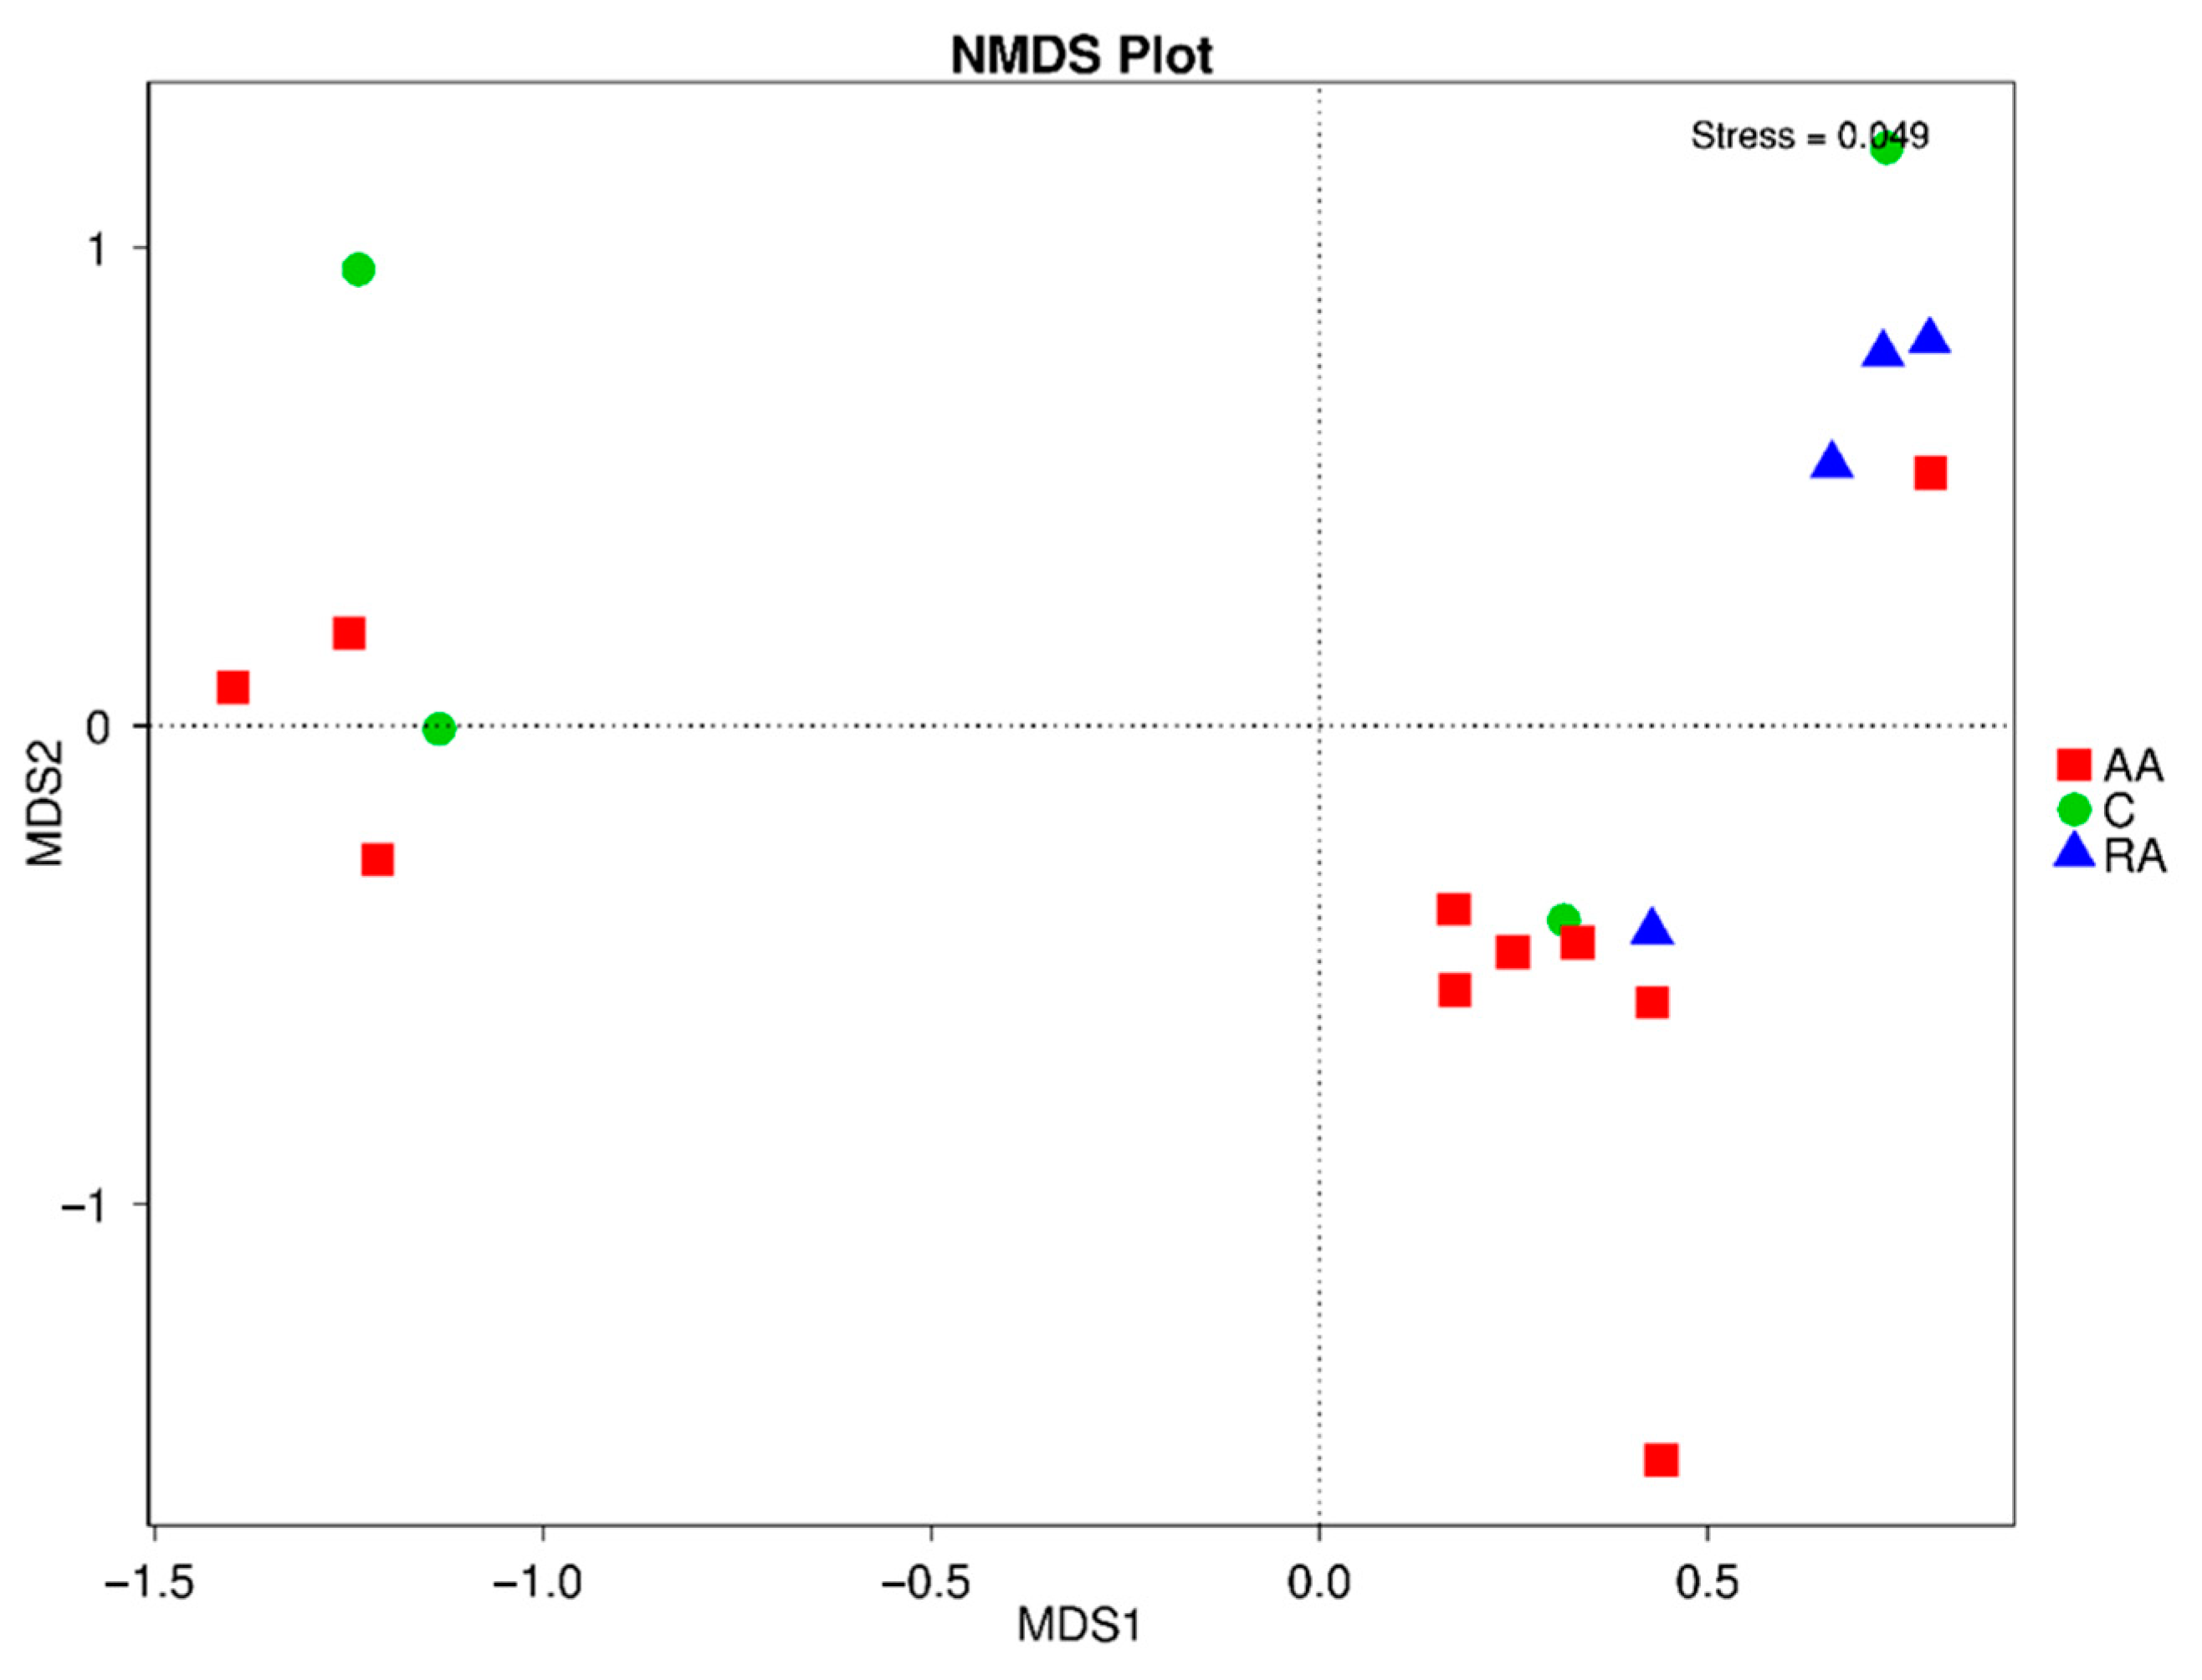
3.7. Beta Diversity of the Gut Microbiota
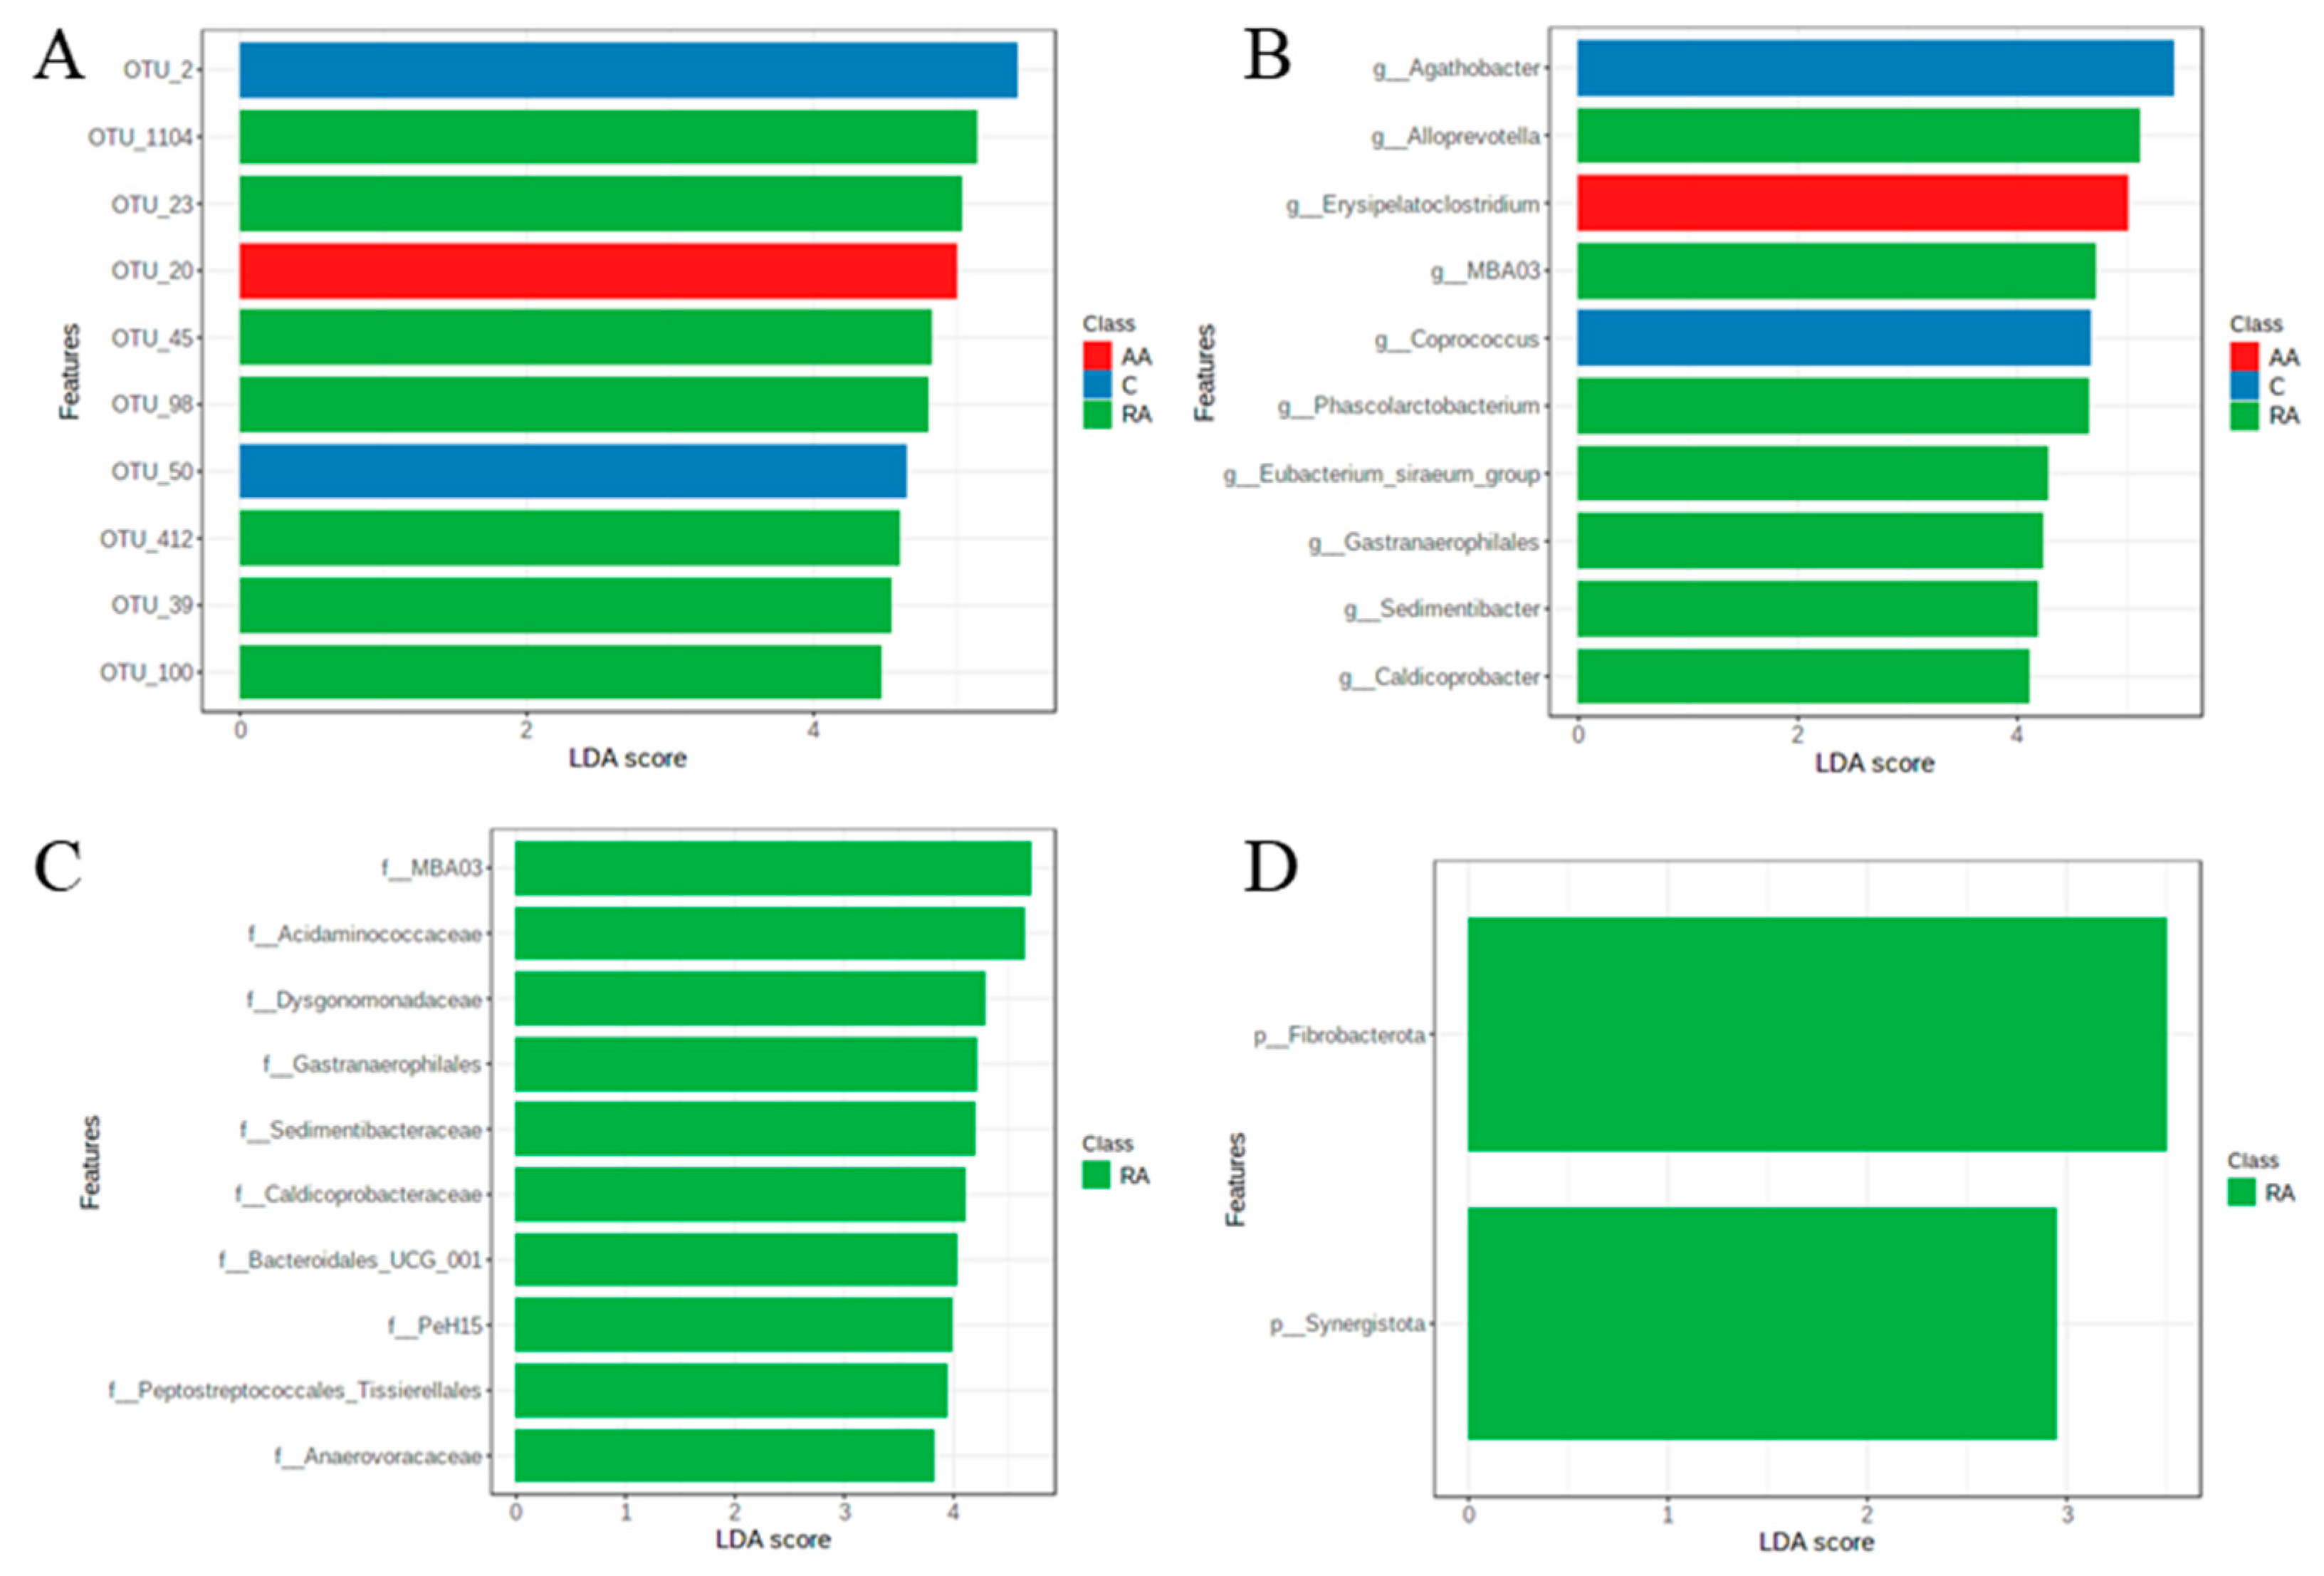
3.8. LEfSe Test for Biomarkers
4. Discussion
Supplementary Materials
Author Contributions
Funding
Institutional Review Board Statement
Informed Consent Statement
Data Availability Statement
Acknowledgments
Conflicts of Interest
References
- Camaschella, C. New insights into iron deficiency and iron deficiency anemia. Blood Rev. 2017, 31, 225–233. [Google Scholar] [CrossRef] [PubMed]
- Stelle, I.; Kalea, A.Z.; Pereira, D.I. Iron deficiency anaemia: Experiences and challenges. Proc. Nutr. Soc. 2019, 78, 19–26. [Google Scholar] [CrossRef] [PubMed] [Green Version]
- Arrieta, M.C.; Stiemsma, L.T.; Amenyogbe, N.; Brown, E.M.; Finlay, B. The intestinal microbiome in early life: Health and disease. Front. Immunol. 2014, 5, 427. [Google Scholar] [CrossRef] [PubMed] [Green Version]
- Meropol, S.B.; Edwards, A. Development of the infant intestinal microbiome: A bird’s eye view of a complex process. Birth Defects Res. Part C Embryo Today Rev. 2015, 105, 228–239. [Google Scholar] [CrossRef] [Green Version]
- Zmora, N.; Suez, J.; Elinav, E. You are what you eat: Diet, health and the gut microbiota. Nat. Rev. Gastroenterol. Hepatol. 2019, 16, 35–56. [Google Scholar] [CrossRef] [Green Version]
- Puga, A.M.; Samaniego-Vaesken MD, L.; Montero-Bravo, A.; Ruperto, M.; Partearroyo, T.; Varela-Moreiras, G. Iron Supplementation at the Crossroads of Nutrition and Gut Microbiota. State Art. Nutr. 2022, 14, 1926. [Google Scholar] [CrossRef]
- Lönnerdal, B. Excess iron intake as a factor in growth, infections, and development of infants and young children. Am. J. Clin. Nutr. 2017, 106 (Suppl. 6), 1681S–1687S. [Google Scholar] [CrossRef] [Green Version]
- Owolabi, A.J.; Senbanjo, I.O.; Oshikoya, K.A.; Boekhorst, J.; Eijlander, R.T.; Kortman, G.A.; Hageman, J.H.; Samuel, F.; Melse-Boonstra, A.; Schaafsma, A. Multi-nutrient fortified dairy-based drink reduces anaemia without observed adverse effects on gut microbiota in anaemic malnourished nigerian toddlers: A randomised dose–response study. Nutrients 2021, 13, 1566. [Google Scholar] [CrossRef]
- García Zanabria, J. Perú: Indicadores de Resultados de los Programas presupuestales 2014–2019. Inst. Nac. Estadística Inf. 2020, 53, 1–163. [Google Scholar]
- Chaudhary, N.; Sharma, A.K.; Agarwal, P.; Gupta, A.; Sharma, V.K. 16S classifier: A tool for fast and accurate taxonomic classification of 16S rRNA hypervariable regions in metagenomic datasets. PLoS ONE 2015, 10, e0116106. [Google Scholar] [CrossRef]
- Graspeuntner, S.; Loeper, N.; Künzel, S.; Baines, J.F.; Rupp, J. Selection of validated hypervariable regions is crucial in 16S-based microbiota studies of the female genital tract. Sci. Rep. 2018, 8, 9678. [Google Scholar] [CrossRef] [PubMed]
- Nicholson, J.K.; Holmes, E.; Kinross, J.; Burcelin, R.; Gibson, G.; Jia, W.; Pettersson, S. Host-gut microbiota metabolic interactions. Science 2012, 336, 1262–1267. [Google Scholar] [CrossRef] [PubMed] [Green Version]
- Zhao, J.; Zhang, X.; Liu, H.; Brown, M.A.; Qiao, S. Dietary protein and gut microbiota composition and function. Curr. Protein Pept. Sci. 2019, 20, 145–154. [Google Scholar] [CrossRef] [PubMed]
- Vogel, S.C.; Brito, N.H.; Callaghan, B.L. Early life stress and the development of the infant gut microbiota: Implications for mental health and neurocognitive development. Curr. Psychiatry Rep. 2020, 22, 61. [Google Scholar] [CrossRef] [PubMed]
- Spencer, S.P.; Fragiadakis, G.K.; Sonnenburg, J.L. Pursuing human-relevant gut microbiota-immune interactions. Immunity 2019, 51, 225–239. [Google Scholar] [CrossRef]
- Iddrisu, I.; Monteagudo-Mera, A.; Poveda, C.; Pyle, S.; Shahzad, M.; Andrews, S.; Walton, G.E. Malnutrition and gut microbiota in children. Nutrients 2021, 13, 2727. [Google Scholar] [CrossRef]
- Gomaa, E.Z. Human gut microbiota/microbiome in health and diseases: A review. Antonie Leeuwenhoek 2020, 113, 2019–2040. [Google Scholar] [CrossRef]
- Fouhy, F.; Watkins, C.; Hill, C.J.; O’Shea, C.A.; Nagle, B.; Dempsey, E.M.; O’Toole, P.W.; Ross, R.P.; Ryan, C.A.; Stanton, C. Perinatal factors affect the gut microbiota up to four years after birth. Nat. Commun. 2019, 10, 1517. [Google Scholar] [CrossRef] [Green Version]
- Jaeggi, T.; Kortman, G.A.; Moretti, D.; Chassard, C.; Holding, P.; Dostal, A.; Boekhorst, J.; Timmerman, H.M.; Swinkels, D.W.; Tjalsma, H.; et al. Iron fortification adversely affects the gut microbiome, increases pathogen abundance and induces intestinal inflammation in Kenyan infants. Gut 2015, 64, 731–742. [Google Scholar] [CrossRef]
- McClorry, S.; Zavaleta, N.; Llanos, A.; Casapía, M.; Lönnerdal, B.; Slupsky, C.M. Anemia in infancy is associated with alterations in systemic metabolism and microbial structure and function in a sex-specific manner: An observational study. Am. J. Clin. Nutr. 2018, 108, 1238–1248. [Google Scholar] [CrossRef] [Green Version]
- Ho, T.T.; Kumar, A.; Louis-Jacques, A.F.; Dishaw, L.J.; Yee, A.L.; Groer, M.W. The development of intestinal dysbiosis in anemic preterm infants. J. Perinatol. 2020, 40, 1066–1074. [Google Scholar] [CrossRef] [PubMed]
- Paganini, D.; Jaeggi, T.; Cercamondi, C.; Kujinga, P.; Moretti, D.; Zimmermann, M. Anemia and iron status are predictors of gut microbiome composition and metabolites in infants and children in rural Kenya. FASEB J. 2016, 30, 296–302. [Google Scholar]
- Muleviciene, A.; D’Amico, F.; Turroni, S.; Candela, M.; Jankauskiene, A. Iron deficiency anemia- related gut microbiota dysbiosis in infants and young children: A pilot study. Acta Microbiol. Immunol. Hung. 2018, 65, 551–564. [Google Scholar] [CrossRef] [PubMed] [Green Version]
- Huey, S.L.; Jiang, L.; Fedarko, M.W.; McDonald, D.; Martino, C.; Ali, F.; Russell, D.G.; Udipi, S.A.; Thorat, A.; Thakker, V.; et al. Nutrition and the gut microbiota in 10-to 18-month-old children living in urban slums of Mumbai, India. Msphere 2020, 5, e00731-20. [Google Scholar] [CrossRef] [PubMed]
- Salguero, M.V.; Al-Obaide, M.A.; Singh, R.; Siepmann, T.; Vasylyeva, T.L. Dysbiosis of Gram-negative gut microbiota and the associated serum lipopolysaccharide exacerbates inflammation in type 2 diabetic patients with chronic kidney disease. Exp. Ther. Med. 2019, 18, 3461–3469. [Google Scholar] [CrossRef] [Green Version]
- Said, H.S.; Suda, W.; Nakagome, S.; Chinen, H.; Oshima, K.; Kim, S.; Kimura, R.; Iraha, A.; Ishida, H.; Fujita, J.; et al. Dysbiosis of salivary microbiota in inflammatory bowel disease and its association with oral immunological biomarkers. DNA Res. 2014, 21, 15–25. [Google Scholar] [CrossRef] [Green Version]
- Liu, F.; Li, J.; Guan, Y.; Lou, Y.; Chen, H.; Xu, M.; Deng, D.; Chen, J.; Ni, B.; Zhao, L.; et al. Dysbiosis of the gut microbiome is associated with tumor biomarkers in lung cancer. Int. J. Biol. Sci. 2019, 15, 2381. [Google Scholar] [CrossRef]
- Sánchez-Quinto, A.; Cerqueda-García, D.; Falcón, L.I.; Gaona, O.; Martínez-Correa, S.; Nieto, J.; G-Santoyo, I. Gut microbiome in children from indigenous and urban communities in México: Different subsistence models, different microbiomes. Microorganisms 2020, 8, 1592. [Google Scholar] [CrossRef]
- Shen, Y.; Laue, H.E.; Shrubsole, M.J.; Wu, H.; Bloomquist, T.R.; Larouche, A.; Zhao, K.; Gao, F.; Boivin, A.; Prada, D.; et al. Associations of Childhood and Perinatal Blood Metals with Children’s Gut Microbiomes in a Canadian Gestation Cohort. Environ. Health Perspect. 2022, 130, 017007. [Google Scholar] [CrossRef]
- Berding, K.; Holscher, H.D.; Arthur, A.E.; Donovan, S.M. Fecal microbiome composition and stability in 4-to 8-year old children is associated with dietary patterns and nutrient intake. J. Nutr. Biochem. 2018, 56, 165–174. [Google Scholar] [CrossRef]
- Lopetuso, L.R.; Scaldaferri, F.; Petito, V.; Gasbarrini, A. Commensal Clostridia: Leading players in the maintenance of gut homeostasis. Gut Pathog. 2013, 5, 23. [Google Scholar] [CrossRef] [PubMed] [Green Version]
- Smith-Brown, P.; Morrison, M.; Krause, L.; Davies, P.S.W. Dairy and plant based food intakes are associated with altered faecal microbiota in 2 to 3 year old Australian children. Sci. Rep. 2016, 6, 32385. [Google Scholar] [CrossRef] [PubMed]
- Chen, G.; Peng, Y.; Huang, Y.; Xie, M.; Dai, Z.; Cai, H.; Dong, W.; Xu, W.; Xie, Z.; Chen, D.; et al. Fluoride Exposure Induced Bloom of Erysipelatoclostridium Ramosum Mediates the Exacerbation of Obesity in High-Fat-Diet Fed Mice. 2022. Available online: https://www.researchsquare.com/article/rs-1356629/latest.pdf (accessed on 3 July 2022).
- Woting, A.; Pfeiffer, N.; Loh, G.; Klaus, S.; Blaut, M. Clostridium ramosum promotes high-fat diet-induced obesity in gnotobiotic mouse models. MBio 2014, 5, e01530-14. [Google Scholar] [CrossRef] [PubMed] [Green Version]
- Liu, Y.; Hu, D.; Dai, C.; Wang, D.; Weihong, S. Characteristics of Intestinal Microbiota and Mother’s Reproductive Tract Flora in Children with Down Syndrome. 2021. Available online: https://www.researchsquare.com/article/rs-922120/latest.pdf (accessed on 25 July 2022).
- Liu, C.E.; Pan, Y.M.; Du, Z.L.; Wu, C.; Hong, X.Y.; Sun, Y.H.; Li, H.F.; Liu, J. Composition characteristics of the gut microbiota in infants and young children of under 6 years old between Beijing and Japan. Transl. Pediatrics 2021, 10, 790. [Google Scholar] [CrossRef]
- Vänni, P.; Tejesvi, M.V.; Ainonen, S.; Renko, M.; Korpela, K.; Salo, J.; Paalanne, N.; Tapiainen, T. Delivery mode and perinatal antibiotics influence the predicted metabolic pathways of the gut microbiome. Sci. Rep. 2021, 11, 17483. [Google Scholar] [CrossRef]
- Liu, M.; Ma, L.; Chen, Q.; Zhang, P.; Chen, C.; Jia, L.; Li, H. Fucoidan alleviates dyslipidemia and modulates gut microbiota in high-fat diet-induced mice. J. Funct. Foods 2018, 48, 220–227. [Google Scholar] [CrossRef]
- Tang, S.; Xin, Y.; Ma, Y.; Xu, X.; Zhao, S.; Cao, J. Screening of microbes associated with swine growth and fat deposition traits across the intestinal tract. Front. Microbiol. 2020, 11, 586776. [Google Scholar] [CrossRef]
- Gong, X.; Cai, Q.; Liu, X.; An, D.; Zhou, D.; Luo, R.; Peng, R.; Hong, Z. Gut flora and metabolism are altered in epilepsy and partially restored after ketogenic diets. Microb. Pathog. 2021, 155, 104899. [Google Scholar] [CrossRef]
- Nagao-Kitamoto, H.; Leslie, J.L.; Kitamoto, S.; Jin, C.; Thomsson, K.A.; Gillilland, M.G.; Kuffa, P.; Goto, Y.; Jenq, R.R.; Ishii, C.; et al. Interleukin-22-mediated host glycosylation prevents Clostridioides difficile infection by modulating the metabolic activity of the gut microbiota. Nat. Med. 2020, 26, 608–617. [Google Scholar] [CrossRef]
- Kociolek, L.K.; Burnham CA, D.; Nicholson, M.R.; Zackular, J.P. Clostridioides difficile infection in children: Research progress, pitfalls, and priorities. J. Pediatric Infect. Dis. Soc. 2021, 10 (Suppl. 3), S1–S2. [Google Scholar] [CrossRef]
- González-Sánchez, A.; Reyes-Lagos, J.J.; Peña-Castillo, M.A.; Nirmalkar, K.; García-Mena, J.; Pacheco-López, G. Vaginal Microbiota Is Stable and Mainly Dominated by Lactobacillus at Third Trimester of Pregnancy and Active Childbirth: A Longitudinal Study of Ten Mexican Women. Curr. Microbiol. 2022, 79, 230. [Google Scholar] [CrossRef] [PubMed]


Publisher’s Note: MDPI stays neutral with regard to jurisdictional claims in published maps and institutional affiliations. |
© 2022 by the authors. Licensee MDPI, Basel, Switzerland. This article is an open access article distributed under the terms and conditions of the Creative Commons Attribution (CC BY) license (https://creativecommons.org/licenses/by/4.0/).
Share and Cite
Díaz-Rodríguez, K.; Pacheco-Aranibar, J.; Manrique-Sam, C.; Ita-Balta, Y.; Carpio-Toia, A.M.d.; López-Casaperalta, P.; Chocano-Rosas, T.; Fernandez-F, F.; Villanueva-Salas, J.; Bernabe-Ortiz, J.C. Intestinal Microbiota in Children with Anemia in Southern Peru through Next-Generation Sequencing Technology. Children 2022, 9, 1615. https://doi.org/10.3390/children9111615
Díaz-Rodríguez K, Pacheco-Aranibar J, Manrique-Sam C, Ita-Balta Y, Carpio-Toia AMd, López-Casaperalta P, Chocano-Rosas T, Fernandez-F F, Villanueva-Salas J, Bernabe-Ortiz JC. Intestinal Microbiota in Children with Anemia in Southern Peru through Next-Generation Sequencing Technology. Children. 2022; 9(11):1615. https://doi.org/10.3390/children9111615
Chicago/Turabian StyleDíaz-Rodríguez, Karla, Jani Pacheco-Aranibar, Cecilia Manrique-Sam, Yuma Ita-Balta, Agueda Muñoz del Carpio-Toia, Patricia López-Casaperalta, Teresa Chocano-Rosas, Fernando Fernandez-F, Jose Villanueva-Salas, and Julio Cesar Bernabe-Ortiz. 2022. "Intestinal Microbiota in Children with Anemia in Southern Peru through Next-Generation Sequencing Technology" Children 9, no. 11: 1615. https://doi.org/10.3390/children9111615