Article

Site Selection for a Network of Weather Stations Using AHP and Near Analysis in a GIS Environment in Amazonas, NW Peru

by
Nilton B. Rojas Briceño
1,*,
Rolando Salas López
1,
Jhonsy O. Silva López
1,
Manuel Oliva-Cruz
1,
Darwin Gómez Fernández
1,
Renzo E. Terrones Murga
1,
Daniel Iliquín Trigoso
1,
Miguel Barrena Gurbillón
1 and
Elgar Barboza
1,2
1
Instituto de Investigación para el Desarrollo Sustentable de Ceja de Selva, Universidad Nacional Toribio Rodríguez de Mendoza de Amazonas, Chachapoyas 01001, Peru
2
Dirección de Desarrollo Tecnológico Agrario, Instituto Nacional de Innovación Agraria (INIA), Av. La Molina 1981, Lima 15024, Peru
*
Author to whom correspondence should be addressed.
Climate 2021, 9(12), 169; https://doi.org/10.3390/cli9120169
Submission received: 31 October 2021 / Revised: 23 November 2021 / Accepted: 25 November 2021 / Published: 28 November 2021

Abstract

:
Meteorological observations play a major role in land management; thus, it is vital to properly plan the monitoring network of weather stations (WS). This study, therefore, selected ‘highly suitable’ sites with the objective of replanning the WS network in Amazonas, NW Peru. A set of 11 selection criteria for WS sites were identified and mapped in a Geographic Information System, as well as their importance weights were determined using Analytic Hierarchy Process and experts. A map of the suitability of the territory for WS sites was constructed by weighted superimposition of the criteria maps. On this map, the suitability status of the 20 existing WS sites was then assessed and, if necessary, relocated. New ‘highly suitable’ sites were determined by the Near Analysis method using existing WS (some relocated). The territory suitability map for WS showed that 0.3% (108.55 km2) of Amazonas has ‘highly suitable’ characteristics to establish WS. This ‘highly suitable’ territory corresponds to 26,683 polygons (of ≥30 × 30 m each), from which 100 polygons were selected in 11 possible distributions of new WS networks in Amazonas, with different number and distance of new WS in each distribution. The implementation of this methodology will be a useful support tool for WS network planning.

1. Introduction

Meteorological observations are used for real-time weather analysis, severe weather forecasts and warnings, for weather-sensitive local operations (e.g., airfield flights or construction work at land and sea facilities), for hydrology and agricultural meteorology, and for meteorological and climatological research purposes [1,2,3]. However, previous studies around the world [4,5,6,7], including in Peru [8,9,10], warn that there is (i) lack of weather stations (WS) in certain important areas, (ii) a non-uniform spatial distribution of existing WS, and (iii) variable precision of measurements because current WS sites are often inadequate. Therefore, planning an adequate network of WS constitutes the basic and necessary infrastructure for land management [7]. Adequate distribution of WS increases the effectiveness of observations and provides more accurate analysis results [2,11]. In addition, it is essential to restructure the WS network and increase the number of WS in countries with a high frequency of natural disasters [2], such as Peru.
Peru is located in the intertropical zone of South America, on the Pacific Coast, and, unlike other equatorial countries, it does not have an exclusively tropical climate [12]. In 2020, the Servicio Nacional de Meteorología e Hidrología del Perú (SENAMHI) defined 38 climate types, 11 more than the previous map, and among other factors, the updated map included a greater number of WS [13]. Additionally, due to its geographical location, topography, land cover, and high, non-uniform rainfall, Peru suffers from a variety of natural disasters, including earthquakes, floods, landslides, frost, and forest fires [14,15]. In this regard, in the Amazonas region (NW Peru), the Universidad Nacional Toribio Rodríguez de Mendoza de Amazonas (UNTRM) operates a network of 12 automatic WS [16]. This network, as in other meteorological networks around the world [2,3], aims to support not only research needs (climate monitoring and analysis, weather and natural disaster forecasting capabilities, etc.) but also the needs of various communities in the production sector (agriculture, construction, leisure activities and tourism, etc.). Currently, UNTRM aims to expand its number of WS in suitable locations.
Determining the most suitable locations is, therefore, of utmost importance for the sustainability and success of the WS network [2,17]. The selection of locations for a WS involves various spatial analyses, including the distances between different land use zones, slopes, roads, populations, and proximity to natural hazard boundaries, such as landslide areas [2,3]. In this sense, geographic information systems (GIS), integrated with remote sensing (RS) data and multi-criteria analysis (MCA) techniques, is an important decision-support tool that is able to operate and analyze a wide range of spatial data and criteria [18]. GIS–RS–MCA has been used in the selection of suitable sites for hydro/agro-meteorological stations in Turkey [2], Greece [7], the Philippines [19,20], and Colombia [21]. Two important questions emerge from these studies. First, in Turkey [2], after MCA, a near analysis (NA) was proposed and implemented between suitable sites determined by MCA and existing WS, such that highly suitable sites for WS were selected. Second, these studies did not consider the relative importance of the criteria in theie MCAs, the incorporation of which is important in improving MCA [22]. For this, the analytical hierarchy process (AHP) is the most widely used MCA technique, and it consists of weighing the importance of each criterion using expert opinions [23].
In Peru, the “Protocol for the installation and operation of meteorological and hydrological stations” (Section 7.2) of SENAMHI [24], establishes several criteria and guidelines for the selection of a WS site, but it does not provide a methodological framework for WS network planning. Accordingly, this study aims to select highly suitable sites for a WS network by integrating AHP and NA, using the Amazonas Department (NW Peru) as the study area. It is expected that existing WS locations are not highly suitable and need to be relocated. In summary, (i) WS site-selection criteria were identified and mapped in a GIS, and the weighting of their importance was determined by AHP; (ii) a map of the suitability of the territory for WS sites was constructed; (iii) the suitability of the conditions of existing WS sites were assessed and, if necessary, the sites were relocated; (iv) the most suitable new sites for monitoring networks with different number of WS were determined by the NA method, using existing WS. Finally, an integrated methodological framework of AHP and NA in a GIS environment is proposed as a useful support tool for WS network planning, which can be replicable in other regions with the necessary complements.

2. Materials and Methods
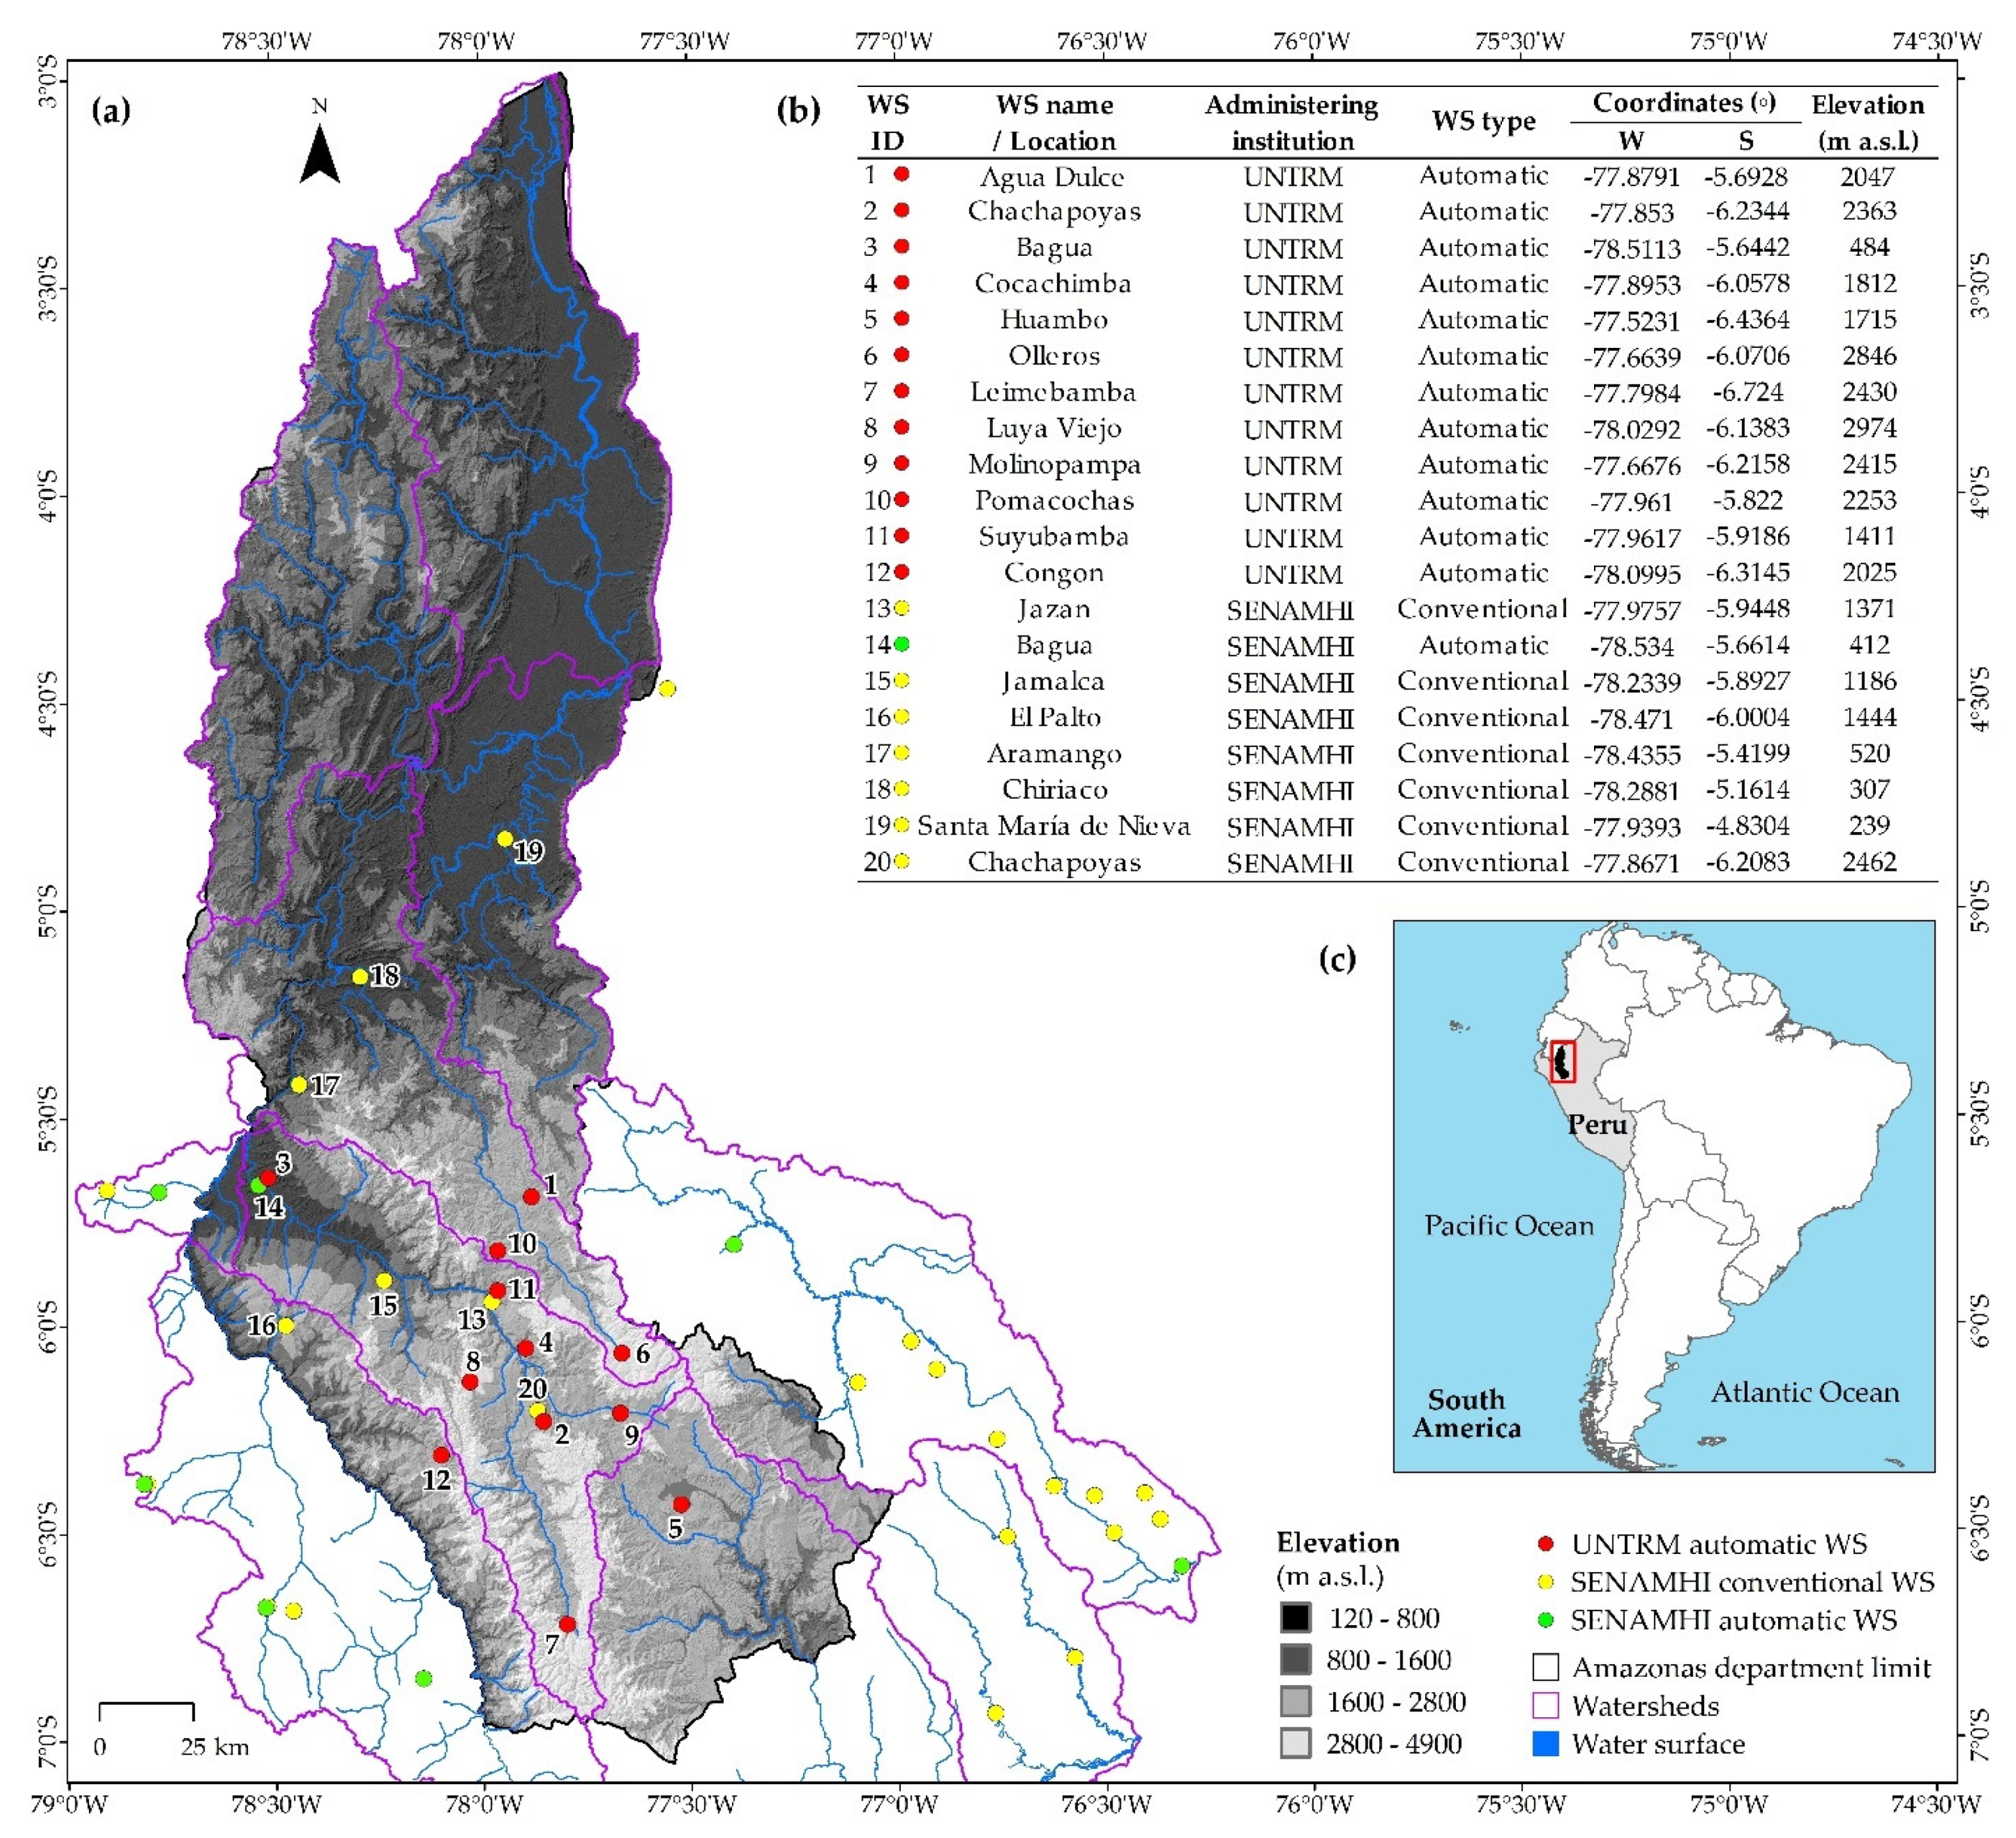
2.1. Study Area

In the northeastern Peruvian Andes, the Amazonas Department covers approximately 42,050.37 km2 of rugged territory, covered mainly by the Amazon rainforest, along an elevational gradient from 120 m a.s.l., in the north, to 4900 m a.s.l., in the south (Figure 1, 3°0′–7°2′ S and 77°0′–78°42′ W) [25]. It has contrasting climates (“warm and humid”, “dry warm”, and “warm and slightly humid temperate”), ranging from a maximum temperature of 40 °C, in the lowland forest of the north, to a minimum temperature of 2 °C, in the mountain ranges at the southern boundary; some areas have a water deficit of 924 mm/year and others have a surplus of up to 3000 mm/year [26]. As part of their high biophysical diversity, four ecosystems can be distinguished [27]: (i) lowland forest, (ii) high forest or yunga, (iii) Andean forests and grasslands, and (iv) tropical dry forest. Amazonas is characterized by its agricultural activity, which occupies 24.9% of the territory and generates 51.22% of the departmental gross domestic product [27]. Currently, there are 20 WS in Amazonas, varying by type between automatic and conventional, administered by UNTRM (12) and SENAMHI (8) (Figure 1). In the current network there is no uniform spatial distribution of the WS, because each institution installed WS for its purpose, at different times, without considering a departmental distribution network plan and the only criteria used were for convenience. Thus, currently there are elevation ranges that are well represented, but other ranges are not, and often two WSs from both institutions are too close to each other.

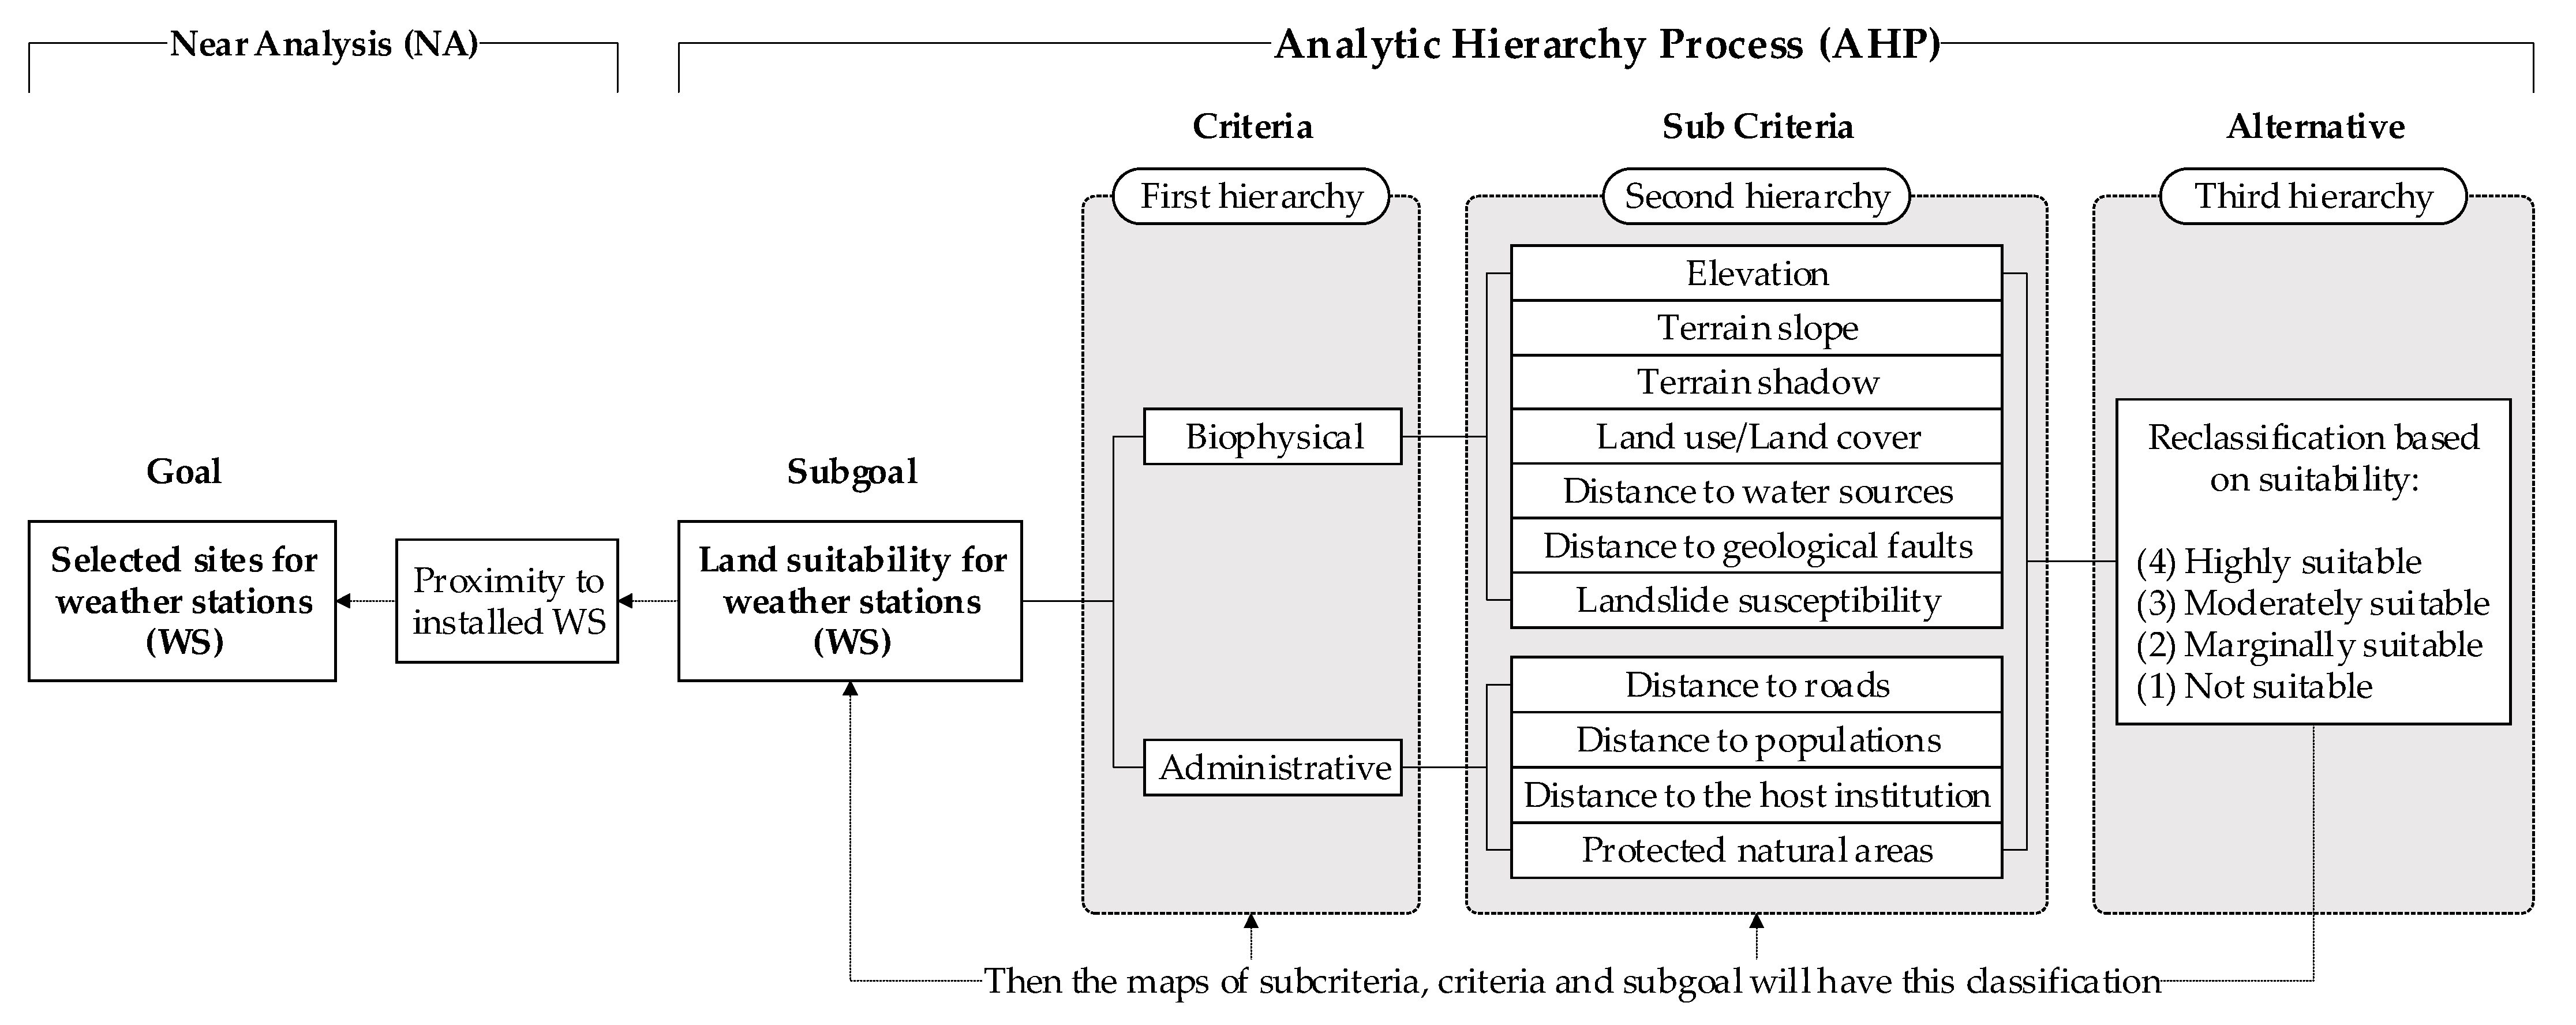
2.2. Methodological Design

Figure 2 shows the methodological process developed for the selection of WS sites by integrating the analytic hierarchy process (AHP) and near analysis (NA). This study is the first integration of both methodologies.

2.3. Criteria and Criteria Thresholds for Selecting a Suitable Site

The AHP structures problems into levels of sub-problems/objectives and criteria, where each level can be analyzed independently and is more easily understood [28,29,30]. A hierarchy was constructed, consisting of the study sub-goal (land suitability for WS), two criteria (biophysical and administrative), eleven sub criteria and four alternatives (Figure 2). The criteria were established considering technical documents from World Meteorological Organization (WMO) [1,17,31] and Environmental Protection Agency (EPA) [32], the Peruvian national protocol of SENAMHI [24] and studies concerning the selection of hydro/agro-meteorological station sites [2,7,19,21]. To develop the third hierarchy, shown in Figure 2 (the alternatives), the sub-criteria were scored on a scale of four levels of land suitability for meteorological station sites (Table 1): (4) ‘Highly suitable’, (3) ‘Moderate Suitable’, (2) ‘Marginally suitable’ and (1) ‘Not suitable’. These suitability levels are derived from the five suitability levels of the FAO’s “A Framework for Land Evaluation” [33]; where, as in other studies [22,34,35], with a more restrictive approach, the last two levels (Currently Not Suitable and Permanently Not Suitable) were combined to form (1) ‘Not suitable’. The ‘Highly suitable’ level (including ‘Moderately Suitable’ for some sub-criteria) aims to meet the most stringent requirements for Class 1 sites (and therefore the other classes) established by WMO [1] and the requirements for synoptic, climatological, and agrometeorological station sites established in the Peruvian national protocol of SENAMHI [24].
The site should be on flat terrain, with no steep slopes nearby, and should not be in a hollow; otherwise, the equipment will receive considerable daily shading and WS observations will have only locally significant peculiarities [1,17]. Reflective surfaces or artificial heat sources (e.g., buildings, concrete surfaces or car parks), and bodies of water or moisture (e.g., large rivers, ponds, lakes or irrigated areas), distort measurements of temperature, humidity, radiation, wind, and other variables [1]. For both cases above, the maximum distances recommended by WMO [1] and SENAMHI [24] are >100 m and >30 m, respectively. Several areas of Amazonas are susceptible to landslides [15], consequently, areas of high susceptibility were considered unsuitable for WS sites [2]. In addition, a buffer zone of 500 m from the geological faults was established [2]. Agriculture is the main economic activity in Amazonas [37]; therefore, the agricultural zone was considered very suitable for WS sites.
In fact, roads and vehicular traffic do affect the measurements of WS but accessibility is necessary for WS’ sustained operation and they must be taken into account [2,7]. Similarly, although urban constructions affect measurements, proximity to them is important to ensure power supply and surveillance of the instruments from theft and/or vandalism [1,17]. In addition, the worldwide trend towards urbanization should be considered by avoiding areas planned for urban sprawl (or with a buffer to the current urban area) [2,24]. The lack of host institutions where WS can be installed is a real barrier to achieving an optimal number of WS in most developing countries [19]; ergo, they should be identified and considered. Moreover, Amazonas is the third department in Peru with the highest number of Protected Natural Areas (PNA) [38], and given the ecological importance of these territories, they are a priority for having WS.

2.4. Mapping of Sub-Criteria for Selecting a Suitable Site

Elevation, terrain slope, and terrain shadow were derived from the ASTER Global Digital Elevation Model V3 (spatial resolution: 30 m) downloaded from the Japan Space Systems platform [39]. A terrain-shadow map was generated for each hour between 1200 and 0000 UTC [2] (0700 and 1900 UTC–5, Peru). For this, the sun’s elevation and azimuth, averaged for each hour in 2020 and obtained from SunEarthTools [40] was used. In each map, pixels fully shaded by another pixel were given a value of 0 and all other pixels were given integer values between 1 and 255. All values greater than 1 were re-classified to 0, and pixels with 0 or 1 and the 13 maps were summed to count the hours of shade per day for each pixel.
The land-use/land-cover (LU/LC) base map was obtained from the Copernicus Global Land Service-Land Cover (CGLS-LC100)-Collection 3-2019 of 100-m spatial resolution [36]. On this map, LU polygons (urban, agricultural and livestock areas) were updated from the National Ecosystems Map of Peru [41,42], the National Map of Agricultural Surface [43], the Amazon Economic Ecological Zoning (ZEE-A) [27], and the province of Rodriguez de Mendoza [44]. Water bodies (rivers and lakes) were obtained from the ZEE-A [27]. Lakes and rivers of order ≥3 (Strahler method [45]) are listed as principal in Table 1 and the remaining ones were considered secondary and without significant influence on WS observations. The susceptibility maps for landslides [15] and geological faults [46] were obtained from the Instituto Geológico Minero y Metalúrgico in Peru.
The road network (national, departmental and local categories) was obtained from the portal of the Ministerio de Transportes y Comunicaciones (MTC) [47]. The urban polygons were extracted from the final LU/LC map and the population centres (points) were obtained from the (MINEDU) [48]. The host institutions were the headquarters, experimental stations and branches of the UNTRM (geo-referenced with GPS receiver) and the public educational institutions of higher technical and university level (obtained from MINEDU [49]). The PNA were obtained from the Servicio Nacional de Áreas Naturales Protegidas por el Estado (SERNANP) [38].
The distances to water bodies, roads, geological faults, possible administration centres and population centres from anywhere in the Amazonas Department were mapped using the Euclidean distance tool. In sum, 11 thematic maps were prepared in raster models, one map for each sub-criterion. These maps were standardized in the WGS 1984 UTM 18 South coordinate system and spatial boundaries restricted to Amazonas and a spatial resolution of 30 m. This resolution was based on the maximum dimensions recommended for meteorological stations by the WMO (25 × 25 m) [1] and the SENAMHI national protocol (15 × 25 m) [24]. Then, the thematic maps for each sub-criterion were reclassified according to the thresholds established in Table 1, assigning scores (between 1 and 4) to each pixel.

2.5. Determination of Importance Weights of Criteria and Sub-Criteria

The development of the second and first hierarchy in Figure 2 involves constructing pairwise comparison matrices (PCM), which compare one criterion with respect to the others (pairwise) and establishes the degree of importance between them [50]. The applied AHP is a variation of the traditional Saaty method, because the paired comparison was not applied to the third hierarchy (alternatives) [28]. The comparison was based on Saaty’s nine-level scale (Table 2) [29], and each member of a group of experts assigned a value judgement, from the least important to the most important criterion, based on their experience. The questionnaire with the PCM was sent by email to professionals from SENAMHI, the Autoridad Nacional del Agua (ANA), meteorological instrument companies and meteorological professors/researchers. Each expert completed two PCMs at the sub-criterion level and one PCM at the criterion level (hierarchical groups in Figure 2). The experts’ PCMs were processed (for examples of matrix processing of PCM, see [34,51]) and weighted importance was obtained for each sub-criterion and criterion. The subjective preferences between experts can lead to inconsistencies in the importance weights, because their matrices do not comply with the two simultaneous properties of consistency, which are the transitivity of the preferences and the proportionality of the preferences [52]. Therefore, the consistency ratio (CR) of each PCM was calculated to compare with an acceptable inconsistency (CR < 0.1) [28]. CR was calculated by dividing the PCM’s consistency index (CI) with a random consistency index (RI) [30]. This RI is defined according to the number of criteria (n) (Table 3) [53] and CI depends on the largest or principal eigenvalue of the matrix (λmax) and n (Equation (1)).
CI = (λmax − n)/(n − 1),

2.6. Sub-Model Generation and Suitability Modelling

The final development of the second and first hierarchy consisted of integrating the reclassified thematic maps (based on Table 1), according to hierarchical group (Figure 2), by weighted linear overlay (Equation (2)) [22,34,35]. The resulting suitability (GRI-Dresult) depended on the reclassified map pixel score (GRIDi) and the sub-criterion importance weight (WEIGHTi). The integration of sub-criteria generated the biophysical and administrative suitability sub-models, and the integration of these sub-models generated the territory suitability model for WS. Water bodies and urban areas (polygons) were restricted to the suitability maps, and the area (in km2) was counted within the ‘Not suitable’ level. This process was performed with the ArcGIS 10.5 Weighted Overlay (Spatial Analyst) tool.
GRIDresult = Σ [(GRIDi) (WEIGHTi)],

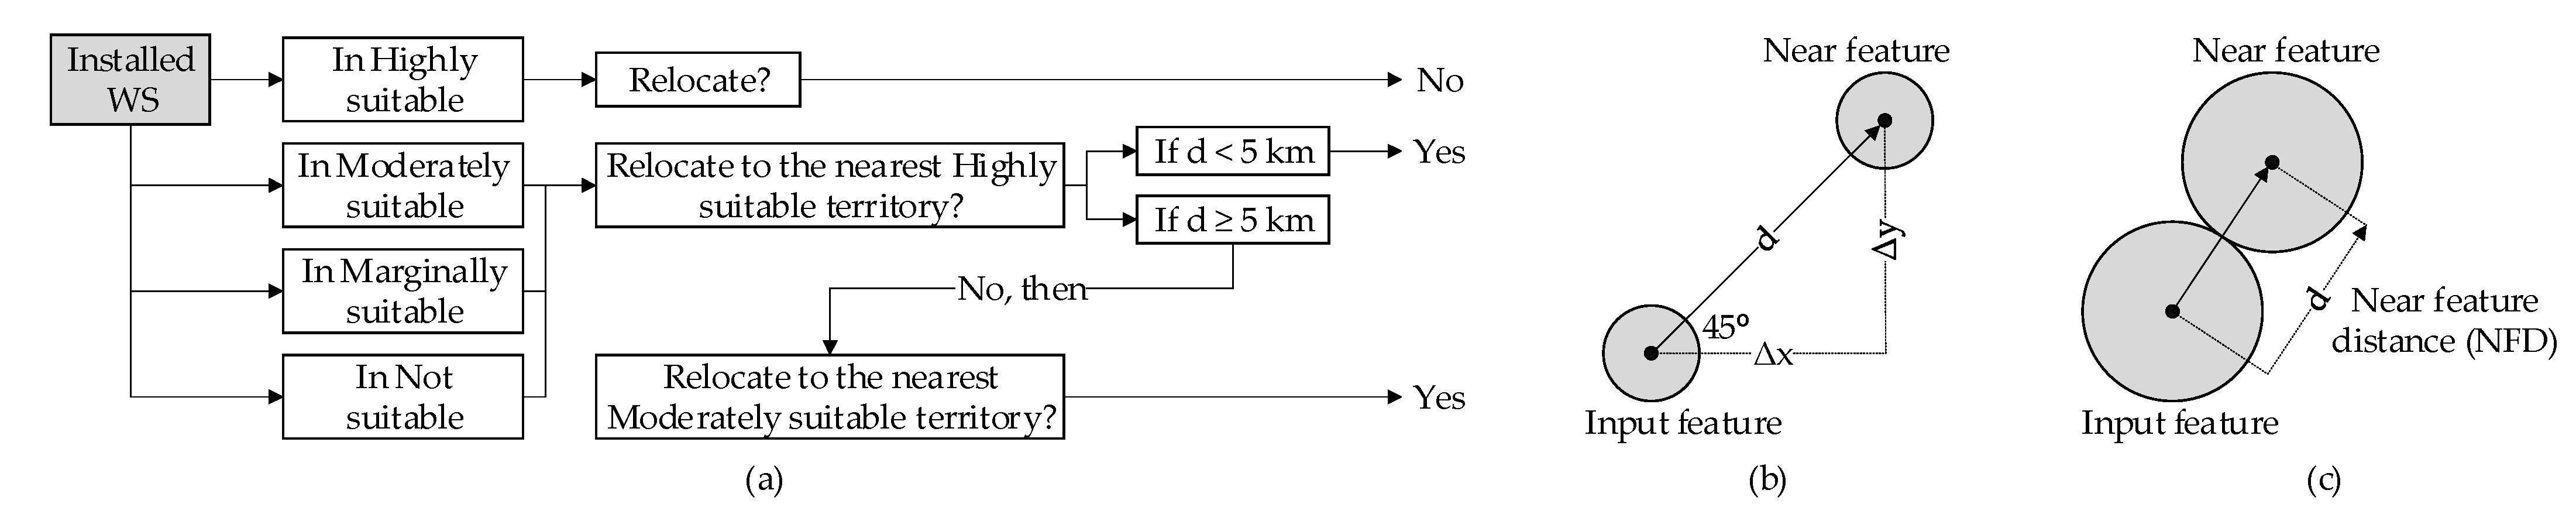
2.7. Near Analysis (NA) to Select WS Sites

The 20 existing WS (Figure 1) were overlaid with the WS land-suitability model to determine the current condition of the land on which they are located. In addition, the ‘highly suitable’ terrain (according to the decision rule in Figure 3a) closest to each WS was determined in order to relocate the currently misplaced WS. This step was based on the near analysis (NA) method. NA calculated the distances between two input spatial features (input feature = 20 existing WS; near feature = only ‘highly suitable’ polygons from the WS land-suitability model) (Figure 3b,c) [2,54]. This process was performed with the ArcGIS 10.5 Near (Analysis) tool.
Then, the selection of ‘highly suitable’ sites for installing new WS was also based on the NA method, but by swapping the function of the two spatial input features (input feature = only ‘highly suitable’ polygons of the WS land suitability model; near feature = 20 relocated existing WS). From the first iteration, the furthest ‘highly suitable’ polygon was chosen as the first new site (WS number 21). In the second iteration, the second new site (WS number 22) was determined as the furthest ‘highly suitable’ polygon in relation to the 21 WS. Successive iterations were performed, considering new sites at each iteration, until the furthest distance was less than 9 km [19].

3. Results

3.1. Importance of Criteria and Sub-Criteria

The weighted scores for each sub-criterion (Table 4) were calculated from the mean of the evaluations of five (5) meteorological experts. This group of experts that responded and approved with CR < 0.1 was made up of an expert from SENAMHI, one from ANA one from Peru Davis Instruments E.I.R.L., and two professors/researchers in meteorology. The sub-criteria terrain slope (22.8%) and distance to water sources (21.4%), followed by terrain hill shade (16.2%) and land use /land cover (15.3%), obtained the highest weighting with respect to their biophysical criteria group. In the administrative criteria group, distance to roads (36.2%) and distance to populations (32.8%) were the most important sub-criteria. Regarding the group of criteria, biophysical (68.3%) was more important than administrative (31.8%).

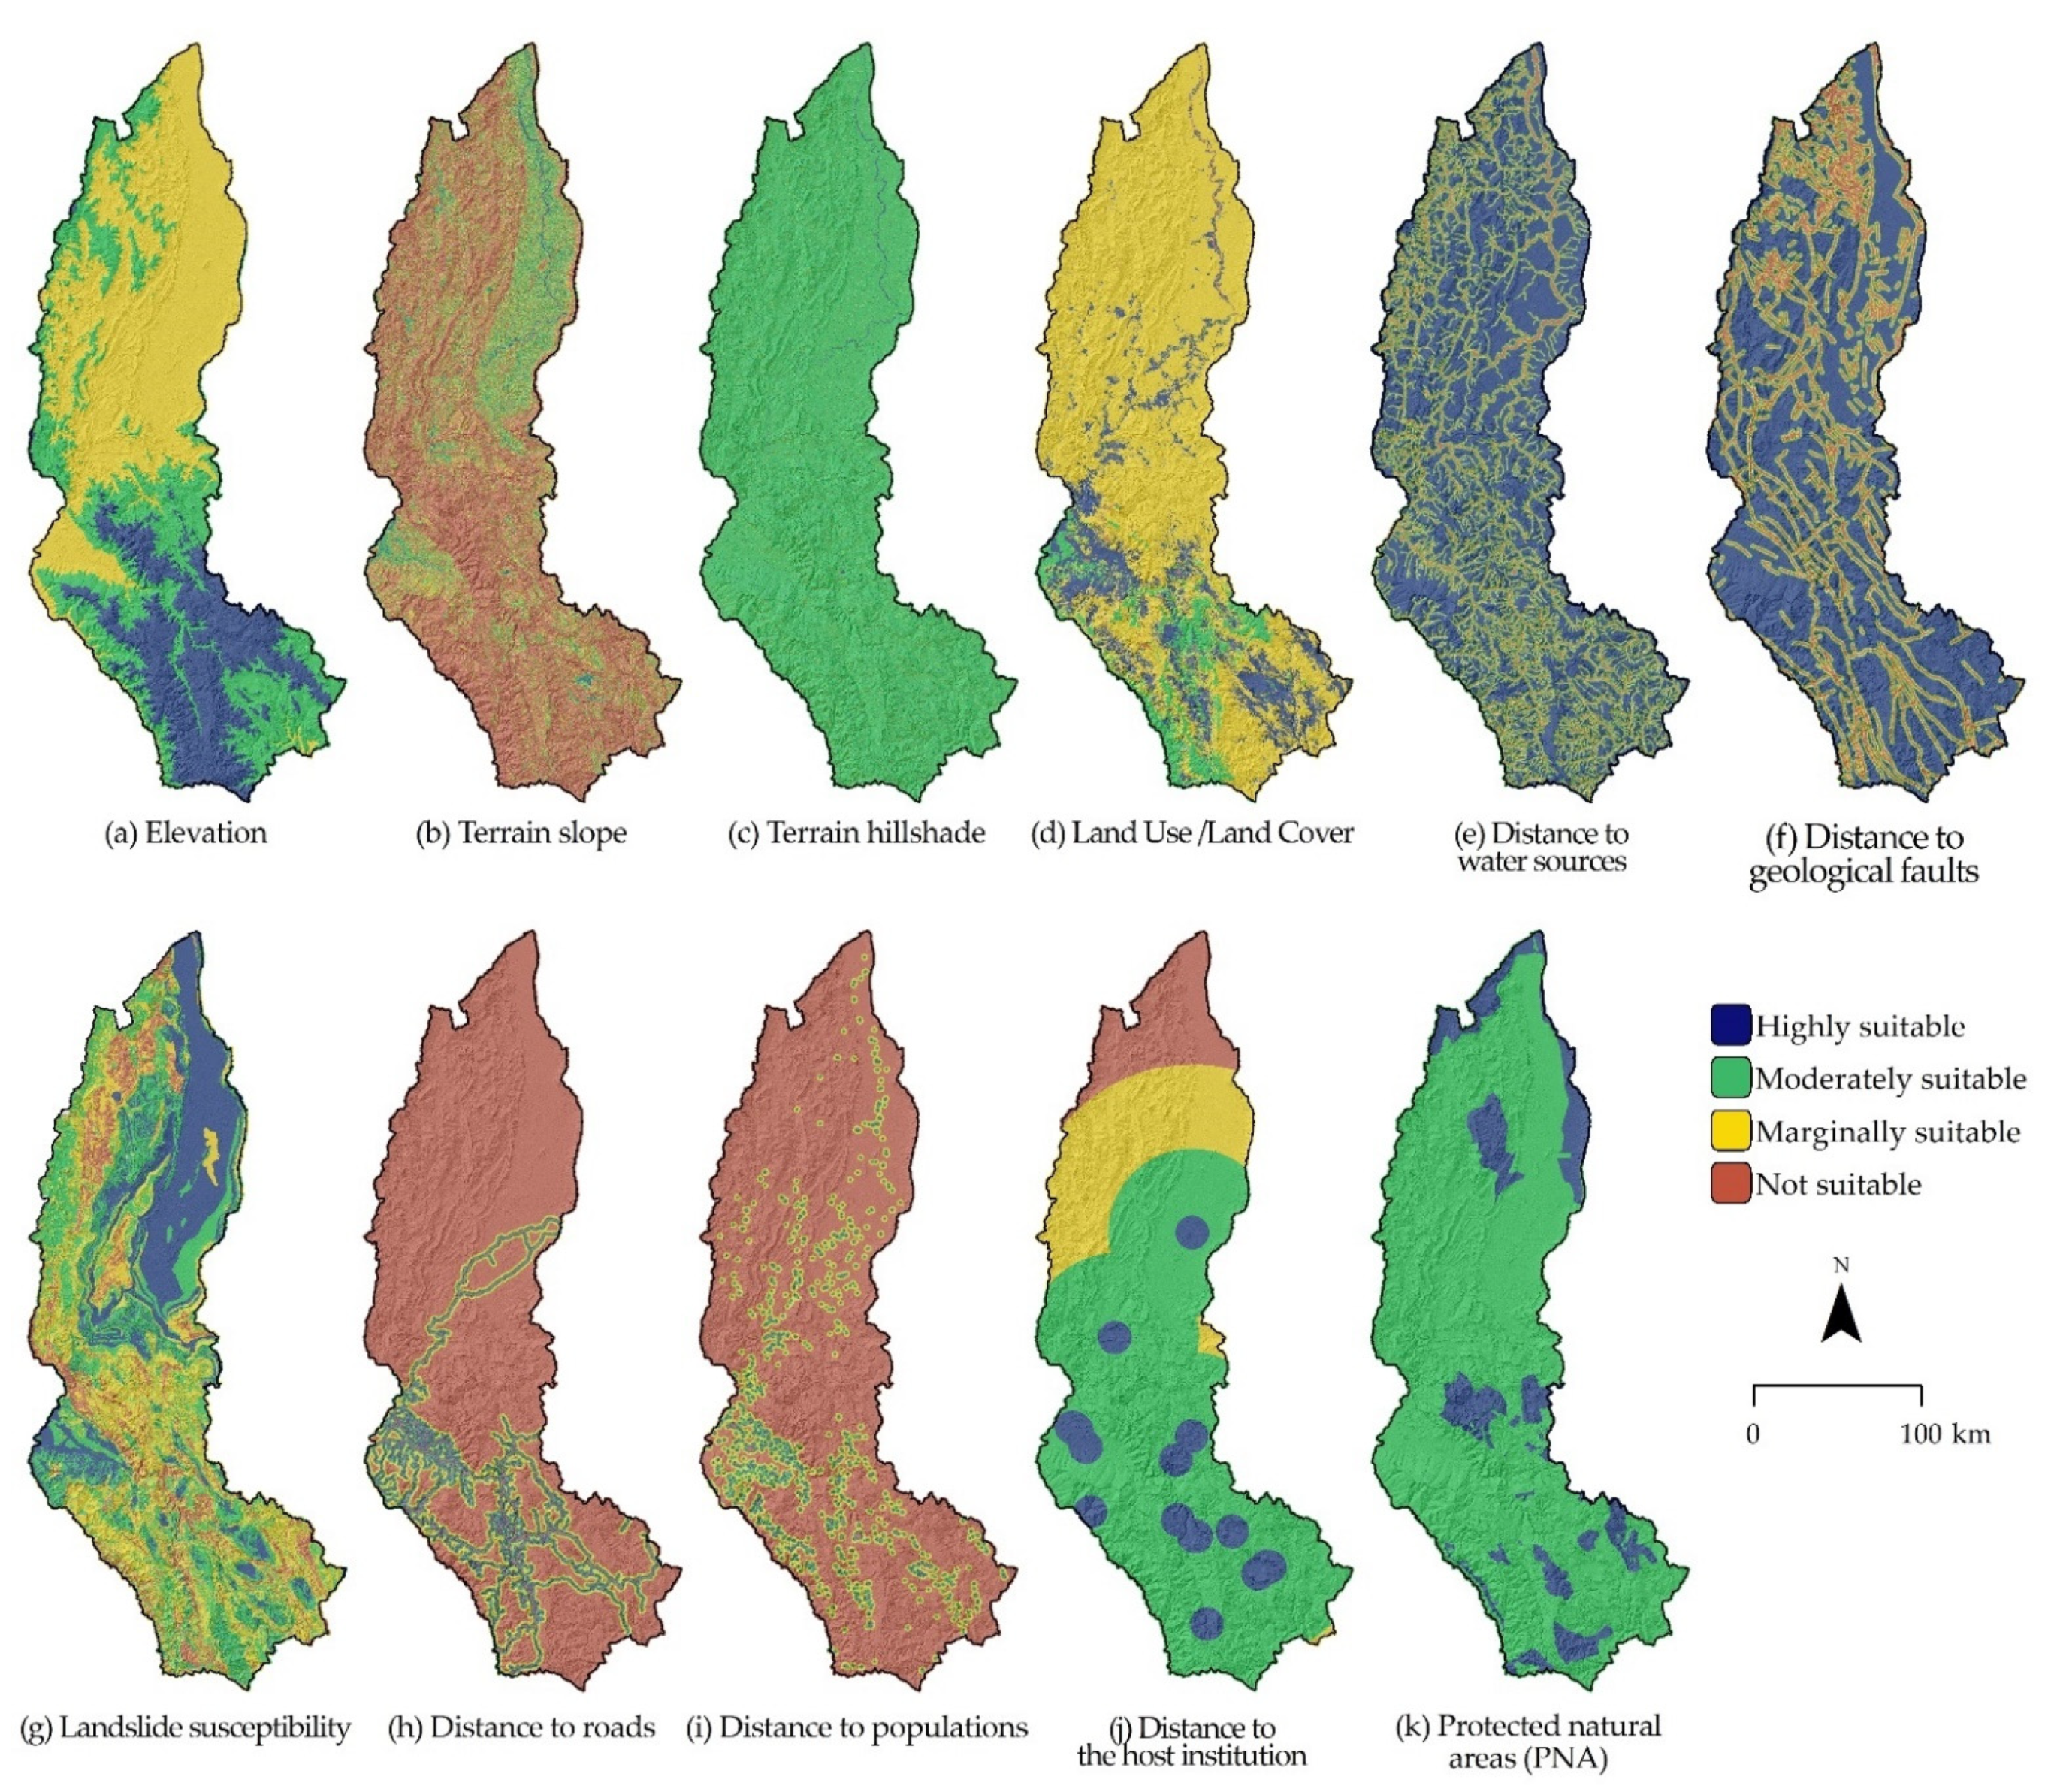
3.2. Maps of Sub-Criteria Based on Levels of Land Suitability

Figure 4 shows the reclassified maps, based on suitability thresholds (Table 1), of the biophysical and administrative sub-criteria. The sub-criteria with the largest ‘highly suitable’ area, regarding their criteria group, were: distance to geological faults (56.1%) and protected natural areas (14.6%), while those with the largest ‘not suitable’ area were terrain slope (61.0%) and distance to roads (81.2%) (Table 5). Hence, distance to geological faults is the sub-criterion that most favours the selection of sites for weather stations in Amazonas, while distance to roads is the most restrictive.

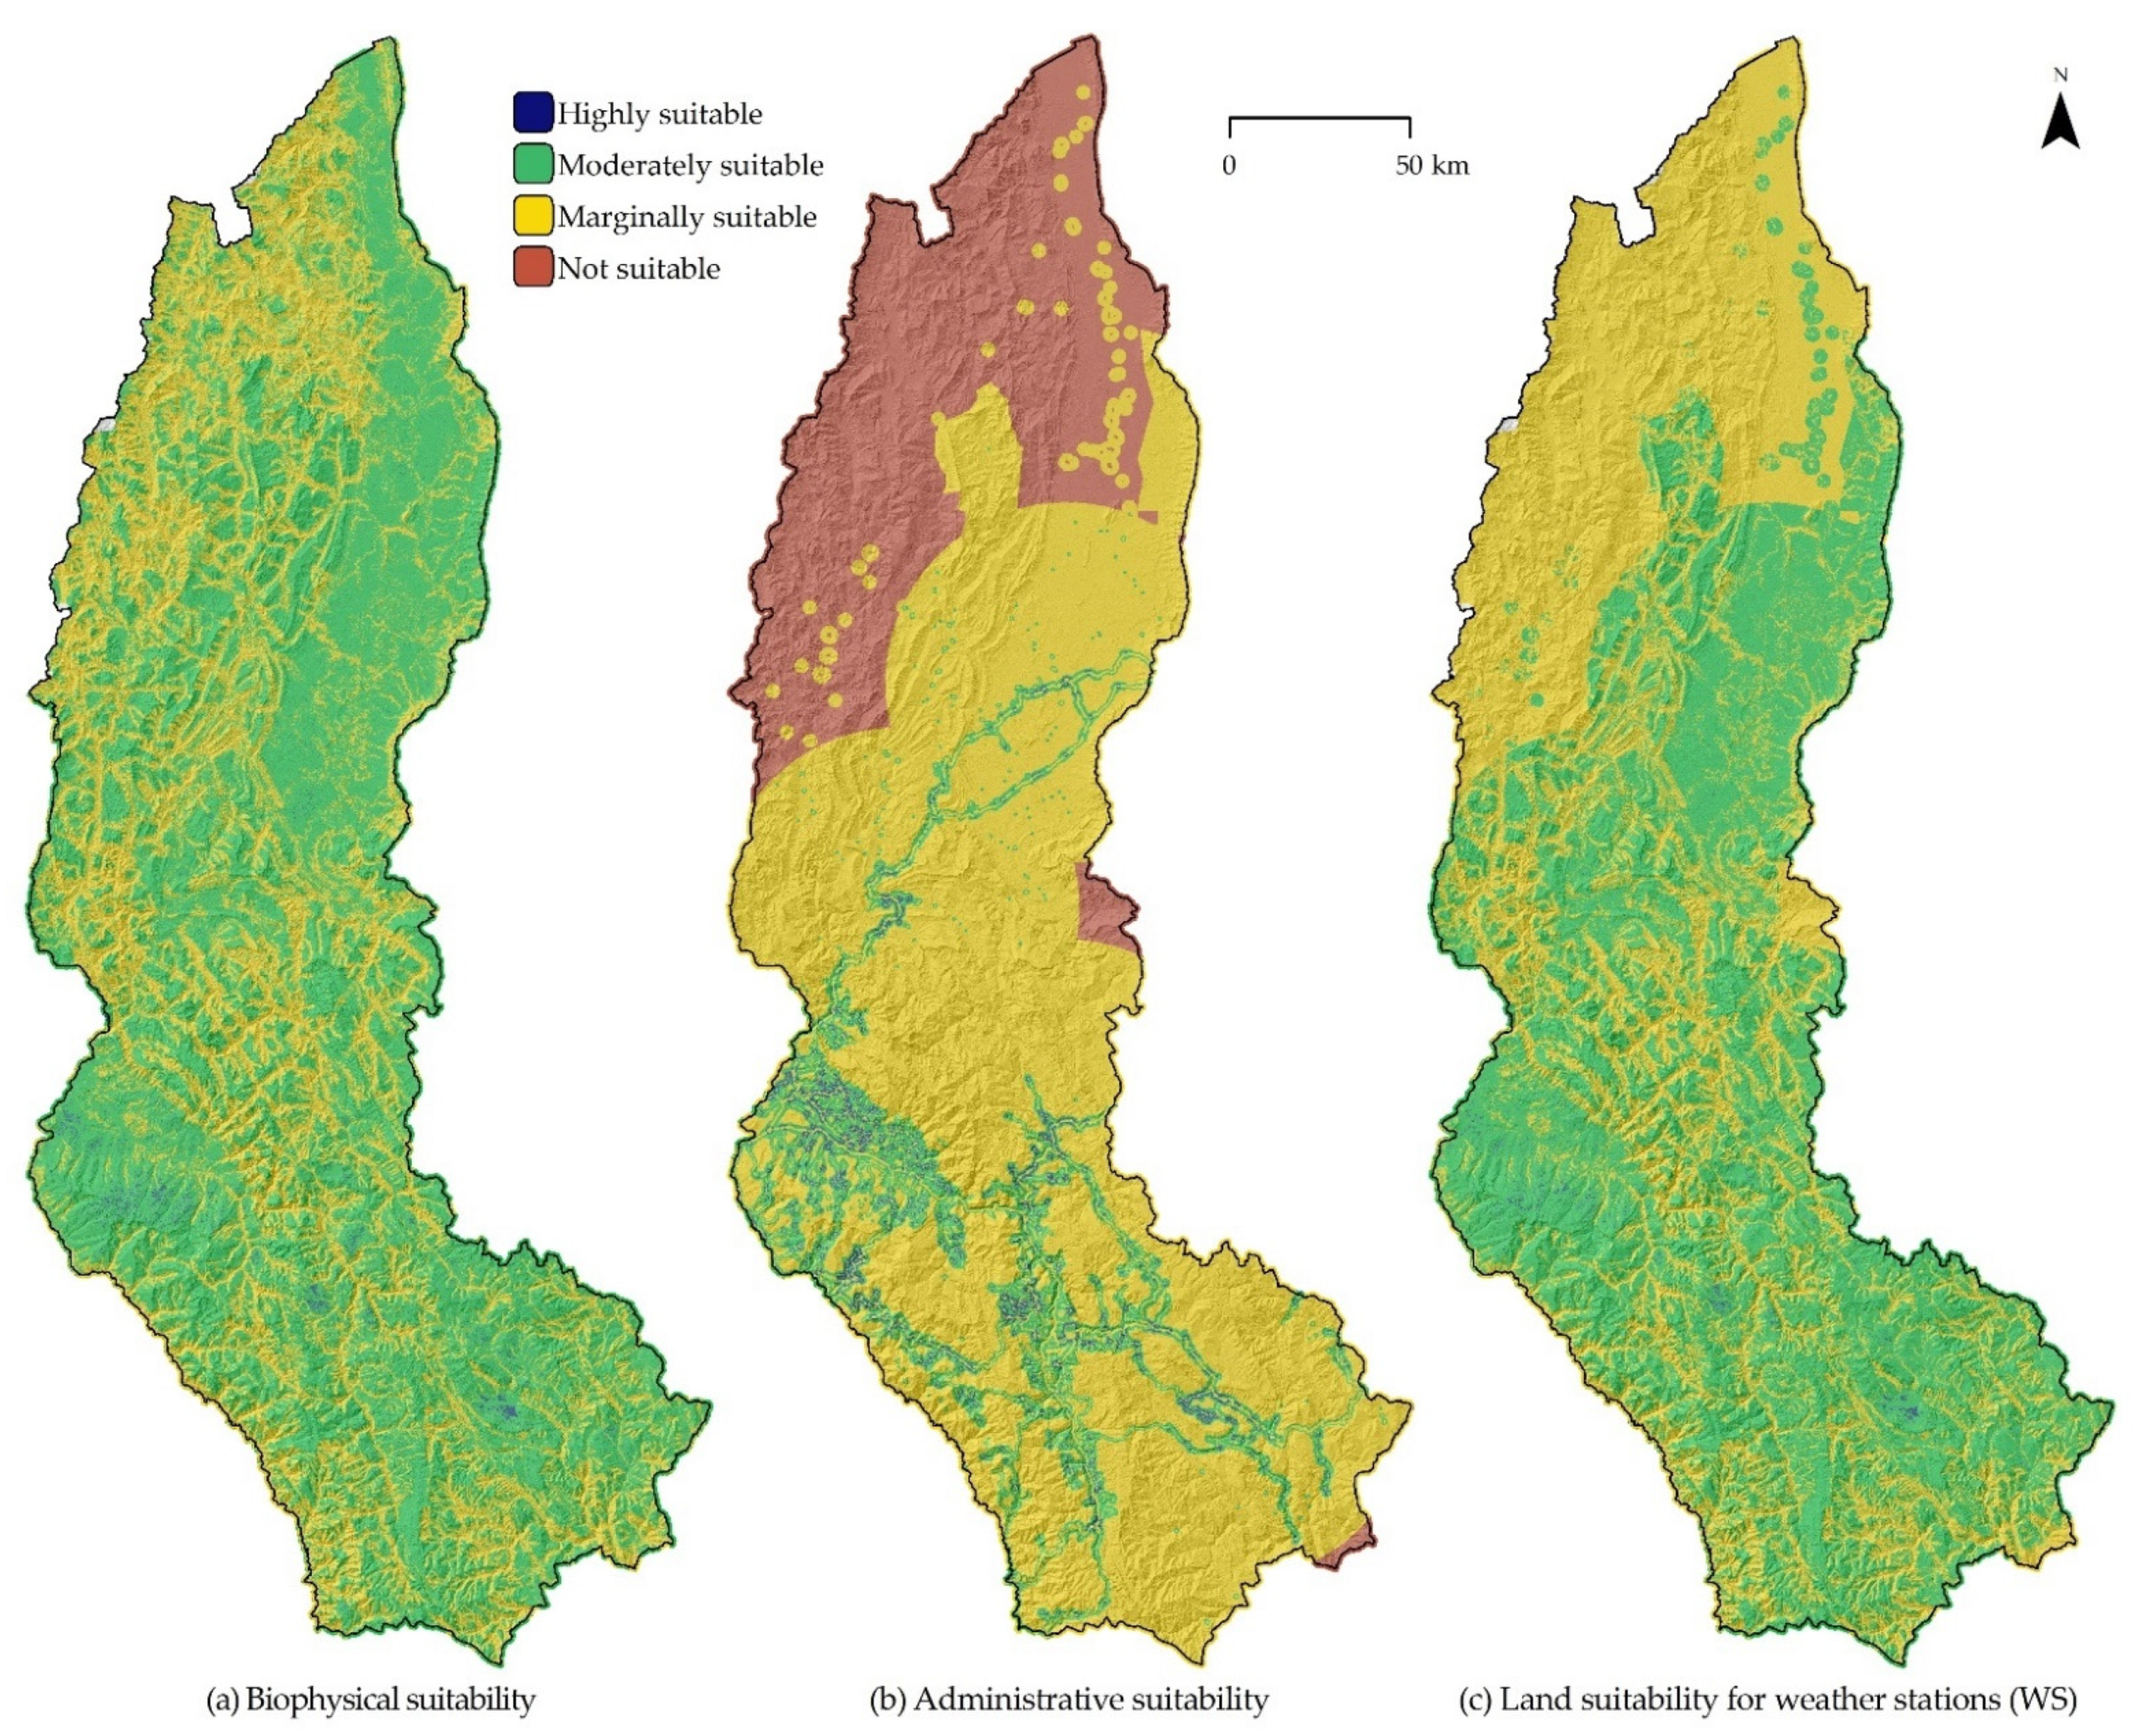
3.3. Suitability Sub-Model Maps

With the weighted overlap of sub-criteria, suitability sub-models were generated for each hierarchical group (Figure 5a,b). The administrative sub-model had the largest ‘highly suitable’ area (663.45 km2) and ‘not suitable’ area (10,253.37 km2) for selecting locations for WS in Amazonas (Table 6). The land-suitability model for WS (Figure 5c) indicated that 0.3% (108.55 km2) of the Amazon region has characteristics that are highly suitable for installing WS. This ‘highly suitable’ territory corresponded to 115,706 30 × 30 m pixels, which formed 26,683 ‘highly suitable’ polygons for installing WS.

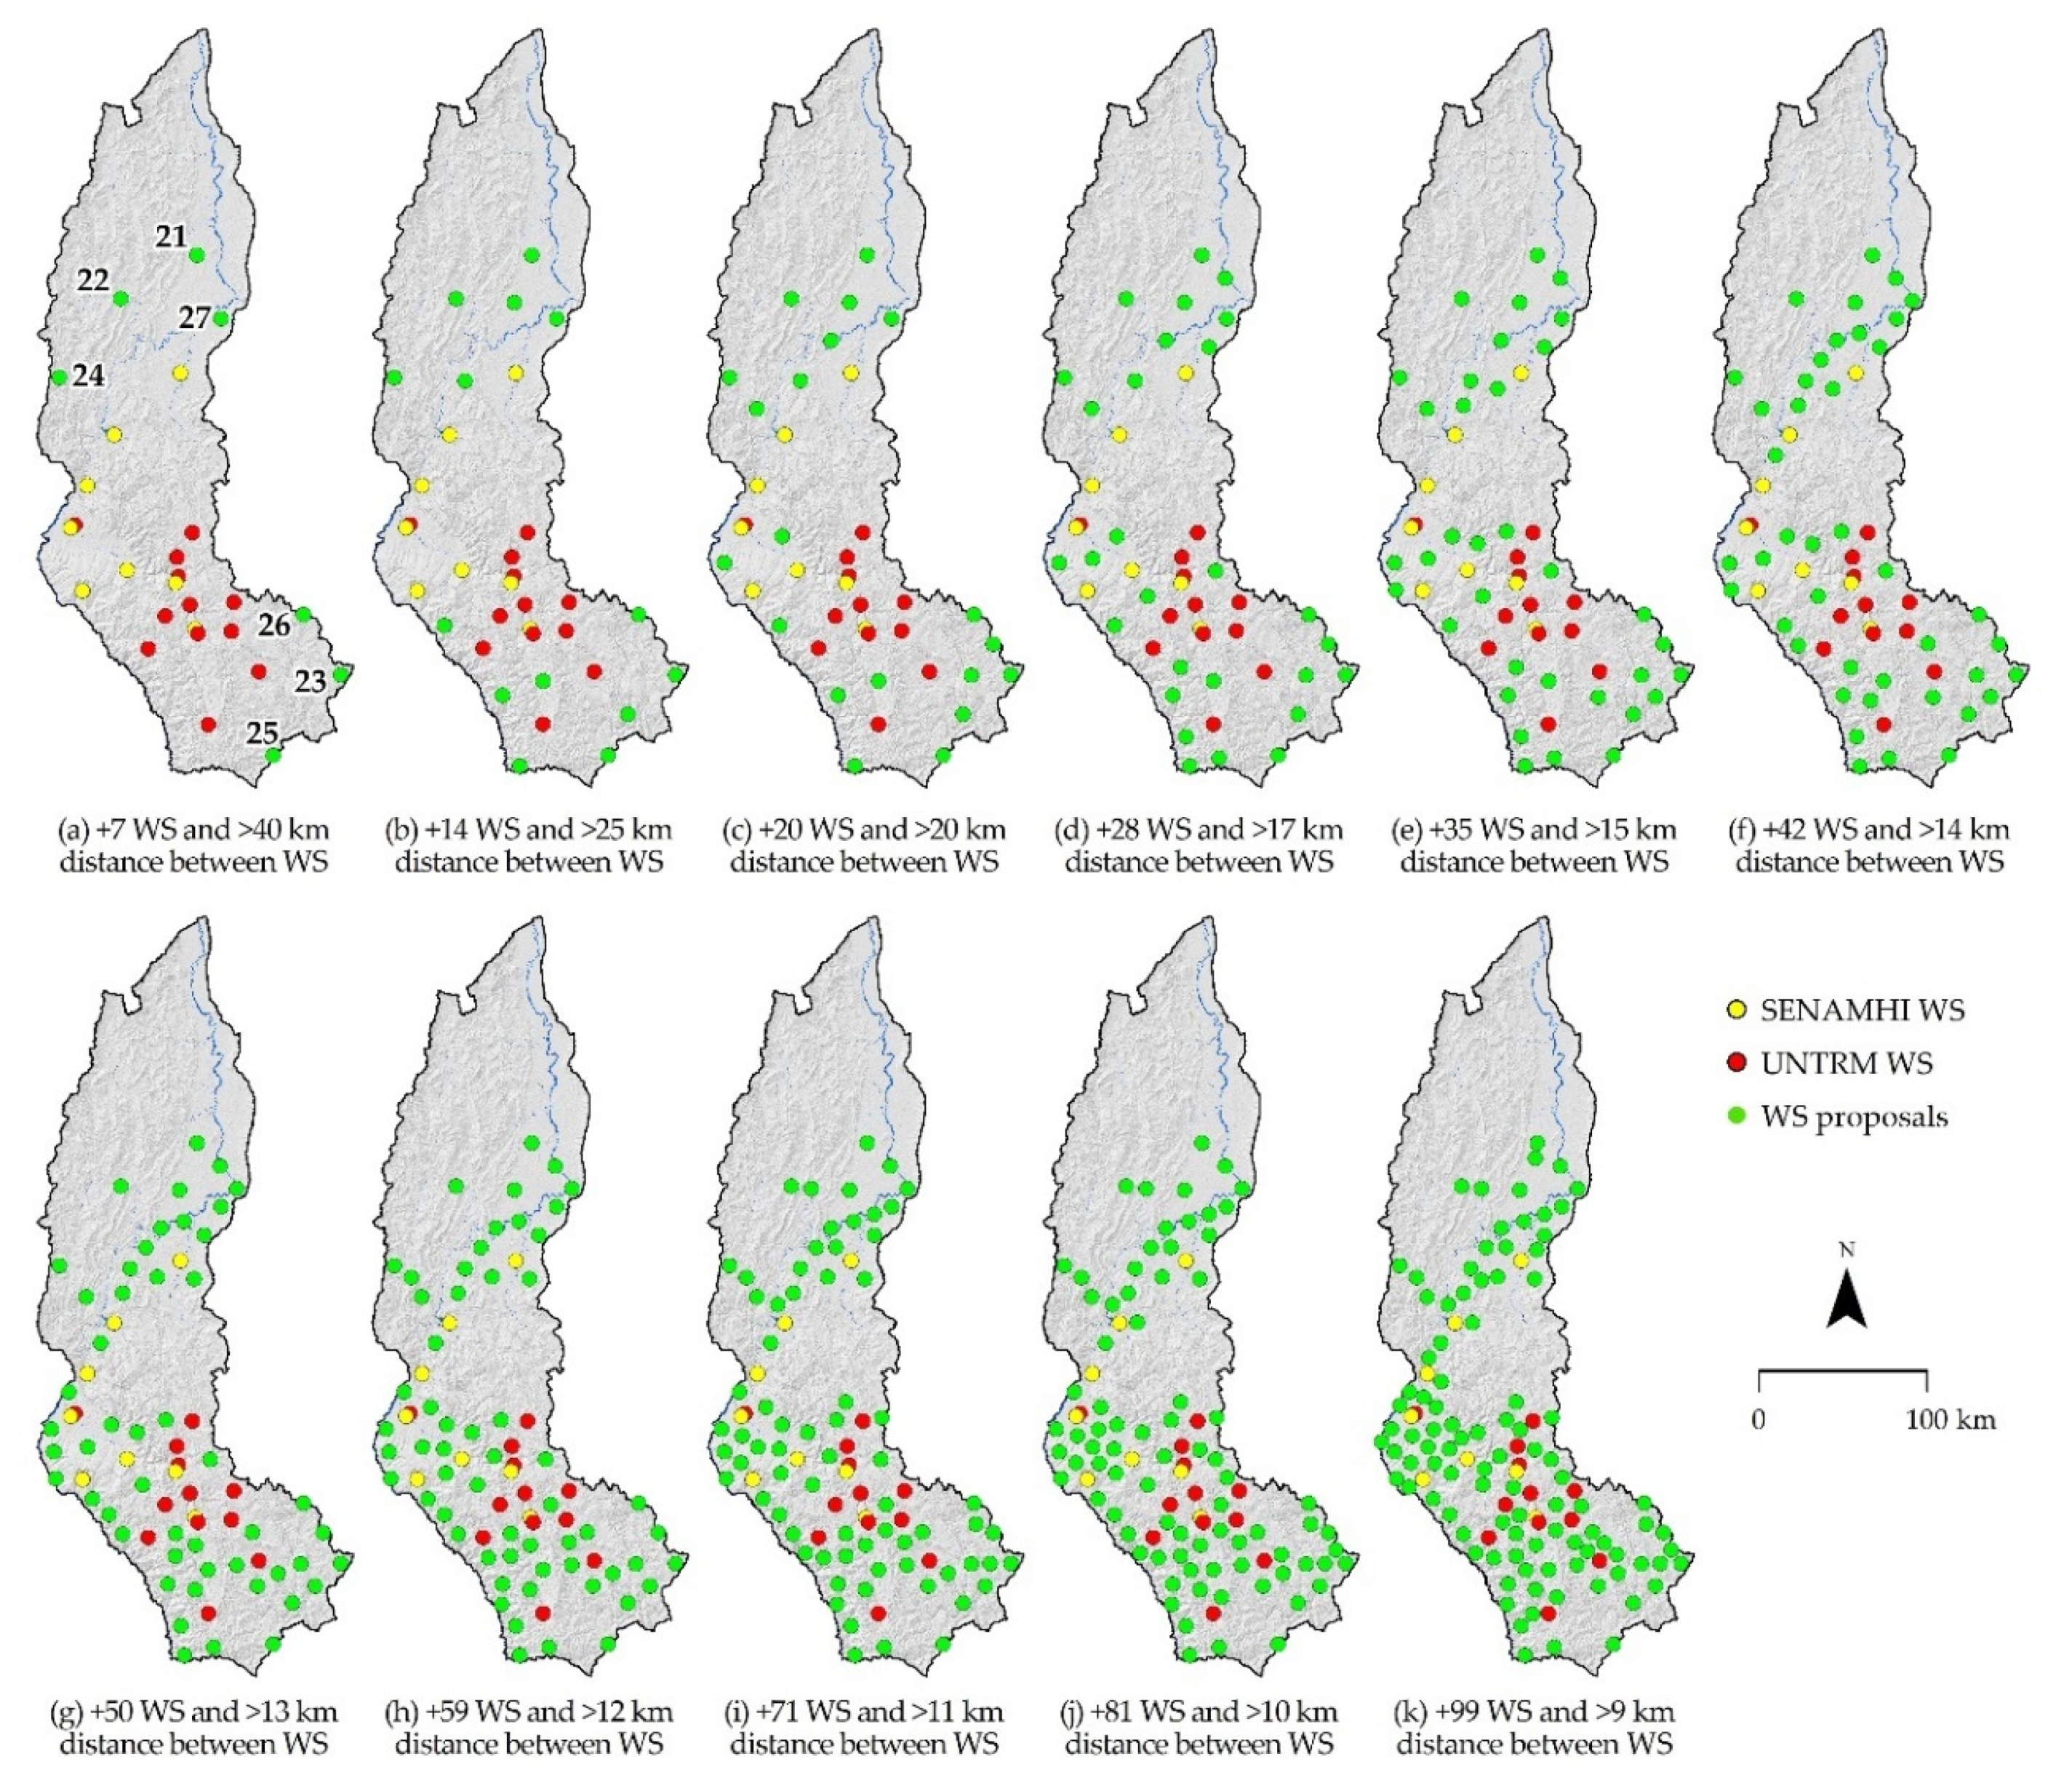
3.4. Relocation of WS and the Selection of Sites for New WS

Of the 20 existing WS, 5% (1 WS, WS Chachapoyas-SENAMHI), 70% (14 WS), and 20% (5 WS) are located in ‘highly suitable’, ‘moderately suitable’ and ‘marginally suitable’ terrain, respectively (Table 7). The closest ‘highly suitable’ terrain to the 19 WS that are not in ‘highly suitable’ terrain is between 0.9 m (WS Bagua-SENAMHI) and 2387.0 m (WS Congon-UNTRM). One hundred iterations were performed, taking into account the relative distances of the 20 existing WS (19 WS relocated to the nearest ‘highly suitable’ terrain). Figure 6 shows 11 possible distributions of the WS network in Amazonas, with varying numbers of new WS and distances between them depending on each distribution. The northernmost point of Amazonas, in Figure 6, is the furthest (70.79 km) from the existing WS and it was identified as the location of WS number 21. WS numbers 22–27 (Figure 6a) were identified at 52.07 km, 48.72 km, 47.38 km, 42.74 km, 42.06 km, and 40.35 km relative to the WSs that were used for iteration. At iteration 100, the ‘highly suitable’ polygon that was furthest away from the preceding 99 WS (Figure 6k) was 8.73 km (<9 km) distant, thus halting the iterations for the purpose of this study.

4. Discussion

Unlike previous studies that used GIS–MCA as a tool to support site selection for hydro/agro/urban/road weather stations [2,7,19,20,21,55,56,57], this study included a larger number of criteria. However, in this type of study, the number of sub-criteria depends on the focus of the study and the availability of spatial data [22]. In Peru, and specifically in the Amazonas Department, these spatial resources are scarce, even more so for specific studies of biological, environmental, and socioeconomic criteria at detailed, local scales [34]. Therefore, this study tried to use readily available spatial data so that the study could be replicated in other places that have the same difficulties. However, for studies in regions with data availability, for example, proximity to the flow of electricity or cell-phone coverage (or telecommunications in general), such can be incorporated [17], as could the requirements of potential investors.
In this study, terrain slope (15.6%), followed by distance to water sources (14.6%) and Distance to roads (11.5%) were the most important sub-criteria fin selecting WS sites. These sub-criteria were consistent with those established as priorities in previous studies [2,7,19,20,21]. In fact, terrain slope is the criterion most evaluated and highlighted by the WMO [1,17,31], EPA [32], and SENAMHI [24] in different technical documents. This is due to the various effects that slopes and their directions (and, in general, the type of relief or morphological environment) have on radiation, wind flow, and the amount of shadow that the WS instruments receive. These documents also highlight the importance of considering proximity to reflective surfaces (e.g., roads) and water sources, because they distort instrument measurements.
Furthermore, of all previous studies [2,7,19,20,21,55,56,57], only four [21,55,56,57] integrated AHP to hierarchize and weight the importance of their criteria, but these are very local studios (e.g., urban or road WS); and only one [2] did not integrate AHP but used NA to select optimal sites after GIS–MCA. This study represents the first integration of the AHP technique and the NA method in site selection for WS. Among its advantages, the easy applicability a both regional and national scales stands out, however, the main limitation would be that it does not incorporate the historical spatial behaviour of climatological criteria [17]. In this sense, the precipitation and/or temperature data from SENAMHI [58] (for Peru) and/or WorldClim [59] (for any area of the world) can be incorporated during or after the MCA to improve the distribution of WS. In addition, to improve the NA, complex network analysis can be incorporated, whose application to the optimal design of hydrometric station networks is recent [60].
For future studies, it is possible to run a single iteration of the NA method and choose all locations further away than the number of WS to be installed or based on the distance threshold between WS, however, it is not recommended to do so. Instead, it should be done iteration by iteration, as each new location can be moved at the judgement of the researcher. Two sites may be the same distance apart, but one may be prioritized or relocated to another site, due to the proximity to a community, or by other, more local expert criteria. This increases the efficacy of the WS network. In addition, in mountainous areas, such as the south of the Amazonas region, it is necessary to increase the density of the stations, since they present greater climatic variability as compared with flat areas [61].
Eleven possible distributions of new WS networks in Amazonas are presented, with different numbers and distances of new WS in each redistribution. The purpose of this is to prioritize the implementation of each distribution according to the budgets and scope of the project. As not all of them will be installed in a single project, it is recommended to prioritize points in the order from which they resulted from the iteration. Namely, if an institution other than the UNTRM intends to install a WS, it is recommended to install it at the most highly suitable point determined by this study that is of convenient proximity for administration. It is suggested that the projects intending to install WS in Amazonas should follow the order in which the positions of the new sites were identified, until the desired distance/density is reached or the budget is spent. In this way, all institutions can start contributing to the restructuring of the WS network. In addition, amateurs can access this map and install WS; Bell et al. [62] demonstrated that data from amateur observation stations can be useful for several applications.

5. Conclusions

Eleven key sub-criteria, grouped into two criteria, were identified for selecting WS sites. For Amazonas, biophysical criteria were more important than administrative criteria. Of the biophysical criteria, terrain slope (22.8%) and distance to water sources (21.4%) were the most important, while of the administrative criteria, distance to roads (36.2%) and distance to populations (32.8%) were the most important. The territory suitability map for WS indicated that 0.3% (108.55 km2) of Amazonas presents ‘highly suitable’ characteristics for installing WS. This ‘highly suitable’ territory corresponds to 26,683 polygons (of ≥30 × 30 m each), from which 100 polygons were selected in 11 possible distributions of new WS networks in Amazonas, with varying numbers of and distances to the new WS in each distribution.
In Peru, no references to this type of study have been found, therefore, a methodological framework is presented for Amazonas, which can be replicated, with the necessary complements, throughout Peru. The implementation of this methodology will be a useful support tool for the planning of WS networks.

Author Contributions

Conceptualization, N.B.R.B.; Data curation, N.B.R.B.; Formal analysis, N.B.R.B.; Funding acquisition, R.S.L., M.O.-C. and M.B.G.; Investigation, N.B.R.B., R.S.L., J.O.S.L., D.G.F., R.E.T.M., D.I.T. and E.B.; Methodology, N.B.R.B., R.S.L., J.O.S.L., D.G.F. and D.I.T.; Project administration, R.S.L., M.O.-C. and M.B.G.; Resources, R.S.L. and M.O.-C.; Software, N.B.R.B. and J.O.S.L.; Supervision, R.S.L., M.O.-C. and M.B.G.; Validation, N.B.R.B.; Visualization, N.B.R.B.; Writing—original draft, N.B.R.B.; Writing—review & editing, N.B.R.B., R.S.L., J.O.S.L. and M.O.-C. All authors have read and agreed to the published version of the manuscript.

Funding

This research was funded by Public Investment Project SNIP No. 312235—GEOMÁTICA, executed by the Instituto de Investigación para el Desarrollo Sustentable de Ceja de Selva (INDES-CES) of the Universidad Nacional Toribio Rodríguez de Mendoza de Amazonas (UNTRM).

Data Availability Statement

The data used to support the findings of this study are available from the corresponding author upon request.

Acknowledgments

The authors acknowledge and appreciate the support of the Instituto de Investigación para el Desarrollo Sustentable de Ceja de Selva (INDES-CES) of the Universidad Nacional Toribio Rodríguez de Mendoza de Amazonas (UNTRM).

Conflicts of Interest

The authors declare no conflict of interest.

References

  1. WMO. Medición de variables meteorlógicas. In Guía de Instrumentos y Métodos de Observación Meteorológicos; WMO: Genève, Switzerland, 2017; p. 773. ISBN 978-92-63-30008-9. [Google Scholar]
  2. Yildirim, V.; Nisanci, R.; Colak, E.H.; Yildiz, O. A GIS-based siting technique for automatic weather stations in Trabzon, Turkey. Weather 2016, 71, 43–49. [Google Scholar] [CrossRef]
  3. Lagouvardos, K.; Kotroni, V.; Bezes, A.; Koletsis, I.; Kopania, T.; Lykoudis, S.; Mazarakis, N.; Papagiannaki, K.; Vougioukas, S. The automatic weather stations NOANN network of the National Observatory of Athens: Operation and database. Geosci. Data J. 2017, 4, 4–16. [Google Scholar] [CrossRef]
  4. Dou, Y.; Chen, X.; Bao, A.; Li, L. The simulation of snowmelt runoff in the ungauged Kaidu River Basin of TianShan Mountains, China. Environ. Earth Sci. 2011, 62, 1039–1045. [Google Scholar] [CrossRef]
  5. Guedes, E.; de Lima, P.M.; de Oliveira, M.B.L. Neural Networks for Time Series Rainfall Forecasting: A Case Study in Manaus, Amazonas. In Proceedings of the XIII Encontro Nacional de Inteligencia Artificial e Computacional; SBC ENIAC: Recife, Brazil, 2016; pp. 337–348. [Google Scholar]
  6. Gentilucci, M.; Barbieri, M.; Burt, P.; D’Aprile, F. Preliminary Data Validation and Reconstruction of Temperature and Precipitation in Central Italy. Geosciences 2018, 8, 202. [Google Scholar] [CrossRef] [Green Version]
  7. Baltas, E.A.; Mimikou, M.A. GIS-based optimisation of the hydrometeorological network in Greece. Int. J. Digit. Earth 2009, 2, 171–185. [Google Scholar] [CrossRef]
  8. Rascón, J.; Gosgot Angeles, W.; Quiñones Huatangari, L.; Oliva, M.; Barrena Gurbillón, M.Á. Dry and Wet Events in Andean Populations of Northern Peru: A Case Study of Chachapoyas, Peru. Front. Environ. Sci. 2021, 9, 54. [Google Scholar] [CrossRef]
  9. Daneshvar, F.; Frankenberger, J.R.; Bowling, L.C.; Cherkauer, K.A.; Moraes, A.G.D.L. Development of Strategy for SWAT Hydrologic Modeling in Data-Scarce Regions of Peru. J. Hydrol. Eng. 2021, 26, 05021016. [Google Scholar] [CrossRef]
  10. Vicente-Serrano, S.M.; López-Moreno, J.I.; Correa, K.; Avalos, G.; Bazo, J.; Azorin-Molina, C.; Domínguez-Castro, F.; Kenawy, A.E.; Gimeno, L.; Nieto, R. Recent changes in monthly surface air temperature over Peru, 1964–2014. Int. J. Climatol. 2018, 38, 283–306. [Google Scholar] [CrossRef]
  11. Amorim, A.M.T.; Gonçalves, A.B.; Nunes, L.M.; Sousa, A.J. Optimizing the location of weather monitoring stations using estimation uncertainty. Int. J. Climatol. 2012, 32, 941–952. [Google Scholar] [CrossRef] [Green Version]
  12. INIA.; FAO. Peru: Segundo Informe Sobre el Estado de los Recursos Fitogenéticos Para la Alimentación y la Agricultura; INIA.: Lima, Peru, 2009. [Google Scholar]
  13. SENAMHI. Climas del Peru—Mapa de Clasificación Climática Nacional; Castro, A., Davila, C., Laura, W., Cubas, F., Ávalos, G., López, O.C., Villena, D., Valdez, M., Urbiola, J., Trebejo, I., et al., Eds.; SENAMHI: Lima, Peru, 2020. [Google Scholar]
  14. CENEPRED Plan Nacional de Gestion del Riesgo de Deastres—PLANAGERD 2014–2021; CENEPRED: Lima, Peru, 2014.
  15. Villacorta, S.; Fidel, L.; Zavala Carrión, B. Mapa de susceptibilidad por movimientos en masa del Perú. Rev. de la Asoc. Geológica Argent. 2012, 69, 393–399. [Google Scholar]
  16. Quiñones, L.; Barrena, M.; Gosgot, W.; Salas, R.; Milla, M. Estimación de la radiación solar diaria para la ciudad de Bagua, región Amazonas, Perú. Sel. Matemáticas 2019, 6, 320–328. [Google Scholar] [CrossRef] [Green Version]
  17. WMO. Siting and exposure of meteorological instruments. In Instruments and Observing Methods Report No. 55; Ehinger, J., Ed.; CIMO: Lausanne, Switzerland, 1993. [Google Scholar]
  18. An, X.; Ma, A.; Liu, D. A GIS-based Study for Optimizing the Total Emission Control Strategy in Lanzhou City. Environ. Modeling Assess. 2008, 13, 491–501. [Google Scholar] [CrossRef]
  19. Alejo, L.A. Suitability analysis for optimum network of agrometeorological stations: A case study of Visayas Region, Philippines. J. Agrometeorol. 2018, 20, 269–274. [Google Scholar]
  20. Amin, J.A.; Soriano, C.L.; Thi, K.K.; Mabli, A.B.; Alguin, M.N. Augmentation of agrometeorological stations network in southern Luzon, Philippines. Epra Int. J. Multidiscip. Res. 2021, 7, 187–197. [Google Scholar] [CrossRef]
  21. Valdés, Q.C.J.; Parra, T.J.C.; Herrera, C.S. Modelación espacial para la ubicación de estaciones meteorológicas en cuencas hidrográficas. Rev. Politécnica 2013, 9, 9–18. [Google Scholar]
  22. Iliquín Trigoso, D.; Salas López, R.; Rojas Briceño, N.B.; Silva López, J.O.; Gómez Fernández, D.; Oliva, M.; Quiñones Huatangari, L.; Terrones Murga, R.E.; Barboza Castillo, E.; Barrena Gurbillón, M.Á. Land Suitability Analysis for Potato Crop in the Jucusbamba and Tincas Microwatersheds (Amazonas, NW Peru): AHP and RS–GIS Approach. Agronomy 2020, 10, 1898. [Google Scholar] [CrossRef]
  23. Saaty, T.L. Fundamentals ofthe Analytie Hierarehy Process. In The Anal ytic Hierarchy Process in Natural Resource and Environmental Decision Making; Schmoldt, D.L., Kangas, J., Mendoza, G.A., Pesonen, M., Eds.; Springer-Science+Business Media, B.Y.: New York, NY, USA, 2001; pp. 15–36. ISBN 978-94-015-9799-9. [Google Scholar]
  24. SENAMHI. Protocolo para la Instalación y Operación de Estaciones Meteorológicas e Hidrológicas; SENAMHI: Lima, Peru, 2013. [Google Scholar]
  25. Rojas, B.N.B.; Cotrina, S.D.A.; Barboza, C.E.; Barrena, G.M.Á.; Sarmiento, F.O.; Sotomayor, D.A.; Oliva, M.; Salas, L.R. Current and Future Distribution of Five Timber Forest Species in Amazonas, Northeast Peru: Contributions towards a Restoration Strategy. Diversity 2020, 12, 305. [Google Scholar] [CrossRef]
  26. Vargas Rivera, J. Clima. In Estudios Temáticos para la Zonificación Ecológica Económica del Departamento de Amazonas; Instituto de Investigaciones de la Amazonía Peruana (IIAP) & Programa de Investigaciones en Cambio Climático, Desarrollo Territorial y Ambiente (PROTERRA): Chachapoyas, Amazonas, Peru, 2010; Volume 1, pp. 1–27. [Google Scholar]
  27. GRA.; IIAP. Zonificación Ecológica y Económica (ZEE) del Departamento de Amazonas; GRA and IIAP: Iquitos, Peru, 2010.
  28. Saaty, T.L. How to make a decision: The Analytic Hierarchy Process. Eur. J. Oper. Res. 1990, 48, 9–26. [Google Scholar] [CrossRef]
  29. Saaty, T.L. A scaling method for priorities in hierarchical structures. J. Math. Psychol. 1977, 15, 234–281. [Google Scholar] [CrossRef]
  30. Mu, E.; Pereyra-Rojas, M. Understanding the Analytic Hierarchy Process. In Practical Decision Making; Springer Briefs in Operations Research: Berlin, Germany, 2017; pp. 7–22. ISBN 978-3-319-33861-3. [Google Scholar]
  31. WMO. Guide to Agricultural Meteorological Practices; WMO: Geneva, Switzerland, 2012; ISBN 0103-9016. [Google Scholar]
  32. EPA. Meteorological Monitoring Guidance for Regulatory Modeling Applications; Epa-454/R-99-005; EPA: Washington, DC, USA, 2000; p. 171.
  33. FAO. A framework for Land Evaluation; FAO: Roma, Italy, 1976; Volume 32, ISBN 9251001111. [Google Scholar]
  34. Calle, Y.C.R.; Salas, L.R.; Cruz, S.M.O.; Barboza, C.E.; Silva, L.J.O.; Iliquín, T.D.; Rojas, B.N.B. Land Suitability for Sustainable Aquaculture of Rainbow Trout (Oncorhynchus mykiss) in Molinopampa (Peru) Based on RS, GIS, and AHP. Isprs Int. J. Geo-Inf. 2020, 9, 28. [Google Scholar] [CrossRef] [Green Version]
  35. Salas López, R.; Gómez Fernández, D.; Silva López, J.O.; Rojas Briceño, N.B.; Oliva, M.; Terrones Murga, R.E.; Iliquín Trigoso, D.; Barboza Castillo, E.; Barrena Gurbillón, M.Á. Land Suitability for Coffee (Coffea arabica) Growing in Amazonas, Peru: Integrated Use of AHP, GIS and RS. Isprs Int. J. Geo-Inf. 2020, 9, 673. [Google Scholar] [CrossRef]
  36. Buchhorn, M.; Smets, B.; Bertels, L.; De Roo, B.; Lesiv, M.; Tsendbazar, N.-E.; Herold, M.; Fritz, S. Copernicus Global Land Service: Land Cover 100 m: Collection 3: Epoch 2019: Globe (Versión V3.0.1) [Conjunto de Datos]; Zenodo: Geneva, Switzerland, 2020. [Google Scholar] [CrossRef]
  37. INEI. Resultados definitivos de los Censos Nacionales 2017: Amazonas. In Censos Nacionales 2017: XII de Población, VII de Vivienda y III de Comunidades Indígenas; INEI: Lima, Peru, 2017; pp. 1–11347. [Google Scholar]
  38. SERNANP. GEO ANP—Visor de las Áreas Naturales Protegidas. Available online: http://geo.sernanp.gob.pe (accessed on 22 May 2021).
  39. Japan Space Systems ASTER Global Digital Elevation Model. Available online: https://gdemdl.aster.jspacesystems.or.jp/index.html (accessed on 21 February 2021).
  40. SunEarthTools Sun Position. Available online: https://www.sunearthtools.com/dp/tools/pos_sun.php?lang=en (accessed on 22 August 2020).
  41. MINAM. Mapa Nacional de Ecosistemas del Perú: Memoria Descriptiva; Dirección General de Ordenamiento Territorial Ambiental: Lima, Peru, 2019. [Google Scholar]
  42. MINAM. Definiciones conceptuales de los ecosistemas del Perú; Dirección General de Diversidad Biológica: Lima, Peru, 2019. [Google Scholar]
  43. MIDAGRI. Resolución Ministerial N° 0322-2020-MIDAGRI; Oficializar el Mapa Nacional de Superficie Agrícola del Perú, detallado por departamentos, provincias y distritos: Lima, Peru, 2020.
  44. Rojas, B.N.B.; Barboza, C.E.; Maicelo, Q.J.L.; Oliva, C.S.M.; Salas, L.R. Deforestación en la Amazonía peruana: Índices de cambios de cobertura y uso del suelo basado en SIG. Bol. de la Asoc. De Geogr. Esp. 2019, 81, 1–34. [Google Scholar] [CrossRef]
  45. Strahler, A.N. Quantitative geomorphology of drainage basin and channel networks. In Handbook of Applied Hydrology; Chow, V.T., Ed.; McGraw Hill Book Company: New York, NY, USA, 1964; pp. 4–76. [Google Scholar]
  46. INGEMMET. GEOCATMIN Sistema de Información Geológico y Catastral Minero. Available online: https://geocatmin.ingemmet.gob.pe/geocatmin/ (accessed on 23 May 2021).
  47. MTC. Descarga de Datos Espaciales. Available online: https://portal.mtc.gob.pe/estadisticas/descarga.html (accessed on 2 April 2021).
  48. MINEDU. Descarga de Información Espacial del MED. Available online: http://sigmed.minedu.gob.pe/descargas/ (accessed on 15 April 2021).
  49. MINEDU. Mapa de Escuelas. ESCALE Estadística de Calidad Educativa. Available online: http://sigmed.minedu.gob.pe/mapaeducativo/ (accessed on 15 May 2021).
  50. Mighty, M.A. Site suitability and the analytic hierarchy process: How GIS analysis can improve the competitive advantage of the Jamaican coffee industry. Appl. Geogr. 2015, 58, 84–93. [Google Scholar] [CrossRef]
  51. Hossain, M.S.; Das, N.G. GIS-based multi-criteria evaluation to land suitability modelling for giant prawn (Macrobrachium rosenbergii) farming in Companigonj Upazila of Noakhali, Bangladesh. Comput. Electron. Agric. 2010, 70, 172–186. [Google Scholar] [CrossRef]
  52. Berumen, S.A.; Llamazares, F. La utilidad de los métodos de decisión multicriterio (como el AHP) en un entorno de competitividad creciente. Cuad. Adm. 2007, 20, 65–87. [Google Scholar]
  53. Aguarón, J.; Moreno-Jiménez, J.M. The geometric consistency index: Approximated thresholds. Eur. J. Oper. Res. 2003, 147, 137–145. [Google Scholar] [CrossRef]
  54. Smirnoff, A.; Huot-Vézina, G.; Paradis, S.J.; Boivin, R. Generalizing geological maps with the GeoScaler software: The case study approach. Comput. Geosci. 2012, 40, 66–86. [Google Scholar] [CrossRef]
  55. Samadi, S.; Nokhandan, M.H.; Poor, E.F.; Malbosi, S.; Alizadeh, D. Using the AHP method in site selecting of the road meteorological stations for the main roads of Khorasan Razavi province. J. Clim. Res. 2020, 1398, 93–111. [Google Scholar]
  56. Heydari, N.; Doostan, R.; Nokhandan, M.H. Site selection of urban meteorological stations in Mashhad. J. Clim. Res. 2016, 1395, 59–75. [Google Scholar]
  57. Shepherd, J.M.; Taylor, O.O.; Garza, C. A dynamic GIS-multicriteria technique for siting the NASA-Clark Atlanta urban rain gauge network. J. Atmos. Ocean. Technol. 2004, 21, 1346–1363. [Google Scholar] [CrossRef]
  58. Aybar, C.; Fernández, C.; Huerta, A.; Lavado, W.; Vega, F.; Felipe-Obando, O. Construction of a high-resolution gridded rainfall dataset for Peru from 1981 to the present day. Hydrol. Sci. J. 2020, 65, 770–785. [Google Scholar] [CrossRef]
  59. Fick, S.E.; Hijmans, R.J. WorldClim 2: New 1-km spatial resolution climate surfaces for global land areas. Int. J. Climatol. 2017, 37, 4302–4315. [Google Scholar] [CrossRef]
  60. Agarwal, A.; Marwan, N.; Maheswaran, R.; Ozturk, U.; Kurths, J.; Merz, B. Optimal design of hydrometric station networks based on complex network analysis. Hydrol. Earth Syst. Sci. 2020, 24, 2235–2251. [Google Scholar] [CrossRef]
  61. Yoon, S.; Jang, K.; Won, M. The spatial distribution characteristics of Automatic Weather Stations in the mountainous area over South Korea. Korean J. Agric. For. Meteorol. 2018, 20, 117–126. [Google Scholar] [CrossRef]
  62. Bell, S.; Cornford, D.; Bastin, L. The state of automated amateur weather observations. Weather 2013, 68, 36–41. [Google Scholar] [CrossRef]
Figure 1. Current Weather Stations (WS) in the watersheds to which the Amazonas Department belongs (a,b), in NW Peru, South America (c).
Climate 09 00169 g001
Figure 2. Methodological process with hierarchy of objectives and criteria for the selection of sites for meteorological stations in Amazonas, NW Peru.
Climate 09 00169 g002
Figure 3. (a) Decision rule for the relocation of installed weather stations (WS). The method of near analysis (NA) [54]: (b) the distance from input feature to near feature is calculated based on the Pythagorean theorem and the differences in their coordinates, and (c) an example of calculating near feature distance for circular symbols when defined as symbol diameter.
Climate 09 00169 g003
Figure 4. Suitability maps of the biophysical (ag) and administrative (hk) sub-criteria for selecting locations for weather stations in Amazonas, NW Peru.
Climate 09 00169 g004
Figure 5. Suitability maps for selecting locations for weather stations in Amazonas, NW Peru.
Climate 09 00169 g005
Figure 6. The final suitable weather stations (WS) sites and location of current weather stations (WS) in Amazonas, NW Peru.
Climate 09 00169 g006
Table 1. Sub criteria scoring for selecting weather station sites in Amazonas, NW Peru.
Criteria/Sub-CriteriaHighly
Suitable (4 1)
Moderately
Suitable (3 1)
Marginally
Suitable (2 1)
Not Suitable
(1 1)
Adapted from
Biophysical
Elevation (120–4900)2200–4900 m a.s.l.1090–2200 m a.s.l.120–1090 m a.s.l.[7]
Terrain slope≤5%5–15%15–25%≥25%[17]
Terrain hillshade0–4 h5–7 h8–10 h11–13 h[2]
Land Use/Land Cover–LU/LC 24020, 30, 60>1000, 50, 80, 90[19]
Distance to water bodiesMain≥1 km0.5–1 km0.25–0.5 km≤0.25[1,2,24]
Secondary≥0.5 km0.25–5 km0.1–0.25 km≤0.1[1,2,24]
Distance to geological faults≥1.5 km1–1.5 km0.5–1 km≤0.5 km[2]
Landslide susceptibilityVery low; LowMediumHighVery high[2]
Administrative
Distance to roadsNational0.3–0.7 km0.7–1.2 km1.2–2.2 km≤0.3/≥2.2 km[1,2,24]
Departmental0.2–0.6 km0.6–1.1 km1.1–2.1 km≤0.2/≥2.1 km[1,2,24]
Local0.1–0.5 km0.5–1 km1–2 km≤0.1/≥2 km[1,2,24]
Distance to populationsUrban areas0.2–0.6 km0.6–1.1 km1.1–2.1 km≤0.2/≥2.1 km
Villages0.1–0.5 km0.5–1 km1–2 km≤0.1/≥2 km
Distance to the host institution≤10 km10–50 km50–100 km≥100 km[19]
Protected natural areas—PNAInsideOutside[24]
1 Pixel value of the map reclassified according to the four levels of land suitability. 2 CGLS-LC100 [36]: 0—NoData, 20—Shrubs, 30—Herbaceous vegetation, 40—Cropland, 50—Urban/built up, 60—Bare/sparse vegetation, 80—water bodies, 90—Herbaceous wetland, and >100–all the forests.
Table 2. Scale established for the allocation of value judgments between two criteria in peer comparison matrices (PCM).
1/91/81/71/61/51/41/31/2123456789
ExtremeStrongModerateEqualModerateStrongExtreme
less importantmore important
Table 3. Random index (RI) to determine the consistency ratio (CR) of peer comparison matrices (PCM).
n12345678910111213141516
RI000.5250.8821.1151.2521.3411.4041.4521.4841.5131.5351.5551.5701.5831.595
Table 4. Importance weights (%) for the second and third hierarchies of criteria for selecting sites for weather stations in Amazonas, NE Peru.
CriteriaWeight (%)RankSub-CriteriaWeight (%)RankStandardized Weight (%)Standardized Rank
Biophysical68.31elevation9.156.27
terrain slope22.8115.61
terrain hill shade16.2311.14
land use/land cover–LU/LC15.3410.45
distance to water sources21.4214.62
distance to geological faults8.866.09
landslide susceptibility6.474.410
Administrative31.82distance to roads36.2111.53
distance to populations32.8210.46
distance to host institution19.136.18
protected natural areas–PNA11.943.811
Table 5. Suitability area for sub-criteria to select weather station sites in Amazonas, NW Peru.
CriteriaSub-CriteriaHighly SuitableModerately SuitableMarginally SuitableNot Suitable
km2%km2%km2%km2%
Biophysicalelevation9074.7921.612,653.0830.120,322.5048.30.000.0
terrain slope1401.333.36746.9616.08253.5419.625,648.5561.0
terrain hill shade1273.103.038,736.1192.11457.693.5583.471.4
land use/land cover6370.3915.13338.057.931,968.0476.0373.890.9
distance to water sources22,745.0854.18202.4219.55512.1713.15590.7013.3
distance to geological faults23,594.5356.15077.3312.16106.7414.57271.7817.3
landslide susceptibility9825.6723.413,935.9733.113,380.9931.84907.7411.7
Administrativedistance to roads (km)2466.985.92276.155.43167.667.534,139.5981.2
distance to populations (km)1090.422.62156.415.14953.4811.833,850.0780.5
distance to the host institution3821.349.126,049.8661.97972.2019.04206.9710.0
protected natural areas6157.5014.635,892.8785.40.000.00.000.0
Table 6. Areas of suitability of sub-models for selecting sites for weather stations in Amazonas, NW Peru.
Criteria/Sub GoalHighly SuitableModerately SuitableMarginally SuitableNot Suitable
km2%km2%km2%km2%
Biophysical228.010.525,070.5959.616,646.3539.6105.420.3
Administrative663.451.64135.809.826,997.7664.210,253.3724.4
Land suitability for weather stations108.550.320,562.5248.921,274.8950.6104.410.2
Table 7. Suitability of the existing WS sites and very suitable locations closer to them in Amazonas, NE Peru.
WS IDWS NameCurrent SuitabilityNearest Highly Suitable Territory
Distance (m)Coordinates (◦)
1Agua Dulcemoderate 243.9−77.8791−5.6906
2Chachapoyasmoderate171.0−77.8515−6.2339
3Baguamoderate58.1−78.5113−5.6448
4Cocachimbamoderate2153.8−77.8943−6.0773
5Huambomoderate 117.1−77.5237−6.4373
6Ollerosmoderate838.4−77.6574−6.0667
7Leimebambamoderate81.4−77.7987−6.7234
8Luya Viejomoderate83.6−78.0285−6.1384
9Molinopampamoderate704.9−77.6718−6.2206
10Pomacochasmoderate254.2−77.9632−5.8228
11Suyubambamarginal1124.0−77.9546−5.9259
12Congonmarginal2387.0−78.1210−6.3128
13Jazanmarginal1783.9−77.9696−5.9598
14Baguamoderate0.9−78.5340−5.6614
15Jamalcamoderate177.1−78.2335−5.8912
16El Paltomoderate196.6−78.4726−5.9998
17Aramangomarginal1828.3−78.4443−5.4339
18Chiriacomarginal956.8−78.2965−5.1631
19Santa María de Nievamoderate270.8−77.9390−4.8328
20Chachapoyashigh
Publisher’s Note: MDPI stays neutral with regard to jurisdictional claims in published maps and institutional affiliations.

