Article

Biogeographic Distribution of Cedrela spp. Genus in Peru Using MaxEnt Modeling: A Conservation and Restoration Approach

by
Alexander Cotrina Sánchez
1,*,
Nilton B. Rojas Briceño
1,*,
Subhajit Bandopadhyay
2,
Subhasis Ghosh
3,
Cristóbal Torres Guzmán
1,
Manuel Oliva
1,
Betty K. Guzman
1 and
Rolando Salas López
1
1
Instituto de Investigación para el Desarrollo Sustentable de Ceja de Selva (INDES-CES), Universidad Nacional Toribio Rodríguez de Mendoza de Amazonas, Chachapoyas 01001, Peru
2
Department of Ecology and Environmental Protection, Poznan University of Life Sciences, Piatkowska 94, 60-649 Poznan, Poland
3
Geoinformatics and Remote Sensing Cell, West Bengal State Council of Science & Technology, Government of West Bengal, Kolkata 700091, India
*
Authors to whom correspondence should be addressed.
Diversity 2021, 13(6), 261; https://doi.org/10.3390/d13060261
Submission received: 1 May 2021 / Revised: 4 June 2021 / Accepted: 7 June 2021 / Published: 10 June 2021

Abstract

:
The increasing demand for tropical timber from natural forests has reduced the population sizes of native species such as Cedrela spp. because of their high economic value. To prevent the decline of population sizes of the species, all Cedrela species have been incorporated into Appendix II of the Convention on International Trade in Endangered Species of Wild Fauna and Flora (CITES). The study presents information about the modeled distribution of the genus Cedrela in Peru that aims to identify potential habitat distribution of the genus, its availability in areas protected by national service of protected areas, and highlighted some areas because of their conservation relevance and the potential need for restoration. We modeled the distribution of the genus Cedrela in Peru using 947 occurrence records that included 10 species (C. odorata, C. montana, C. fissilis, C. longipetiolulata, C. angustifolia, C. nebulosa, C. kuelapensis, C. saltensis, C. weberbaueri, and C. molinensis). We aim to identify areas environmentally suitable for the occurrence of Cedrela that are legally protected by the National Service of Protected Areas (PAs) and those that are ideal for research and restoration projects. We used various environmental variables (19 bioclimatic variables, 3 topographic factors, 9 edaphic factors, solar radiation, and relative humidity) and the maximum entropy model (MaxEnt) to predict the probability of occurrence. We observed that 6.7% (86,916.2 km2) of Peru presents a high distribution probability of occurrence of Cedrela, distributed in 17 departments, with 4.4% (10,171.03 km2) of the area protected by PAs mainly under the category of protection forests. Another 11.65% (21,345.16 km2) of distribution covers areas highly prone to degradation, distributed mainly in the departments Ucayali, Loreto, and Madre de Dios, and needs immediate attention for its protection and restoration. We believe that the study will contribute significantly to conserve Cedrela and other endangered species, as well as to promote the sustainable use and management of timber species as a whole.

1. Introduction

Forest covers have been reduced drastically in the Peruvian Amazon region over the last few decades as a result of agricultural expansion and livestock activities, deforestation, mining, and urban expansion [1,2]. In Peru, 2,433,314 ha of Amazonian forests have been lost during 2001–2019 [3]. Although the tropical Amazon forest covers about 60% of Peru [4], it has now been highly fragmented because of the forest harvesting activities. The need for more agricultural land also promoted heavy migratory agricultural practices, [5] eliminating approximately 0.5 ha of forest cover for crop production [6,7]. As a result of such growing land-use changes induced by migratory agriculture and cattle ranching, many native species, including genus Cedrela, are now experiencing massive destruction of their habitats [8]. In addition, the selective falling of trees, mainly of species having high economic values, has also caused the near extinction of many vegetation species such as mahogany (Swietenia macrophylla) and cedar (Cedrela odorata) [9].
Cedrela is a genus of tropical trees that includes species such as C. odorata L. and C. fissilis Vell., which had been collected for wood for more than 500 years in Central and South America, with C. odorata being the second most demanded tropical wood [10,11,12,13]. Worldwide, this genus has 17 recognized species [13,14], out of which Peru alone has 10. Hence, Peru can be considered as a center of diversity for Cedrela species [15], which currently includes three endemic species with restricted distribution, i.e., C. molinensis, C. longipetiolulata, and C. weberbaueri [16]. However, because of the high economic value of the genus Cedrela species, their usage had started increasing since the end of the 1980s, mainly in Mexico, Brazil, Peru, and Bolivia [17,18]. Such overexploitation eventually resulted in the near-extinction of the Cedrela population and made the international conservation community call for its greater protection under the Convention on International Trade in Endangered Species of Wild Fauna and Flora (CITES). In Peru, the National Forest and Wildlife Service (SERFOR) has also recently incorporated the populations of genus Cedrela (C. odorata, C. montana, C. fissilis, C. longipetiolulata, C. angustifolia, C. nebulosa, C. kuelapensis, C. Saltensis, C. weberbaueri, and C. molinensis) in Appendix II of CITES on 28 August 2020.
This alarming situation indicates a strong need for further research studies that may effectively contribute to decision making related to the sustainability and conservation of biodiversity of the Cedrela and its habitat. Species distribution models (SDMs) are tools that combine species presence data with factors such as bioclimatic, edaphic, topographic, etc. and allow more effective and generous support for species conservation, biogeography, and climate change actions [19,20,21,22,23]. SDMs have made it possible to identify the distribution of timber forest species [24,25], other endemic species [26], wildlife [27,28], etc. on a regional scale facilitating proper identification, protection, and conservation of the endangered ones [29,30]. Among all the available SDMs, the maximum entropy algorithm (MaxEnt) [31] is one of the most widely used algorithms to find out the distribution of species under current and future conditions [32,33]. This way, MaxEnt allows habitat mapping and produces credible, defensible, and repeatable information, which contributes to a structured and transparent process of sustainable natural resources management by predicting the possible degradation of potential forest areas with species under risk in the future climate change scenarios [34].
After identifying the potential distribution areas of a species, the areas having the best aptitude to carry out reforestation or recovery initiatives of degraded areas are needed to be quantified and monitored properly. Such restoration is of great interest since 13.78% (177,592.82 km2) of the Peruvian territory has been identified as degraded areas as a consequence of deforestation, livestock activities, agriculture, mining, forest fires, etc. [35]. The strategies to be implemented must be oriented to the restoration and/or conservation of threatened species that are widely distributed over the geographic spaces integrated into the territorial order using environmental services, ecotourism, management of renewable resources, and productive practices promoted through Protected Natural Areas (PNAs) initiative [36].
The study has two main objectives—firstly, 00 10 available species of genus Cedrela (i.e., C. odorata, C. montana, C. fissilis, C. longipetiolulata, C. angustifolia, C. nebulosa, C. kuelapensis, C. Saltensis, C. weberbaueri and C. molinensis) over the Peruvian territory using the MaxEnt model in a current scenario, and secondly, to identify the locations of Cedrela within the designated conservation areas (to evaluate its effectiveness in conserving the species’ habitat) and degraded areas (to implement forest restoration practices using these species). The study considered sample location information of the Cedrela species (947 geographical records) and 33 different variables (19 bioclimatic variables, 3 topographic, 9 edaphic, solar radiation, and relative humidity).

2. Materials and Methods
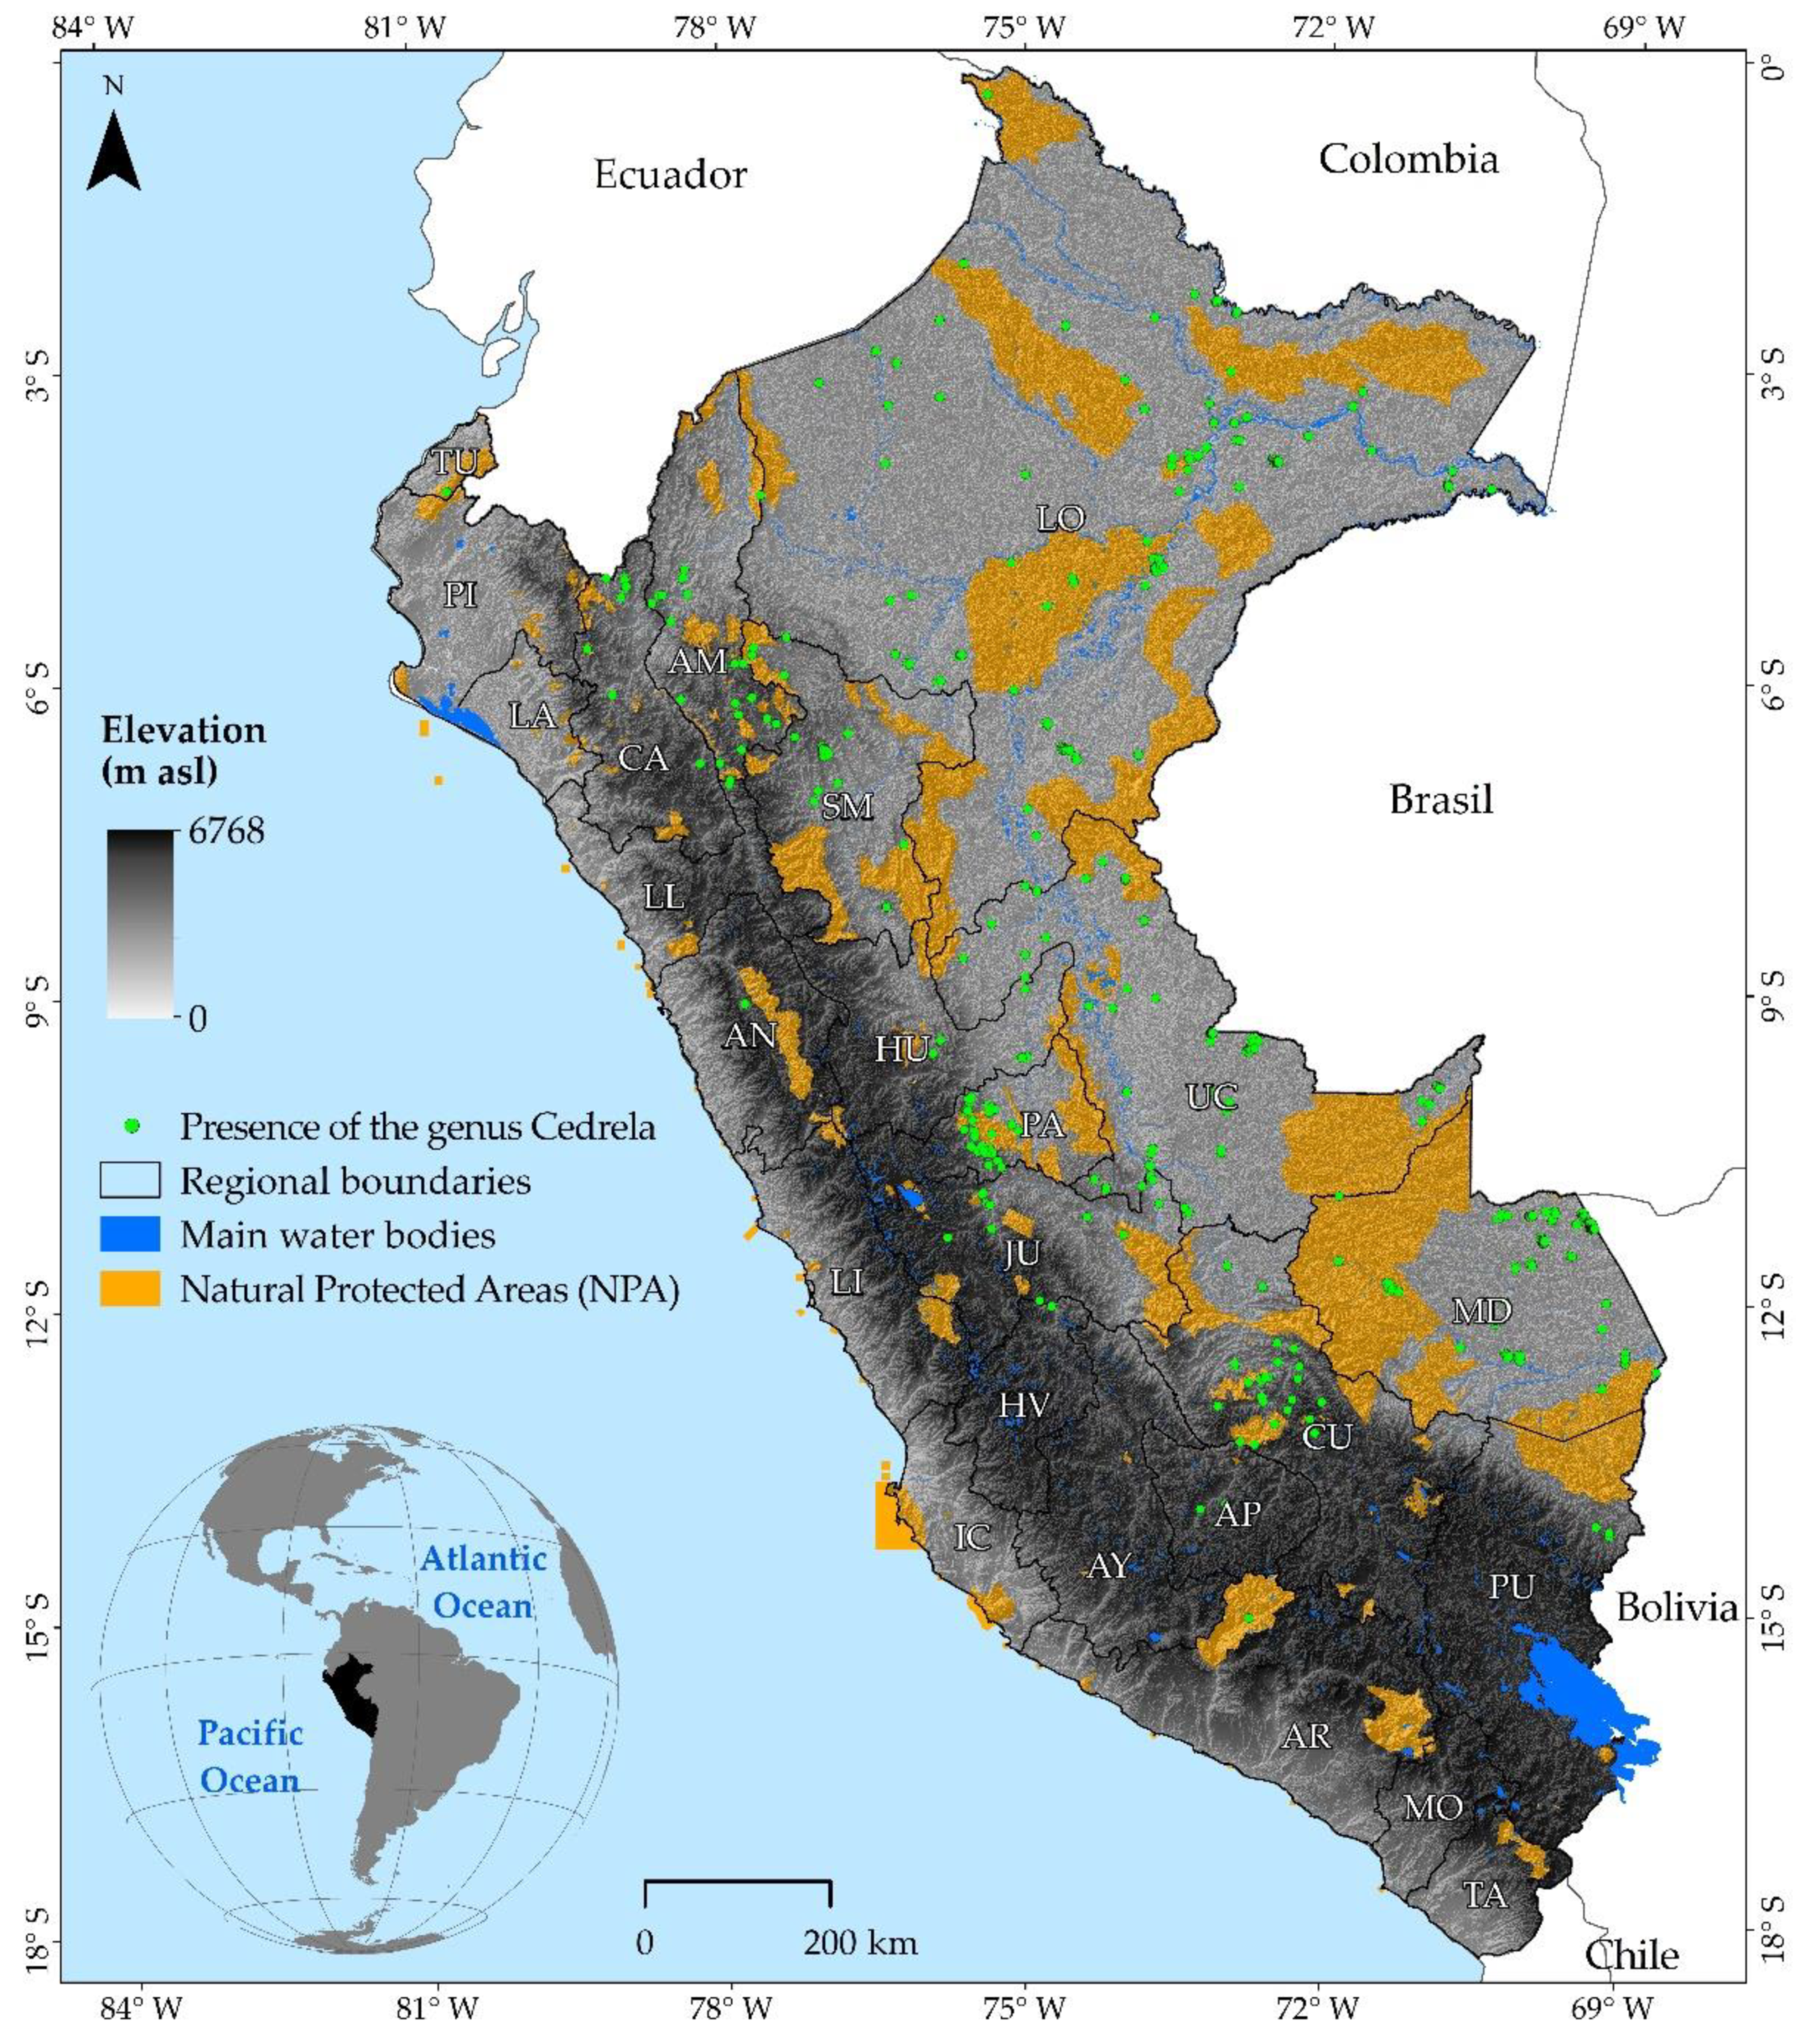
2.1. Study Area

This study covers the entire territory of Peru (1,300,000 km2 approx.) located between the parallels of 0°03′00″ and 18°30′0″ south and the meridians of 68°30′00″ and 81°30′00″ west, sharing borders with Ecuador and Colombia to the north, Brazil to the east, Bolivia to the southeast, Chile to the south, and the Pacific Ocean to the west. The altitudinal gradient of this region starts from 0 m above sea level (a.s.l.) in the north and goes up to 6800 m above sea level (Mataraju Mountain). Almost 60% of the study area is covered by the Amazon rainforest, which is characterized by heavy rainfall and high temperatures, except for its southernmost part, which has cold winters and seasonal rainfall. The Protected Natural Areas (PNAs) belong to the National System of Natural Areas Protected by the State (SINANPE) [36]. These broadly include regional conservation areas, private conservation areas, national sanctuary, historic sanctuary, wildlife refuge, national reserve, communal reserve, national park, and hunting and protection forest scattered all over the study region (Figure 1).

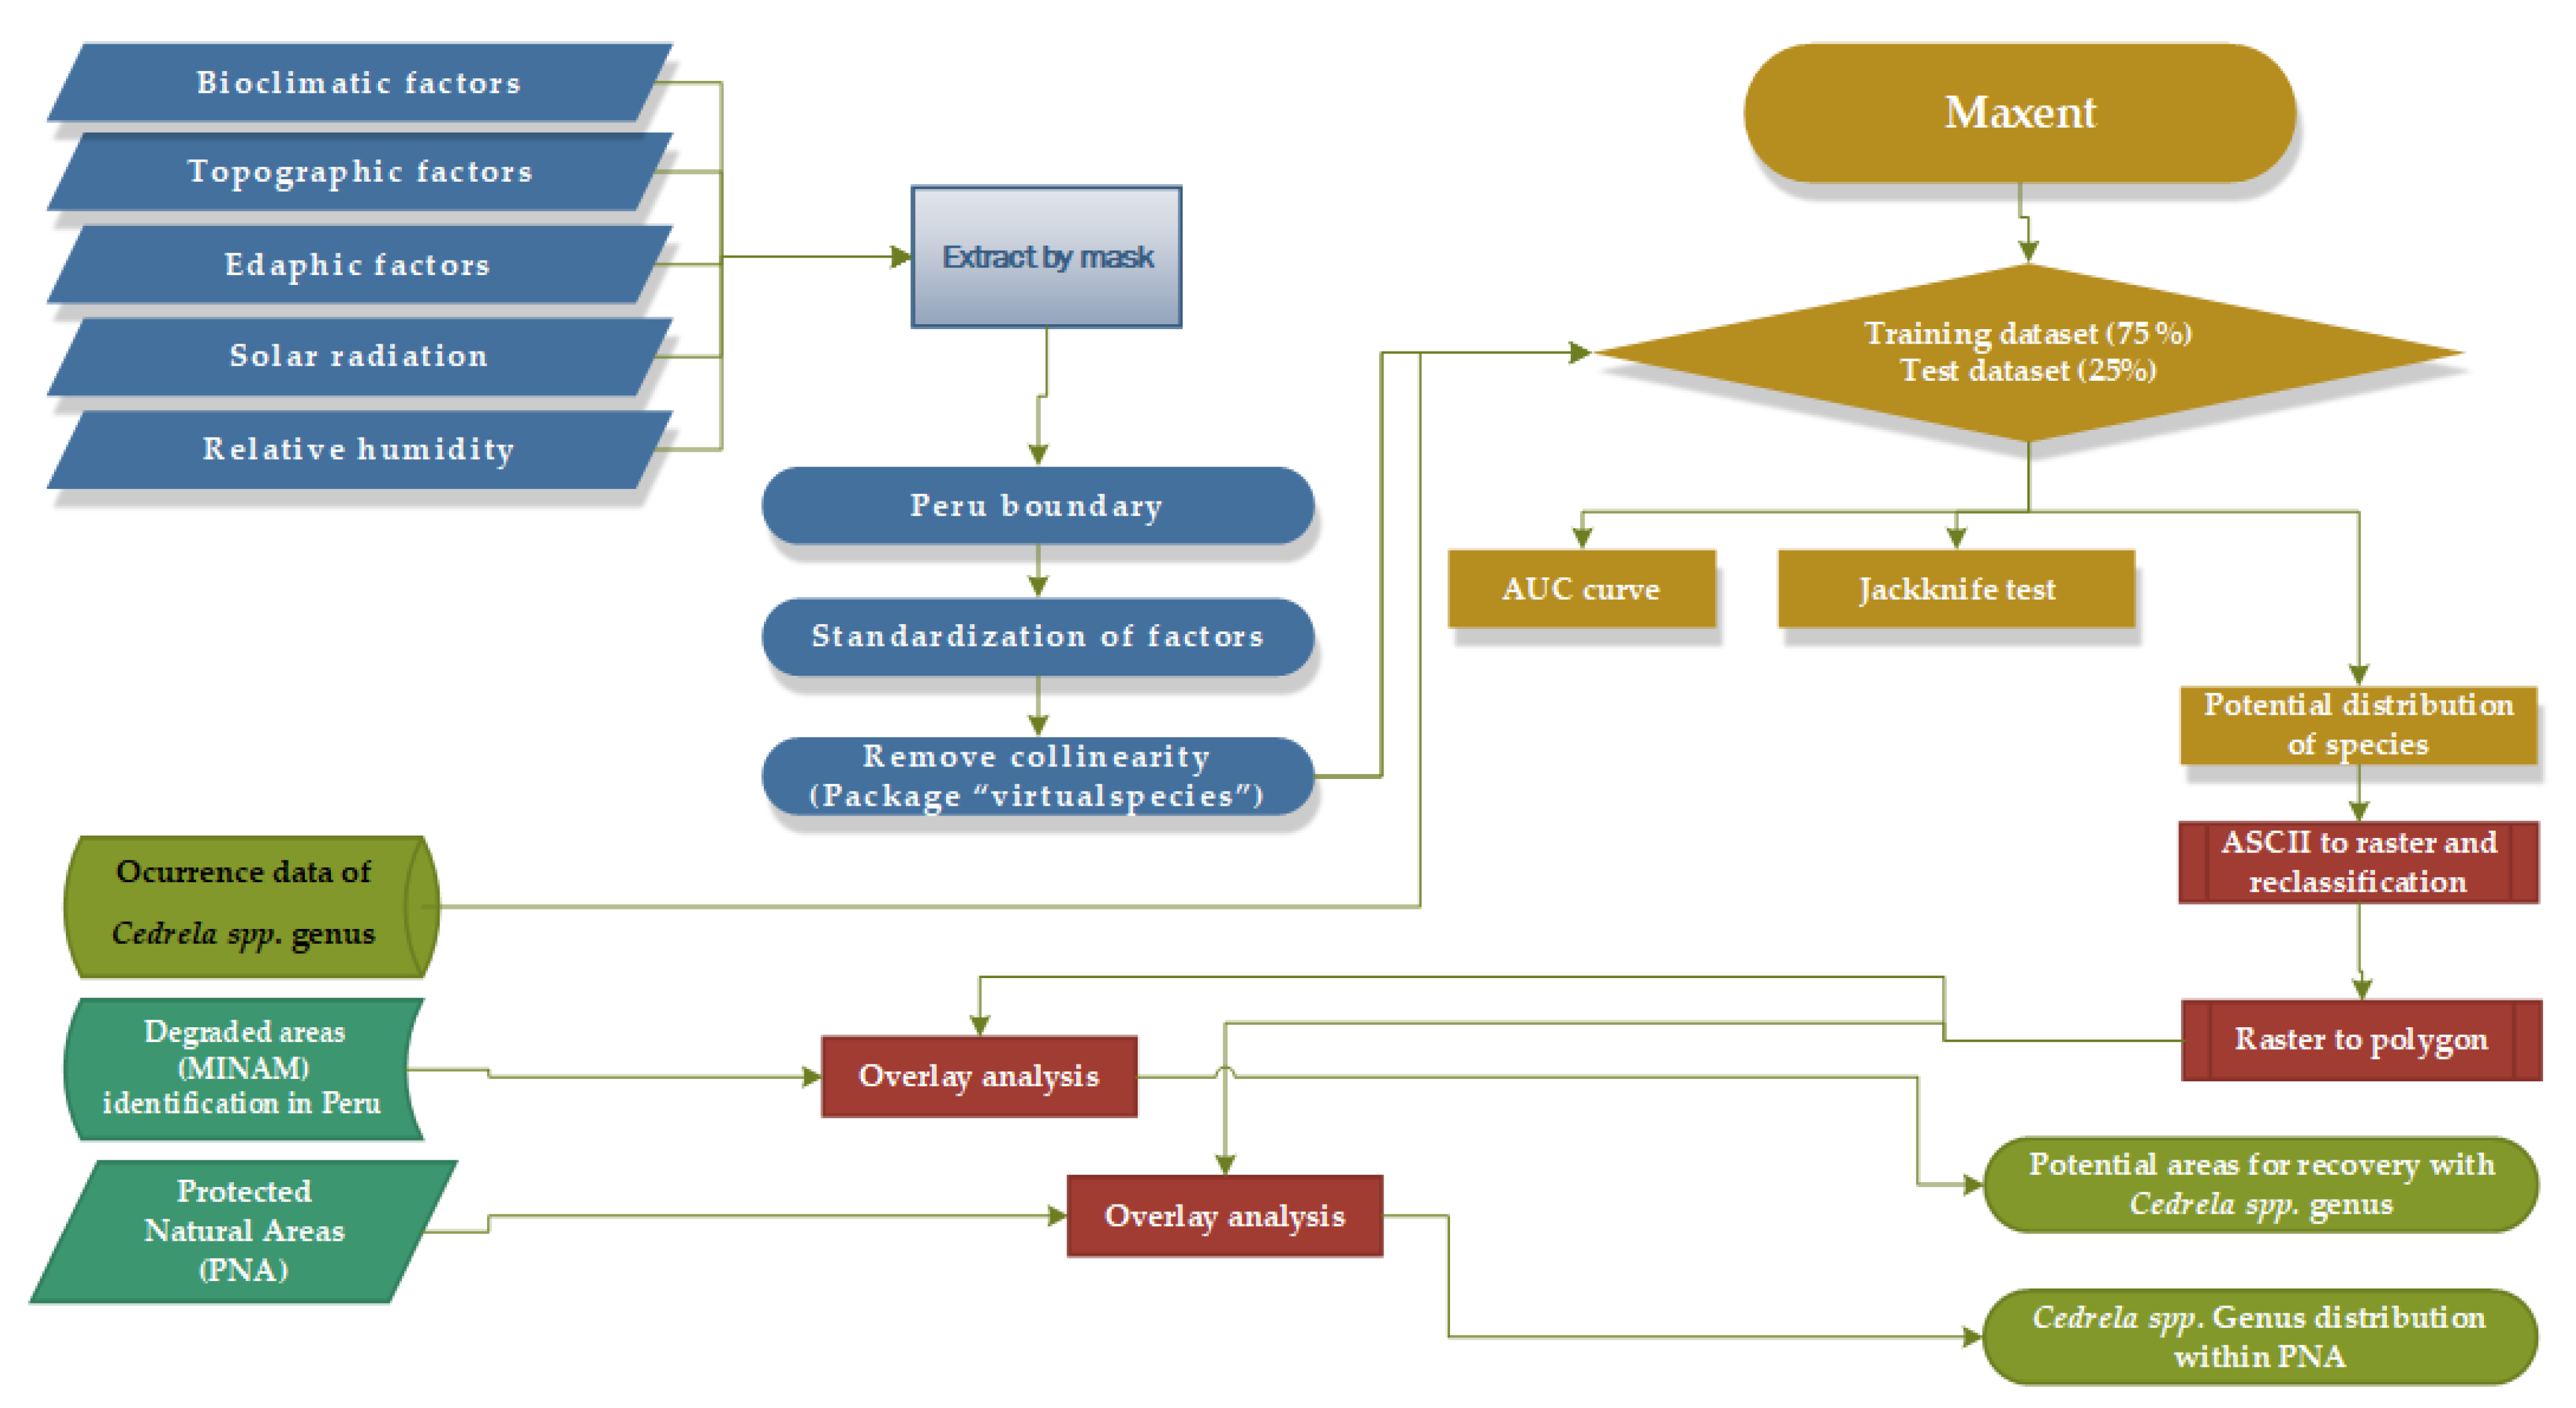
2.2. Dataset and Methodological Design

The methodological framework used in the present study has been described graphically in Figure 2. From the cartographic standardization through the rescaling in the raster calculator of Qgis 3.16, 33 variables at a spatial resolution of 250 m were derived as input for use in modeling with MaxEnt. The bioclimatic information under current conditions (average 1970–2000) with a spatial resolution of 30 s (~1 km) was obtained from Woldclim version 2.1 (https://www.worldclim.org/data/worldclim21.html; accessed on 5 January 2021) [37]. Topographic factors such as elevation, slope, slope, and ground orientation were obtained from the 90 m spatial resolution DEM generated by the Shuttle Radar Topography Mission (SRTM) [38], United States Geological Survey (USGS) (http://srtm.usgs.gov; accessed on 28 December 2020). The edaphic variables were collected from SoilGrids 0.5.3 (http://soilgrids.org; accessed on 15 January 2021) with a spatial resolution of 250 m.
Likewise, the geographic occurrence data of 10 target species of the genus Cedrela to be used in the MaxEnt model were obtained from GBIF’s Global Biodiversity Information Service (https://www.gbif.org/; accessed on 1 February 2021) through “Species Explorer” plug-in of QGIS software. The registration information of CITES species was obtained from the Ministry of the Environment of Peru (https://geoservidor.minam.gob.pe/recursos/intercambio-de-datos/; accessed on 18 February 2021). Finally, to identify the locations of Cedrela habitats within the protected areas, and the areas prone to degradation but having high suitability for genus Cedrela habitat, the modeled potential distribution result was overlaid with the degraded areas identified by the Ministry of Environment (MINAM) and the spaces conserved by the National Service of Natural Areas Protected by the Peruvian State (SERNANP). These degraded areas were identified by the ministry mainly based on deforestation, soil erosion, forest fires, mining, illegal logging, etc.

2.3. Geographical Records of Forest Species

The geographic coordinates of the 10 species of the genus Cedrela (Table 1) were obtained using the GBIF and Species Explorer plug-ins in QGIS 3.16 software. It was also complemented with the records of the presence of Cedrela, obtained from the Ministry of Environment of Peru. The CITES species information was collected from the systematization of forest inventories, review of national herbaria which is available in its geoservidor (https://geoservidor.minam.gob.pe/recursos/intercambio-de-datos/; accessed on 18 February 2021), and information related to the species of the genus Cedrela was separated. The data were then re-sampled at a spatial resolution of 250 m [39] by visually excluding those samples that were falling within lagoons, rivers, and roads, or urban areas. Finally, 947 resulting data were exported into CSV to be used for modeling in MaxEnt (https://biodiversityinformatics.amnh.org/open_source/maxent/; accessed on 10 November 2020).

2.4. Bioclimatic, Physiographic, and Soil Variables

The spatial distribution of species within a geographic area dependson the interaction with several environmental factors that contribute to their development and coexistence [40]. Considering this, 33 variables were selected (Table 2) to carry out the modeling. These variables include 19 bioclimatic and solar radiation obtained from WorldClim 2.1 (https://www.worldclim.org/; accessed on 5 January 2021) [37]; 3 topographic derived from digital elevation model (DEM) obtained from the United States Geological Survey (USGS) web portal (http://srtm.usgs.gov; accessed on 28 December 2020); the relative humidity obtained from the Climate Research Unit (CRU) [41] (www.cru.uea.ac.uk; accessed on 1 May 2021); and 9 soil properties collected from SoilGrids 0.5.3 (http://soilgrids.org; accessed on 15 January 2021) [42]. All variables were rescaled into a spatial resolution of 250 m to overcome the issues such as collinearity between variables, which causes overfitting problems, increases uncertainty, and decreases the statistical power of the model [43]. Therefore, using the function “remove collinearity” from the package “virtual species” [44] in R 3.6, the variables were grouped (clustering) according to the Pearson correlation coefficient, and only variables having Pearson’s r ≥ 0.7 were considered. This threshold is an acceptable measure to minimize the multicollinearity of fitted models [43].
To select an important variable for each cluster, a preliminary MaxEnt model was run (the configuration is explained in Section 3.2.) using all the variables. The variable with the best performance in the Jackknife test [25] was selected (i.e., the smallest difference in regularized training gains obtained from a model generated with all criteria except that of interest and a model generated only with the criterion of interest [21] (Table 2).

2.5. Execution of the Model

The biogeographic distribution model for the 10 species of the genus Cedrela was performed using a maximum entropy algorithm [31] which estimates the probability of potential distribution of each species from the presence data (location) using the open-source software MaxEnt ver. 3.4.1 (https://biodiversityinformatics.amnh.org/open_source/maxent/; access on 10 November 2020). For the validation of this model, 75% of the randomly selected presence data were used for training purposes, and 25% were used for validation [31]. The algorithm was run using 100 repetitions in 5000 iterations with different random partitions (Bootstrap method), and other configurations (i.e., extrapolation, graph drawing, etc.) were kept as default [45].
The resulting model was validated based on the area under the curve (AUC) calculated from the operating characteristic of the receptor (ROC) [31,46,47]. According to the AUC values, five performance levels were differentiated: excellent (>0.9), good (0.8–0.9), accepted (0.7–0.8), poor (0.6–0.7) and invalid (<0.6) [46,48]. We used the logistic output format to obtain the model of the 10 evaluated species by generating a raster of continuous values in a range from 0 to 1. The raster obtained was further reclassified into four ranges: (1) “high potential” habitat (>0.6), (2) “moderate” habitat (0.4–0.6), (3) “low potential” habitat (0.2–0.4), and (4) “no potential” habitat (<0.2) [24,25,28,48].

2.6. Identification of Potential Areas for Restoration and Conservation

Subsequently, the areas of high distribution potential were overlapped with the Protected Natural Areas (PNA) information obtained from GeoServer (https://geo.sernPNA.gob.pe/visorsernPNA/; access on 18 February 2021) of the National Service of Natural Areas, which is protected by the State (SERNPNA) to promote conservation of the genus Cedrela, currently considered as endangered and overexploited in Peru.
Similarly, the raster layer (30 m resolution) of degraded areas as identified by the Ministry of the Environment of Peru (MINAM) in 2019 was also obtained from its geoservidor, (https://geoservidor.minam.gob.pe/recursos/intercambio-de-datos/; access on 18 February 2021) and overlapped with the potential distribution of Cedrela. Finally, the distribution surfaces of the 10 species within the PAs and degraded areas were quantified. This way, the analysis had made it possible to identify the protected areas that conserve the genus Cedrela and those degraded spaces that could be restored with one or more of the species under study.

3. Results

3.1. Model Performance and the Importance of Environmental Variables

Model performance evaluation aims to estimate the accuracy of machine learning-based prediction models and ensures confidence in the results obtained. The performance of this model obtained an area under the curve (AUC) value of 0.866 (Figure 3a), which is considered good (0.8 < AUC < 0.9). The response curves (Figure 3b–n) reflect the dependence of predicted suitability, both on the selected variable and on dependencies induced by correlations between the selected variable and other variables. Overall, 83% of the potential distribution of Cedrela was found to be driven mainly by four environmental variables, i.e., bio19 (precipitation of coldest quarter), soc (organic carbon), dem (elevation above mean sea level), and cec (cation exchange capacity) (Table 3). On the other hand, silt (slime content), bdod (bulk density of the fine earth fraction), and nitrogen were the three environmental variables that contributed the least. Figure 3o shows the results of jackknife test of variable importance. The environmental variable that reported the highest gain when used in isolation was bio19, which therefore appeared to have the most useful information by itself. The environmental variable that decreased the gain the most on its omission was dem, which therefore appeared to have the most information that was not present in the other variables. Likewise, the Jackknife test (Figure 3o) identified that the variables bio 19 (coldest quarter precipitation), bio 12 (annual precipitation), soil pH, and elevation (DEM) contributed highly to the biogeographic distribution model of the Cedrela species.

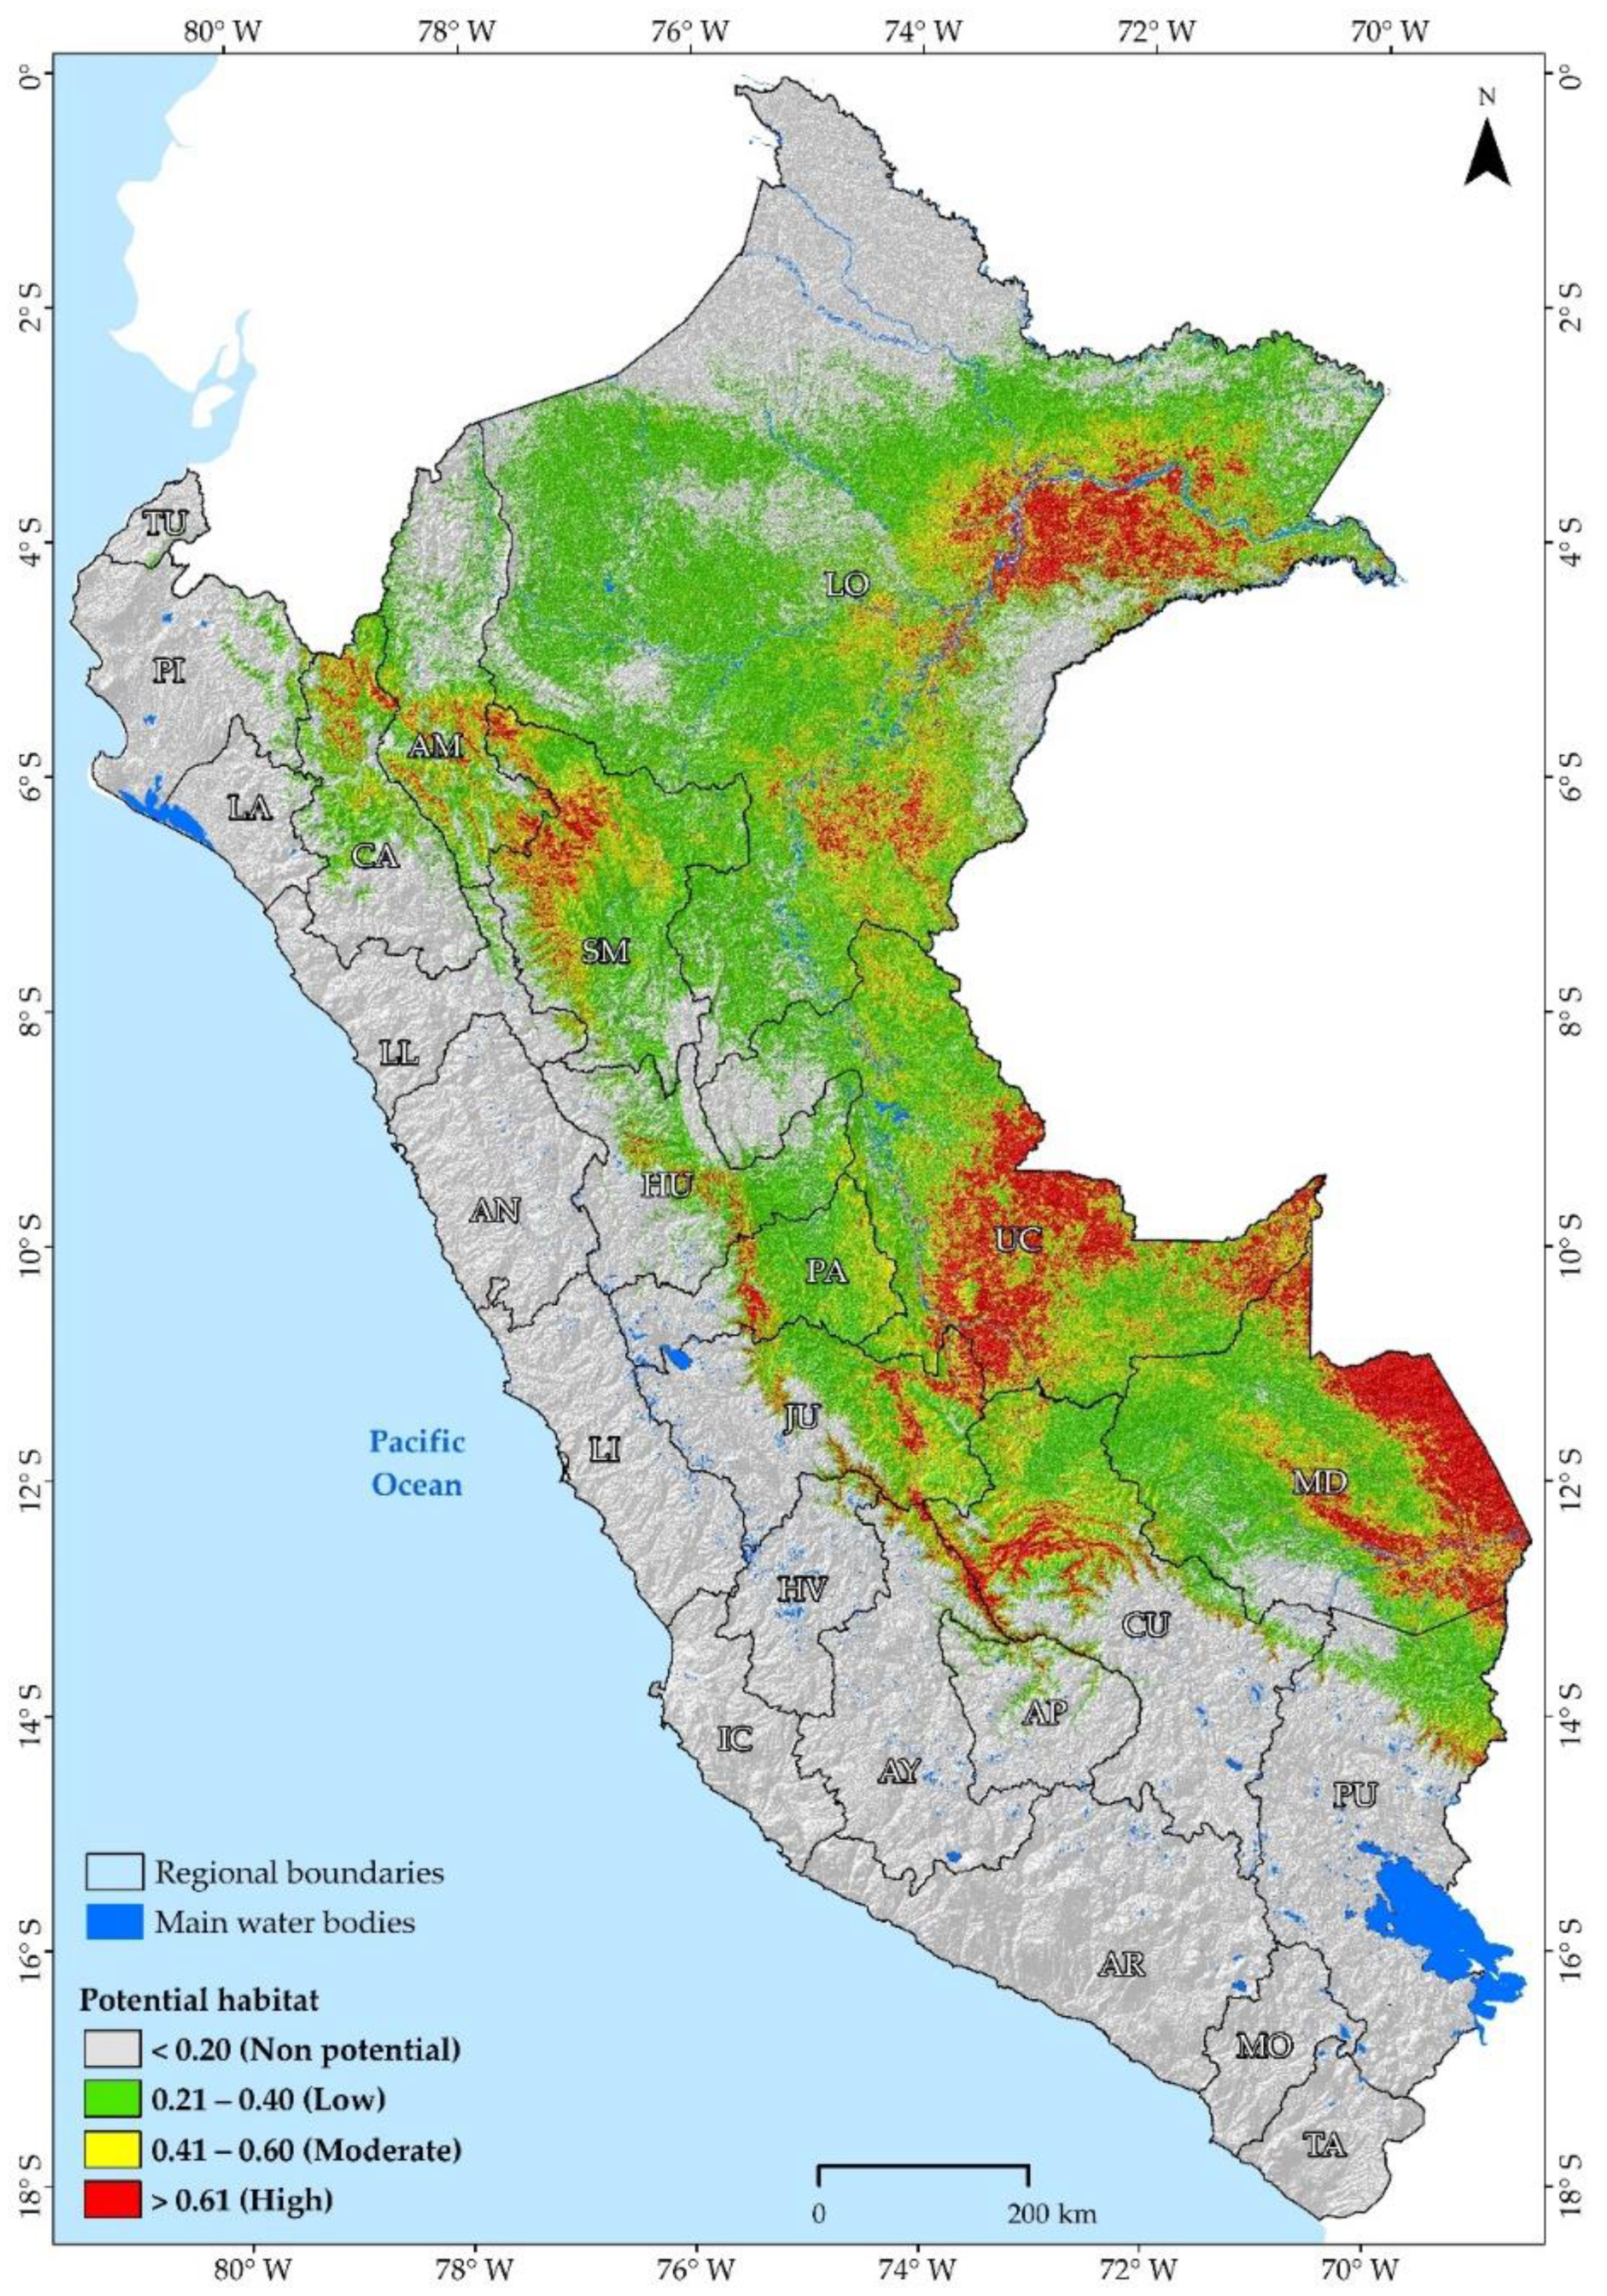
3.2. Potential Distribution of the Genus Cedrela

The areas of a high probability of occurrence of genus Cedrela under present climatic and environmental conditions were identified mainly across the lowland Amazonia, covering 86,916.2 km2 (6.7%) area of the study region. This potential habitat distribution covers about 17 regions of the Peruvian territory (Figure 4) with a high concentration in the departments of Ucayali (23,322.04 km2), Loreto (22,842.3 km2), and Madre de Dios (20,755.7 km2) (Table 4).

3.3. High-Priority Areas for Research, Conservation, and Restoration

The study identified that 4.4% (10,171.03 km2) of the areas of the high-occurrence probability of genus Cedrela was distributed in the designated Peruvian conservation areas (Figure 5a), out of which the PNA cover of 35.5% (8995.64 km2) was distributed among the reserved zones (85.18 km2), national sanctuary (130.76 km2), historic sanctuary (20.18 km2), wildlife refuge (0.13 km2), national reserve (2323.46 km2), communal reserve (1023.63 km2), national park (5000.93) and protection forest (411.37 km2). The distribution also included conservation areas administered by regional governments (1020.71 km2), and by individuals or institutions at a private level through private conservation areas, whose high-occurrence potential covered a total of 154.68 km2 (Table 5) area of the study region.
After compiling the potential habitat distribution results with the information on degraded areas, a high-distribution potentiality of genus Cedrela was observed over 20,857.0 km2 areas of the central and western parts of Peru (accounts for 11.4% of the study area) that are highly prone to degradation (Table 6). In other words, with proper conservation and management practices in these areas, 11.4% of degraded Peruvian Amazon can be potentially restored.

4. Discussion

4.1. Potential Distribution of Genus Cedrela

Our study is the first attempt that makes use of SDMs as a probabilistic decision-making tool [49], which allows the prediction and identification of geographic spaces of the genus Cedrela [50] through maximum entropy modeling technique [51]. The proposed model can be applied at regional [24,25] to national scale [52,53,54] that will significantly contribute to the decision-making system for the Peruvian Amazon authorities. Our model is evident with higher accuracies represented by the strong AUC values of 0.866. Among different topographic and bioclimatic variables, altitude emerges as the most significant variable, which proved to be a determining factor in distribution ranges [24,25]. Species such as C. montana and C. lilloi, are mostly located and distributed at the higher altitudes. However, the distribution of species depends on the biogeographic conditions and also has a strong influence on historical or evolutionary constraints along with biogeographical, physiological, and ecological factors [55]. In this study, we observed that the 10 species of the genus Cedrela covered 17 departments related to the National Forestry and Wildlife Service, as of 2021 [16], and evaluated the location of botanical collections and inventories of the species [13,53,54]. Overall, the modeled distribution of genus Cedrela will also help to understand the historic evaluation of genus Cedrela species under a spatiotemporal framework. Therefore, we believe that our modeling framework will help in the future in order to establish forest management strategies.

4.2. Conservation and Restoration of Genus Cedrela

Peru is one of the most megadiverse countries in the world and is enriched with the biogeographic distribution of various species that requires the implementation of adequate strategies for species conservation [56,57]. Among the 10 species of genus Cedrela, C. odorata is currently one of the important timber species, threatened by deforestation and unsustainable logging [58]. However, the PAs that harbor C. odorata, together with the other species of the Cedrela genus (10,171.03 km2), will allow the implementation of mechanisms to maintain its population and genetic diversity, given that the PAs constitute territorial protection reserves [59,60]. Similarly, the degraded areas are the result of anthropogenic pressure and forest fires in 2019 in Peru, occupying an area of 183,288.15 km2 [35]. Among the degraded region, 11.4% of the area is currently having a high probability of recovery through the plantation of species of high economic value such as the Cedrela genus. The Cedrela genus needs to be protected from selective logging and overexploitation over time [9,12,18,61]. This is possible through the implementation of sustainable forest management strategies [62], strengthening forest monitoring and surveillance actions [48,63], and forming strategic alliances for conservation to protect these vulnerable species [56].
This study modeled the potential distribution of the genus Cedrela in Peru under current climatic conditions and identified which part of this potential distribution is protected by conservation areas or coincides with degraded areas. However, future studies could evaluate the distribution in future conditions of climate change, similar to Rojas et al. [25], who studied five timber forest species in Amazonas (northeastern Peru). However, it should be noted that species distribution models in climate change scenarios should be interpreted with caution since they may overestimate the decline or increase, by not considering the qualities of the species to adapt in situ to new conditions or persist outside the conditions in which they have been observed [64,65]. Despite the above, the relatively stable distribution sites (same current and future potential) of species would be of interest and essential to ensure the success of any conservation or restoration initiative.

5. Conclusions

The current biogeographic distribution of the 10 genus Cedrela (C. odorata, C. montana, C. fissilis, C. longipetiolulata, C. angustifolia, C. nebulosa, C. kuelapensis, C. saltensis, C. weberbaueri and C. molinensis) using MaxEnt, covers around 6.7% of Peru, found in 17 departments under Ucayali, Loreto, and Madre de Dios that are more likely to be located in the Amazon region. Likewise, the Natural Protected Areas categorized by the Peruvian State play a fundamental role in allowing the conservation of 4.4% of the potentially high-distribution regions of its territory. Such regions have high potentiality forthe genus Cedrela plantations, and such plantations could possibly be protected through appropriate conservation strategies.
Our research has also allowed us to quantify that 11.4% of the degraded areas identified in Peru as of 2019, can possibly be recovered through the plantation of one or more species of Cedrela genus. Therefore, our study has a strong potentiality to serve as a tool for identifying geographic spaces of genus Cedrela under a spatiotemporal framework in order to conserve or recover its local populations in areas degraded by anthropic or natural factors.

Author Contributions

Conceptualization, A.C.S., N.B.R.B., B.K.G. and R.S.L.; formal analysis, M.O. and B.K.G.; funding acquisition, C.T.G. and M.O.; investigation, A.C.S., N.B.R.B., S.B., S.G., M.O., B.K.G. and R.S.L.; methodology, A.C.S., N.B.R.B., S.B., S.G., C.T.G., B.K.G. and R.S.L.; project administration, C.T.G., M.O. and R.S.L.; resources, C.T.G., M.O., R.S.L.; software, A.C.S. and N.B.R.B.; supervision, A.C.S., S.B., S.G. and R.S.L.; validation, A.C.S., N.B.R.B., C.T.G., M.O., B.K.G. and R.S.L.; writing—original draft preparation, A.C.S., N.B.R.B. and S.B.; writing—review and editing, A.C.S., N.B.R.B., S.B. and S.G. All authors have read and agreed to the published version of the manuscript.

Funding

This work was supported by the SNIP project Nº 316114 “Service Creation Project of the Biodiversity and Conservation of Wild Species Genetic Resources Laboratory at the Toribio Rodríguez de Mendoza National University—Amazonas Region”.

Institutional Review Board Statement

Not applicable.

Informed Consent Statement

Not applicable.

Data Availability Statement

Not applicable.

Acknowledgments

The authors appreciate and acknowledge the support of the Research Institute for the Sustainable Development of the Eyebrow of the Jungle (INDES-CES) of the National University Toribio Rodriguez de Amazonas (UNTRM).

Conflicts of Interest

The authors declare no conflict of interest.

References

  1. Bruun, T.B.; Elberling, B.; de Neergaard, A.; Magid, J. Organic carbon dynamics in different soil types after conversion of forest to agriculture. L. Degrad. Dev. 2013, 26, 272–283. [Google Scholar] [CrossRef]
  2. Sánchez-Cuervo, A.M.; de Lima, L.S.; Dallmeier, F.; Garate, P.; Bravo, A.; Vanthomme, H. Twenty years of land cover change in the southeastern Peruvian Amazon: Implications for biodiversity conservation. Reg. Environ. Chang. 2020, 20, 1–14. [Google Scholar] [CrossRef]
  3. GeoBosques Bosque y Pérdida de Bosque. Available online: http://geobosques.minam.gob.pe/geobosque/view/perdida.php (accessed on 25 February 2020).
  4. Flores, Y. Crecimiento y Productividad de Plantaciones Forestales en la Amazonía Peruana; Lima, Perú, 2010. [Google Scholar]
  5. Dourojeanni, R.M. Aprovechamiento del barbecho forestal en áreas de agricultura migratoria en la Amazonía peruana. Rev. For. Perú 2016, 14, 1–33. [Google Scholar] [CrossRef]
  6. Suárez de Freitas, G. Reducción de la Deforestación (Principalmente en la Amazonía) en el Contexto del Cambio Climático y de un Enfoque de Crecimiento Verde; MINAM: Lima, Perú, 2017. [Google Scholar]
  7. Marquardt, K.; Pain, A.; Bartholdson, Ö.; Rengifo, L.R. Forest dynamics in the Peruvian Amazon: Understanding processes of change. Small-Scale For. 2019, 18, 81–104. [Google Scholar] [CrossRef] [Green Version]
  8. Lombardi, I. Las Poblaciones del Género Cedrela en el Perú; UNALM: Lima, Perú, 2014; ISBN 9786124147357. [Google Scholar]
  9. Escobal, J.; Aldana, U. Are nontimber forest products the antidote to rainforest degradation? Brazil nut extraction in Madre De Dios, Peru. World Dev. 2003, 31, 1873–1887. [Google Scholar] [CrossRef]
  10. Lamb, A.F.A. Fast Growing Timber Trees of the Lowland Tropics. Cedrela Odorata; Commonwealth Forestry Institute: Oxford, UK, 1968; Volume 2, p. 46. [Google Scholar]
  11. Cintrón, B.B. Cedrela odorata L. Cedro hembra, Spanish cedar. In Silvics of North America; United States Department of Agriculture (USDA): Washington, DC, USA, 1990; Volume 2, pp. 250–257. [Google Scholar]
  12. Navarro, C.; Montagnini, F.; Hernández, G. Genetic variability of Cedrela odorata Linnaeus: Results of early performance of provenances and families from Mesoamerica grown in association with coffee. For. Ecol. Manag. 2004, 192, 217–227. [Google Scholar] [CrossRef]
  13. Pennington, T.D.; Muellner, A.N. A Monograph of CEDRELA (Meliaceae), 1st ed.; DH Books: England, UK, 2010; ISBN 9780953813476. [Google Scholar]
  14. Palacios, W.A.; Santiana, J.; Iglesias, J. A new species of cedrela (Meliaceae) from the eastern flanks of ecuador. Phytotaxa 2019, 393, 84–88. [Google Scholar] [CrossRef]
  15. MINAM. Evaluación Dendrológica y Anatómica del las Especies del Género Cedrela; MINAM: Lima, Perú, 2017. [Google Scholar]
  16. SERFOR. Estado Situacional del Género Cedrela en el Perú; SERFOR: Lima, Perú, 2021. [Google Scholar]
  17. Rosser, A.; Haywood, M. Guidance for CITES Scientific Authorities; IUCN: Gland, Switzerland; Cambridge, UK, 2002. [Google Scholar]
  18. Cerrillo, R.M.N.; Agote, N.; Pizarro, F.; Ceacero, C.J.; Palacios, G. Elements for a non-detriment finding of Cedrela spp. in Bolivia-A CITES implementation case study. J. Nat. Conserv. 2013, 21, 241–252. [Google Scholar] [CrossRef]
  19. Guisan, A.; Tingley, R.; Baumgartner, J.B.; Naujokaitis-Lewis, I.; Sutcliffe, P.R.; Tulloch, A.I.T.; Regan, T.J.; Brotons, L.; Mcdonald-Madden, E.; Mantyka-Pringle, C.; et al. Predicting species distributions for conservation decisions. Ecol. Lett. 2013, 16, 1424–1435. [Google Scholar] [CrossRef] [PubMed]
  20. Fagundes, C.K.; Vogt, R.C.; De Marco Júnior, P. Testing the efficiency of protected areas in the Amazon for conserving freshwater turtles. Divers. Distrib. 2016, 22, 123–135. [Google Scholar] [CrossRef]
  21. Guisan, A.; Zimmermann, N.E. Predictive Habitat Distribution Models in Ecology. Ecol. Model. 2000, 135, 147–186. [Google Scholar] [CrossRef]
  22. Guisan, A.; Thuiller, W. Predicting species distribution: Offering more than simple habitat models. Ecol. Lett. 2005, 8, 993–1009. [Google Scholar] [CrossRef]
  23. Peterson, A.T.; Soberón, J.; Pearson, R.G.; Anderson, R.P.; Martínez-Meyer, E.; Nakamura, M.; Araújo, M.B. Ecological Niches and Geographic Distributions (MPB-49); Princeton University Press: Princeton, NJ, USA, 2011; ISBN 9780691136868. [Google Scholar]
  24. Cotrina, D.A.; Castillo, E.B.; Rojas, N.B.; Oliva, M.; Guzman, C.T.; Amasifuen, C.A.; Bandopadhyay, S. Distribution models of timber species for forest conservation and restoration in the Andean-Amazonian landscape, North of Peru. Sustainability 2020, 12, 7945. [Google Scholar] [CrossRef]
  25. Rojas, N.B.; Cotrina, D.A.; Castillo, E.B.; Oliva, M.; Salas, R. Current and future distribution of five timber forest species in Amazonas, Northeast Peru: Contributions towards a restoration strategy. Diversity 2020, 12, 305. [Google Scholar] [CrossRef]
  26. Abdelaal, M.; Fois, M.; Fenu, G.; Bacchetta, G. Using MaxEnt modeling to predict the potential distribution of the endemic plant Rosa arabica Crép. in Egypt. Ecol. Inform. 2019, 50, 68–75. [Google Scholar] [CrossRef]
  27. Naveda-Rodríguez, A.; Vargas, F.H.; Kohn, S.; Zapata-Ríos, G. Andean Condor (Vultur gryphus) in Ecuador: Geographic distribution, population size and extinction risk. PLoS ONE 2016, 11, e0151827. [Google Scholar] [CrossRef]
  28. Meza Mori, G.; Barboza Castillo, E.; Torres Guzmán, C.; Cotrina Sánchez, D.A.; Guzman Valqui, B.K.; Oliva, M.; Bandopadhyay, S.; Salas López, R.; Rojas Briceño, N.B. Predictive modelling of current and future potential distribution of the spectacled bear (Tremarctos ornatus) in Amazonas, Northeast Peru. Animals 2020, 10, 1816. [Google Scholar] [CrossRef]
  29. Gilani, H.; Arif Goheer, M.; Ahmad, H.; Hussain, K. Under predicted climate change: Distribution and ecological niche modelling of six native tree species in Gilgit-Baltistan, Pakistan. Ecol. Indic. 2020, 111, 106049. [Google Scholar] [CrossRef]
  30. Qin, A.; Liu, B.; Guo, Q.; Bussmann, R.W.; Ma, F.; Jian, Z.; Xu, G.; Pei, S. Maxent modeling for predicting impacts of climate change on the potential distribution of Thuja sutchuenensis Franch., an extremely endangered conifer from southwestern China. Glob. Ecol. Conserv. 2017, 10, 139–146. [Google Scholar] [CrossRef]
  31. Phillips, S.J.; Anderson, R.P.; Schapire, R.E. Maximum entropy modeling of species geographic distributions. Ecol. Modell. 2006, 190, 231–259. [Google Scholar] [CrossRef] [Green Version]
  32. Hernandez, P.A.; Graham, C.H.; Master, L.L.; Albert, D.L. The effect of sample size and species characteristics on performance of different species distribution modeling methods. Ecography 2006, 29, 773–785. [Google Scholar] [CrossRef]
  33. Aguirre-Gutiérrez, J.; Carvalheiro, L.G.; Polce, C.; van Loon, E.E.; Raes, N.; Reemer, M.; Biesmeijer, J.C. Fit-for-purpose: Species distribution model performance depends on evaluation criteria—Dutch Hoverflies as a case study. PLoS ONE 2013, 8, e63708. [Google Scholar] [CrossRef] [PubMed] [Green Version]
  34. Sofaer, H.R.; Jarnevich, C.S.; Pearse, I.S.; Smyth, R.L.; Auer, S.; Cook, G.L.; Edwards, T.C.; Guala, G.F.; Howard, T.G.; Morisette, J.T.; et al. Development and delivery of species distribution models to inform decision-making. Bioscience 2019, 69, 544–557. [Google Scholar] [CrossRef]
  35. MINAM. Estudio para la Identificación de Áreas Degradadas y Propuesta de Monitoreo; MINAM: Lima, Perú, 2017. [Google Scholar]
  36. MINAM-SERNANP. Áreas Naturales Protegidas Del Perú (2011–2015)—Conservación para el Desarrollo Sostenible; MINAM-SERNANP: Lima, Perú, 2016; Volume 1. [Google Scholar]
  37. Fick, S.E.; Hijmans, R.J. WorldClim 2: New 1-km spatial resolution climate surfaces for global land areas. Int. J. Climatol. 2017, 37, 4302–4315. [Google Scholar] [CrossRef]
  38. Hennig, T.A.; Kretsch, J.L.; Pessagno, C.J.; Salamonowicz, P.H.; Stein, W.L. The shuttle radar topography mission. Lect. Notes Comput. Sci. (Subser. Lect. Notes Artif. Intell. Lect. Notes Bioinform.) 2001, 2181, 65–77. [Google Scholar] [CrossRef]
  39. Boria, R.A.; Olson, L.E.; Goodman, S.M.; Anderson, R.P. Spatial filtering to reduce sampling bias can improve the performance of ecological niche models. Ecol. Modell. 2014, 275, 73–77. [Google Scholar] [CrossRef]
  40. Stevens, G.C. The latitudinal gradient in geographical range: How so many species coexist in the tropics. Am. Nat. 1989, 133, 240–256. [Google Scholar] [CrossRef]
  41. New, M.; Lister, D.; Hulme, M.; Makin, I. A high-resolution data set of surface climate over global land areas. Clim. Res. 2002, 21, 1–25. [Google Scholar] [CrossRef] [Green Version]
  42. Hengl, T.; De Jesus, J.M.; Heuvelink, G.B.M.; Gonzalez, M.R.; Kilibarda, M.; Blagotić, A.; Shangguan, W.; Wright, M.N.; Geng, X.; Bauer-Marschallinger, B.; et al. SoilGrids250m: Global gridded soil information based on machine learning. PLoS ONE 2017, 12, e0169748. [Google Scholar] [CrossRef] [PubMed] [Green Version]
  43. Dormann, C.F.; Elith, J.; Bacher, S.; Buchmann, C.; Carl, G.; Carré, G.; Marquéz, J.R.G.; Gruber, B.; Lafourcade, B.; Leitão, P.J.; et al. Collinearity: A review of methods to deal with it and a simulation study evaluating their performance. Ecography 2013, 36, 027–046. [Google Scholar] [CrossRef]
  44. Leroy, B.; Meynard, C.N.; Bellard, C.; Courchamp, F. virtualspecies, an R package to generate virtual species distributions. Ecography 2016, 39, 599–607. [Google Scholar] [CrossRef]
  45. Otieno, B.A.; Nahrung, H.F.; Steinbauer, M.J. Where did you come from? Where did you go? Investigating the origin of invasive Leptocybe species using distribution modelling. Forests 2019, 10, 115. [Google Scholar] [CrossRef] [Green Version]
  46. Manel, S.; Williams, C.; Ormerod, S.J. Evaluating presence—Absence models in ecology: The need to account for prevalence. J. Appl. Ecol. 2001, 38, 921–931. [Google Scholar] [CrossRef]
  47. Hanley, J.A.; McNeil, B.J. The meaning and use of the area under a Receiver Operating Characteristic (ROC) Curve1. Radiology 1982, 143, 29–36. [Google Scholar] [CrossRef] [Green Version]
  48. Zhang, K.; Zhang, Y.; Tao, J. Predicting the potential distribution of Paeonia veitchii (Paeoniaceae) in China by incorporating climate change into a maxent model. Forests 2019, 10, 190. [Google Scholar] [CrossRef] [Green Version]
  49. Soberon, J.; Peterson, A.T. Interpretation of models of fundamental ecological niches and species’ distributional areas. Biodivers. Inform. 2005, 2, 3392–3396. [Google Scholar] [CrossRef] [Green Version]
  50. Hernández, J.; Reynoso, R.; Hernández, A.; García, X.; Hernández-Máximo, E.; Cob, J.; Sumano, D. Historical, current and future distribution of Cedrela odorata in Mexico. Acta Bot. Mex. 2018, 2018, 117–134. [Google Scholar] [CrossRef]
  51. Elith, J.; Graham, C.H.; Anderson, R.P.; Dudík, M.; Ferrier, S.; Guisan, A.; Hijmans, R.J.; Huettmann, F.; Leathwick, J.R.; Lehmann, A.; et al. Novel methods improve prediction of species’ distributions from occurrence data. Ecography 2006, 29, 129–151. [Google Scholar] [CrossRef] [Green Version]
  52. Pecchi, M.; Marchi, M.; Burton, V.; Giannetti, F.; Moriondo, M.; Bernetti, I.; Bindi, M.; Chirici, G. Species distribution modelling to support forest management. A literature review. Ecol. Modell. 2019, 411, 108817. [Google Scholar] [CrossRef]
  53. Laurente, M. Modeling the effects of climate change on the distribution of Cedrela odorata L. “Cedro” in the Peruvian Amazon. Biologist 2015, 13, 213–224. [Google Scholar]
  54. Reynel, C.; Pennington, T.; Pennington, R.; Flores, C.; Daza, A. Árboles Útiles de la Amazonía Peruana y Sus Usos; Herbario de la Facultad de Ciencias Forestales de la Universidad Agraria La Molina, Royal Botanic Gardens Kew, Royal Botanic Gardens Edinburgh e ICRAF: Lima, Peru, 2003; ISBN 9972-9733-1-X. [Google Scholar]
  55. OSINFOR. Modelamiento Espacial de Nichos Ecológicos para la Evaluación de Presencia de Especies Forestales Maderables en la Amazonía Peruana; OSINFOR: Lima, Perú, 2013. [Google Scholar]
  56. Fajardo, J.; Lessmann, J.; Bonaccorso, E.; Devenish, C.; Muñoz, J. Combined use of systematic conservation planning, species distribution modelling, and connectivity analysis reveals severe conservation gaps in a megadiverse country (Peru). PLoS ONE 2014, 9, e0122159. [Google Scholar] [CrossRef] [Green Version]
  57. Rodriguez, L.O.; Young, K.R. Biological diversity of Peru: Determining priority areas for conservation. Ambio 2000, 29, 329–337. [Google Scholar] [CrossRef]
  58. Bonilla-Bedoya, S.; Estrella-Bastidas, A.; Molina, J.R.; Herrera, M.Á. Socioecological system and potential deforestation in Western Amazon forest landscapes. Sci. Total Environ. 2018, 644, 1044–1055. [Google Scholar] [CrossRef] [PubMed]
  59. Lombardi, I.; Barrena, V.; Huerta, P.; Carranza, J.; Vallejo, S. Propuesta Para la Recuperación de las Poblaciones de Cedrela spp. en el Perú; Universidad Nacional Agraria La Molina: Lima, Perú, (s.f.).
  60. Possingham, H.P.; Wilson, K.A. Protected Areas: Goals, Limitations, and Design. In Principies of Conservation Biology, 3rd ed.; Groom, M.J., Meffe, G.K., Carroll, C.R., Eds.; Sinauer Associates, lnc.: Sunderland, MA, USA, 2006. [Google Scholar]
  61. Romijn, E.; Lantican, C.B.; Herold, M.; Lindquist, E.; Ochieng, R.; Wijaya, A.; Murdiyarso, D.; Verchot, L. Assessing change in national forest monitoring capacities of 99 tropical countries. For. Ecol. Manag. 2015, 352, 109–123. [Google Scholar] [CrossRef] [Green Version]
  62. Araujo, M.; Pearson, R.; Thuiller, W.; Erhard, M. Validation of species-climate impact models under climate change. Glob. Chang. Biol. 2005, 11, 1504–1513. [Google Scholar] [CrossRef] [Green Version]
  63. Godsoe, W.; Franklin, J.; Blanchet, F.G. Effects of biotic interactions on modeled species’ distribution can be masked by environmental gradients. Ecol. Evol. 2017, 7, 654–664. [Google Scholar] [CrossRef] [Green Version]
  64. Lamont, B.B.; Connell, S.W. Biogeography of Banksia in southwestern australia. J. Biogeogr. 1996, 23, 295–309. [Google Scholar] [CrossRef]
  65. Sarmiento, F.O.; Kooperman, G.J. A Socio-hydrological perspective on recent and future precipitation changes over tropical montane cloud forests in the Andes. Front. Earth Sci. 2019, 7, 324. [Google Scholar] [CrossRef]
Figure 1. Study area and presence of Cedrela species.
Diversity 13 00261 g001
Figure 2. Methodological process for the biogeographic modeling of the genus Cedrela in Peru.
Diversity 13 00261 g002
Figure 3. Model performance based on the area under the curve (AUC) (a), mean response curves of the 100 replicated MaxEnt runs (red) and standard deviation (blue), showing the relationships between environmental variables and the probability of the presence of the Cedrela (bn), and Jackknife test of environmental variables importance to MaxEnt model of the Cedrela (o).
Diversity 13 00261 g003
Figure 4. Distribution of the biographical model of the genus Cedrela in Peru.
Diversity 13 00261 g004
Figure 5. Priority areas (a) for research and conservation practices, and (b) for the restoration of degraded Peruvian areas with genus Cedrela.
Diversity 13 00261 g005
Table 1. The number of records of 10 species of the genus Cedrela used in biogeographic modeling.
FamilyGenereSpeciesRecords Number
1MeliaceaeCedrelafissilis42
2kuelapensis16
3molinensis1
4montana30
5nebulosa32
6odorata787
7saltensis6
8angustifolia18
9longipetiolulata8
10weberbaueri7
Total947
Table 2. Variables for MaxEnt modeling of Cedrela in Peru.
VariableUnitsSymbolΔ Earnings in Jackknife 1Clúster
Bioclimatic
Annual Mean Temperature°Cbio010.73791
Mean Diurnal Range°Cbio020.76277
Isothermality bio030.91504
Temperature Seasonality°Cbio040.70979
Max Temperature of Warmest Month°Cbio050.68111
Min Temperature of Coldest Month°Cbio060.70681
Annual Temperature Range°Cbio070.76559
Mean Temperature of Wettest Quarter°Cbio080.76081
Mean Temperature of Driest Quarter°Cbio090.71071
Mean Temperature of Warmest Quarter°Cbio100.76061
Mean Temperature of Coldest Quarter°Cbio110.70671
Annual Precipitationmmbio120.62313
Precipitation of Wettest Monthmmbio130.76742
Precipitation of Driest Monthmmbio140.55253
Precipitation Seasonalitymmbio150.66929
Precipitation of Wettest Quartermmbio160.75242
Precipitation of Driest Quartermmbio170.54813
Precipitation of Warmest Quartermmbio180.79152
Precipitation of Coldest Quartermmbio190.51473
Topographic
Elevation above mean sea levelmsnmdem0.67097
Slope of the terrain°slope0.91047
Cardinal orientation of the slope°aspect1.01175
Edaphic at 0.30 m
pH in H2OpH × 10ph0.65437
Cation exchange capacitycmol kg−1cec0.78986
Organic carbong kg−1soc0.80944
Bulk density of the fine earth fractioncg/cm3bdod0.88818
Volumetric fraction of coarse fragmentscm3/dm3 (vol %)cfvo0.70517
Total nitrogencg/kgnitrogen0.83756
Clay content%clay0.87434
Sand content%sand0.81557
Slime content%silt0.79702
Solar radiationMJ m−2 day−1srad0.68019
Relative humidity%rhm0.77773
1 In bold, the variables with less variation between the regularized training data and single variable for each cluster used for MaxEnt model are shown.
Table 3. Relative contributions (%) of environmental variables to the MaxEnt model of the genus Cedrela in Peru.
VariablePercent ContributionPermutation Importance
bio1951.319.7
soc18.36
dem6.925.8
cec6.52.3
bio124.619.2
bio043.79.1
ph2.64.6
aspect1.31.1
slope1.31.2
sand1.34.7
silt0.94
bdod0.71.1
nitrogen0.71.1
Table 4. Area of distribution of the biographical model of the genus Cedrela in Peru.
Region/CountryGeographic Area km2LowModerateHigh
km2%km2%km2%
Amazonas39,306.4612,692.7832.36339.4116.11925.424.9
Ancash35,962.257.1800.1600.000
Apurimac21,114.181719.018.1476.602.3148.550.7
Ayacucho43,503.841150.372.61306.673985.082.3
Cajamarca33,044.688512.5625.84444.7513.51140.413.5
Cusco72,076.215,217.8921.111,450.6615.95145.997.1
Huancavelica22,065.07444.752260.121.2194.120.9
Huánuco37,200.5312,279.44332274.376.1867.622.3
Junín43,997.311,298.7225.78212.0818.73340.967.6
La Libertad25,295.941025.674.1270.801.139.080.2
Lambayeque14,342.31294.652.120.760.10.190
Loreto375,115.94161,464.724353,151.9114.222,842.306.1
Madre De Dios85,045.8734,710.9540.820,326.5623.920,755.7024.4
Pasco24,113.9510,797.9244.84771.8819.8979.544.1
Piura36,065.11953.375.4225.540.614.430
Puno67,962.798270.8512.23048.194.5947.781.4
San Martin50,961.2623,558.3846.213,728.2726.94267.018.4
Tumbes4690.28122.442.60.0000.000
Ucayali105,341.7738,186.2936.232,564.5330.923,322.0422.1
Peru1,288,564.27343,70826.716,287312.686,916.26.7
Table 5. Total potential distribution area predicted that is protected by the modalities of Protected Natural Area in Peru.
PNA ModalitiesGeographic Area (km2)LowModerateHigh
km2%km2%km2%
Reserved Zone6257.551799.2228.8358.285.785.181.4
Regional Conservation Areas33,253.7916,206.5448.74309.7813.01020.713.1
Private Conservation Areas3963.05764.3419.3536.1313.5154.683.9
National sanctuary3173.661169.4336.81226.7938.7130.764.1
Historic Sanctuary412.7950.4612.231.677.720.184.9
Wildlife Refuge207.7544.2521.320.119.70.130.1
National Reserve46,528.5215,987.9634.49005.6819.42323.465.0
Communal Reserve21,665.887247.0533.45636.4026.01023.634.7
National Park103,943.6753,959.4251.921,151.8320.35000.934.8
Hunting1247.357.510.60.000.00.000.0
Protection Forest3899.871563.6840.11175.8230.2411.3710.5
PNA Peru231,672.0798,799.8542.643,452.4918.810,171.034.4
Table 6. Departments with potential area of recovery of degraded areas with Cedrela in Peru.
RegionDegraded Area (km2)LowModerateHighTotal
Km2%Km2%Km2%Km2%
Amazonas11,2103758.433.52186.6219.5881.567.96826.5860.9
Apurimac146.3610.937.54.583.12.051.417.5612.0
Ayacucho1983.93444.9922.4601.9530.3450.522.71497.4475.5
Cajamarca3254.271013.8631.2927.4328.5359.4911.02300.7870.7
Cusco14,955.425001.7133.44241.0928.42622.0117.511,864.8179.3
Huancavelica255.8462.5324.434.2613.434.113.3130.8951.2
Huanuco12,492.156630.7153.11057.658.5487.873.98176.2365.5
Junin12,312.955537.2545.03807.130.91449.9311.810,794.2887.7
La Libertad1430173.0712.1115.798.119.681.4308.5421.6
Lambayeque1169.755.290.50.040.000.05.330.5
Loreto45,320.8219,959.4644.08105.4817.93635.898.031,700.8369.9
Madre de Dios16,2244671.5528.83127.5819.35604.8334.513,403.9682.6
Pasco7317.364689.3964.11394.619.1494.756.86578.7489.9
Piura2890.04215.57.540.471.46.450.2262.429.1
Puno6561.037.640.117.850.315.470.240.960.6
San Martin20,356.173530.2217.33328.4216.41621.728.08480.3641.7
Tumbes256.3512.594.900.000.012.594.9
Ucayali21,792.538418.1838.65072.223.33170.7314.516,661.1176.5
Peru183,288.1564,143.335.034,063.118.620,85711.411,9063.465.0
Publisher’s Note: MDPI stays neutral with regard to jurisdictional claims in published maps and institutional affiliations.

