Preliminary Evidence for Domestication Effects on the Genetic Diversity of Guazuma crinita in the Peruvian Amazon


1
Department of Crop Sciences and Agroforestry, Faculty of Tropical AgriSciences, Czech University of Life Sciences Prague, Kamycka 129, 16500 Prague, Czech Republic
2
Estación Experimental Agraria El Chira, Dirección de Recursos Genéticos y Biotecnología, Instituto Nacional de Innovación Agraria, Carretera Sullana–Talara, Km. 1027, Sullana, Piura 20120, Peru
3
Crop Research Institute, Department of Gene Bank, Drnovska 507/73 Praha 6-Ruzyne, 16521 Prague, Czech Republic
4
World Agroforestry Centre, Lima 15074, Peru
*
Authors to whom correspondence should be addressed.
Forests 2020, 11(8), 795; https://doi.org/10.3390/f11080795
Submission received: 30 June 2020
/
Revised: 15 July 2020
/
Accepted: 20 July 2020
/
Published: 23 July 2020
(This article belongs to the Special Issue Genetic and Phenotypic Variation in Tree Crops Biodiversity)
Abstract
:Guazuma crinita, a fast-growing timber tree species, was chosen for domestication in the Peruvian Amazon because it can be harvested at an early age and it contributes to the livelihood of local farmers. Although it is in an early stage of domestication, we do not know the impact of the domestication process on its genetic resources. Amplified fragment length polymorphic (AFLP) fingerprints were used to estimate the genetic diversity of G. crinita populations in different stages of domestication. Our objectives were (i) to estimate the level of genetic diversity in G. crinita using AFLP markers, (ii) to describe how the genetic diversity is distributed within and among populations and provenances, and (iii) to assess the genetic diversity in naturally regenerated, cultivated and semi-domesticated populations. We generated fingerprints for 58 leaf samples representing eight provenances and the three population types. We used seven selective primer combinations. A total of 171 fragments were amplified with 99.4% polymorphism at the species level. Nei’s genetic diversity and Shannon information index were slightly higher in the naturally regenerated population than in the cultivated and semi-domesticated populations (He = 0.10, 0.09 and 0.09; I = 0.19, 0.15 and 0.16, respectively). The analysis of molecular variation showed higher genetic diversity within rather than among provenances (84% and 4%, respectively). Cluster analysis (unweighted pair group method with arithmetic mean) and principal coordinate analysis did not show correspondence between genetic and geographic distance. There was significant genetic differentiation among population types (Fst = 0.12 at p ˂ 0.001). The sample size was small, so the results are considered as preliminary, pending further research with larger sample sizes. Nevertheless, these results suggest that domestication has a slight but significant effect on the diversity levels of G. crinita and this should be considered when planning a domestication program.
1. Introduction
Tropical forests provide many valuable products, including rubber, fruits and nuts, medicinal herbs, lumber, firewood, and charcoal [1]. Natural forest populations typically possess considerable genetic variation [2]. However, deforestation due to slash-and-burn agriculture [3], over-harvesting and other unsustainable forestry practices are reducing tree genetic diversity in many areas in the tropics [1]. Tree domestication has been promoted as a strategy to conserve genetic resources for tropical species [1,4]. Domestication involves the selection and propagation of desirable trees, so we expect that genetic diversity is lower in domesticated populations compared with natural populations. However, very few studies have assessed the difference in genetic diversity between domesticated and natural forest tree populations in the tropics [5,6]. This information is necessary for planning tree domestication strategies that maintain high levels of genetic diversity in the domesticated population.
Guazuma crinita Mart. (Malvaceae) was identified as a priority timber species for tree domestication in the Peruvian Amazon [7]. It is a pioneer species in the Amazon basin of Peru, Ecuador and Brazil [8]. It can be inter-cultivated with food crops because it has a small crown with thin branches and the older branches naturally self-prune. It provides wood products at an early age, can be coppiced for successive harvests and contributes significantly to farmers’ income [9,10]. Due to its initial fast growth (up to 3 m per year), it has been promoted in reforestation programs and agroforestry systems [11,12]. In addition, it can be vegetative propagated for commercial purposes [10]. It has promising national and international markets for lumber products [10,13].
G. crinita is a cross pollinated species that produces fruit at an early age, and can potentially disperse seeds over a long distance by both wind and water, allowing it to colonize forest gaps and potentially form dense stands of natural regeneration [14]. These dispersal characteristics should produce extensive gene flow among populations, resulting in high levels of genetic diversity within population and relatively low genetic differentiation among populations [15,16,17]. Local farmers manage G. crinita in its natural ecological niche for timber, while also engaging in other agricultural activities.
The objectives of this study were (i) to estimate the level of genetic diversity in G. crinita using AFLP (amplified fragment length polymorphism) markers, (ii) to describe how the genetic diversity is distributed within and among populations and provenances, and (iii) to assess the genetic diversity in naturally regenerated, cultivated and semi-domesticated populations. Based on the reproductive characteristics of this species, we hypothesized that there would be (i) a high level of polymorphism within populations and provenances, (ii) relatively little genetic differentiation among populations, and (iii) greater genetic diversity in the naturally regenerated population compared with the cultivated and semi-domesticated populations.
2. Materials and Methods
2.1. Sampling
In this study, we analyzed the genetic diversity of G. crinita populations in three stages of tree domestication. A natural population included wild, naturally regenerated trees from one provenance that farmers retained in their fields. In the cultivated population, we sampled trees from one provenance that farmers planted in a home garden using seedlings produced in a home nursery. The semi-domesticated population included trees from six provenances in a clonal garden. Genotypes in the clonal garden were selected over a period of years from progeny trees originating from an extensive collection of 200 mother trees. The natural, cultivated and semi-domesticated populations are in the second, fourth and sixth stages, respectively, of the seven stages of domestication proposed by Vodouhe and Dansi [18].
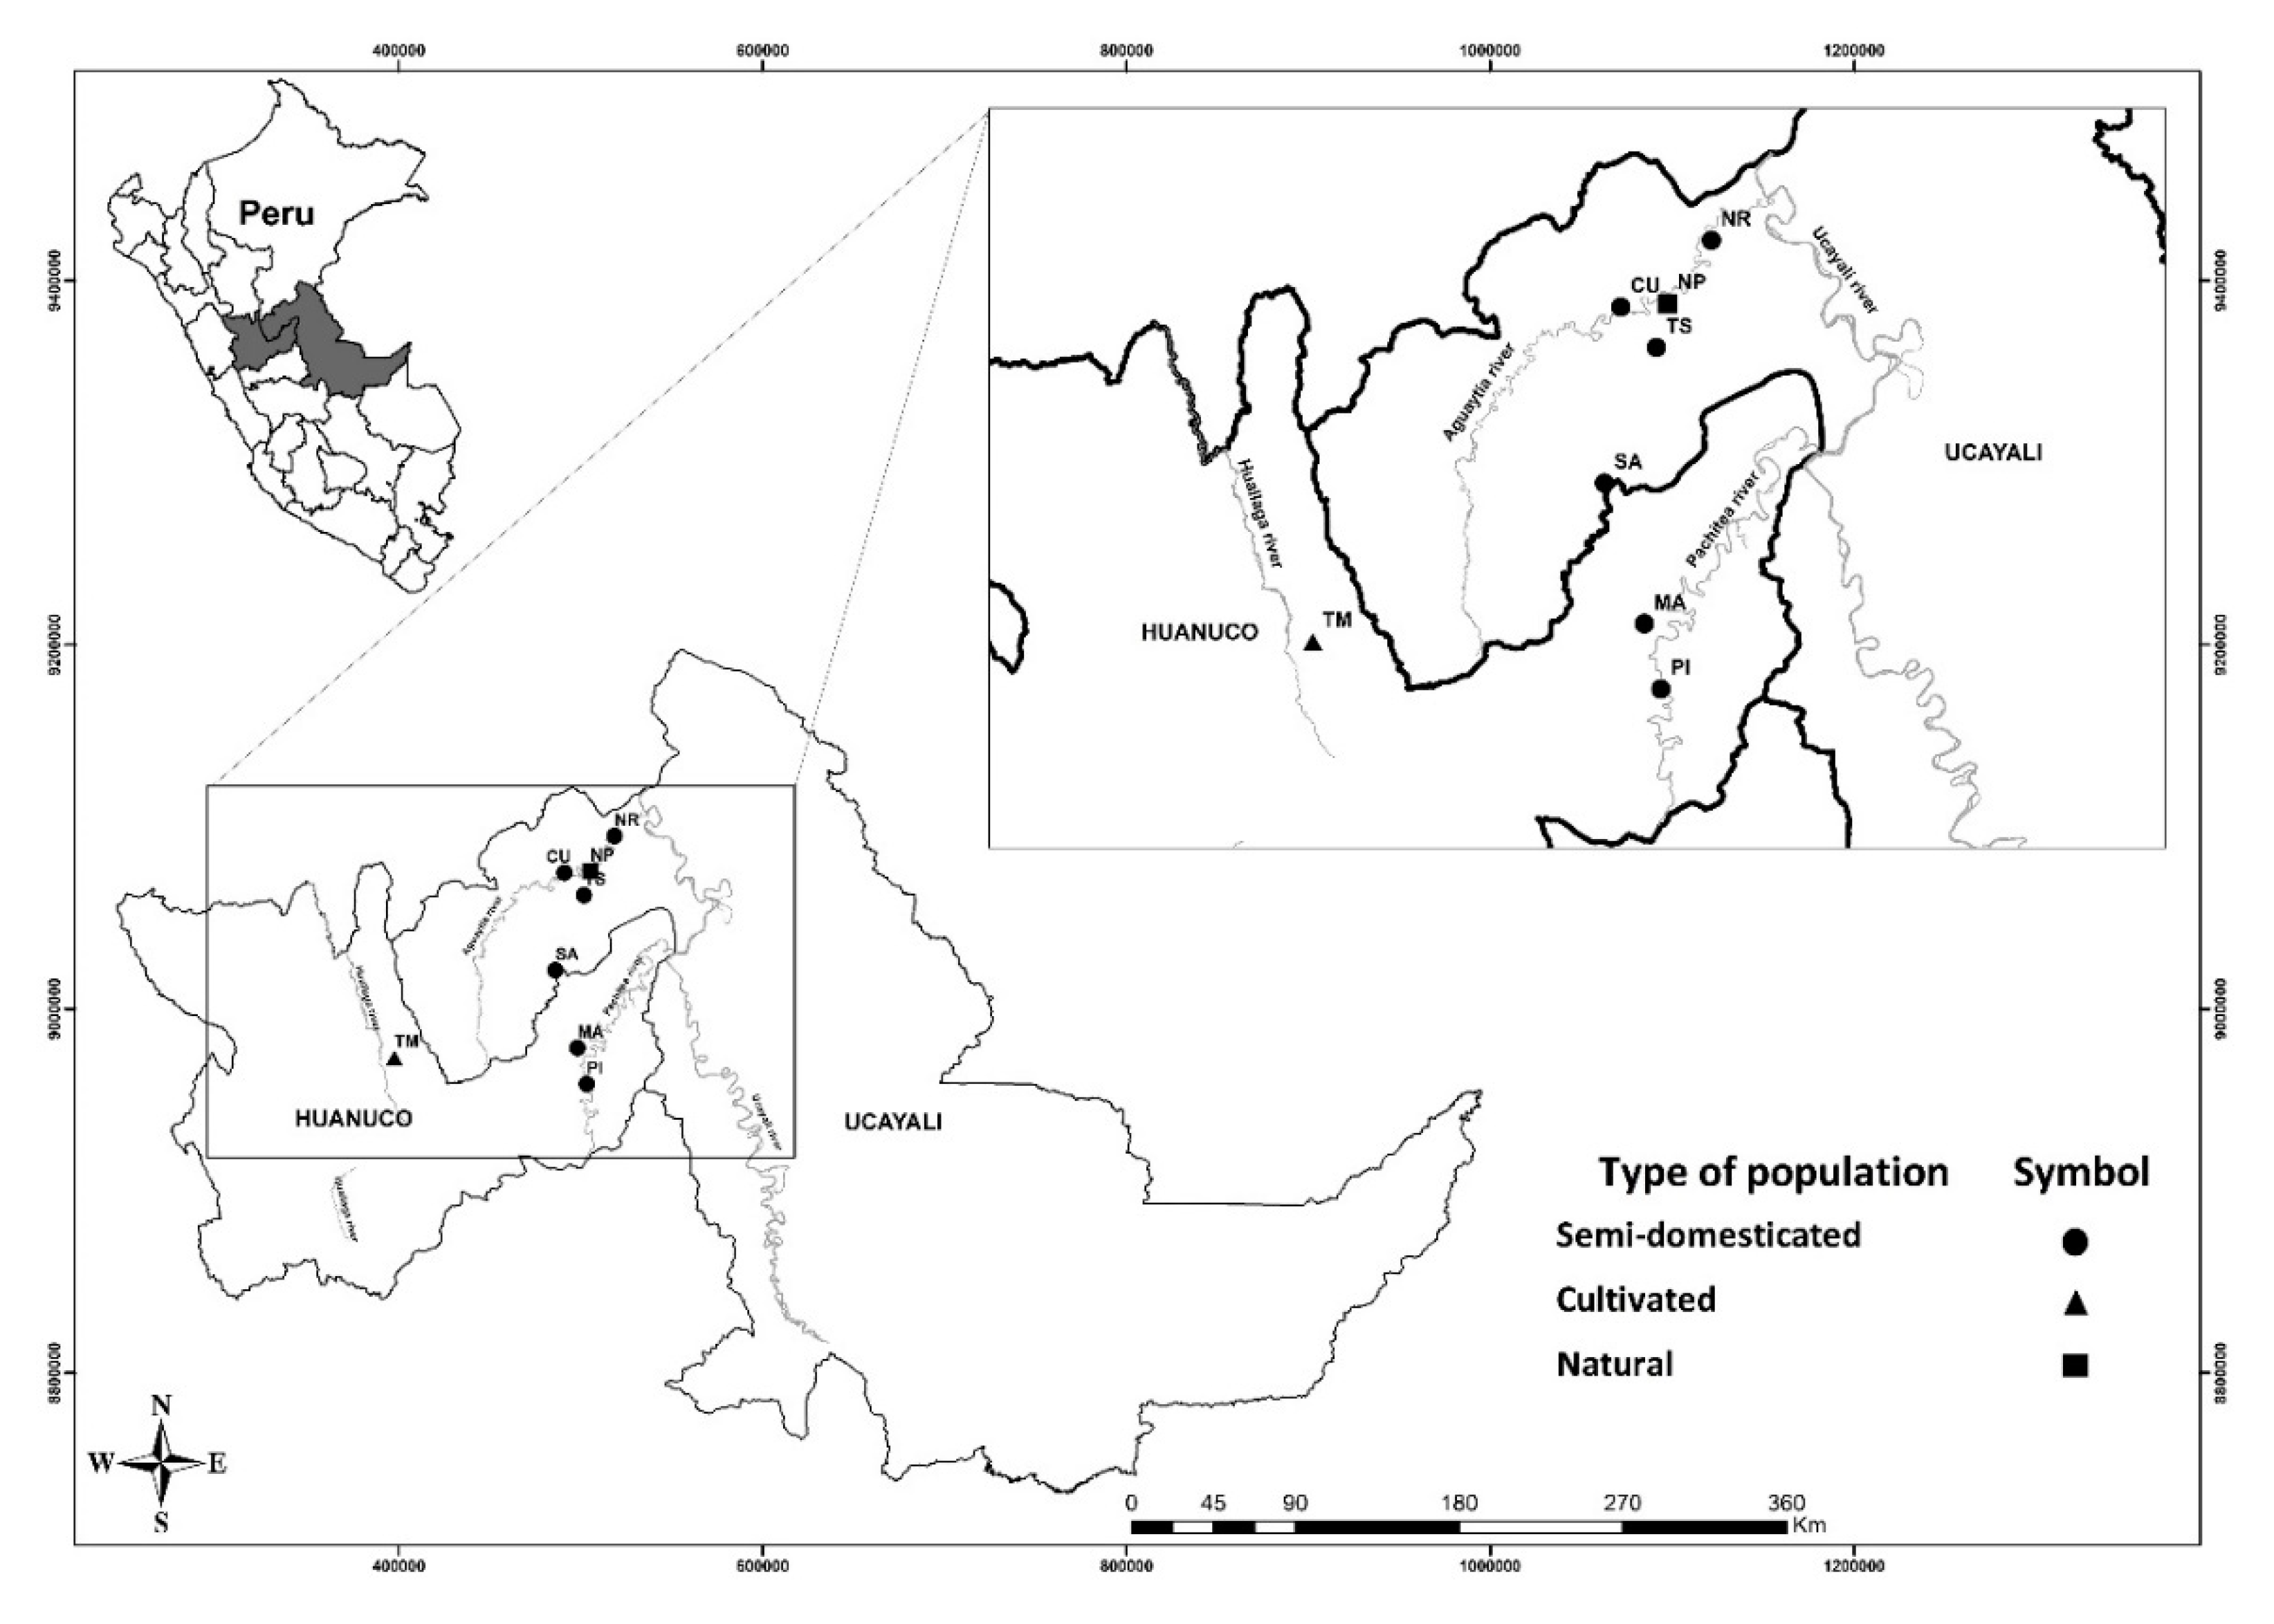
A total of 84 individuals from the three different population types (natural, cultivated and semi-domesticated) were sampled from eight G. crinita provenances in the Peruvian Amazon (Figure 1). Thirty individuals from the village of Nuevo Piura were randomly sampled from a population of natural regeneration located in Campo Verde district, Ucayali region (150 m.a.s.l). In the city of Tingo Maria, Huanuco region, 30 cultivated individuals were sampled in a home garden (564 m.a.s.l). In addition, 24 vegetative propagated trees were sampled from a clonal multiplication garden at the Peruvian Amazon Research Institute (IIAP), located 12.4 km from Pucallpa, Ucayali Region (154 m.a.s.l). They represent selected genotypes from six provenances in two watersheds in the Peruvian Amazon. Young leaf tissues were collected from individual plants and then dried in silica gel for DNA extraction.
2.2. DNA Extraction
DNA from the 84 leaf samples was extracted using the CTAB (cetyltrimethylammonium bromide) method [23] with a slight modification (adding a trace of polyvinylpyrrolidone (PVP) and 5 µL of RNase). The DNA quality was determined by 0.8 % agarose gel electrophoresis using a Nanodrop Spectrophotometer (Thermo Scientific, Delaware, USA). We only obtained genomic DNA of sufficient quality for amplification from 58 of the 84 samples (Table 1). It was diluted to 50 ng/µL and stored at −20 °C.
2.3. AFLP Amplification
Molecular AFLP markers were used because no previous genome information is required and a large number of polymorphic loci can be analysed simultaneously [24]. With the use of AFLP, we expected to successfully assess the genetic relationships between G. crinita populations in the Peruvian Amazon.
Techniques for the AFLP analysis of G. crinita were adapted from those described by Vos et al. [25]. Commercial AFLP kits (Stratec Molecular, Berlin, Germany) were used for the restriction, ligation and pre-amplification steps.
An AFLP Core Plant Reagent Kit I (Stratec Molecular, Berlin, Germany) was used for restriction and ligation. The restriction reaction volume was 5 μL and included the following: 1 uL of 5 × Reaction Buffer (50 mM Tris-HCl (pH 7.5), 50 mM Mg-acetate, 250 mM k-acetate); 0.4 μL of enzyme mixture EcoRI/MseI (1.25 U/μL each in 10 mM Tris-HCl (pH 7.4), 50 mM NaCl, 0.1 mM EDTA, 1 mM DTT, 0.1 mg/mL BSA, 50% glycerol (v/v), 0.1% Triton®X-100); 1.1 μL of sterile water and 2.5 μL of DNA (50 ng/μL). After mixing the reaction we incubated it in a thermocycler at 37 °C for 2 h. Ligation of the adapters included the following: 4.8 μL of Adapter/Ligation Solution (EcoRI/MseI adapters, 0.4 mM ATP, 10 mM Tris-HCl (pH 7.5), 10 mM Mg-acetate, 50 mM K-acetate); and 0.2 μL of T4 DNA Ligase (1 U/μL in 10 mM Tris-HCl (pH 7.5), 1 mM DTT, 50 mM KCl, 50% (v/v) glycerol). This volume was added into a microtube with the restriction products from previous reactions. The reaction was left at 37 °C for 2 h.
For pre-amplification, we used AFLP Pre-Amp Mix I (Stratec Molecular, Berlin, Germany). The cycle profile for pre-amplification PCR was as follows: an initial step at 72 °C for 2 min, followed by 20 cycles of 94 °C for 10 s, at 56 °C for 30 s and at 72 °C for 2 min and final elongation at 60 °C for 30 min; containing 4.0 μL of pre-amplification mix, 0.5 μL of 10 × Buffer for RedTaq Polymerase (100 mM Tris-HCl (pH 8.3), 500 mM KCl, 11 nM MgCl2 and 0.1% gelatin) (Sigma-Aldrich, Saint Louis, USA), 0.1 μL RedTaq Polymerase (Sigma-Aldrich, Saint Louis, USA) and 0.5 μL of DNA after restriction and ligation. The product was visualized on 1.8% TBE agarose gel. After amplification, the product was diluted by the addition of 15 μL of ddH2O.
The selective amplification reactions with slight modifications were performed following the protocol described in Mikulášková et al. [26], with a total volume of 9.8 μL, comprising 2.3 μL of preamplified DNA, 5.1 μL ddH2O, 1 μL 10 × polymerase buffer (100 mM Tris-HCl (pH 8.3), 500 mM KCl, 11 nM MgCl2 and 0.1% gelatin) (Sigma-Aldrich, Saint Louis, USA), 0.2 mM dNTP (Thermo Scientific, USA), 0.5 pmol fluorescent dye-labelled EcoRI primer (Applied Biosystems, Foster city, California, USA), 0.5 pmol MseI primer (Generi Biotech, Hradec Králové, Czech Republic) and 0.2 U RedTaq DNA polymerase (Sigma Aldrich, Saint Louis, USA). Selective PCR amplifications were carried out using the following cycle profile: 92 °C for 2 min, 65 °C for 30 s and 72 °C for 2 min. A touchdown protocol was applied in the following eight cycles at 94 °C for 1 s, at 64 °C (1 °C decrease each cycle) for 30 s, and at 72 °C for 60 s. This was followed by 23 cycles of 94 °C for 1 s, at 56 °C for 30 s and at 72 °C for 2 min. Final elongation was carried out at 60 °C for 30 min.
Eleven primer combinations were tested but only seven were selected for final analysis because they produced distinct polymorphic bands. For all PCR amplifications T100TM Thermal Cycler (Bio-Rad Laboratories, California, USA) was used. The final products after selective amplification were visualized on 1.8% agarose gels buffered in 1 × TBE. Following a successful amplification, the AFLP products were prepared for analysis on 3500 Genetic Analyser, automated sequencer (Applied Biosystems, Foster city, California, USA). Ten percent of the samples were analyzed twice for error rate estimation.
2.4. Data Analysis
AFLP fragments were analyzed using GeneMarker v 2.0.2 (SoftGenetics, USA). Polymorphic and strong peaks were scored as present or absent and then converted into a binary matrix. The data were used to calculate the percentage of polymorphic fragments, gene diversity (He) and Shannon’s information index (I) using POPGENE v1.32 [27].
Analysis of molecular variance (AMOVA) was carried out to evaluate genetic diversity within and among samples, as well as to estimate genetic differentiation indexes, using GenAlEx v6 [28]. Principal coordinate analysis (PCoA) was carried out to assess genetic relationship among samples, also using GenAlEx v6.
Patterns of genetic relationships among samples was also investigated using cluster analysis. A dendrogram was constructed based on Jaccard’s dissimilarity index with UPGMA using DARwin5 [29]. The software STRUCTURE v2.3.2.1 [30] was used to identify the number of similar population clusters (K) and the proportion of membership of each population in each of the K clusters. The analysis of the number of clusters was performed using the recessive allele model with a burn-in and run lengths of 100,000 and 1,000,000 interactions, respectively. The number of clusters was determined following the guidelines of Pritchard and Wen [31] and Evano et al. [32] using the online software Structure Harvester [33], and subsequently visualized using DISTRUCT 1.1 [34]. AFLP percentage of reproducibility was calculated following Bonin et al. [35].
3. Results
3.1. AFLP Fingerprint
The seven primer combinations selected for the analysis revealed 10 to 35 fragments in the 58 G. crinita samples, with the mean of 24 fragments. Of the 171 total fragments, 99.7% were polymorphic. The fragments were in a size range of 52 to 336 bp (Table 2). The first primer combination (EcoRI-ACG/MseI- CTT) was the most successful with a polymorphic rate of 20.5%. The least successful was EcoRI-ACG/MseI- CAG (5.8%).
Ten percent of the sample size was independently replicated with the same primer combinations, resulting in 85% of the fragment reproducibility among replicated samples.
3.2. Genetic Diversity and Population Structure
In a single measurement of intra-population diversity, e.g., the percentage of polymorphic fragments, samples from Nuevo Piura provenance (natural population) exhibited the highest diversity (72.5%), followed by the samples from Tingo Maria (cultivated population, 42.2%). There was less diversity in the provenances in the semi-domesticated population (20.7% on average) (Table 3). However, in the semi-domesticated provenances considered as one population, the percentage of polymorphic fragments was 54.4%, Nei’s genetic diversity was 0.09 and the Shannon index was 0.16.
Based on 170 polymorphic fragments from the 58 G. crinita samples, Nei’s genetic diversity values ranged from 0.06 to 0.10 and the Shannon information index (I) ranged from 0.09 to 0.19 (Table 3). Comparing the three population types, all measure (polymorphic fragments (PF), percentage of polymorphic fragments (PPF), He, and I) were slightly higher in the population of natural regeneration.
The coefficient of genetic differentiation (Gst) among the three population types was 0.10. This indicates that 10% of the genetic diversity was distributed among the population types. Nei’s genetic identity comparison between population types indicated that the highest identity (0.011) was between natural and cultivated populations, and the lowest identity (0.022) was between cultivated and semi-domesticated populations.
Pairwise genetic distance between provenances ranged from 0.011 to 0.063 (Table 4). Nueva Piura and Tingo Maria were the most similar with the minimum distance value of 0.011, while the highest value of genetic distance (0.063) was between Nuevo Piura, Puerto Inca, and Tahuayo, San Alejandro.
Analysis of molecular variation (AMOVA) showed that 12% of the variation was among population types, 4% was among provenances and 84% was within provenances (Table 5). The level of differentiation among provenances was higher (Fst = 0.16) than among population types (Fst = 0.12) at p ˂ 0.001.
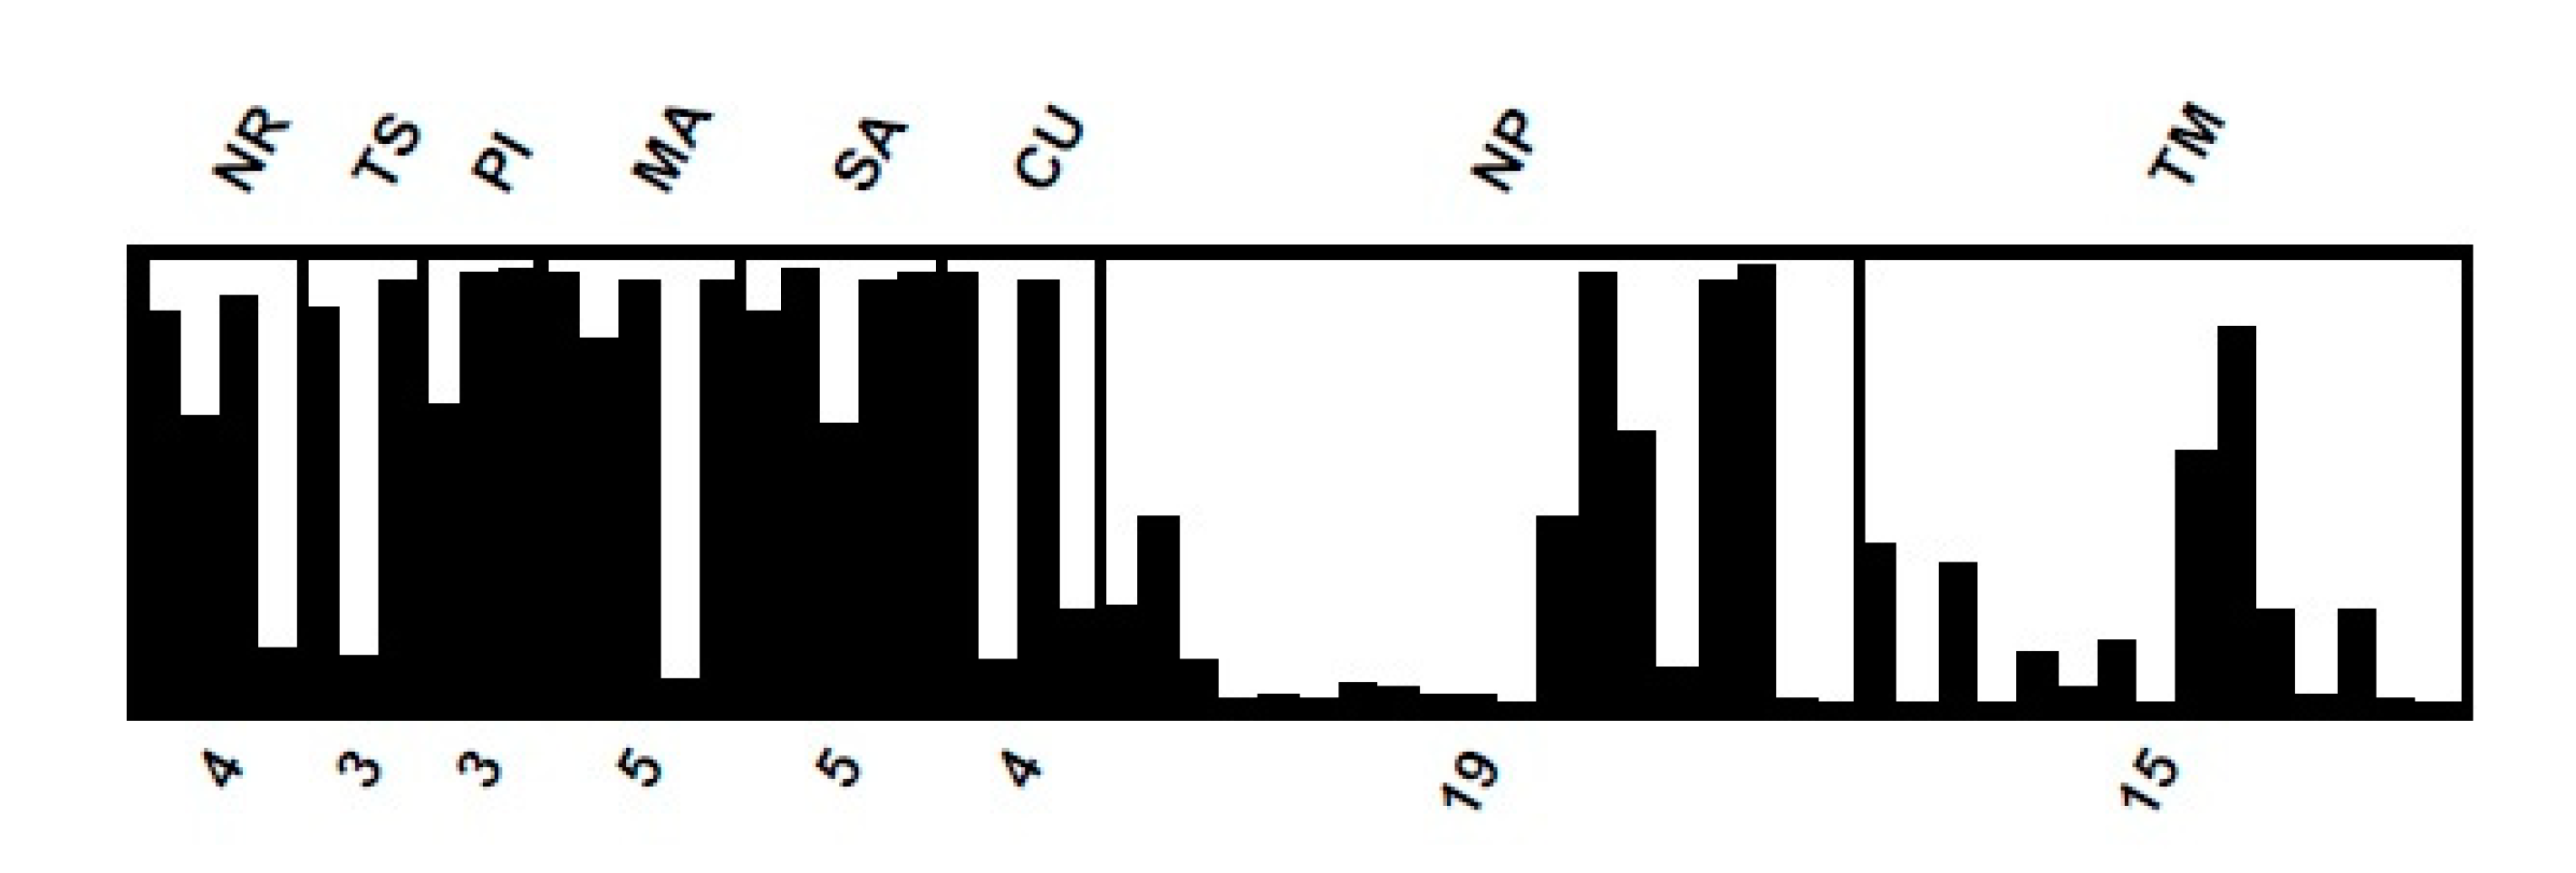
Patterns of a genetic relationship were visualized using principal coordinate analysis (PCoA) (Figure S1) and a dendrogram based on Jaccard’s dissimilarity, which grouped the 58 samples into two main clusters with seven sub-clusters (Figure S2). The number of clusters (K value) assessed by STRUCTURE analysis suggested two was the optimal K because it had the largest delta K value. Under this K = 2 model, provenance from the semi-domesticated population (NR, TS, PI, MA, SA and CU) had some individuals with mixed assignment membership in cluster 1 (black bar) and cluster 2 (white bar, Figure 2). The analysis also provided membership assignment, with the higher membership ranging from 56.6% (CU provenance in cluster 1) to 89.3% (SA provenance in cluster 1). In natural and cultivated populations (NP and TM, respectively), the membership was 73.2% and 80.4%, respectively in cluster 2.
4. Discussion
Studies of genetic variation in growth and wood traits of Guazuma crinita have been published [14,36,37], but genetic variation in morphological traits represents a small part of a total genetic variation in a species [38]. This research assesses genetic diversity in G. crinita based on amplified fragment length polymorphism (AFLP) markers, and we found 99.4% polymorphism. In another study involving eleven provenances of G. crinita in the Peruvian Amazon, there was 93.8% polymorphism based on Inter Simple Sequence Repeat (ISSR) [17]. Although the methods were different, both studies confirm high levels of genetic diversity in G. crinita. The high levels of diversity are probably related to the fact that G. crinita is a pioneer species and has long-distance seed dispersal, which results in extensive gene flow [39,40].
We analyzed the genetic diversity of G. crinita from three different population types (natural, cultivated and semi-domesticated). Comparing the genetic diversity parameters, such as PPF, He, and I, the naturally regenerated population had slightly greater genetic diversity than the cultivated and semi-domesticated populations. This suggests that artificial selection in the domestication process has reduced the levels of G. crinita genetic diversity. Other studies also confirmed that wild populations usually maintain higher levels of genetic diversity compared with cultivated populations [5,6,41,42].
Higher diversity in natural populations is expected because they are not affected by artificial selection. Maintaining high genetic diversity in natural populations is important because it reduces the risk of local extinction under natural conditions [1,43]. The conservation of cultivated populations is also important to conserve genetic diversity, particularly for those cultivated populations with superior individuals. Genetic diversity parameters were slightly higher in the semi-domesticated population compared with the cultivated population. This probably is due to the larger genetic base of the semi-domesticated population. The semi-domesticated population included six provenances with individuals selected from offspring of 200 mother trees (details of the initial collection were reported by Rochon et al. [14]), while the cultivated population represented only one provenance and a few mother trees. The number of mother trees used to establish a population is a key factor that affects inbreeding and genetic diversity: a low number will cause inbreeding among progeny, while a large number will increase genetic diversity and reduce differentiation among plantations [44].
In this study, three parameters were used to assess genetic differentiation among the three population types, and they gave similar results (AMOVA = 12%, Gst coefficient = 0.10 and Fst = 0.12). This indicates that about 12% of the variation was due to the domestication stage. In contrast, genetic differentiation among naturally regenerated and managed stands of Picea abies (L.) Karst in Europe are much lower (Fst = 0.012), suggesting that tree breeding activities have not greatly altered gene frequencies compared with natural populations of this species [45]. Geographical and climatic factors can also affect genetic differentiation, and their effects should be assessed in future studies of G. crinita [46,47].
The relatively low level of genetic differentiation (4%) among the eight G. crinita provenances can be explained by the high gene flow value (Nm = 12.9) reported by Tuisima et al. [17]. The high gene flow probably reflects the long-distance dispersal of its small seed by wind and water [37]. Lower genetic differentiation is also expected for cross-pollinated species [48]. The high level of genetic diversity within provenances in this study was consistent with reports based on phenotypic traits [14,37].
Other studies have also reported relatively low genetic differentiation among tree populations in the Amazon Basin. Russell et al. [49] reported 9% variation among populations of Calycophylum spruceanum Benth from several watersheds in the Peruvian Amazon Basin, using seven AFLP primer combinations. This species also produces small seeds that are dispersed over long distances by both wind and water. Nassar et al. [50] found low levels of diversity among populations of three native species from the Amazon Basin based on allozymes (8%, 6% and 7%, respectively, among populations of Samanea saman (Jack.) Merr. (Fabaceae), Guazuma ulmifolia (Malvaceae) and Hura crepitans L. (Euphorbiaceae)).
Many trees species have adaptations that allow long-distance seed dispersal [48,51]. One may expect that trees sampled over a relatively small geographical range (as in our study) would show low levels of variation among populations [15]. However, in some studies in the tropics, trees were sampled over extensive geographical ranges and still showed low differentiation among population (e.g., Swietenia macrophylla King [52]; Vitellaria paradoxa Gaertn [53]; Inga edulis Mart [22]).
According to STRUCTURE analysis, individuals within provenances were assigned mixed membership in the two clusters, so provenances were not distinctly separated. This is consistent with the AMOVA, which showed much greater genetic diversity within than among provenances. As a result, it was not possible to correctly identify groups [54]. Nevertheless, we notice similarity among provenances from the semi-domesticated population (cluster 1), and similarity between provenances from the naturally regenerated and cultivated populations (cluster 2).
5. Conclusions
AFLP markers were successful and effective for the assessment of the genetic diversity and structure of G. crinita populations in different stages of the domestication process. A high level of genetic diversity was observed at the species level, and this probably reflects extensive gene flow due to long-distance seed dispersal.
Genetic diversity appears to be slightly greater in the natural population compared to the cultivated and semi-domesticated populations, while significant genetic differentiation was detected among the three population types. These results are preliminary, given the small sample size, and suggest the presence of a slight, but significant genetic bottleneck in the cultivated and semi-domesticated populations. The semi-domesticated population appears to have a slightly higher genetic diversity than the cultivated population.
There appears to be significant differentiation among the natural, cultivated and semi-domesticated populations, a result presented with caution given the small sample size employed. Future studies should include larger sample sizes in different domestication stages to confirm the results reported in this paper.
The in situ and circa situ conservation and sustainable management of naturally regenerated populations are recommended to maintain G. crinita genetic resources in order to cope with potential inbreeding depression and environmental changes.
To increase genetic variation in planted populations, we recommend further sampling, the collection of G. crinita seeds over an extensive geographic range (including various natural stands), and the establishment of seedlings and clonal seed orchards.
Supplementary Materials
The following are available online at https://www.mdpi.com/1999-4907/11/8/795/s1, Figure S1: Dendrogram based on 171 AFLP loci for 58 samples of G. crinita. Samples in green, black and blue are from natural, cultivated and semi-domesticated populations, respectively. Figure S2: Principal coordinate analysis of the 58 samples belonging to eight provenances of G. crinita, based on AFLP analysis.
Author Contributions
Conceptualization, L.L.T.-C. and P.H.Č.; methodology, L.L.T.-C. and P.H.Č.; formal analysis, L.L.T.-C. and P.H.Č. writing—original draft preparation, L.L.T.-C. and B.L.; writing—review and editing, P.H.Č., B.L., J.C.W.; Supervision of the research, B.L., P.H.Č.; project administration, B.L.; funding acquisition, B.L. All authors have read and agreed to the published version of the manuscript.
Funding
The research was funded by the Internal Grant Agency of Czech University of Life Science Prague CIGA (Project No. 20205003).
Acknowledgments
The authors thank the collaboration of the Peruvian Amazon Research Institution (IIAP) and to Ing. Walter Rios Perez and Gabriel Morales Alejo in the collection of samples. We would like to thank Bohumil Mandák for support on Structure analysis and Antony Del Aguila Heller for help with Figure 1.
Conflicts of Interest
The authors declare no conflict of interest.
References
- O’Neill, G.; Dawson, I.; Sotelo-Montes, C.; Guarino, L.; Guariguata, M.; Current, D.; Weber, J.C. Strategies for genetic conservation of trees in the Peruvian Amazon. Biodivers Conserv. 2001, 10, 837–850. [Google Scholar] [CrossRef]
- Schnabel, A.; Hamrick, J.L. Organization of genetic diversity within and among populations of Gleditsia triacanthos (Leguminosae). Am. J. Bot. 1990, 77, 1060–1069. [Google Scholar] [CrossRef]
- Mertz, O.; Wadley, R.L.; Nielsen, U.; Bruun, B.T.; Colfer, C.J.P.; de Neergaard, A.; Jepsen, M.R.; Martinussen, T.; Zhao, Q.; Noweg, G.T.; et al. A fresh look at shifting cultivation: Fallow length and uncertain indicator of productivity. Agric. Syst. 2008, 96, 75–84. [Google Scholar] [CrossRef]
- Weber, J.C.; Sotelo-Montes, C.; Vidaurre, H.; Dawson, I.K.; Simons, A.J. Participatory domestication of agroforestry trees: An example from the Peruvian Amazon. Dev. Pract. 2001, 11, 425–433. [Google Scholar] [CrossRef]
- Lengkeek, A.G.; Muchugi-Mwangi, A.; Agufa, C.A.C.; Ahenda, J.O.; Dawson, I.K. Comparing genetic diversity in agroforestry systems with natural forest: A case study of the important timber tree Vitex fischeri in central Kenya. Agrofor. Syst. 2006, 67, 293–300. [Google Scholar] [CrossRef]
- Hollingsworth, P.; Dawson, I.; Goodall-Copestake, W.; Richardson, J.; Weber, J.C.; Sotelo-Montes, C.; Pennington, T. Do farmers reduce genetic diversity when they domesticate tropical trees? A case study from Amazonia. Mol. Ecol. 2005, 14, 497–501. [Google Scholar] [CrossRef]
- Sotelo-Montes, C.; Weber, J.C. Priorización de especies arbóreas para sistemas agroforestales en la selva baja del Perú. Agrofor. Am. 1997, 4, 12–17. [Google Scholar]
- Encarnación, F. Nomenclatura de las Especies Forestales Comunes en el Perú; Ministerio de Agricultura, Instituto Nacional Forestal y de Fauna: Lima, Peru, 1983; p. 149.
- Labarta, R.A.; Weber, J.C. Valorización económica de bienes tangibles de cinco especies arbóreas agroforestales en la Cuenca Amazónica Peruana. Rev. For. Centroam. 1998, 23, 12–21. [Google Scholar]
- Putzel, L.; Cronkleton, P.; Larson, A.; Pinedo-Vasquez, M.; Salazar, O.; Sears, R. Peruvian Smallholder Production and Marketing of Bolaina (Guazuma Crinita), a Fast-Growing Amazonian Timber Species: Call for a Pro-Livelihoods Policy Environment. Available online: http://www.cifor.org/library/4257 (accessed on 15 April 2017).
- Sotelo-Montes, C.; Vidaurre, H.; Weber, J.C.; Simons, A.J.; Dawson, I. Producción de semillas a partir de la domesticación participativa de árboles agroforestales en la amazonia peruana. In Proceedings of the Memorias del Segundo Symposio sobre Avances en la Producción de Semillas Forestales en América Latina. Proyecto de Semillas Forestales (PROSEFOR), Centro de Agricultura Tropical y de Enseñanza (CATIE) y International Union of Forest Research Organizations (IUFRO): Santo Domingo, República Dominica, 18–22 October 1999; Salazar, R., Ed.; CATIE: Turrialba, Costa Rica; pp. 65–72.
- IIAP (Instituto de Investigación de la Amazonía Peruana, PE). Evaluación Económica de Parcelas de Regeneración Natural y Plantaciones de Bolaina Blanca, Guazuma Crinita, en el Departamento de Ucayali; Instituto de Investigación de la Amazonía Peruana: Loreto, Peru, 2009; p. 54. [Google Scholar]
- Toledo, E.; Rincon, C. Utilización Industrial de Nuevas Especies Forestales en el Perú; Cámara Nacional Forestal, Instituto Nacional de Recursos Naturales, Organización Internacional de las Maderas Tropicales: Lima, Peru, 1996. [Google Scholar]
- Rochon, C.; Margolis, H.A.; Weber, J.C. Genetic variation in growth of Guazuma crinita (Mart.) trees at an early age in the Peruvian Amazon. Forest Ecol. Manag. 2007, 243, 291–298. [Google Scholar] [CrossRef]
- Hamrick, J.L.; Godt, M.J.; Sherman Broyles, S.L. Factors influencing levels of genetic diversity in woody plant species. New Forest 1992, 6, 95–124. [Google Scholar] [CrossRef]
- Ouborg, N.J.; Piquot, Y.; Van Groenendael, M. Population genetics, molecular markers and the study of dispersal in plants. J. Ecol. 1990, 87, 551–568. [Google Scholar] [CrossRef]
- Tuisima-Coral, L.; Hlásná-Čepková, P.; Lojka, B.; Weber, J.C.; Filomeno-Alves-Milo, S. Genetic diversity in Guazuma crinita from eleven provenances in the Peruvian Amazon revealed by ISSR markers. Bosque 2016, 37, 63–70. [Google Scholar] [CrossRef] [Green Version]
- Vodouhe, R.; Dansi, A. The “Bringing into Cultivation” Phase of the Plant Domestication Process and its Contributions to In Situ Conservation of Genetic Resources in Benin. Sci. World J. 2012, 176939. [Google Scholar] [CrossRef] [Green Version]
- Hernández, R.C.A.; Kafuri, L.A.; Isaza, R.A.; Arias, M.L. Analysis of genetic variation in clones of rubber (Hevea brasiliensis) from Asian, South and Central American origin using RAPDs markers. Rev. Col. Biotecnol. 2006, 8, 29–34. [Google Scholar]
- Thangjam, R. Inter-Simple Sequence Repeat (ISSR) Marker Analysis in Parkia timoriana (DC.) Merr. Populations from Northeast India. Appl. Biochem. Biotech. 2014, 172, 1727–1734. [Google Scholar] [CrossRef] [PubMed]
- Nazareno, A.G.; Bemmels, J.B.; Dick, C.W.; Lohmann, L.I.G. Minimum sample sizes for population genomics: An empirical study from an Amazonian plant species. Mol. Ecol. Resour. 2017, 17, 1136–1147. [Google Scholar] [CrossRef] [PubMed]
- Rollo, A.; Ribeiro, M.M.; Costa, R.L.; Santos, C.; Clavo, P.Z.M.; Mandák, B.; Kalousová, M.; Vebrová, H.; Chuquilin, E.; Torres, S.G.; et al. Genetic Structure and Pod Morphology of Inga edulis Cultivated vs. Wild Populations from the Peruvian Amazon. Forests 2020, 11, 655. [Google Scholar] [CrossRef]
- Doyle, J.J.; Doyle, J.L. A rapid DNA isolation procedure for small quantities of fresh tissue. Phytochem. Bull. 1987, 19, 11–15. [Google Scholar]
- Russell, J.R.; Fuller, J.D.; Macaulay, M.; Hatz, B.G.; Jahoor, A.; Powell, W.; Waugh, R. Direct comparison of levels of genetic variation among barley accessions detected by RFLPs, AFLPs, SSRs and RAPDs. Theor. Appl. Genet. 1997, 95, 714–722. [Google Scholar] [CrossRef]
- Vos, P.; Hogers, R.; Bleeker, M.; Reijans, M.; Lee van de, T.; Hornes, M.; Frijters, A.; Pot, J.; Peleman, J.; Kuiper, M.; et al. AFLP: A new technique for DNA fingerprinting. Nucleic Acids Res. 1995, 23, 4407–4414. [Google Scholar] [CrossRef] [Green Version]
- Mikulášková, E.; Fér, T.; Kučabová, V. The effect of different DNA isolation protocols and AFLP fingerprinting optimizations on error rate estimates in the bryophyte Campylopus introflexus. Lindbergia 2012, 35, 7–17. [Google Scholar]
- Yeh, F.C.; Yang, R.C.; Boyle, T.B.; Ye, Z.H.; Mao, J.X. POPGENE ver. 1.32 the User-Friendly Shareware for Population Genetic Analysis. Molecular Biology and Biotechnology Center, University of Alberta: Edmonton, AB, Canada, 1997. Available online: http://www.ualberta.ca/∼fyeh/ (accessed on 10 March 2020).
- Peakall, R.; Smouse, P.E. GenAlEx 6.5: Genetic analysis in Excel. Population genetic software for teaching and research-an update. Bioinformatics 2012, 28, 2537–2539. [Google Scholar] [CrossRef] [PubMed] [Green Version]
- Perrier, X.; Jacquemoud-Collet, J.P. Darwin software. Available online: http://darwin.cirad.fr/darwin (accessed on 12 March 2020).
- Pritchard, J.; Stephens, M. Inference of population structure using multilocus genotype data. Genetics 2000, 155, 945–959. [Google Scholar] [PubMed]
- Pritchard, J.K.; Wen, W. Documentation for structure 2.0b. Available online: http://pritch.bsd.uchicago.edu (accessed on 1 April 2020).
- Evanno, G.; Regnaut, S.; Goudet, J. Detecting the number of clusters of individuals using the software structure: A simulation study. Mol. Ecol. 2005, 14, 2611–2620. [Google Scholar] [CrossRef] [Green Version]
- Earl, D.A.; von Holdt, B.M. STRUCTURE HARVESTER: A website and program for visualizing STRUCTURE output and implementing the Evanno method. Conserv. Genet. Resour. 2012, 4, 359–361. [Google Scholar] [CrossRef]
- Rosenberg, N.A. DISTRUCT: A program for the graphical display of population structure. Mol. Ecol. Notes 2004, 4, 137–138. [Google Scholar] [CrossRef]
- Bonin, A.; Bellemain, E.; Bronken-Eidesen, P.; Pompanon, F.; Brochmann, C.; Taberlet, P. How to track and assess genotyping errors in population genetic studies. Mol. Ecol. 2004, 13, 3261–3273. [Google Scholar] [CrossRef]
- Weber, J.C.; Sotelo-Montes, C. Geographic variation in tree growth and wood density of Guazuma crinita Mart. in the Peruvian Amazon. New Forest 2008, 36, 29–52. [Google Scholar] [CrossRef]
- Weber, J.C.; Montes, C.S.; Cornelius, J.; Ugarte, J. Genetic variation in tree growth, stem form and mortality of Guazuma crinita in slower- and faster-growing plantations in the Peruvian Amazon. Silvae Genet. 2011, 30, 70–78. [Google Scholar] [CrossRef] [Green Version]
- White, T.L.; Adams, W.T.; Neale, D.B. Within Population Variation, Genetic Diversity, Mating Systems and Stand Structures; CABI Publishing, Ed.; Forest Genetics: Cambridge, UK, 2007; pp. 149–283. [Google Scholar]
- Hamrick, J.L.; Godt, M.J.W. Allozyme diversity in plant species. In Plant Population Genetics, Breeding and Genetic Resources; Brown, H.D., Clegg, M.T., Kahler, A.L., Weir, B.S., Eds.; Sinauer Associates: Sunderland, MA, USA, 1989; pp. 43–64. [Google Scholar]
- Reynel, C.; Pennington, R.; Pennington, T.; Flores, D.; Daza, C.A. Árboles útiles de la Amazonía Peruana, Manual de Identificación Ecológica y Propagación de las Especies; Universidad Nacional Agraria La Molina: Lima, Peru, 2003; p. 509. [Google Scholar]
- Abo-elwafa, A.K.; Shimada, M.T. Intra and inter specific variations in Lens revealed by RAPD markers. Theor. Appl. Genet. 1995, 90, 335–340. [Google Scholar] [CrossRef]
- Lu, Y.; Chen, C.; Wang, R.; Egan, A.; Fu, C. The effects of domestication on genetic diversity in Chimonanthus praecox: Evidence from cpDNA and AFLP data. J. Syst. Evol. 2015, 53, 239–251. [Google Scholar] [CrossRef]
- Simons, A.J.; MacQueen, D.J.; Stewart, J.L. Strategic concepts in the breeding of non-industrial trees. In Tropical Trees: The Potential for Domestication and the Rebuilding of Forest Resources, Proceedings of a conference organized by the Edinburgh Centre for Tropical Forests, Heriot-Watt University, Edinburgh, UK, 23-28 August 1992; Leakey, R.R.B., Newton, A.C., Eds.; HMSO: Edinburgh, UK, 1994; pp. 91–102. [Google Scholar]
- Aravanopoulos, F.A.P. Do Silviculture and Forest Management Affect the Genetic Diversity and Structure of Long-Impacted Forest Tree Populations? Forests 2018, 9, 355. [Google Scholar] [CrossRef] [Green Version]
- Ruņģis, D.; Luguza, S.; Bāders, E.; Šķipars, V.; Jansons, Ā. Comparison of Genetic Diversity in Naturally Regenerated Norway Spruce Stands and Seed Orchard Progeny Trials. Forests 2019, 10, 926. [Google Scholar] [CrossRef] [Green Version]
- Wang, B.; Mao, J.F.; Zhao, W.; Wang, X.R. Impact of geography and climate on the genetic differentiation of the subtropical pine Pinus yunnanensis. PLoS ONE 2013, 8, e67345. [Google Scholar] [CrossRef] [PubMed]
- Tong, Y.W.; Lewis, B.J.; Zhou, W.M.; Mao, C.R.; Wang, Y.; Zhou, L.; Yu, D.P.; Dai, L.M.; Qi, L. Genetic Diversity and Population Structure of Natural Pinus koraiensis Populations. Forests 2020, 11, 39. [Google Scholar] [CrossRef] [Green Version]
- Russell, J.R.; Weber, J.C.; Booth, A.; Powell, W.; Sotelo-Montes, C.; Dawson, I.K. Genetic variation of Calycophyllum spruceanum in the Peruvian Amazon basin, revealed by AFLP analysis. Mol. Ecol. 1999, 8, 199–204. [Google Scholar] [CrossRef]
- Nassar, J.M.; García-Rivas, A.E.; González, J.A. Patrones de diversidad genética en especies arbóreas de bosques fragmentados en Venezuela. Interciencia 2011, 36, 914–922. [Google Scholar]
- Pär, K.I.; Dahlberg, H. The effects of clonal forestry on genetic diversity in wild and domesticated stands of forest trees. Scand. J. For. Res. 2019, 34, 370–379. [Google Scholar] [CrossRef]
- Finkeldey, R.; Hattemer, H.H. Tropical Forest Genetics; Springer: Berlin/Heidelberg, Germany, 2007; p. 315. [Google Scholar] [CrossRef]
- Lemes, M.R.; Gribel, R.; Procor, J.; Grattapaglia, D. Population genetic structure of mahogany (Swietenia macrophylla King, Meliaceae) across the Brazilian Amazon, based on microsatellite at the loci: Implication for conservation. Mol. Ecol. 2003, 12, 2875–2883. [Google Scholar] [CrossRef]
- Kelly, B.A.; Hardy, O.J.; Bouver, J.M. Temporal and spatial genetic structure in Vitellaria paradoxa (shea tree) in an agroforestry system in southern Mali. Mol. Ecol. 2004, 13, 1231–1240. [Google Scholar] [CrossRef]
- Nelson, M.F.; Anderson, N.O. How many marker loci are necessary? Analysis of dominant marker data sets using two popular population genetic algorithms. Ecol. Evol. 2013, 3, 3455–3470. [Google Scholar] [CrossRef] [PubMed]
Figure 1.
Map of the geographic distribution of eight Guazuma crinita provenances sampled in Peru. NP = Nuevo Piura—naturally regenerated population. TM = Tingo Maria—cultivated population. NR = Nueva Requena, SA = San Alejandro, PI = Puerto Inca, CU = Curimana, MA = Macuya and TS = Tahuayo—semi-domesticated populations.

Figure 2.
Population structure for the 58 G. crinita samples from eight provenances at two K value. The provenance codes are given above, and the numbers of samples per provenance are given below.
Figure 2.
Population structure for the 58 G. crinita samples from eight provenances at two K value. The provenance codes are given above, and the numbers of samples per provenance are given below.


Table 1.
Origin of the 58 G. crinita individuals analysed by amplified fragment length polymorphic (AFLP) markers.
Table 1.
Origin of the 58 G. crinita individuals analysed by amplified fragment length polymorphic (AFLP) markers.
| Provenance | Region | No. of Samples (Code) | Population Type |
|---|---|---|---|
| Nuevo Piura (NP) | Ucayali | 19 (NP 1, 2, 3, ... 19) | Natural regeneration |
| Tingo Maria (TM) | Huanuco | 15 (TM 1, 2, 3, ... 15) | Cultivated 1 |
| Nueva Requena (NR) | Ucayali | 5 (NR 7, 8, 11, 12, 13) | Semi-domesticated 2 |
| Tahuayo Stream (TS) | Ucayali | 3 (TS 1, 2,9) | Semi-domesticated |
| San Alejandro (SA) | Ucayali | 5 (SA 1, 10, 11, 14, 15) | Semi-domesticated |
| Curimana (CU) | Ucayali | 4 (CU 3, 4, 6, 7) | Semi-domesticated |
| Puerto Inca (PI) | Huanuco | 3 (PI 1, 3, 13) | Semi-domesticated |
| Macuya (MA) | Huanuco | 5 (MA11, 33, 36, 42, 46) | Semi-domesticated |
1 Samples cultivated in a home garden; 2 genotypes established in a clonal multiplication garden.
Table 2.
Description of the primer combinations.
| No. | Primer Combination | No. of Fragments | Fragment Range Size (pb) | Polymorphic Bands (%) |
|---|---|---|---|---|
| 1 | EcoRI-ACG/MseI- CTT | 35 | 58–231 | 20.6 |
| 2 | EcoRI-ACG/MseI- CTG | 23 | 60–215 | 13.5 |
| 3 | EcoRI-ACG/MseI- CTA | 19 | 69–198 | 11.1 |
| 4 | EcoRI-ACG/MseI- CAT | 27 | 52–176 | 15.9 |
| 5 | EcoRI-ACG/MseI- CAG | 10 | 71–140 | 5.9 |
| 6 | EcoRI-ACG/MseI- CAC | 29 | 64–336 | 17.0 |
| 7 | EcoRI-ACG/MseI- CAA | 28 | 52–228 | 16.4 |
| Total | 171 |
Table 3.
Measurements of genetic diversity in three types of populations of G crinita: natural regeneration, cultivated and semi domesticated.
Table 3.
Measurements of genetic diversity in three types of populations of G crinita: natural regeneration, cultivated and semi domesticated.
| Samples | N° of Samples | N° of PF | PPF (%) | Nei’s Gene Diversity (He) | Shannon Information Index (I) |
|---|---|---|---|---|---|
| Types of population | |||||
| Natural regeneration | 19 | 124 | 72.5 | 0.10 | 0.19 |
| Cultivated | 15 | 84 | 49.1 | 0.09 | 0.15 |
| Semi-domesticated | 24 | 93 | 54.4 | 0.09 | 0.16 |
| Provenances | |||||
| Nuevo Piura (NP) | 19 | 124 | 72.5 | 0.10 | 0.19 |
| Tingo Maria (CP) | 15 | 84 | 49.1 | 0.09 | 0.15 |
| Nueva Requena (SDP) | 4 | 35 | 20.5 | 0.06 | 0.10 |
| Tahuayo Stream (SDP) | 3 | 41 | 23.9 | 0.09 | 0.13 |
| San Alejandro (SDP) | 5 | 43 | 25.2 | 0.07 | 0.12 |
| Curimana (SDP) | 4 | 30 | 17.5 | 0.06 | 0.09 |
| Puerto Inca (SDP) | 3 | 31 | 18.1 | 0.07 | 0.10 |
| Macuya (SDP) | 5 | 32 | 18.7 | 0.07 | 0.10 |
| Species level | 58 | 170 | 99.4 | 0.11 | 0.20 |
PF = polymorphic fragments; PPF = percentage of polymorphic fragments; NP = natural population, CP = cultivated population, SDP = semi-domesticated population.
Table 4.
Nei’s genetic identity (above diagonal) and genetic distance (below diagonal) among eight G. crinita provenances analysed by AFLP.
Table 4.
Nei’s genetic identity (above diagonal) and genetic distance (below diagonal) among eight G. crinita provenances analysed by AFLP.
| Provenances | NR | TS | SA | CR | NP | TM | PI | MA |
|---|---|---|---|---|---|---|---|---|
| NR | **** | 0.960 | 0.960 | 0.972 | 0.967 | 0.962 | 0.959 | 0.972 |
| TS | 0.040 | **** | 0.939 | 0.948 | 0.950 | 0.951 | 0.943 | 0.951 |
| SA | 0.041 | 0.063 | **** | 0.978 | 0.947 | 0.952 | 0.972 | 0.971 |
| CR | 0.028 | 0.054 | 0.023 | **** | 0.971 | 0.975 | 0.971 | 0.979 |
| NP | 0.033 | 0.051 | 0.054 | 0.029 | **** | 0.989 | 0.939 | 0.963 |
| TM | 0.038 | 0.050 | 0.049 | 0.026 | 0.011 | **** | 0.942 | 0.968 |
| PI | 0.042 | 0.059 | 0.029 | 0.030 | 0.063 | 0.059 | **** | 0.972 |
| MA | 0.029 | 0.050 | 0.030 | 0.022 | 0.037 | 0.032 | 0.029 | **** |
NR = Nueva Requena, TS = Tahuayo Stream, SA = San Alejandro, CR = Curimana River, NP = Nuevo Piura, TM = Tingo Maria, PI = Puerto Inca, MA = Macuya.
Table 5.
Results of the analysis of molecular variation (AMOVA) of 58 G. crinita individuals representing three population types and eight provenances.
Table 5.
Results of the analysis of molecular variation (AMOVA) of 58 G. crinita individuals representing three population types and eight provenances.
| Source of Variance | Degree of Freedom (df) | Sum of Square (SS) | Variance Component | Variance (%) | p Value a |
|---|---|---|---|---|---|
| Among population type | 2 | 99.43 | 1.60 | 12 | ˂0.001 |
| Among provenances | 5 | 69.95 | 0.58 | 4 | ˂0.001 |
| Within provenances | 50 | 583.56 | 11.67 | 84 | ˂0.001 |
| Total | 57 | 752.95 | 13.85 | 100 |
a Significance tests after 999 permutations.
© 2020 by the authors. Licensee MDPI, Basel, Switzerland. This article is an open access article distributed under the terms and conditions of the Creative Commons Attribution (CC BY) license (http://creativecommons.org/licenses/by/4.0/).
Share and Cite
MDPI and ACS Style
Tuisima-Coral, L.L.; Hlásná Čepková, P.; Weber, J.C.; Lojka, B. Preliminary Evidence for Domestication Effects on the Genetic Diversity of Guazuma crinita in the Peruvian Amazon. Forests 2020, 11, 795. https://doi.org/10.3390/f11080795
AMA Style
Tuisima-Coral LL, Hlásná Čepková P, Weber JC, Lojka B. Preliminary Evidence for Domestication Effects on the Genetic Diversity of Guazuma crinita in the Peruvian Amazon. Forests. 2020; 11(8):795. https://doi.org/10.3390/f11080795
Chicago/Turabian StyleTuisima-Coral, Lady Laura, Petra Hlásná Čepková, John C. Weber, and Bohdan Lojka. 2020. "Preliminary Evidence for Domestication Effects on the Genetic Diversity of Guazuma crinita in the Peruvian Amazon" Forests 11, no. 8: 795. https://doi.org/10.3390/f11080795
Note that from the first issue of 2016, this journal uses article numbers instead of page numbers. See further details here.