
Chemical Characterization, Antioxidant Capacity and Anti-Oxidative Stress Potential of South American Fabaceae Desmodium tortuosum

 , ,
, ,  , , , , and
Abstract
:
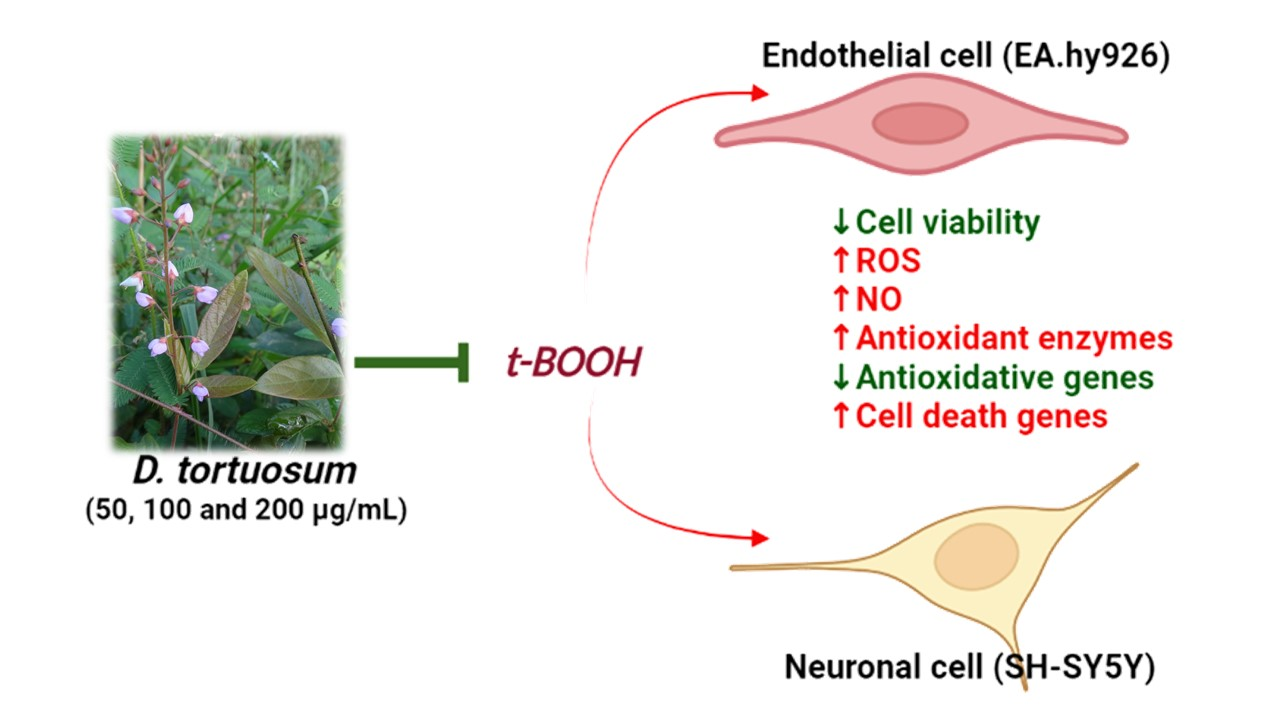
1. Introduction
2. Materials and Methods
2.1. Reagents
2.2. Plant Selection and Extract Preparation
2.3. Chemical Characterization of Extract
2.4. Cell Culture
2.5. Cell Viability Evaluation (MTT)
2.6. Intracellular ROS Production
2.7. Determination of Nitric Oxide (NO) Levels
2.8. Apoptotic Assay with Caspase 3/7 Activity
2.9. Antioxidant Defenses
2.9.1. Reduced Glutathione (GSH)
2.9.2. Antioxidant Enzymes
2.10. Molecular Assay by Real-Time PCR
2.11. Statistics
3. Results
3.1. Chemical Analysis of D. Tortuosom Extract
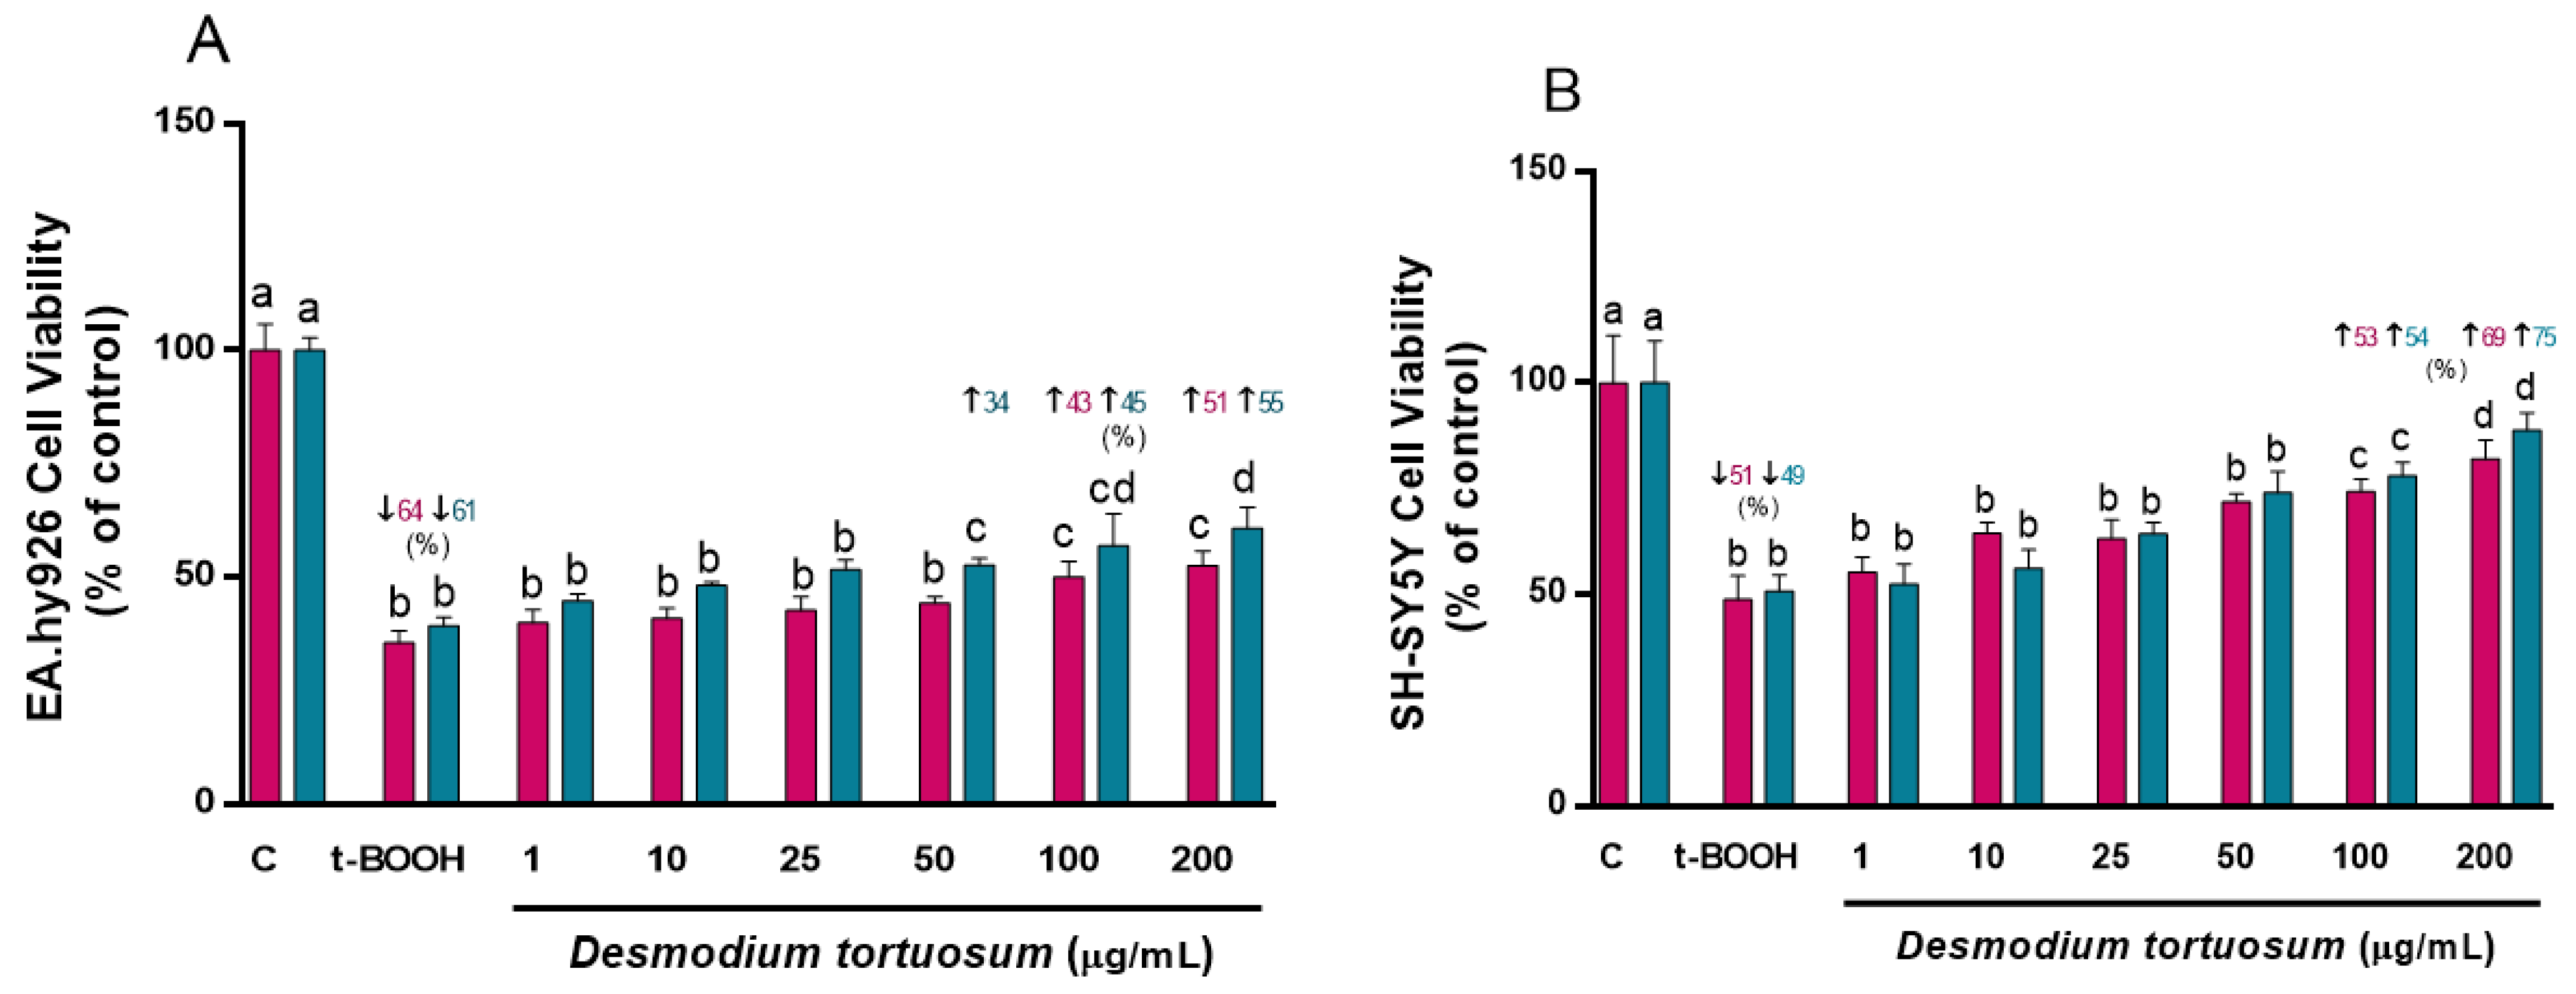
3.2. Cell Viability
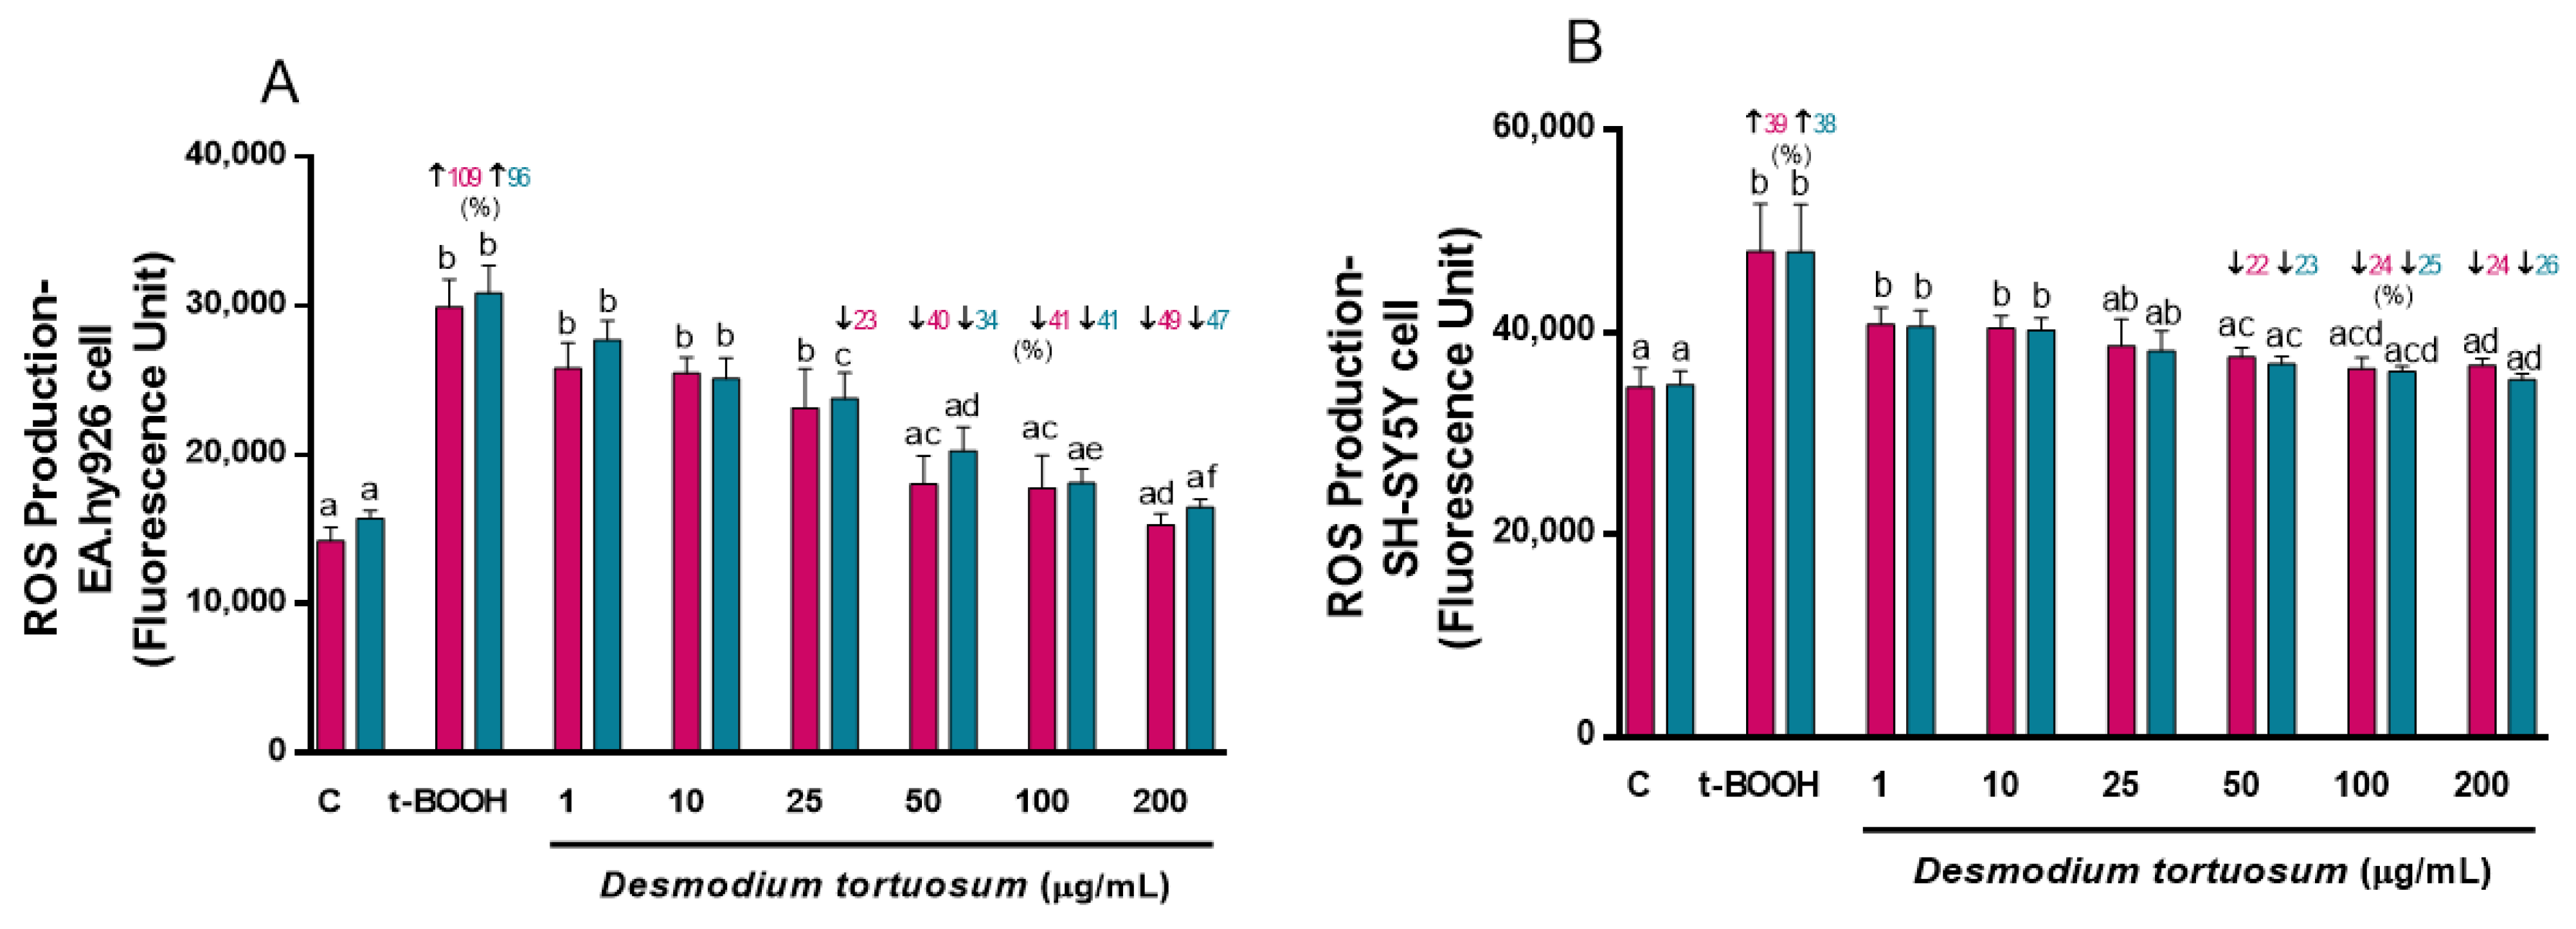
3.3. Intracellular ROS Production
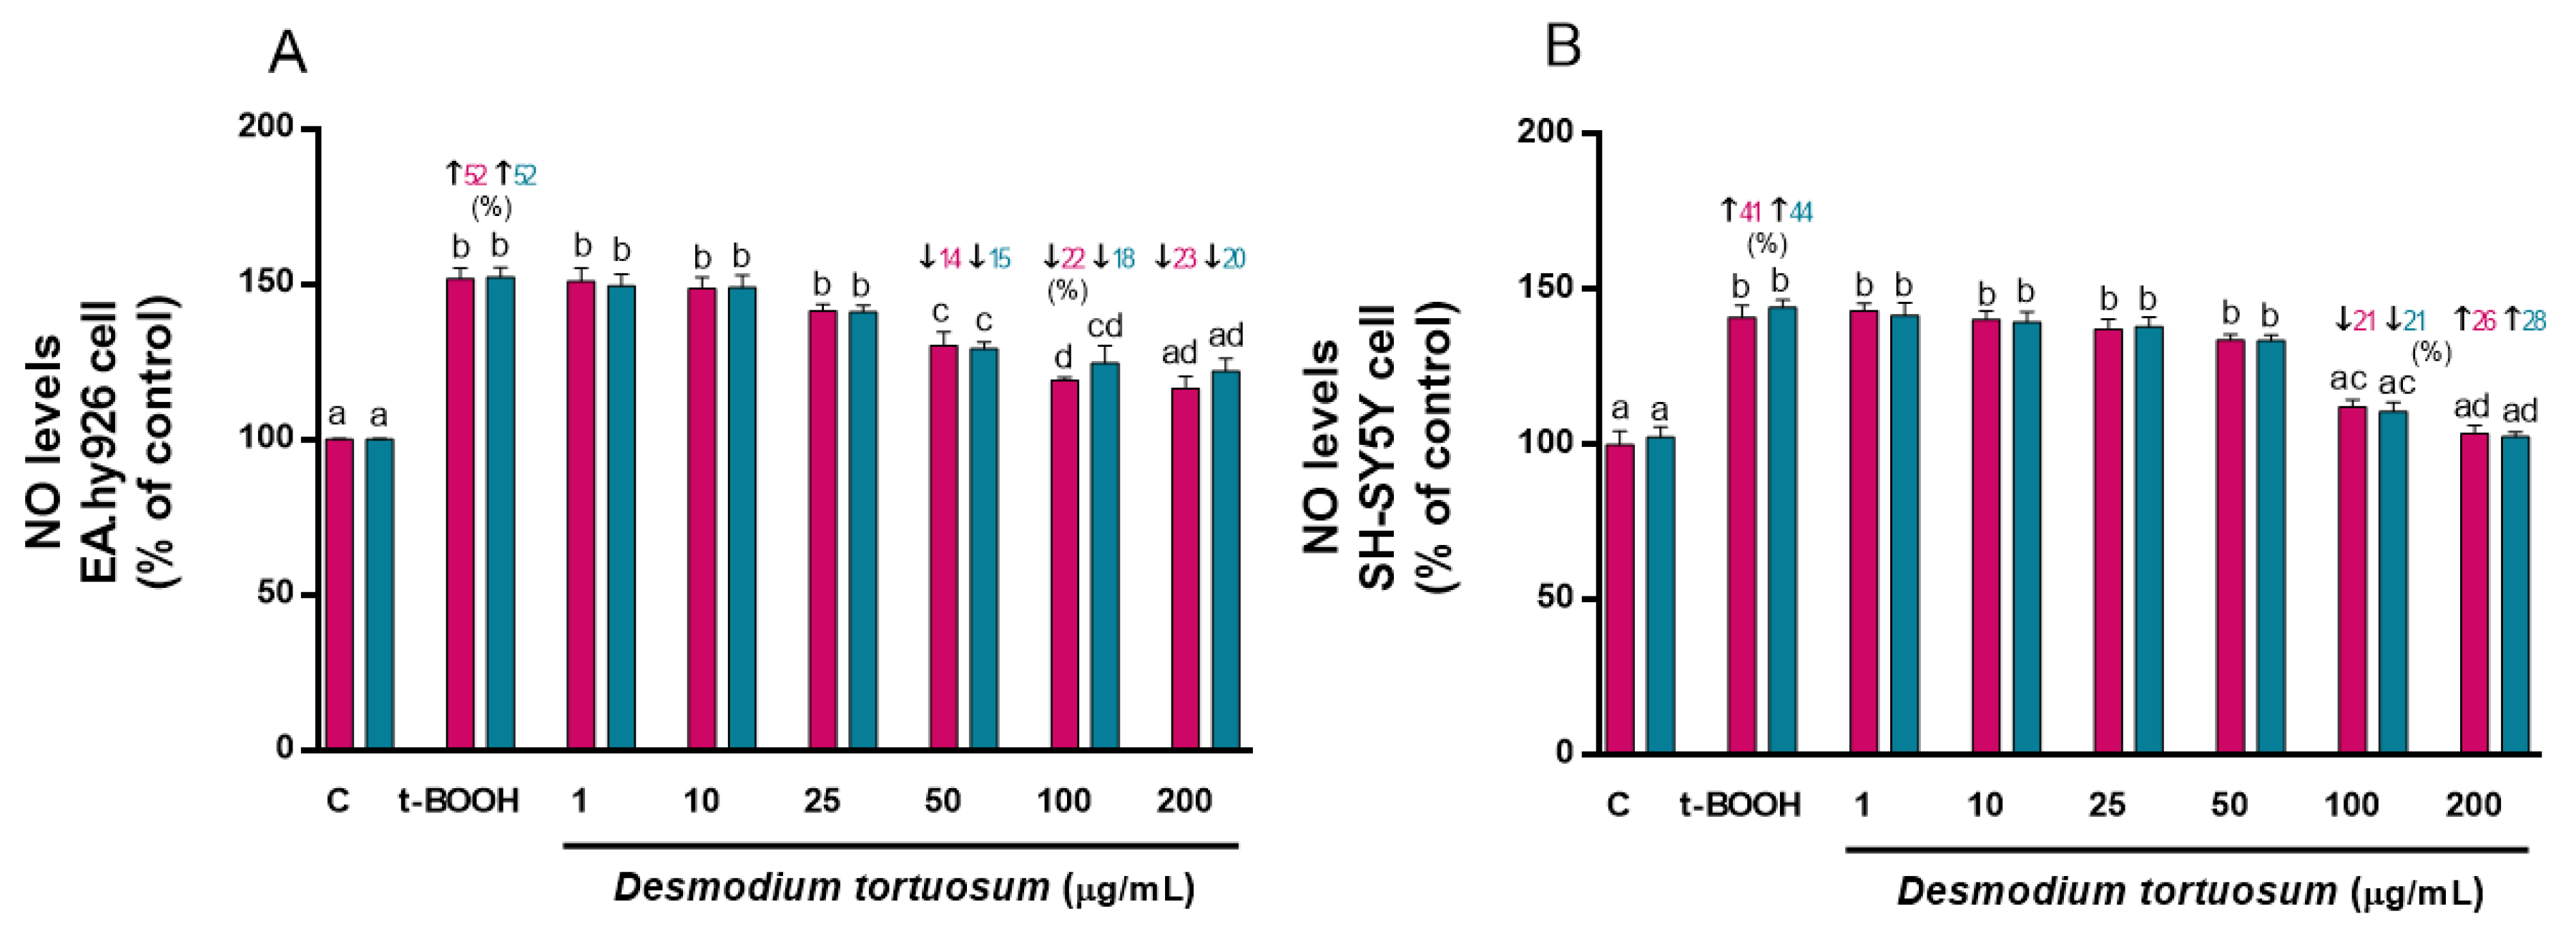
3.4. Determination NO Levels
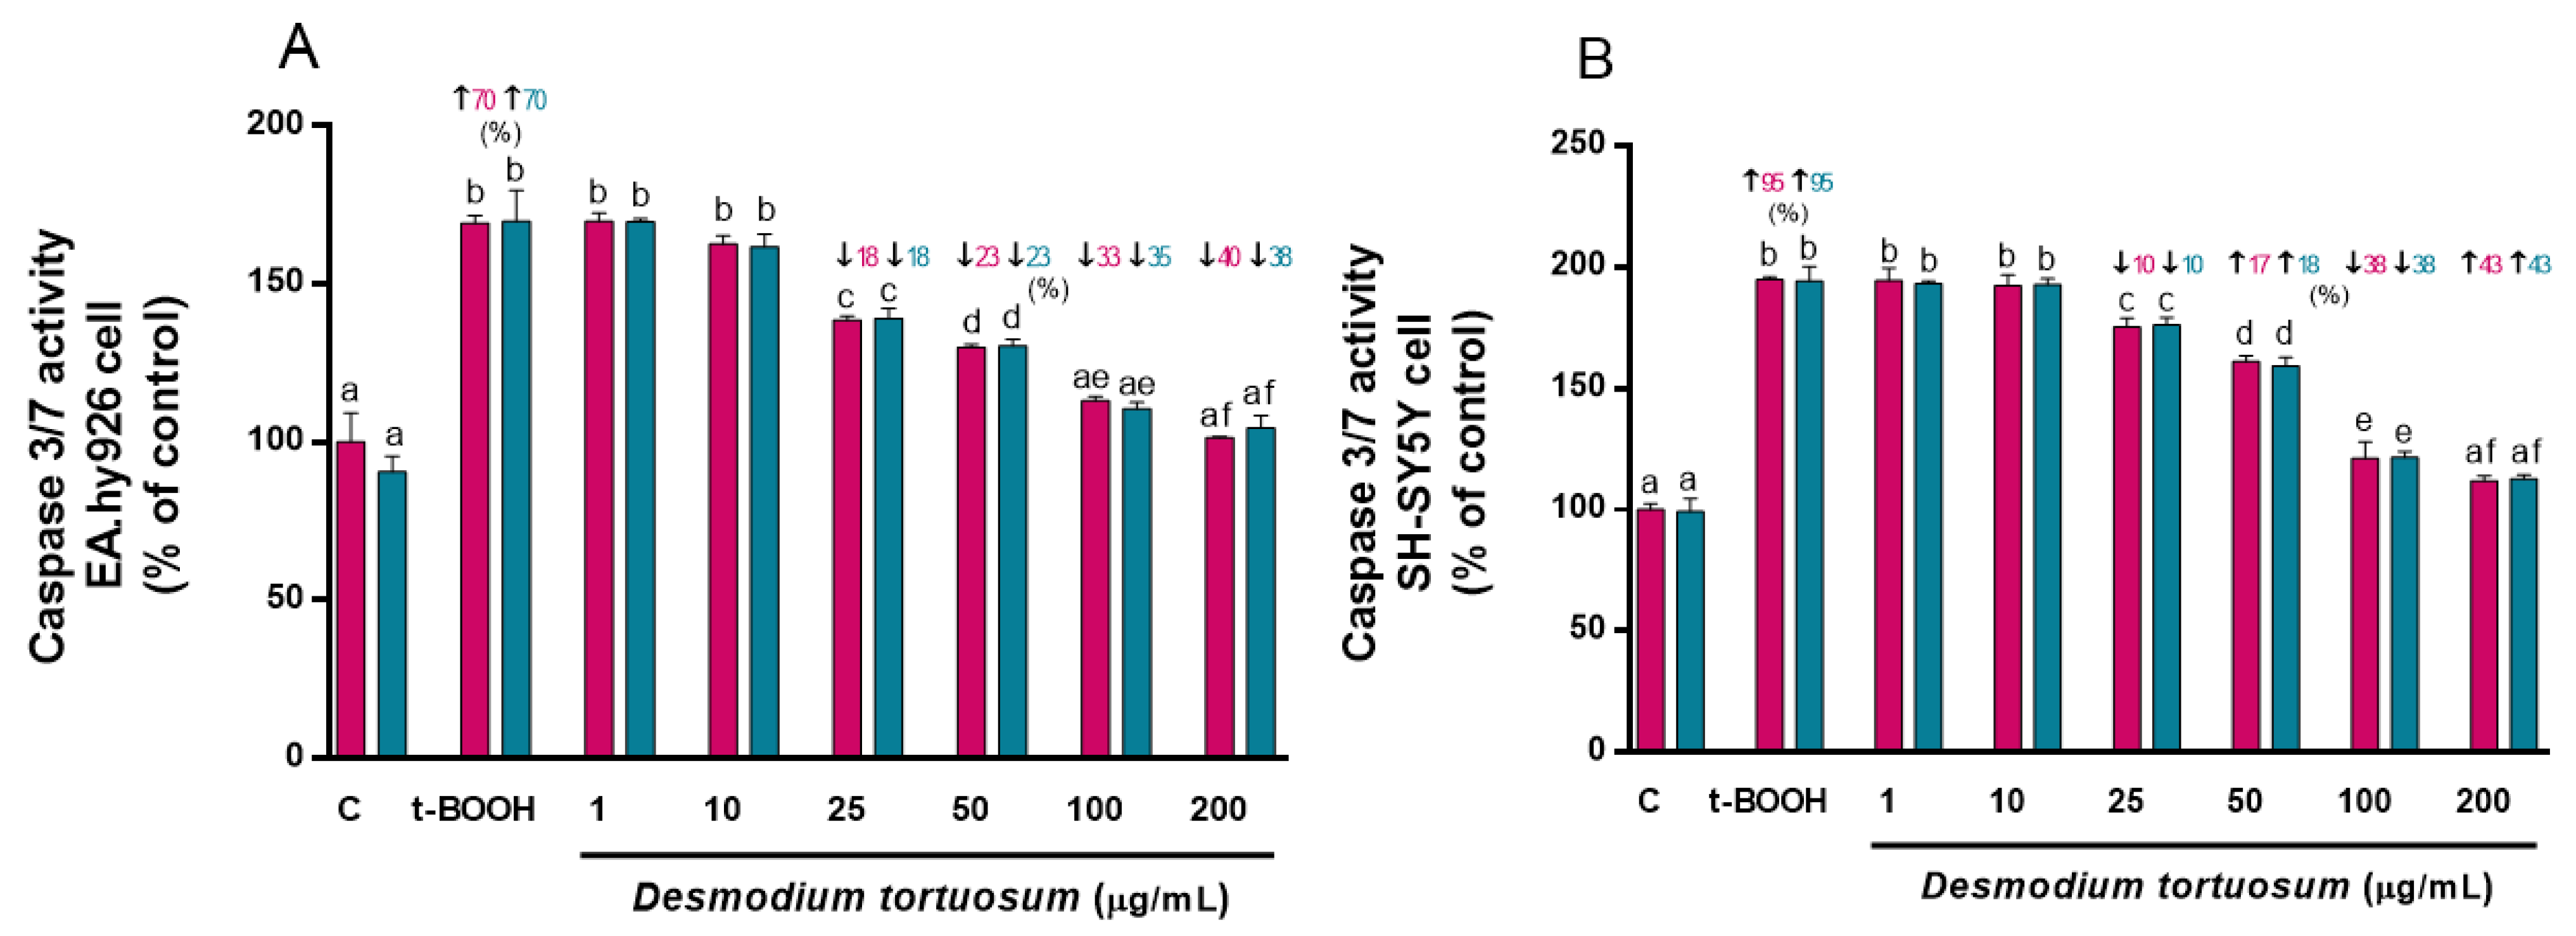
3.5. Apoptotic Assay: Caspase 3/7 Activity
3.6. Antioxidant Defenses
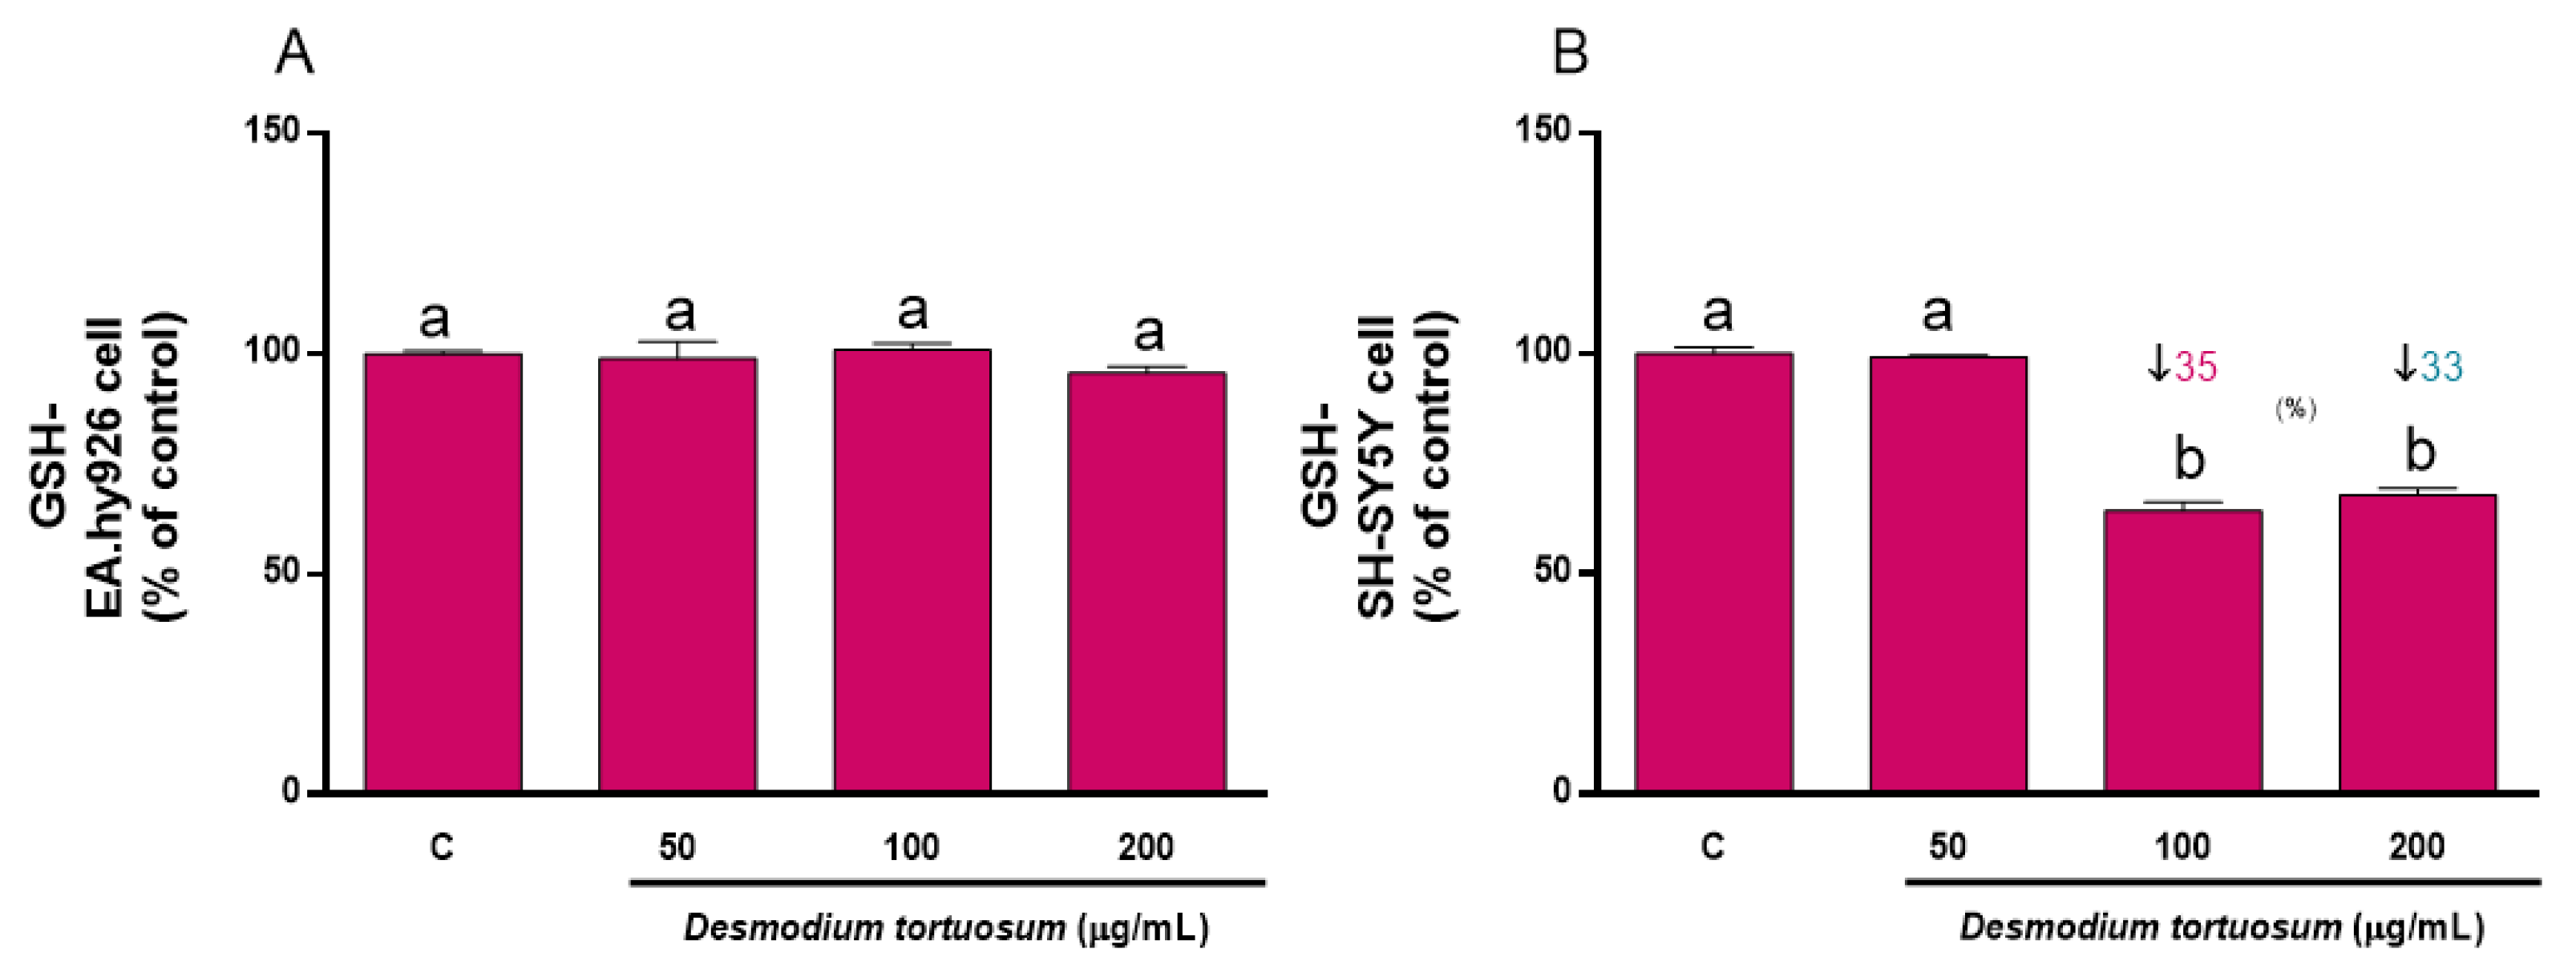
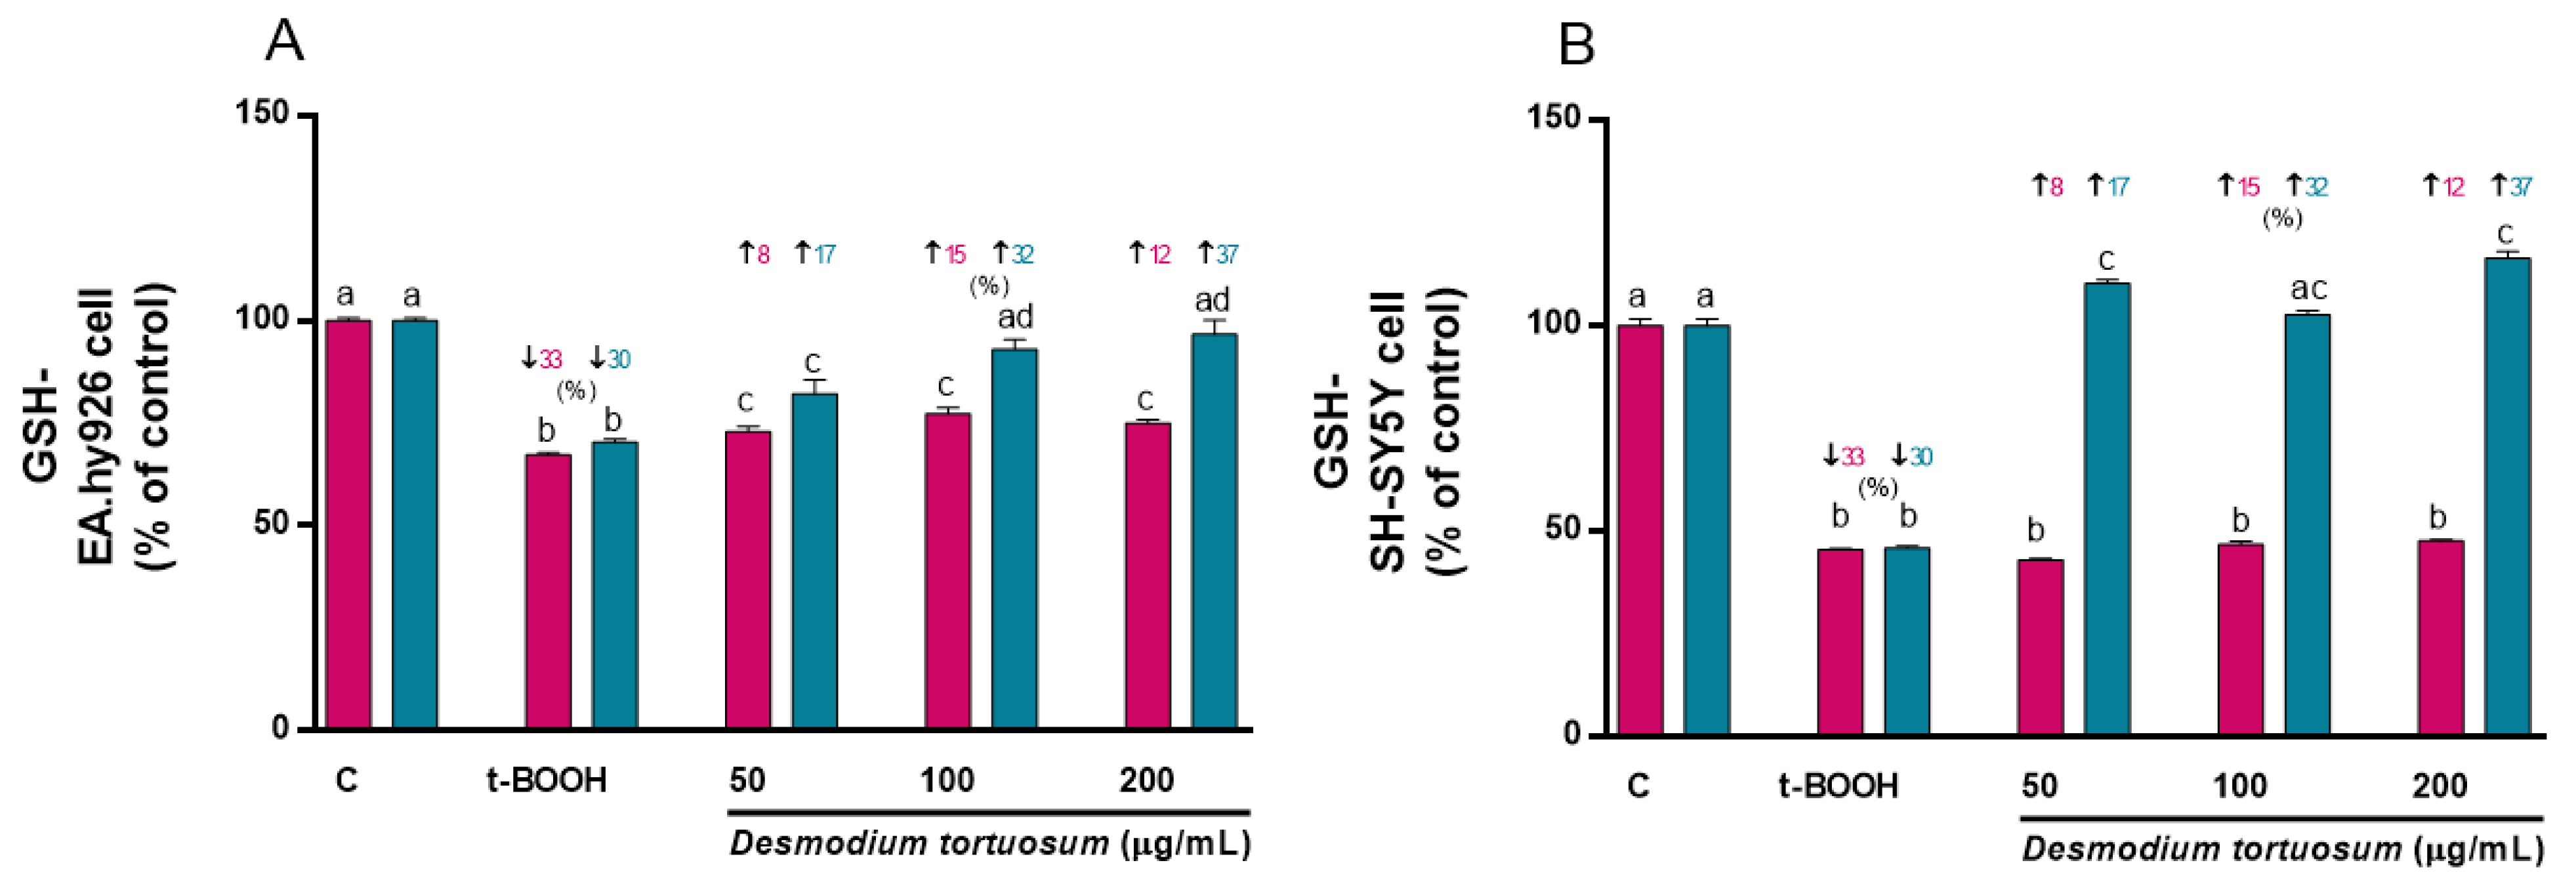
3.6.1. GSH Concentration
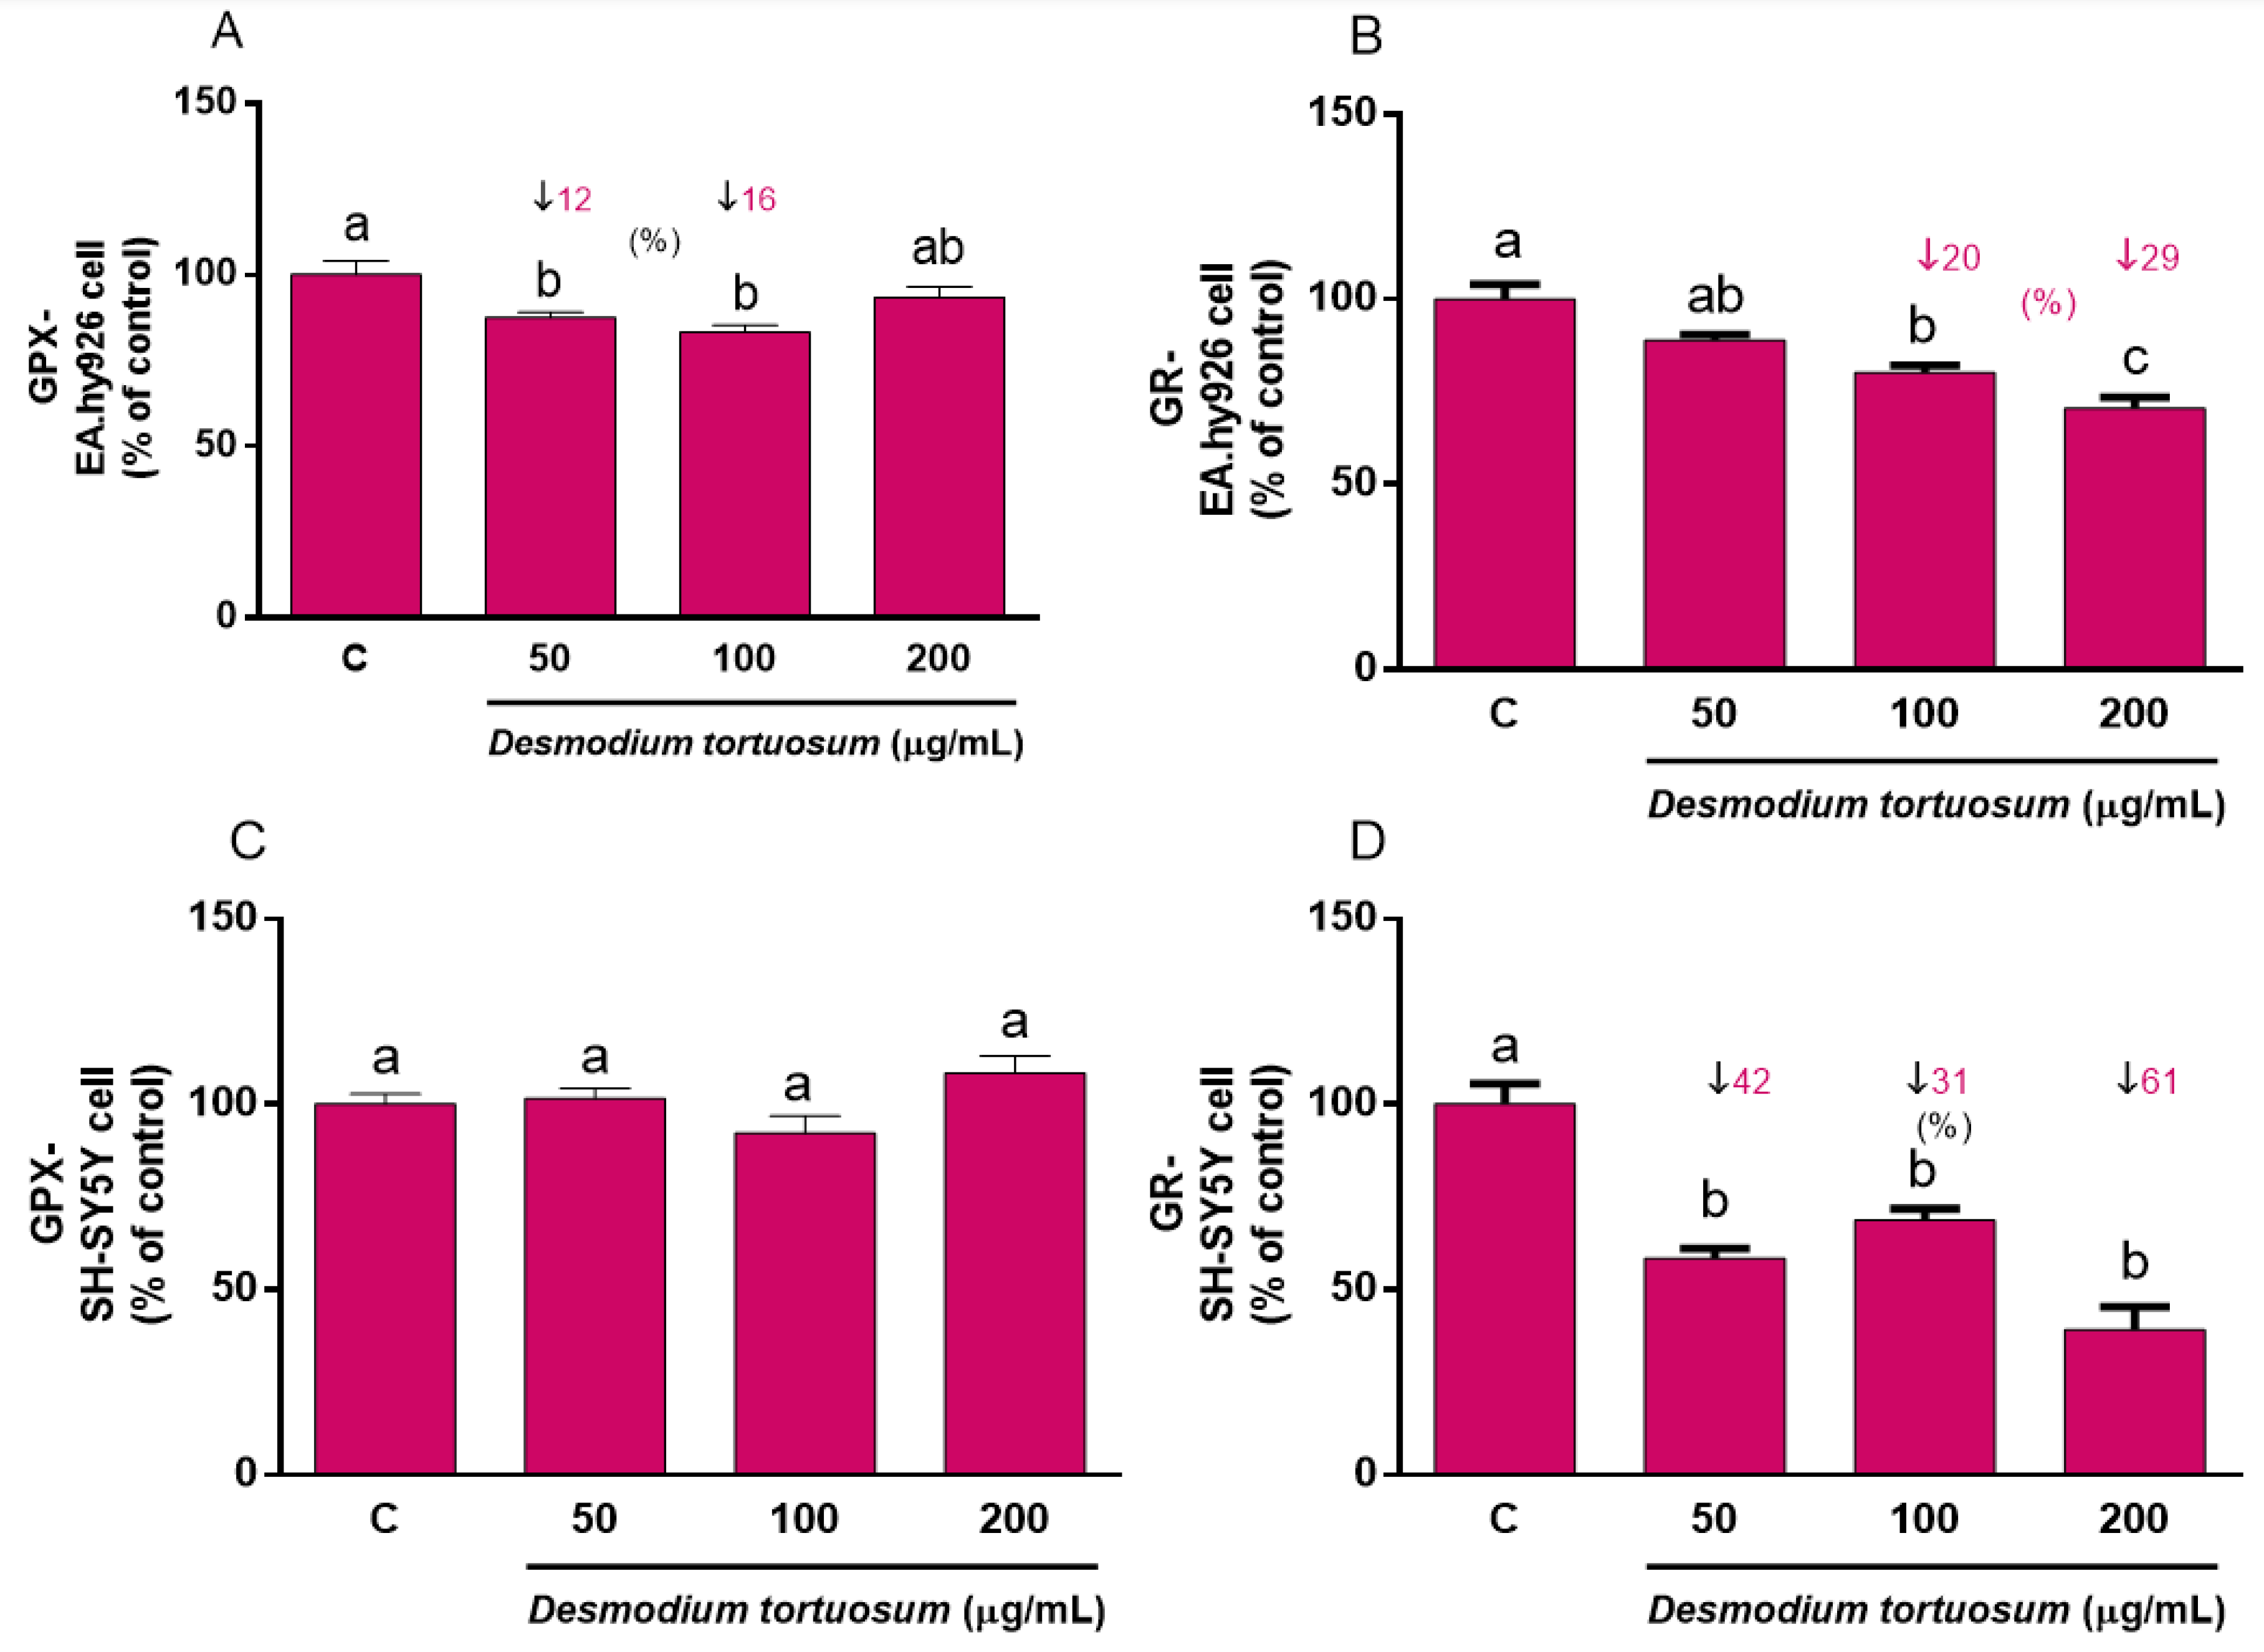
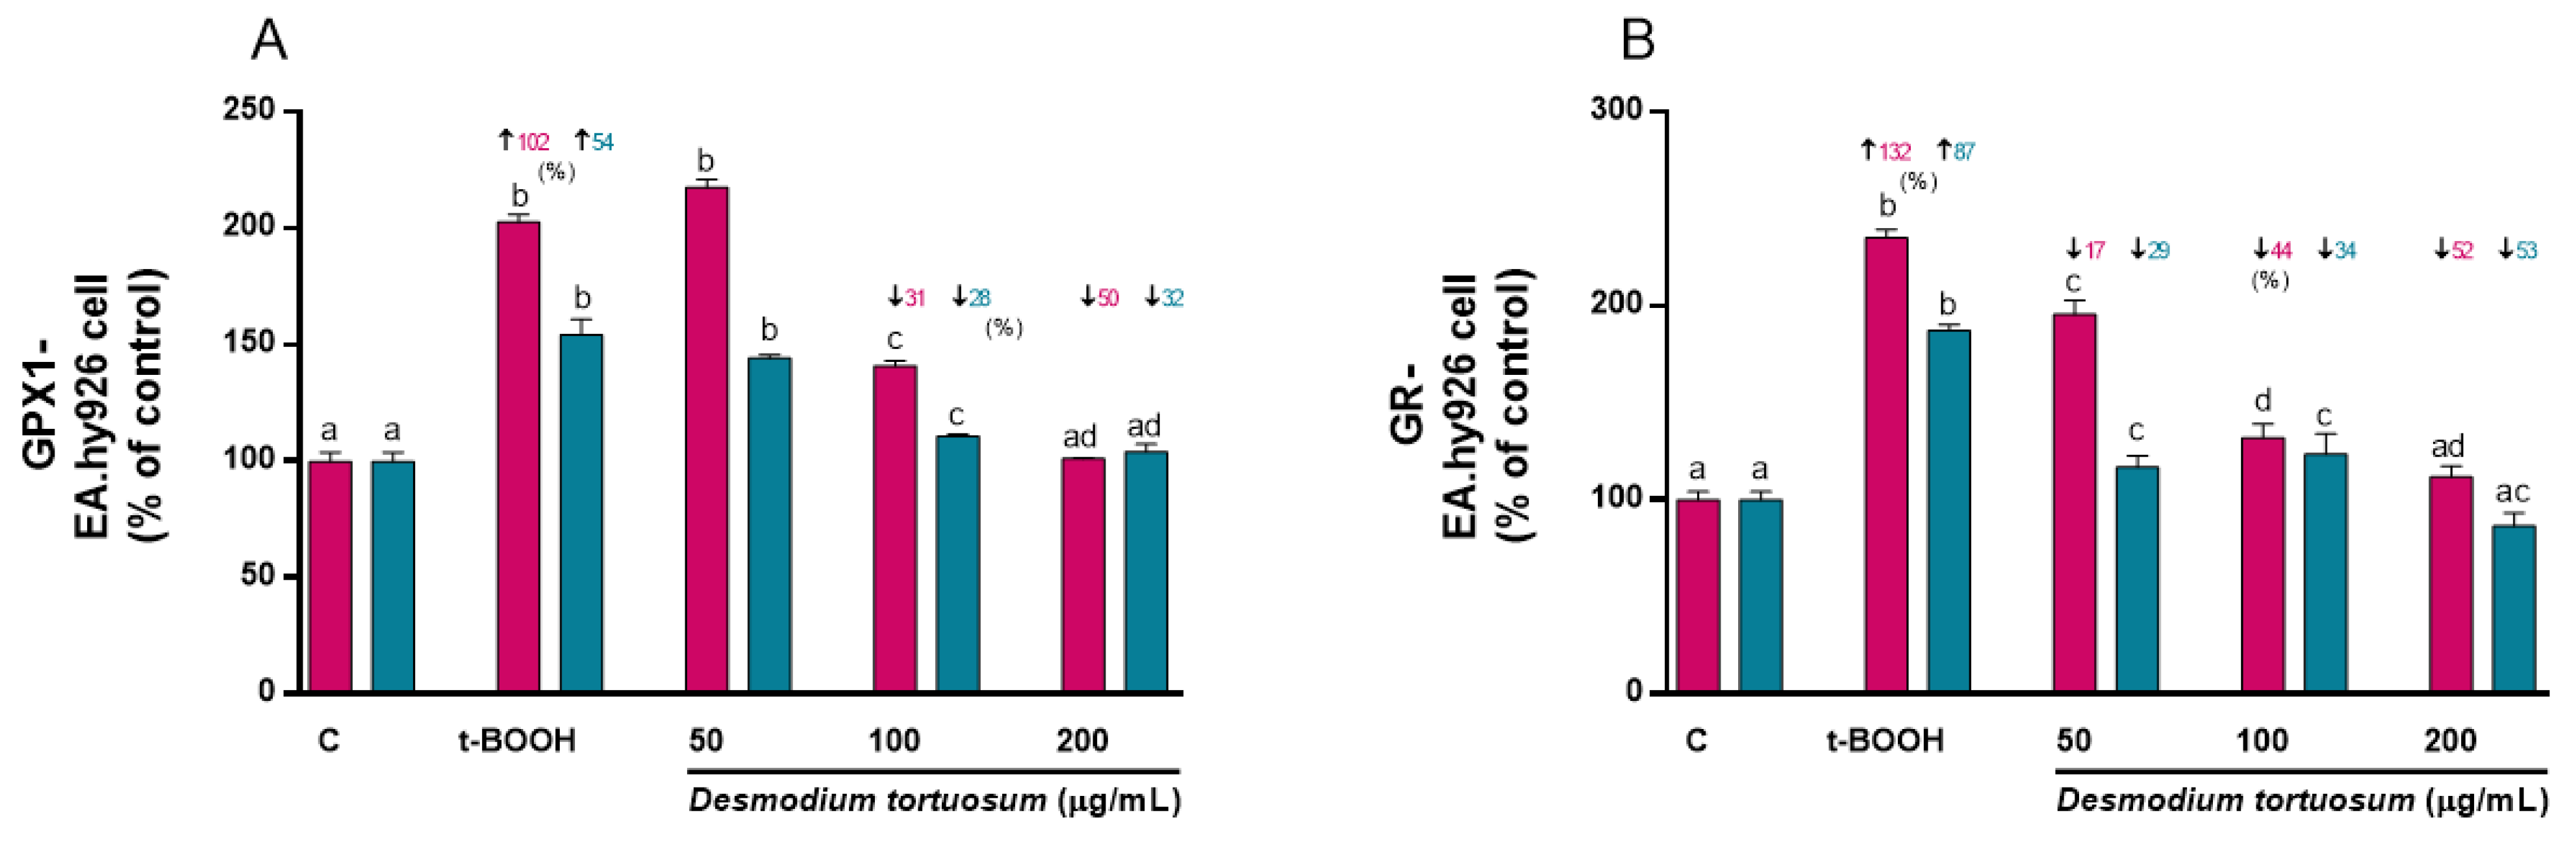
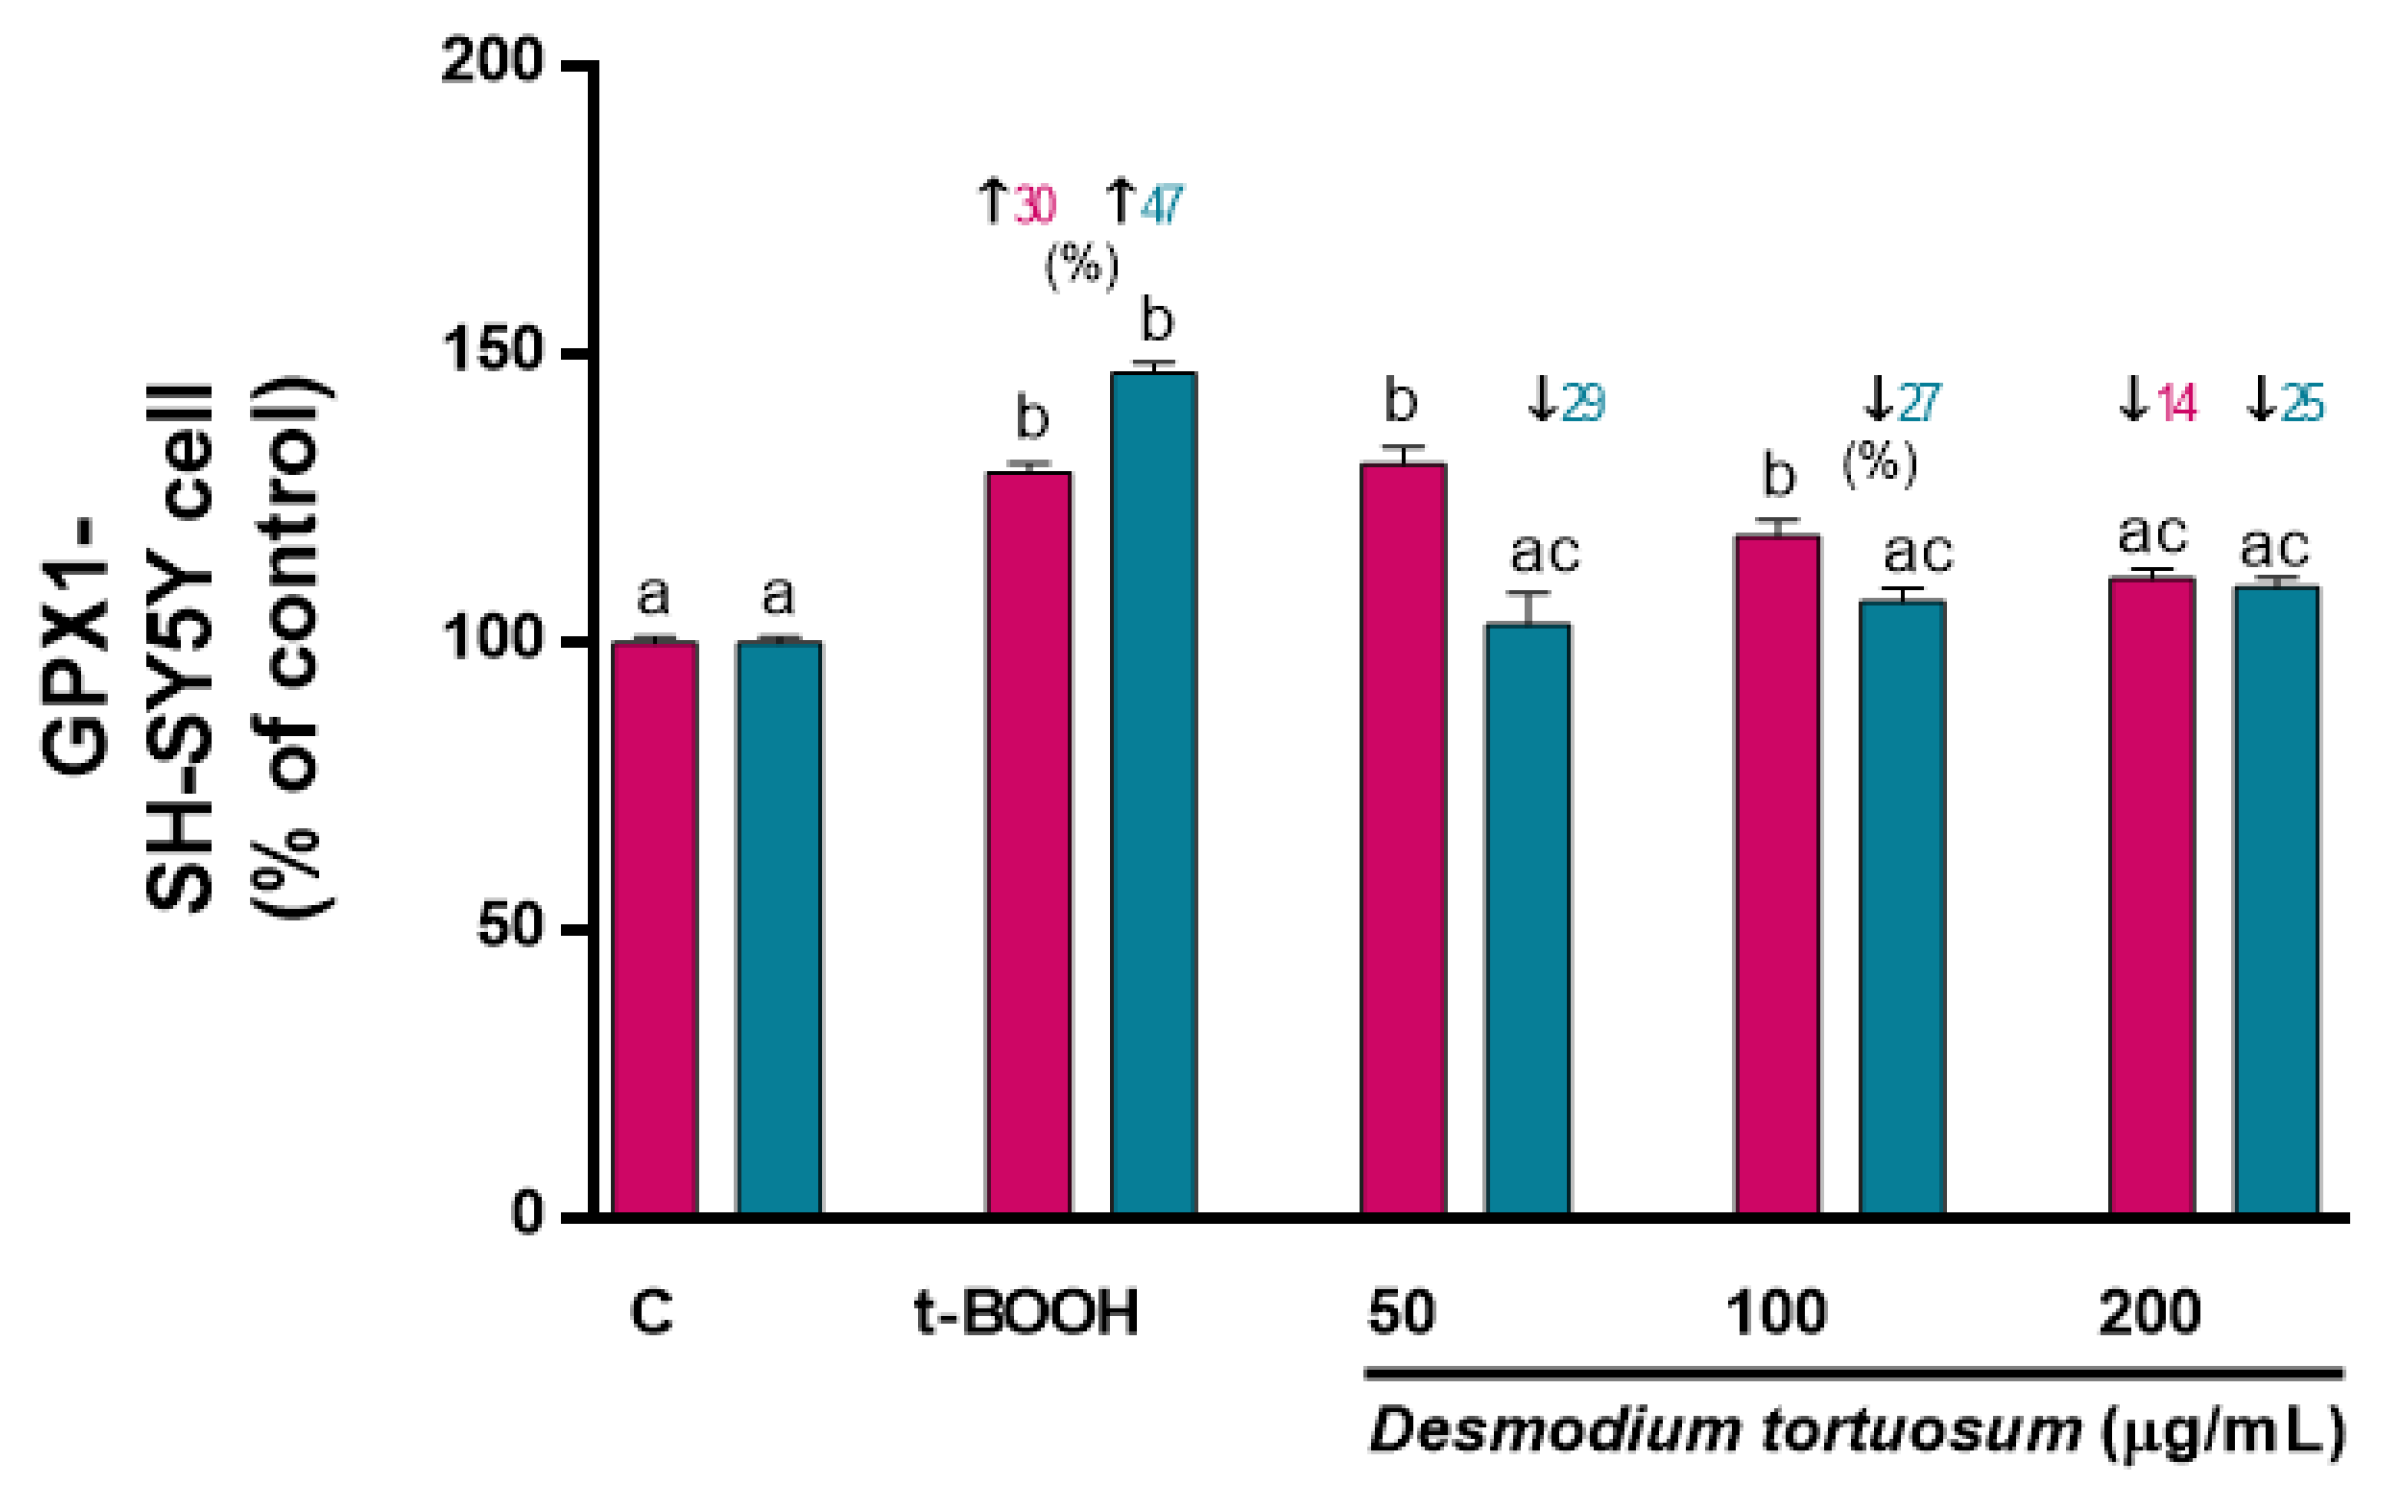
3.6.2. Antioxidant Enzymes
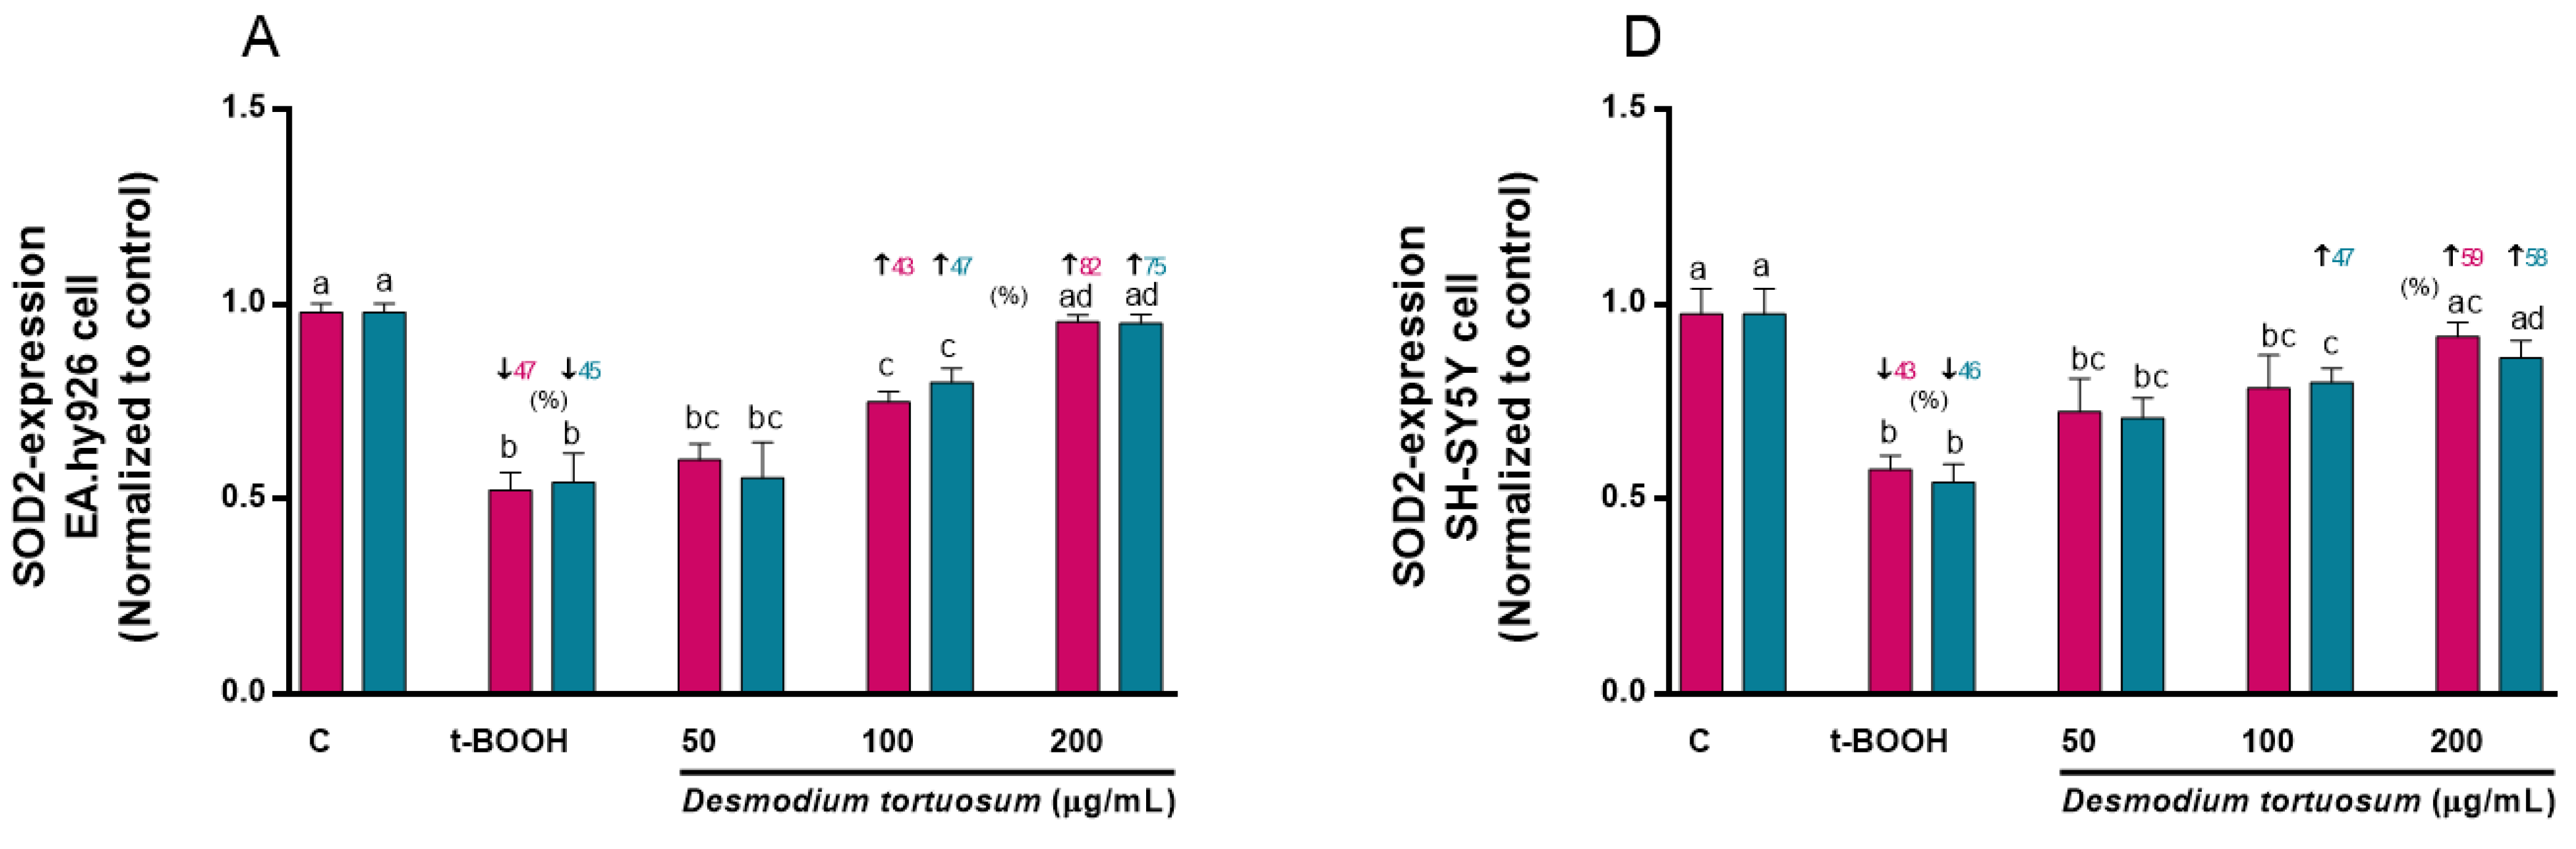
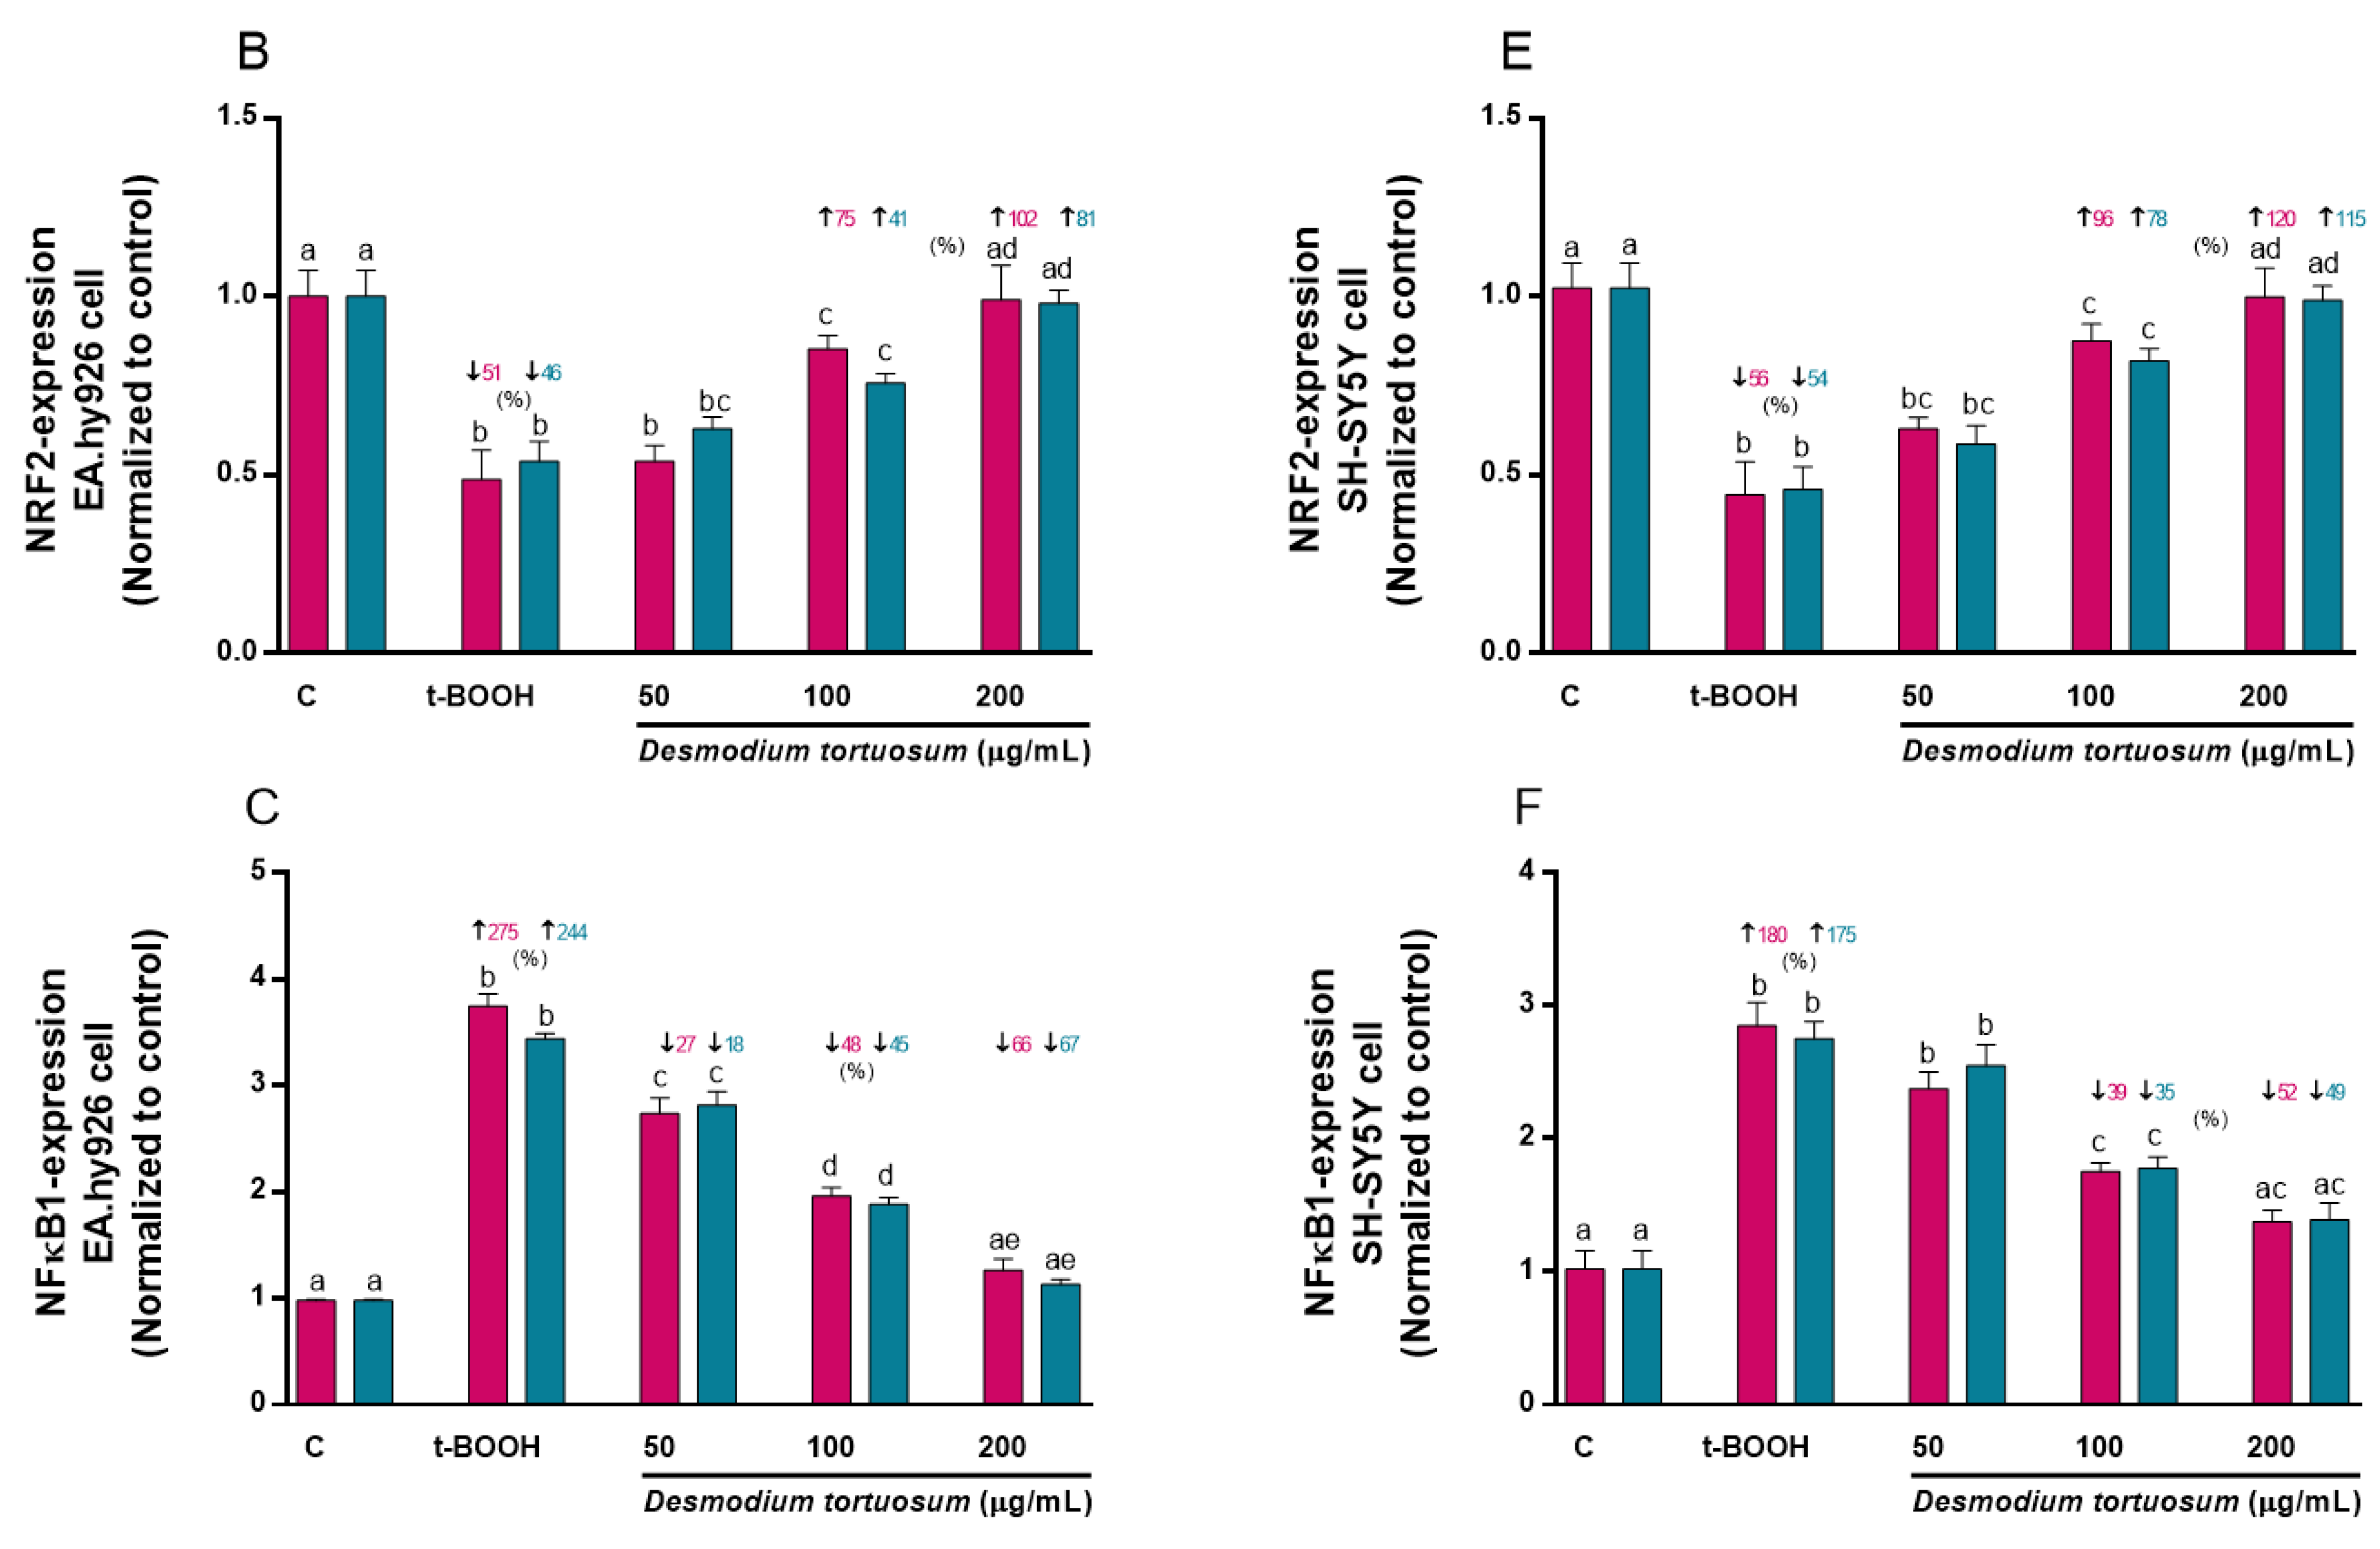
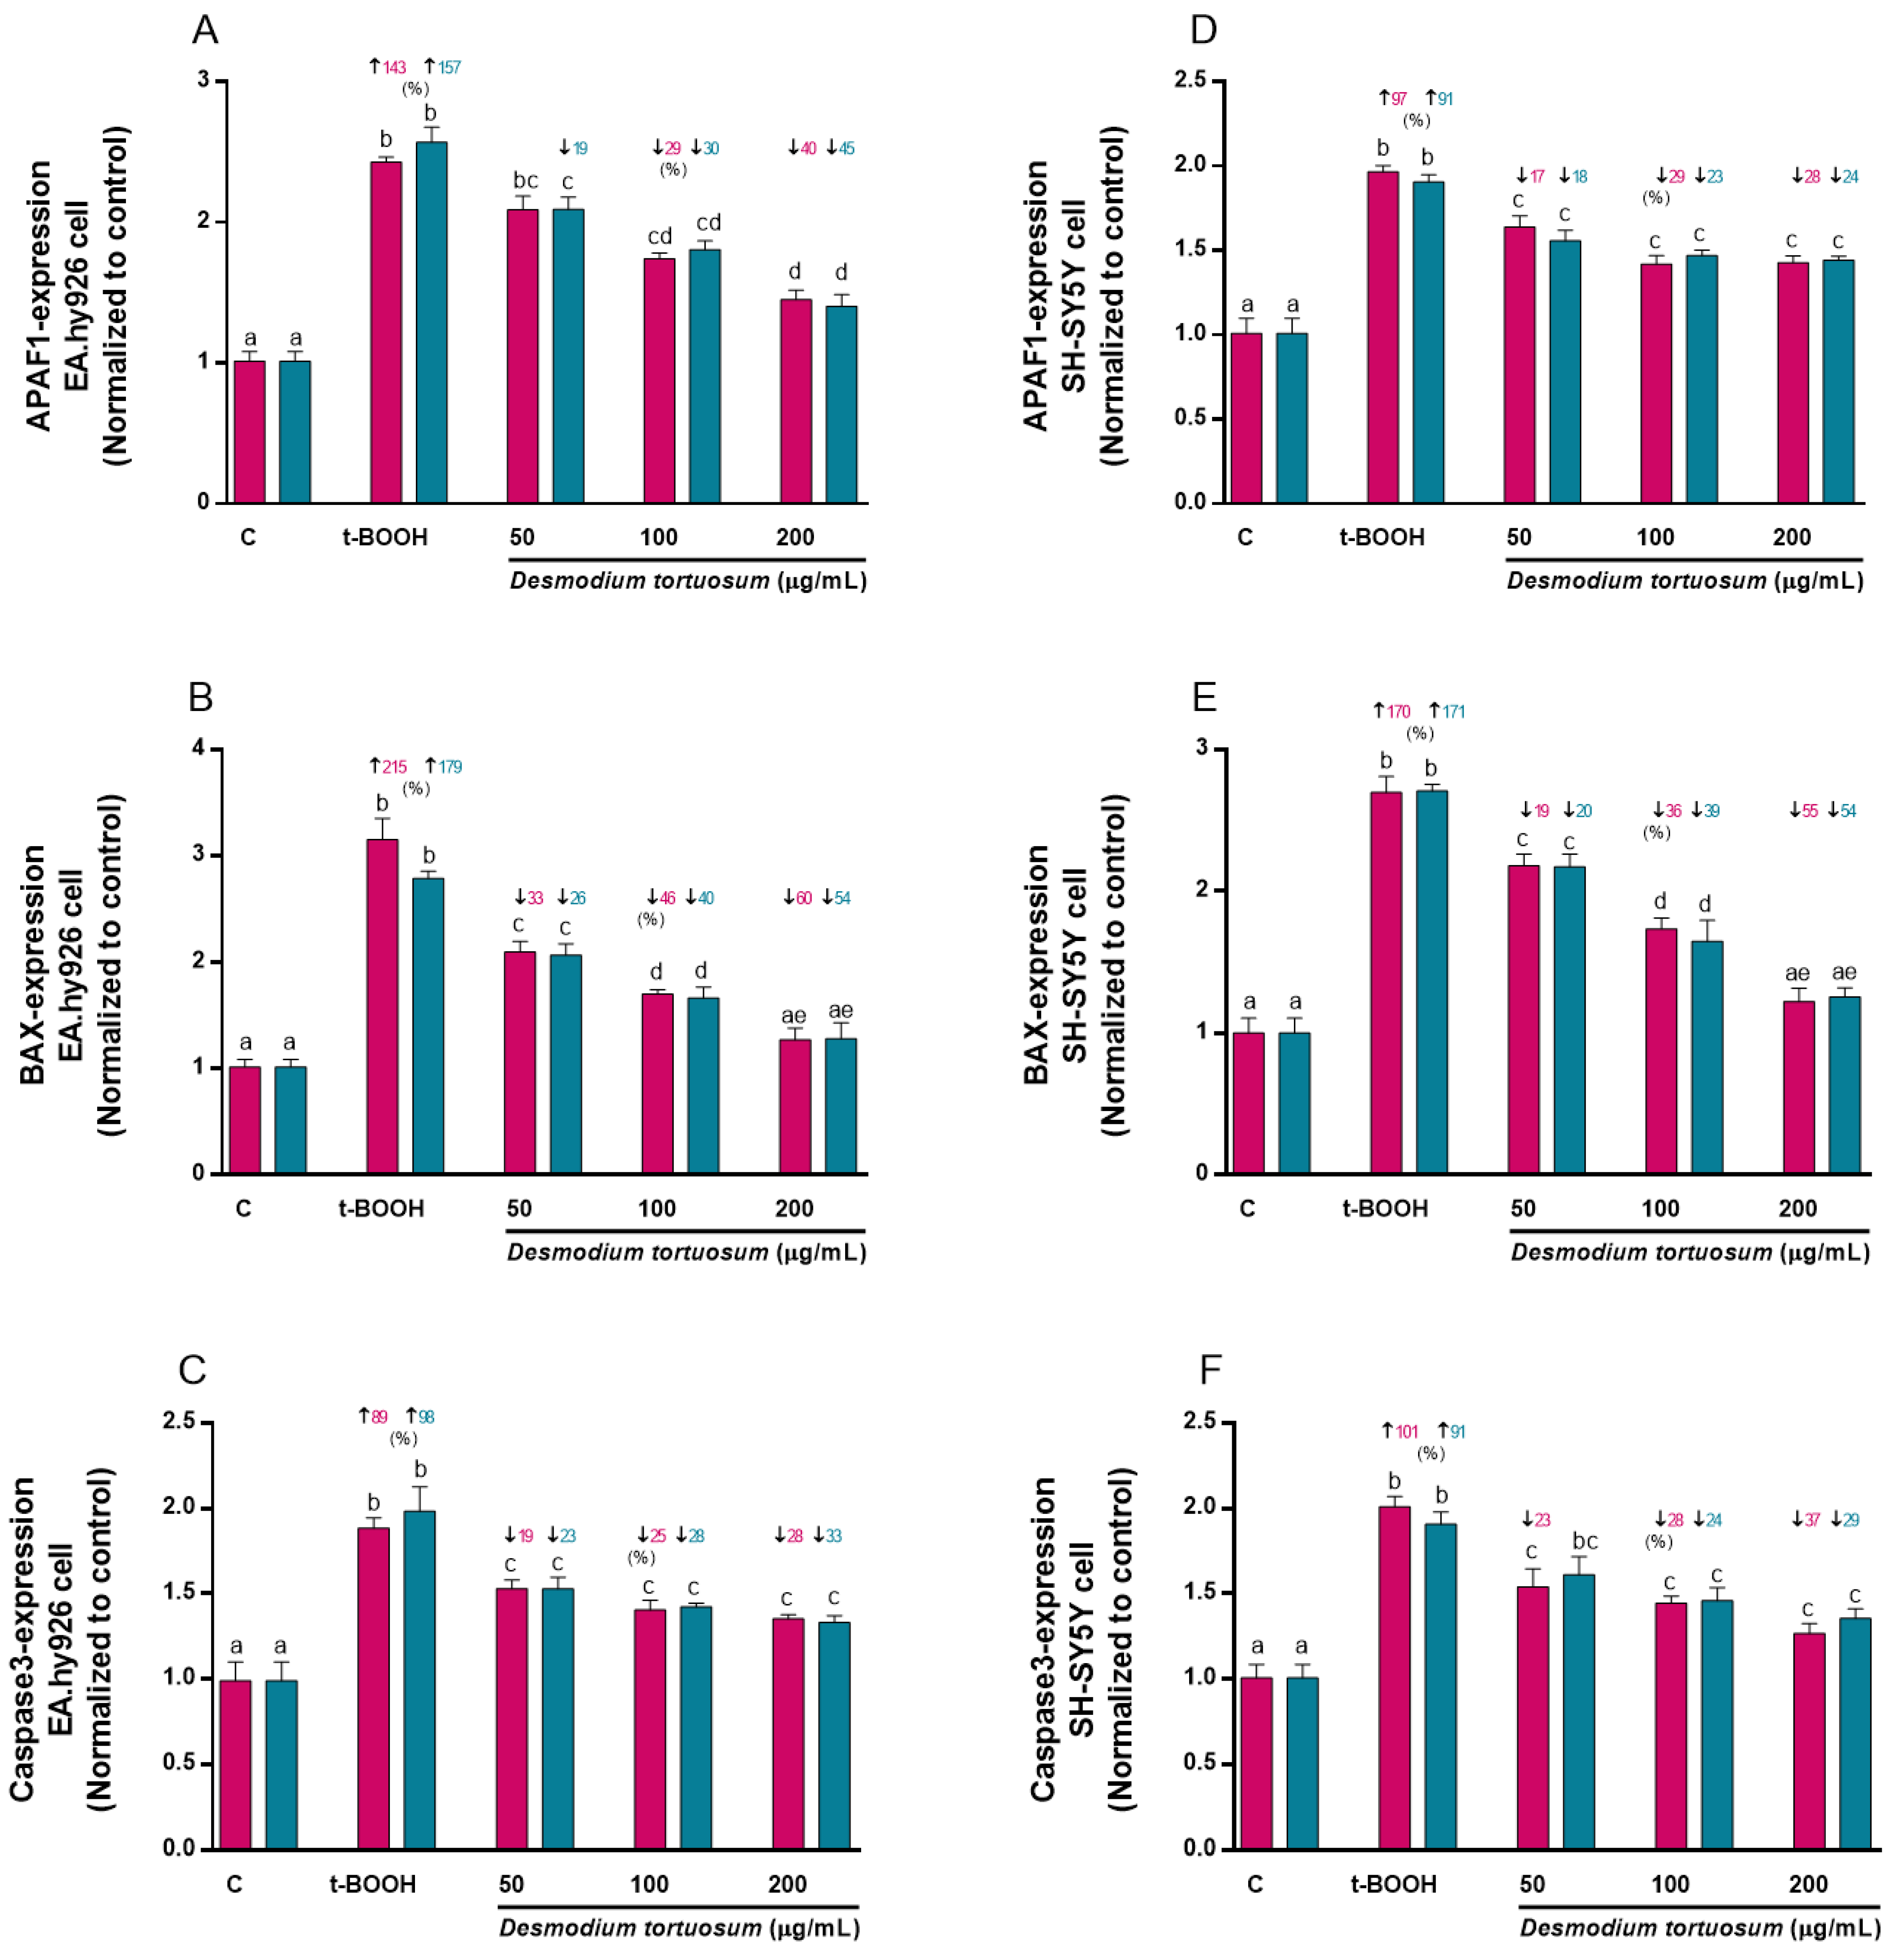
3.7. Gene Expression of Oxidative–Antioxidative and Cell Death Biomarkers
4. Discussion
5. Conclusions
Supplementary Materials
Author Contributions
Funding
Institutional Review Board Statement
Informed Consent Statement
Data Availability Statement
Acknowledgments
Conflicts of Interest
References
- Ionescu-Tucker, A.; Cotman, C.W. Emerging roles of oxidative stress in brain aging and Alzheimer’s disease. Neurobiol. Aging. 2021, 107, 86–95. [Google Scholar] [CrossRef] [PubMed]
- Favero, G.; Paganelli, C.; Buffoli, B.; Rodella, L.F.; Rezzani, R. Endothelium and its alterations in cardiovascular diseases: Life style intervention. BioMed Res. Int. 2014, 2014, 801896. [Google Scholar] [CrossRef] [PubMed]
- Polovina, M.M.; Potpara, T.S. Endothelial dysfunction in metabolic and vascular disorders. Postgrad. Med. 2014, 126, 38–53. [Google Scholar] [CrossRef] [PubMed]
- Paneni, F.; Beckman, J.A.; Creager, M.A.; Cosentino, F. Diabetes and vascular disease: Pathophysiology, clinical consequences and medical therapy: Part I. Eur. Heart J. 2013, 34, 2436–2443. [Google Scholar] [CrossRef] [PubMed]
- Ríos, J.L.; Francini, F.; Schinella, G.R. Natural products for the treatment of type 2 Diabetes mellitus. Planta Med. 2015, 81, 975–994. [Google Scholar] [CrossRef] [PubMed]
- González, J.; Valls, N.; Brito, R.; Rodrigo, R. Essential hypertension and oxidative stress: New insights. World J. Cardiol. 2014, 6, 353–366. [Google Scholar] [CrossRef] [PubMed]
- Song, P.; Zou, M.H. Redox regulation of endothelial cell fate. Cell. Mol. Life Sci. 2014, 71, 3219–3239. [Google Scholar] [CrossRef]
- Niedzielska, E.; Smaga, I.; Gawlik, M.; Moniczewski, A.; Stankowicz, P.; Pera, J.; Filip, M. Oxidative stress in neurodegenerative diseases. Mol. Neurobiol. 2016, 53, 4094–4125. [Google Scholar] [CrossRef]
- Rivas, F.; Poblete-Aro, C.; Pando, M.E.; Allel, M.J.; Fernandez, V.; Soto, A.; Nova, P.; Garcia-Diaz, D. Effects of polyphenols in aging and neurodegeneration associated with oxidative stress. Curr. Med. Chem. 2022, 29, 1045–1060. [Google Scholar] [CrossRef]
- Martín, M.A.; Goya, L.; Ramos, S. Protective effects of tea, red wine and cocoa in diabetes. Evidence from human studies. Food Chem. Toxicol. 2017, 109, 302–314. [Google Scholar] [CrossRef] [Green Version]
- Romacho, T.; Valencia, I.; Ramos-González, M.; Vallejo, S.; López-Esteban, M.; Lorenzo, O.; Cannata, P.; Romero, A.; San Hipólito-Luengo, A.; Gómez-Cerezo, J.F.; et al. Visfatin/eNampt induces endothelial dysfunction in vivo: A role for Toll-Like Receptor 4 and NLRP3 inflammasome. Sci. Rep. 2020, 10, 5386. [Google Scholar] [CrossRef] [PubMed]
- Martin, M.A.; Ramos, S. Impact of cocoa flavanols on human health. Food Chem. Toxicol. 2021, 151, 112121. [Google Scholar] [CrossRef] [PubMed]
- Kris-Etherton, P.M.; Keen, C.L. Evidence that the antioxidant flavonoids in tea and cocoa are beneficial for cardiovascular health. Curr. Opin. Lipidol. 2002, 13, 41–49. [Google Scholar] [CrossRef]
- Fisher, N.D.; Hughes, M.; Gerhard-Herman, M.; Hollenberg, N.K. Flavanol rich cocoa induces nitric oxide-dependent vasodilation in healthy humans. J. Hypertens. 2003, 1, 2281–2286. [Google Scholar] [CrossRef]
- Heiss, C.; Dejam, A.; Kleinbongard, P.; Schewe, T.; Sies, H.; Kelm, M. Vascular effects of cocoa rich in flavan-3-ols. J. Am. Med. Assoc. 2003, 290, 1030–1031. [Google Scholar] [CrossRef] [PubMed]
- Ciumarnean, L.; Milaciu, M.V.; Runcan, O.; Vesa, S.C.; Rachis, A.L.; Negrean, V.; Perné, M.-G.; Donca, V.I.; Alexescu, T.-G.; Para, I. The effects of flavonoids in cardiovascular diseases. Molecules 2020, 25, 4320. [Google Scholar] [CrossRef]
- Ebaditabar, M.; Djafarian, K.; Saeidifard, N.; Shab-Bidar, S. Effect of dark chocolate on flow-mediated dilatation: Systematic review, meta-analysis, and dose–response analysis of randomized controlled trials. Clin. Nutr. ESPEN 2020, 36, 17–27. [Google Scholar] [CrossRef]
- Bravo, L.; Mateos, R.; Sarriá, B.; Baeza, G.; Lecumberri, E.; Ramos, S.; Goya, L. Hypocholesterolaemic and antioxidant effects of yerba mate (Ilex paraguariensis) in high-cholesterol fed rats. Fitoterapia 2014, 92, 219–229. [Google Scholar] [CrossRef]
- Gutiérrez-Del-Río, I.; López-Ibáñez, S.; Magadán-Corpas, P.; Fernández-Calleja, L.; Pérez-Valero, Á.; Tuñón-Granda, M.; Miguélez, E.M.; Villar, C.J.; Lombó, F. Terpenoids and polyphenols as natural antioxidant agents in food preservation. Antioxidants 2021, 10, 1264. [Google Scholar] [CrossRef]
- Palomino, O.M.; Gouveia, N.M.; Ramos, S.; Martín, M.A.; Goya, L. Protective effect of Silybum marianum on endothelial cells submitted to high glucose concentration. Planta Med. 2017, 83, 97–103. [Google Scholar] [CrossRef]
- de Gouveia, N.M.; Ramos, S.; Martín, M.A.; Spindola, F.; Goya, L.; Palomino, O.M. Vochysia rufa stem bark extract protects endothelial cells against high glucose damage. Medicines 2017, 4, 9. [Google Scholar] [CrossRef]
- Wang, S.-L.; Sarriá, B.; Mateos, R.; Goya, L.; Bravo, L. TNF-α induced inflammation in human EA.hy926 endothelial cells is prevented by yerba mate and green coffee extracts, their main hydroxycinnamic acids, and microbial metabolites. Int. J. Food Sci. Nutr. 2019, 70, 267–284. [Google Scholar] [CrossRef]
- Martins, T.F.; Palomino, O.M.; Álvarez-Cilleros, D.; Ramos, S.; Goya, L. Cocoa flavanols protect human endothelial cells from oxidative stress. Plant. Food Hum. Nutr. 2020, 75, 161–168. [Google Scholar] [CrossRef]
- Martín, M.A.; Goya, L.; de Pascual-Teresa, S. Effect of Cocoa and Cocoa Products on Cognitive Performance in Young Adults. Nutrients 2020, 12, 3691. [Google Scholar] [CrossRef]
- Goya, L.; Román, R.S.; de Pascual-Teresa, S. Polyphenols’ effect on cerebrovascular health. Curr. Med. Chem. 2022, 29, 1029–1044. [Google Scholar] [CrossRef]
- Strother, L.; Miles, G.B.; Holiday, A.R.; Cheng, Y.; Doherty, G.H. Long-term culture of SH-SY5Y neuroblastoma cells in the absence of neurotrophins: A novel model of neuronal ageing. J. Neurosci. Methods 2021, 362, 109301. [Google Scholar] [CrossRef]
- Carballeda Sangiao, N.; Chamorro, S.; de Pascual-Teresa, S.; Goya, L. Aqueous extract of cocoa phenolic compounds protects differentiated neuroblastoma SH-SY5Y cells from oxidative stress. Biomolecules 2021, 11, 1266. [Google Scholar] [CrossRef]
- Palomino, O.; García-Aguilar, A.; González, A.; Guillén, C.; Benito, M.; Goya, L. Biological actions and molecular mechanisms of Sambucus nigra L. in neurodegeneration: A cell culture approach. Molecules 2021, 26, 4829. [Google Scholar] [CrossRef]
- Alía, M.; Ramos, S.; Mateos, R.; Bravo, L.; Goya, L. Quercetin protects human hepatoma cell line (HepG2) against oxidative stress induced by tertbutyl hydroperoxide. Toxicol. Appl. Pharmacol. 2006, 212, 110–118. [Google Scholar] [CrossRef]
- Denizot, F.; Lang, R. Rapid colorimetric assay for cell growth and survival. Modifications to the tetrazolium dye procedure giving improved sensitivity and reliability. J. Immunol. Methods 1986, 89, 271–277. [Google Scholar] [CrossRef]
- Wang, H.; Joseph, J.A. Quantifying cellular oxidative stress by dichlorofluorescein assay using microplate reader. Free Radic. Biol. Med. 1999, 27, 612–616. [Google Scholar] [CrossRef] [PubMed]
- Barrios-Arpi, L.; Arias, Y.; Lopez-Torres, B.; Ramos-Gonzalez, M.; Ticli, G.; Prosperi, E.; Rodríguez, J.L. In vitro neurotoxicity of flumethrin pyrethroid on SH-SY5Y neuroblastoma cells: Apoptosis associated with oxidative stress. Toxics 2022, 10, 131. [Google Scholar] [CrossRef]
- Ramakers, C.; Ruijter, J.M.; Deprez, R.H.L.; Moorman, A.F.M. Assumption-free analysis of quantitative real-time polymerase chain reaction (PCR) data. Neurosci. Lett. 2003, 339, 62–66. [Google Scholar] [CrossRef]
- Baba, S.; Osakabe, N.; Natsume, N.; Muto, Y.; Takizawa, T.; Terao, J. In vivo comparison of the bioavailability of catechin, epicatechin and their mixture in orally administered rats. J. Nutr. 2001, 131, 2885–2891. [Google Scholar] [CrossRef] [PubMed]
- Pappas, E.; Schaich, K.M. Phytochemicals of cranberries and cranberry products: Characterization, potential health effects and processing stability. Crit. Rev. Food Sci. Nutr. 2009, 49, 741–781. [Google Scholar] [CrossRef] [PubMed]
- Pedersen, C.B.; Kyle, J.; Jenkinson, A.M.; Gardner, P.T.; PcPhail, D.B.; Duthie, G.G. Effects of cranberry and blueberry juice consumption on the plasma antioxidant capacity of healthy female volunteers. Eur. J. Clin. Nutr. 2000, 54, 405–408. [Google Scholar] [CrossRef] [PubMed]
- Palomino, O.; Giordani, V.; Chowen, J.A.; Fernández Alonso, S.; Goya, L. Physiological doses of oleic and palmitic acids protect human endothelial cells from oxidative stress. Molecules 2022, 27, 5217. [Google Scholar] [CrossRef]
- Martín, M.A.; Ramos, S.; Mateos, R.; Serrano, A.B.G.; Izquierdo-Pulido, M.; Bravo, L.; Goya, L. Protection of Human HepG2 Cells against Oxidative Stress by Cocoa Phenolic Extract. J. Agric. Food Chem. 2008, 56, 7765–7772. [Google Scholar] [CrossRef]
- Martín, M.A.; Ramos, S.; Cordero-Herrera, I.; Bravo, L.; Goya, L. Cocoa phenolic extract protects pancreatic beta cell viability and function against oxidative stress. Nutrients 2013, 5, 2955–2968. [Google Scholar] [CrossRef]
- León-González, A.; Mateos, R.; Ramos, S.; Martín, M.A.; Sarriá, B.; Martín-Cordero, C.; López-Lázaro, M.; Bravo, L.; Goya, L. Chemo-protective activity and characterization of phenolic extracts from Corema album. Food Res. Int. 2012, 49, 728–738. [Google Scholar] [CrossRef] [Green Version]
- Baeza, G.; Amigo-Benavent, M.; Sarriá, B.; Goya, L.; Mateos, R.; Bravo, L. Green coffee hydroxycinnamic acids but not caffeine protect human HepG2 cells against oxidative stress. Food Res. Int. 2014, 62, 1038–1046. [Google Scholar] [CrossRef]
- Martín, M.A.; Ramos, S.; Mateos, R.; Marais, J.; Bravo, L.; Khoo, C.; Goya, L. Chemical characterization and chemo-protective activity of cranberry phenolic extracts in a model cell culture. Response of the antioxidant defences and regulation of signaling pathways. Food Res. Int. 2015, 71, 68–82. [Google Scholar] [CrossRef]
- Castillo, G.; Barrios-Arpi, L.; Ramos-Gonzalez, M.; Vidal, P.; Gonzales-Irribarren, A.; Ramos-Cevallos, N.; Rodríguez, J.L. Neurotoxicity associated with oxidative stress and inflammasome gene expression induced by allethrin in SH-SY5Y cells. Toxicol. Ind. Health 2022, 38, 777–788. [Google Scholar] [CrossRef]
- Lee, M.H.; Lee, J.M.; Jun, S.H.; Lee, S.H.; Kim, N.W.; Lee, J.H.; Ho, N.Y.; Mun, S.H.; Kim, B.K.; Lim, B.O.; et al. The anti-inflammatory effects of Pyrolae herba extract through the inhibition of the expression of inducible nitric oxide synthase (iNOS) and NO production. J. Ethnopharmacol. 2007, 112, 49–54. [Google Scholar] [CrossRef]
- Adebayo, S.A.; Ondua, M.; Shai, L.J.; Lebelo, S.L. Inhibition of nitric oxide production and free radical scavenging activities of four South African medicinal plants. J. Inflamm. Res. 2019, 12, 195–203. [Google Scholar] [CrossRef]
- Marino, G.; López-Otín, C. Autophagy: Molecular mechanisms, physiological functions and relevance in human pathology. Cell Mol. Life Sci. CMLS 2004, 61, 1439–1454. [Google Scholar] [CrossRef]
- Pelicano, H.; Carney, D.; Huang, P. ROS stress in cancer cells and therapeutic implications. Drug Resist. Updat. 2004, 7, 97–110. [Google Scholar] [CrossRef]
- Chen, Y.; McMillan-Ward, E.; Kong, J.; Israels, S.J.; Gibson, S.B. Oxidative stress induces autophagic cell death independent of apoptosis in transformed and cancer cells. Cell Death Differ. 2008, 15, 171–182. [Google Scholar] [CrossRef]
- Li, J.K.; Ge, R.; Tang, L.; Li, Q.S. Protective effects of farrerol against hydrogen-peroxide-induced apoptosis in human endothelium-derived EA.hy926 cells. Can J. Physiol. Pharmacol. 2013, 91, 733–740. [Google Scholar] [CrossRef]
- Guo, S.; Long, M.; Li, X.; Zhu, S.; Zhang, M.; Yang, Z. Curcumin activates autophagy and attenuates oxidative damage in EA.hy926 cells via the Akt/mTOR pathway. Mol. Med. Rep. 2016, 13, 2187–2193. [Google Scholar] [CrossRef] [Green Version]
- Morán-Santibañez, K.; Vasquez, A.H.; Varela-Ramirez, A.; Henderson, V.; Sweeney, J.; Odero-Marah, V.; Fenelon, K.; Skouta, R. Larrea tridentata extract mitigates oxidative stress-induced cytotoxicity in human neuroblastoma SH-SY5Y cells. Antioxidants 2019, 8, 427. [Google Scholar] [CrossRef] [PubMed]
- Jantas, D.; Malarz, J.; Le, T.N.; Stojakowska, A. Neuroprotective properties of kempferol derivatives from maesa membranacea against oxidative stress-induced cell damage: An association with cathepsin D inhibition and PI3K/Akt Activation. Int. J. Mol. Sci. 2021, 22, 10363. [Google Scholar] [CrossRef]
- Myhrstad, M.C.; Carlsen, H.; Nordström, O.; Blomhoff, R.; Moskaug, J.O. Flavonoids increase the intracellular glutathione level by transactivation of the gamma-glutamylcysteine synthetase catalytical subunit promoter. Free Rad. Biol. Med. 2002, 32, 386–393. [Google Scholar] [CrossRef] [PubMed]
- Moridani, M.Y.; Scobie, H.; Salehi, P.; O’Brien, P.J. Catechin metabolism: Glutathione conjugate formation catalyzed by tyrosinase, peroxidase, and cytochrome p450. Chem. Res. Toxicol. 2001, 14, 841–848. [Google Scholar] [CrossRef] [PubMed]
- Galati, G.; Lin, A.; Sultan, A.M.; O’Brien, P.J. Cellular and in vivo hepatotoxicity caused by green tea phenolic acids and catechins. Free Radic. Biol. Med. 2006, 40, 570–580. [Google Scholar] [CrossRef]
- Battistelli, M.; Malatesta, M.; Meschini, S. Oxidative stress to promote cell death or survival. Oxid. Med. Cell. Longev. 2016, 2016, 2054650. [Google Scholar] [CrossRef] [PubMed]
- Lee, H.J.; Spandidos, D.A.; Tsatsakis, A.; Margina, D.; Izotov, B.N.; Yang, S.H. Neuroprotective effects of Scrophularia buergeriana extract against glutamate-induced toxicity in SH-SY5Y cells. Int. J. Mol. Med. 2019, 43, 2144–2152. [Google Scholar] [CrossRef]
- Huang, W.M.; Liang, Y.Q.; Tang, L.J.; Ding, Y.U.E.; Wang, X.H. Antioxidant and anti-inflammatory effects of Astragalus polysaccharide on EA.hy926 cells. Exp. Ther. Med. 2013, 6, 199–203. [Google Scholar] [CrossRef]
- Ma, D.; Wang, Z.; He, Z.; Wang, Z.; Chen, Q.; Qin, F.; Zeng, M.; Chen, J. Pine pollen extract alleviates ethanol-induced oxidative stress and apoptosis in HepG2 cells via MAPK signaling. Food Chem. Toxicol. 2023, 171, 113550. [Google Scholar] [CrossRef]
- Chu, W.L.; Lim, Y.W.; Radhakrishnan, A.K.; Lim, P.E. Protective effect of aqueous extract from Spirulina platensisagainst cell death induced by free radicals. BMC Complement. Altern. Med. 2010, 10, 53. [Google Scholar] [CrossRef] [Green Version]


| Identified Compound | Retention Time (min) | Molecular Formula | MS-ESI− | MS2 | MS-ESI+ | MS2 | Nominal Mass |
|---|---|---|---|---|---|---|---|
| HYDROXYCINNAMIC ACIDS AND HYDROXYCINNATES | |||||||
| 4-Coumaric acid | 8.79 | C9H8O3 | 163 | 119, 93 | 164 | ||
| CAROTENOIDS | |||||||
| Loliolide | 9.60 | C11H16O3 | 197 | 179, 161,135, 133 | 196 | ||
| FLAVONES | |||||||
| 6-C-xylosyl-8-C-galactosylapigenin | 8.16 | C26H28O14 | 563 | 473,443,383 | 565 | 547,529,511 | 564 |
| Vitexin-2″-O-rhamnoside | 8.66 | C27H32O15 | 577 | 457,413,341,323 | 579 | 433, 415, 367, 337 | 578 |
| Vitexin | 9.55 | C21H20O10 | 431 | 341, 311, 283, 268 | 432 | ||
| Isovitexin | 8.85 | C21H20O10 | 431 | 341,323, 311, 295 | 433 | 415, 397, 379, 367 | 432 |
| Saponarin | 8.10 | C27H30O15 | 593 | 473, 431, 311, 297 | 595 | 433,415, 367, 337 | 594 |
| luteolin-7-glucoside | 9.03 | C21H20O11 | 447 | 357,285,256 | 448 | ||
| Luteolin-6-C-glucoside | 8.33 | C21H20O11 | 447 | 429, 357, 327 | 449 | 431, 383, 353, 329 | 448 |
| 6-C-arabinosyl-8-C-β-D-xylosylapigenin | 8.66 | C25H26O13 | 533 | 443, 413, 383, 353 | 535 | 517, 499, 481, 469 | 534 |
| FLAVANONES | |||||||
| Naringenin | 11.62 | C15H12O5 | 271 | 177, 151, 119 | 272 | ||
| Prunin | 9.53 | C21H22O10 | 433 | 271, 177, 151 | 434 | ||
| 8-Prenylnaringenin | 13.79 | C20H20O5 | 339 | 245, 233, 219 | 341 | 285,183,165 | 340 |
| 2’,4’,5,7-Tetrahydroxy-8-prenylflavanone | 13.32 | C20H20O6 | 355 | 193,161,149 | 357 | 301, 283 | 356 |
| FLAVONOLS | |||||||
| Hyperoside | 8.95 | C21H20O12 | 463 | 300, 271, 255 | 465 | 303, 229 | 464 |
| Isorhamnetin-3-O-glucoside | 9.46 | C21H20O11 | 447 | 314, 285, 271, 243 | 448 | ||
| PHENOLIC ACIDS | |||||||
| 3,4-Dihydroxybenzoic acid | 3.69 | C7H6O4 | 153 | 109,108 | 154 | ||
| 2,5-Dihydroxybenzoic acid | 5.88 | C7H6O4 | 153 | 123, 108, 95 | 154 | ||
| 6,8-di-C-glucosylapigenin | 7.70 | C27H30O15 | 593 | 503, 473, 383 | 595 | 577, 559, 511 | 594 |
| 4-hydroxybenzaldehyde | 7.92 | C7H6O2 | 121 | 108, 95, 93 | 122 | ||
| 12-hydroxyjasmonic acid glucoside | 7.93 | C18H28O9 | 387 | 207, 163, 119 | 388 | ||
| Uralenneoside | 4.00 | C12H14O8 | 285 | 152, 108 | 286 | ||
| [2-hydroxy-3-[3,4,5-trihydroxy-6-[[3,4,5-trihydroxy-6-(hydroxymethyl)oxan-2-yl]oxymethyl]oxan-2-yl]oxypropyl] hexadecanoate | 14.87 | C31H58O14 | 699 | 653, 415 | 654 | ||
| p-hydroxybenzoic acid | 10.00 | C7H6O3 | 137 | 93 | 138 | ||
| GLYCOSYLGLYCEROLS | |||||||
| [2-hydroxy-3-[3,4,5-trihydroxy-6-[[3,4,5-trihydroxy-6-(hydroxymethyl)oxan-2-yl]oxymethyl]oxan-2-yl]oxypropyl] (9E,12E,15E)-octadeca-9,12,15-trienoate | 13.90 | C33H56O14 | 721 | 675, 415 | 722 | ||
| GLYCEROPHOSPHOCHOLINES | |||||||
| 1-Palmitoyl-sn-glycero-3-phosphocholine | 16.10 | C24H50NO7 | 540 | 480, 255,152, 78 | 496 | 184, 125, 86 | 495 |
| LINOLEIC ACIDS AND DERIVATIVES | |||||||
| 9,12,13-Trihydroxy-10,15-octadecadienoic acid | 11.44 | C18H32O5 | 327 | 291, 229 | 328 | ||
| 9,12,13-Trihydroxy-10-octadecenoic acid | 11.85 | C18H34O5 | 329 | 229, 211 | 330 | ||
| 9,10,13-Trihydroxy-10-octadecenoic acid | 12.47 | C18H34O5 | 329 | 293, 211 | 330 | ||
| 9,10-DHOME or Leukotoxin Diol | 14.38 | C18H34O4 | 313 | 277, 201 | 314 |
Disclaimer/Publisher’s Note: The statements, opinions and data contained in all publications are solely those of the individual author(s) and contributor(s) and not of MDPI and/or the editor(s). MDPI and/or the editor(s) disclaim responsibility for any injury to people or property resulting from any ideas, methods, instructions or products referred to in the content. |
© 2023 by the authors. Licensee MDPI, Basel, Switzerland. This article is an open access article distributed under the terms and conditions of the Creative Commons Attribution (CC BY) license (https://creativecommons.org/licenses/by/4.0/).
Share and Cite
Rodríguez, J.-L.; Berrios, P.; Clavo, Z.-M.; Marin-Bravo, M.; Inostroza-Ruiz, L.; Ramos-Gonzalez, M.; Quispe-Solano, M.; Fernández-Alfonso, M.S.; Palomino, O.; Goya, L. Chemical Characterization, Antioxidant Capacity and Anti-Oxidative Stress Potential of South American Fabaceae Desmodium tortuosum. Nutrients 2023, 15, 746. https://doi.org/10.3390/nu15030746
Rodríguez J-L, Berrios P, Clavo Z-M, Marin-Bravo M, Inostroza-Ruiz L, Ramos-Gonzalez M, Quispe-Solano M, Fernández-Alfonso MS, Palomino O, Goya L. Chemical Characterization, Antioxidant Capacity and Anti-Oxidative Stress Potential of South American Fabaceae Desmodium tortuosum. Nutrients. 2023; 15(3):746. https://doi.org/10.3390/nu15030746
Chicago/Turabian StyleRodríguez, José-Luis, Paola Berrios, Zoyla-Mirella Clavo, Manuel Marin-Bravo, Luis Inostroza-Ruiz, Mariella Ramos-Gonzalez, Miguel Quispe-Solano, Maria S. Fernández-Alfonso, Olga Palomino, and Luis Goya. 2023. "Chemical Characterization, Antioxidant Capacity and Anti-Oxidative Stress Potential of South American Fabaceae Desmodium tortuosum" Nutrients 15, no. 3: 746. https://doi.org/10.3390/nu15030746