Article

Optimization of Synthesis of Silver Nanoparticles Conjugated with Lepechinia meyenii (Salvia) Using Plackett-Burman Design and Response Surface Methodology—Preliminary Antibacterial Activity

by
Luis Alberto Laime-Oviedo
1,
Amanda Allison Soncco-Ccahui
1,
Gladis Peralta-Alarcon
1,
Carlos Alberto Arenas-Chávez
2,
Jose Luis Pineda-Tapia
3,
José Carlos Díaz-Rosado
4,
Aldo Alvarez-Risco
5,
Shyla Del-Aguila-Arcentales
6,
Neal M. Davies
7,
Jaime A. Yáñez
8,9,* and
Corina Vera-Gonzales
1,10
1
Laboratorio de Preparación, Caracterización e Identificación de Nanomateriales (LAPCI NANO), Universidad Nacional de San Agustín de Arequipa, Arequipa 04000, Peru
2
Facultad de Ciencias Biológicas, Departamento Académico de Biología, Universidad Nacional de San Agustín de Arequipa, Arequipa 04000, Peru
3
Facultad de Ciencias de Ingeniería, Universidad Nacional de Juliaca, Juliaca 21101, Peru
4
Escuela de Ingeniería Física, Facultad de Ciencias, Universidad Nacional de Ingeniería, Lima 15333, Peru
5
Carrera de Negocios Internacionales, Facultad de Ciencias Empresariales y Económicas, Universidad de Lima, Lima 15023, Peru
6
Escuela de Posgrado, Universidad San Ignacio de Loyola, Lima 15024, Peru
7
Faculty of Pharmacy & Pharmaceutical Sciences, University of Alberta, Edmonton, AB T6G 2H1, Canada
8
Vicerrectorado de Investigación, Universidad Norbert Wiener, Lima 15046, Peru
9
Gerencia Corporativa de Asuntos Científicos y Regulatorios, Teoma Global, Lima 15073, Peru
10
Facultad de Ciencias Naturales y Formales, Departamento Académico de Química, Universidad Nacional de San Agustín de Arequipa, Arequipa 04000, Peru
*
Author to whom correspondence should be addressed.
Processes 2022, 10(9), 1727; https://doi.org/10.3390/pr10091727
Submission received: 23 July 2022 / Revised: 24 August 2022 / Accepted: 26 August 2022 / Published: 31 August 2022
(This article belongs to the Section Pharmaceutical Processes)

Abstract

:
In the present investigation, an ethanolic fraction (EF) of Lepechinia meyenii (salvia) was prepared and fractionated by gradient column chromatography, and the main secondary metabolites present in the EF were identified by HPLC-MS. Silver nanoparticles (AgNPs) were synthesized and conjugated with the EF of Lepechinia meyenii (salvia). The AgNPs synthesis was optimized using Plackett-Burman design and response surface methodology (RSM), considering the following independent variables: stirring speed, synthesis pH, synthesis time, synthesis temperature and EF volume. The AgNPs synthesized under the optimized conditions were characterized by UV visible spectroscopy (UV-VIS), Fourier Transform Infrared Spectroscopy (FT-IR), Dynamic Light Scattering (DLS) and Scanning Transmission Electron Microscopy (STEM). The antibacterial activity of the AgNPs against Staphylococcus aureus (ATCC® 25923) was evaluated. The following flavonoids were identified: rosmarinic acid, diosmin and hesperetin-7-O-rutinoside. The optimized conditions for the synthesis of nanoparticles were pH 9.45, temperature 49.8 °C, volume of ethanolic fraction 152.6 µL and a reaction time of 213.2 min. The obtained AgNPs exhibited an average size of 43.71 nm and a resonance plasmon of 410–420 nm. Using FT-IR spectroscopy, the disappearance of the peaks between 626.50 and 1379.54 cm−1 was evident with the AgNPs, which would indicate the participation of these functional groups in the synthesis and protection of the nanoparticles. A hydrodynamic size of 47.6 nm was obtained by DLS, while a size of 40–60 nm was determined by STEM. The synthesized AgNPs conjugated with the EF showed a higher antibacterial activity than the EF alone. These results demonstrate that the AgNPs synthesized under optimized conditions conjugated with the EF of the Lepechinia meyenii (salvia) presented an increased antibacterial activity.

1. Introduction

Because plant extracts contain phytochemicals such as terpenoids, flavonoids, tannins, phenol derivatives, plant enzymes, proteins and reducing sugars [1,2,3,4,5,6,7,8,9,10,11,12,13,14,15,16,17,18], they can act in the reduction of metal ions coming from precursor salts [6,19,20,21,22,23,24,25,26,27]. Therefore, they can act as protective agents required for the synthesis and stabilization of nanoparticles (NPs) [19,28]. The utilization of plants not only influences the morphology and stability of nanoparticles but also enhances their biological properties [21,29]. The green synthesis of nanoparticles using plant extracts has gained considerable attention for biomedical applications [19,30]. The potential use of plant-based nanoparticles for cancer treatment has been reviewed [31], and the application of silver and gold nanoparticles is an active area of research [31,32,33,34,35]. There is an increased interest in the use nanoparticles to improve chemotherapeutic limitations such as undesirable side effects [7,36,37,38], multidrug resistance [39,40], cytotoxicity [37,41,42,43,44], and pharmacokinetic and pharmacodynamic challenges such as low oral bioavailability [42,45,46].
Plants can be an inexpensive and non-toxic source for the biosynthesis of AgNPs and have the potential for scale-up in the production of nanoparticles with different morphological and size characteristics. Therefore, methods have been developed by green chemistry for the biosynthesis of AgNPs, using the aqueous extract of various plant species [47]. For instance, silver nanoparticles synthesized with biological reducing agents have been achieved, with an average size of 19.65 ± 13.49 (nm) and with defined spherical shapes [47]. Our research group previously synthesized silver nanoparticles and carboxymethyl chitosan (AgNPs-CMC), which were characterized in functionalized cotton fabric [20,48]. Furthermore, we also synthesized silver nanoparticles that were reduced and stabilized with an aqueous extract of Thelypteris glandulosolanosa (Raqui-raqui), forming silver nanoparticles (AgNPs-RR) [19]. A hydrodynamic size of 39.16 nm was reported, and an average diameter of 31.45 nm was characterized with STEM [19]. Furthermore, their anti-cancer activity against various cancer cell lines has been investigated as a potential strategy for breast and lung cancer treatment [19]. Further progress has been made in bionic metalized nanocoatings with bactericidal and antiviral activities, which facilitate specific cytotoxicity and improve the stabilization of nanoparticles [49].
Optimization is one of the essential steps in the development of a synthesis protocol, and the evaluation of the interaction of reaction parameters influencing the biosynthesis of AgNPs and their optimization is necessary for the efficient reduction of metal ion as silver (Ag+) to silver nanoparticles (Ag0) using different bioreducers [50]. There is little information in the literature regarding process optimization by green synthesis methods for AgNPs using active principles or plant secondary metabolites. The combined effects of all the factors influencing a process can be explained with the response surface methodology (RSM), which can predict the optimal levels of each parameter and their corresponding response values to eliminate the limitations of a single-factor optimization process [51]. The Plackett-Burman design provides an effective and rapid way to identify the relevant variables to be used for optimization [52,53]. Furthermore, the RSM uses an experimental design called central composite design (CCD) to obtain a polynomial equation representative of the experimental data and describes the behavior of the parameters by applying an analysis of variance for model adequacy [50]. The use of Plackett-Burman design and RSM has been reported for phenol degradation by Candida tropicalis [52] and Pseudomonas aeruginosa [52,54], production of α-amylase by Aspergillus oryzae [55], and production of citric acid from pineapple waste [56]. Therefore, this study aimed to investigate the synthesis of AgNPs, using the ethanolic fraction (EF) from Lepechinia meyenii (salvia), to evaluate the antibacterial activity of these nanoparticles against Staphylococcus aureus (ATCC® 25923) and to optimize the AgNPs biosynthesis parameters using Plackett-Burman design and RSM.

2. Materials and Methods

2.1. Reagents and Materials

The following reagents obtained from Sigma-Aldrich (St. Louis, MO, USA) were used: petroleum ether, ethyl acetate, ethanol, silver nitrate, potassium dihydrogen phosphate (pa ≥ 99%), sodium hydroxide (pa ≥ 99%). In addition, Staphylococcus aureus (ATCC 25923) (Merck Millipore, Burlington, MA, USA), Trypticase soy agar (TSA) and Trypticase soy broth (TSB) (Liofilchem, Abruzzi, Italy) were used in the experiment.

2.2. Equipment

The following equipment was used: UHPLC chromatograph (Dionex Ultimate 3000 UHPLC, Thermo Scientific, Waltham, MA, USA), mass spectrometer (Q Exactive Plus, Thermo Scientific), UV-Visible spectrophotometer (Evolution 220, Thermo Scientific), Dynamic Light Scattering (DLS, Zetasizer Nano ZS, Malvern Panalytical, Worcestershire, UK), scanning transmission electron microscope (JEOL 2200FS STEM, with hexapolar corrector CEOS).

2.3. Preparation of Plant Extract of Lepechinia meyenii (Salvia) and Ethanolic Fraction

Green leaves of Lepechinia meyenii were harvested from the district of Pocsi located in the province and department of Arequipa, Peru, located at 3040 m elevation. Leaves were washed three times using distilled water and then further washed with Milli-Q water. All the water was removed, and the leaves were sprayed, dried, pulverized and sieved in 100 mesh. This sample was defatted using petroleum ether. For the preparation of the 80:20 ethanol:water extract, 100 g of the defatted sample was weighed on an analytical balance (Mettler Toledo). Then, 500 mL of 80:20 ethanol/water solution was added, and it was sonicated in the ultrasound bath under the following conditions: 40 °C, 1 h, 40 KHz and low power; then, it was centrifuged at 5000 rpm for 5 min. To obtain the ethanolic fraction (EF), a gradient column chromatography was performed using Silica Gel 60 (0.063–0.200 mm) as stationary phase, and a column head was prepared for the sample, which consisted of 5 g of silica gel embedded with 15 mL of the ethanolic extract. The following solvents were used as mobile phase in order of increasing polarity: petroleum ether, ethyl acetate and ethanol. The obtained fractions were monitored by thin layer chromatography. The corresponding eluates were obtained according to the polarity of the solvents, choosing the ethanolic fraction for the synthesis of nanoparticles and the identification of their secondary metabolites by HPLC-MS.

2.4. Identification of Flavonoids by HPLC-MS

A UHPLC chromatograph was obtained by injecting 3 µL of the ethanolic fraction (EF) using a Luna Omega C18 column (100 Å150 × 2.1 mm, 1.6 µm, Phenomenex, Torrance, CA, USA) with a temperature of 40 °C and flow rate 0.25 mL/min, with eluents A: H2O 1% HCOOH and B: IN 1% HCOOH. Full mass spectrometry (MS) scan parameters were used in the range of –20 to 1500 m/z, with a resolution of 70 000 microscans, an automatic gain control (AGC target) of 1 × 10⁶ and a maximum IT of 100 ms.

2.5. Silver Nanoparticle (AgNPs) Biosynthesis

Silver nitrate solutions (0.1 M, AgNO3) were also freshly prepared in Milli-Q water under dark conditions, as previously described [57]. The green synthesis of AgNPs was performed as previously described [19], with some adjustments. For instance, 20 mL of AgNO3 (1 mM) was used as precursor, to which different volumes of the EF were used for the reduction of Ag into Ag0 state by mixing it with a final concentration of 0.5 mM AgNO3. These mixtures of plant extract and AgNO3 were temperature-controlled at 50 °C with continuous stirring. The solution was alkalinized by adding drops of 0.1 N NaOH until a basic pH between 9 and 10 was obtained. The reduction of Ag ions in solution was monitored by a visible color change and periodic mixture sampling by measuring in the UV-Visible Evolution 220 (λ 300 to 700 nm). The AgNPs were centrifuged at 12,500 rpm for 15 min, washed three times with Milli-Q water and finally washed with ethanol. The resulting AgNPs were dried at 40 °C for 48 h. The synthesis conditions were developed according to the experimental design matrix proposed by RSM.

2.6. Characterization of Biosynthesized AgNPs

2.6.1. UV-Visible Spectra Analysis

The biosynthesized AgNPs silver nanoparticles were evaluated and monitored by a UV-VIS spectrophotometer. Each assay was defined according to the experimental design employed at each stage of the RSM. The spectral scanning was performed at 350–650 nm for the determination of the peak corresponding to the resonance plasmon of the nanoparticles at 411 nm. Spectrophotometric readings were performed using a quartz cuvette with a step width of 1 cm. The absorbance determination was performed at 411 nm wavelength.

2.6.2. Dynamic Light Scattering (DLS)

The distribution of the size of AgNPs was analyzed by DLS (Zetasizer Nano ZS) as previously described [19]. For the reading, 1.5 mL of sample was added to a polypropylene cuvette, and the following reading parameters were considered: dispersing medium, refractive index (RI) and dynamic viscosity (Cp).

2.6.3. Scanning Transmission Electron Microscopy (STEM)

The STEM sample was prepared by a drop of reaction sample on the copper-coated grid, and excess solution was removed by drying under a mercury lamp for 5 min as previously described [58], with some minor modifications. The sample was dried for 48 h in a chamber with a relative humidity (RH) of 30% and a temperature of 25 °C. To ensure that the nanoparticles were not in a conglomerated or structurally aggregated state at the bond level, a sonication treatment was performed for 30 min.

2.6.4. FT-IR Spectrometry

The amount of silver in the nanoparticles was quantified using Fourier-transform infrared spectroscopy (FTIR) (Nicolet IS50, Thermo Scientific) equipped with the diamond crystal as previously reported [19]. Aliquots of the corresponding samples (EF and AgNPs) were taken and placed in the diamond ATR lens; previously, a spectral background was taken in the 4000 to 400 cm−1 spectrum range in transmittance mode. After the reading for each sample, the ATR accessory was cleaned with Kimtech cloths and isopropyl alcohol to avoid cross-contamination between samples.

2.7. Antibacterial Activity

The antibacterial activity was evaluated by the standard well diffusion method. Inoculations of the bacteria E. coli (ATCC 25922) and S. aureus (ATCC 25923) were prepared at a concentration of 1.02 × 10³ CFU/mL and 1.36 × 10⁴ CFU/mL, respectively, as previously described [21]. Then, 20 μL of the inoculum was measured and plated uniformly on the surface of the Mueller Hinton agar (MH). Then, 3 wells of 7 mm diameter were made, distributed equidistantly in the Petri dish, and 20 μL of the AgNPs or EF was added. The plates were then incubated for 24 h at 37 °C; then, the inhibition zone was measured around the well using a vernier caliper [59].

2.8. Plackett-Burman Design

The screening of process parameters was undertaken using the Plackett-Burman design, which is an effective method used to select significant factors from many variables potentially affecting the process [52]. In this study, an 8-run Placket-Burman design was performed to evaluate seven variables (including two dummy variables), and each variable was examined at two levels: the low level (−1) and high level (+1) as shown in Table 1. The values of the two levels were based on our preliminary results. The effect of the individual variables was calculated using Equation (1).
E ( X i ) = 2 ( M i + M i ) / N
where E ( X i )   is the effect of the tested variable ( X i ) , M i + and M i represent the high and low values, respectively, and N is the total number of trials.
Experimental error was determined by estimating the variance between the two dummy variables using Equation (2).
V e f f = ( E d ) 2 / n  
where V e f f is the variance of the effect, E d is the effect for the dummy variable, and n is the number of dummy variables used in the experiment.
The standard error (SE) of the effect was the square root of V e f f , and the significance (p-value) of the effect of each variable was calculated by Student’s t-test.

2.9. Response Surface Methodology (RSM)

The optimal levels of the significant factors and the variable interactions were analyzed by central composite design (CCD) [52]. In this study, a five-factor, three-level CCD with 32 runs was utilized. The tested variables (stirring speed, synthesis pH, synthesis time, synthesis temperature, and ethanolic fraction volume) were denoted as X1, X2, X3, X4 and X5, respectively. Each of the variables was assessed at three different levels, combining factorial points (−1, +1) and the central point (0), as shown in Table 2.
The second-order model used to fit the response to the independent variable (absorbance at 411 nm) is shown in Equation (3).
Y = β 0 + i = 1 k β i X i + i = 1 k β i i X i 2 + i = 1 k β i j X i X j  
where Y is the predicted response (maximum absorbance at 411 nm); X i and X j are the input variables that influence the response Y ; k is the number of variables; β 0 is the constant term; β i is the ith linear coefficient; β i i is the ith quadratic coefficient; and β i j is the ijth interaction coefficient.

2.10. Statistical and Data Analysis

The evaluation of the significance for each of the independent variables X i of the AgNPs biosynthesis process was performed by calculating the degrees of freedom of each variable. Then, the Sum of Squares (SS), the Mean of the Sum of Squares (MSS) and the calculation of the F0 statistic were developed. Analysis of variance (ANOVA) was performed to determine the significance of model and regression coefficients. The quality of the polynomial equation was examined by the determination coefficient (R2), and the statistical significance by Fischer´s F-test. The response surface and contour plots of the predicted responses of the model were used to assess the interactive relationship between the significant variables. Design-Expert version 8.0 (Stat-Ease Inc., Minneapolis, MN, USA) was used for designing the experiments, regression, and graphical analysis of the data. The statistical analysis was carried out with GraphPad version 6.01 (GraphPad Software, San Diego, CA, USA).

3. Results and Discussion

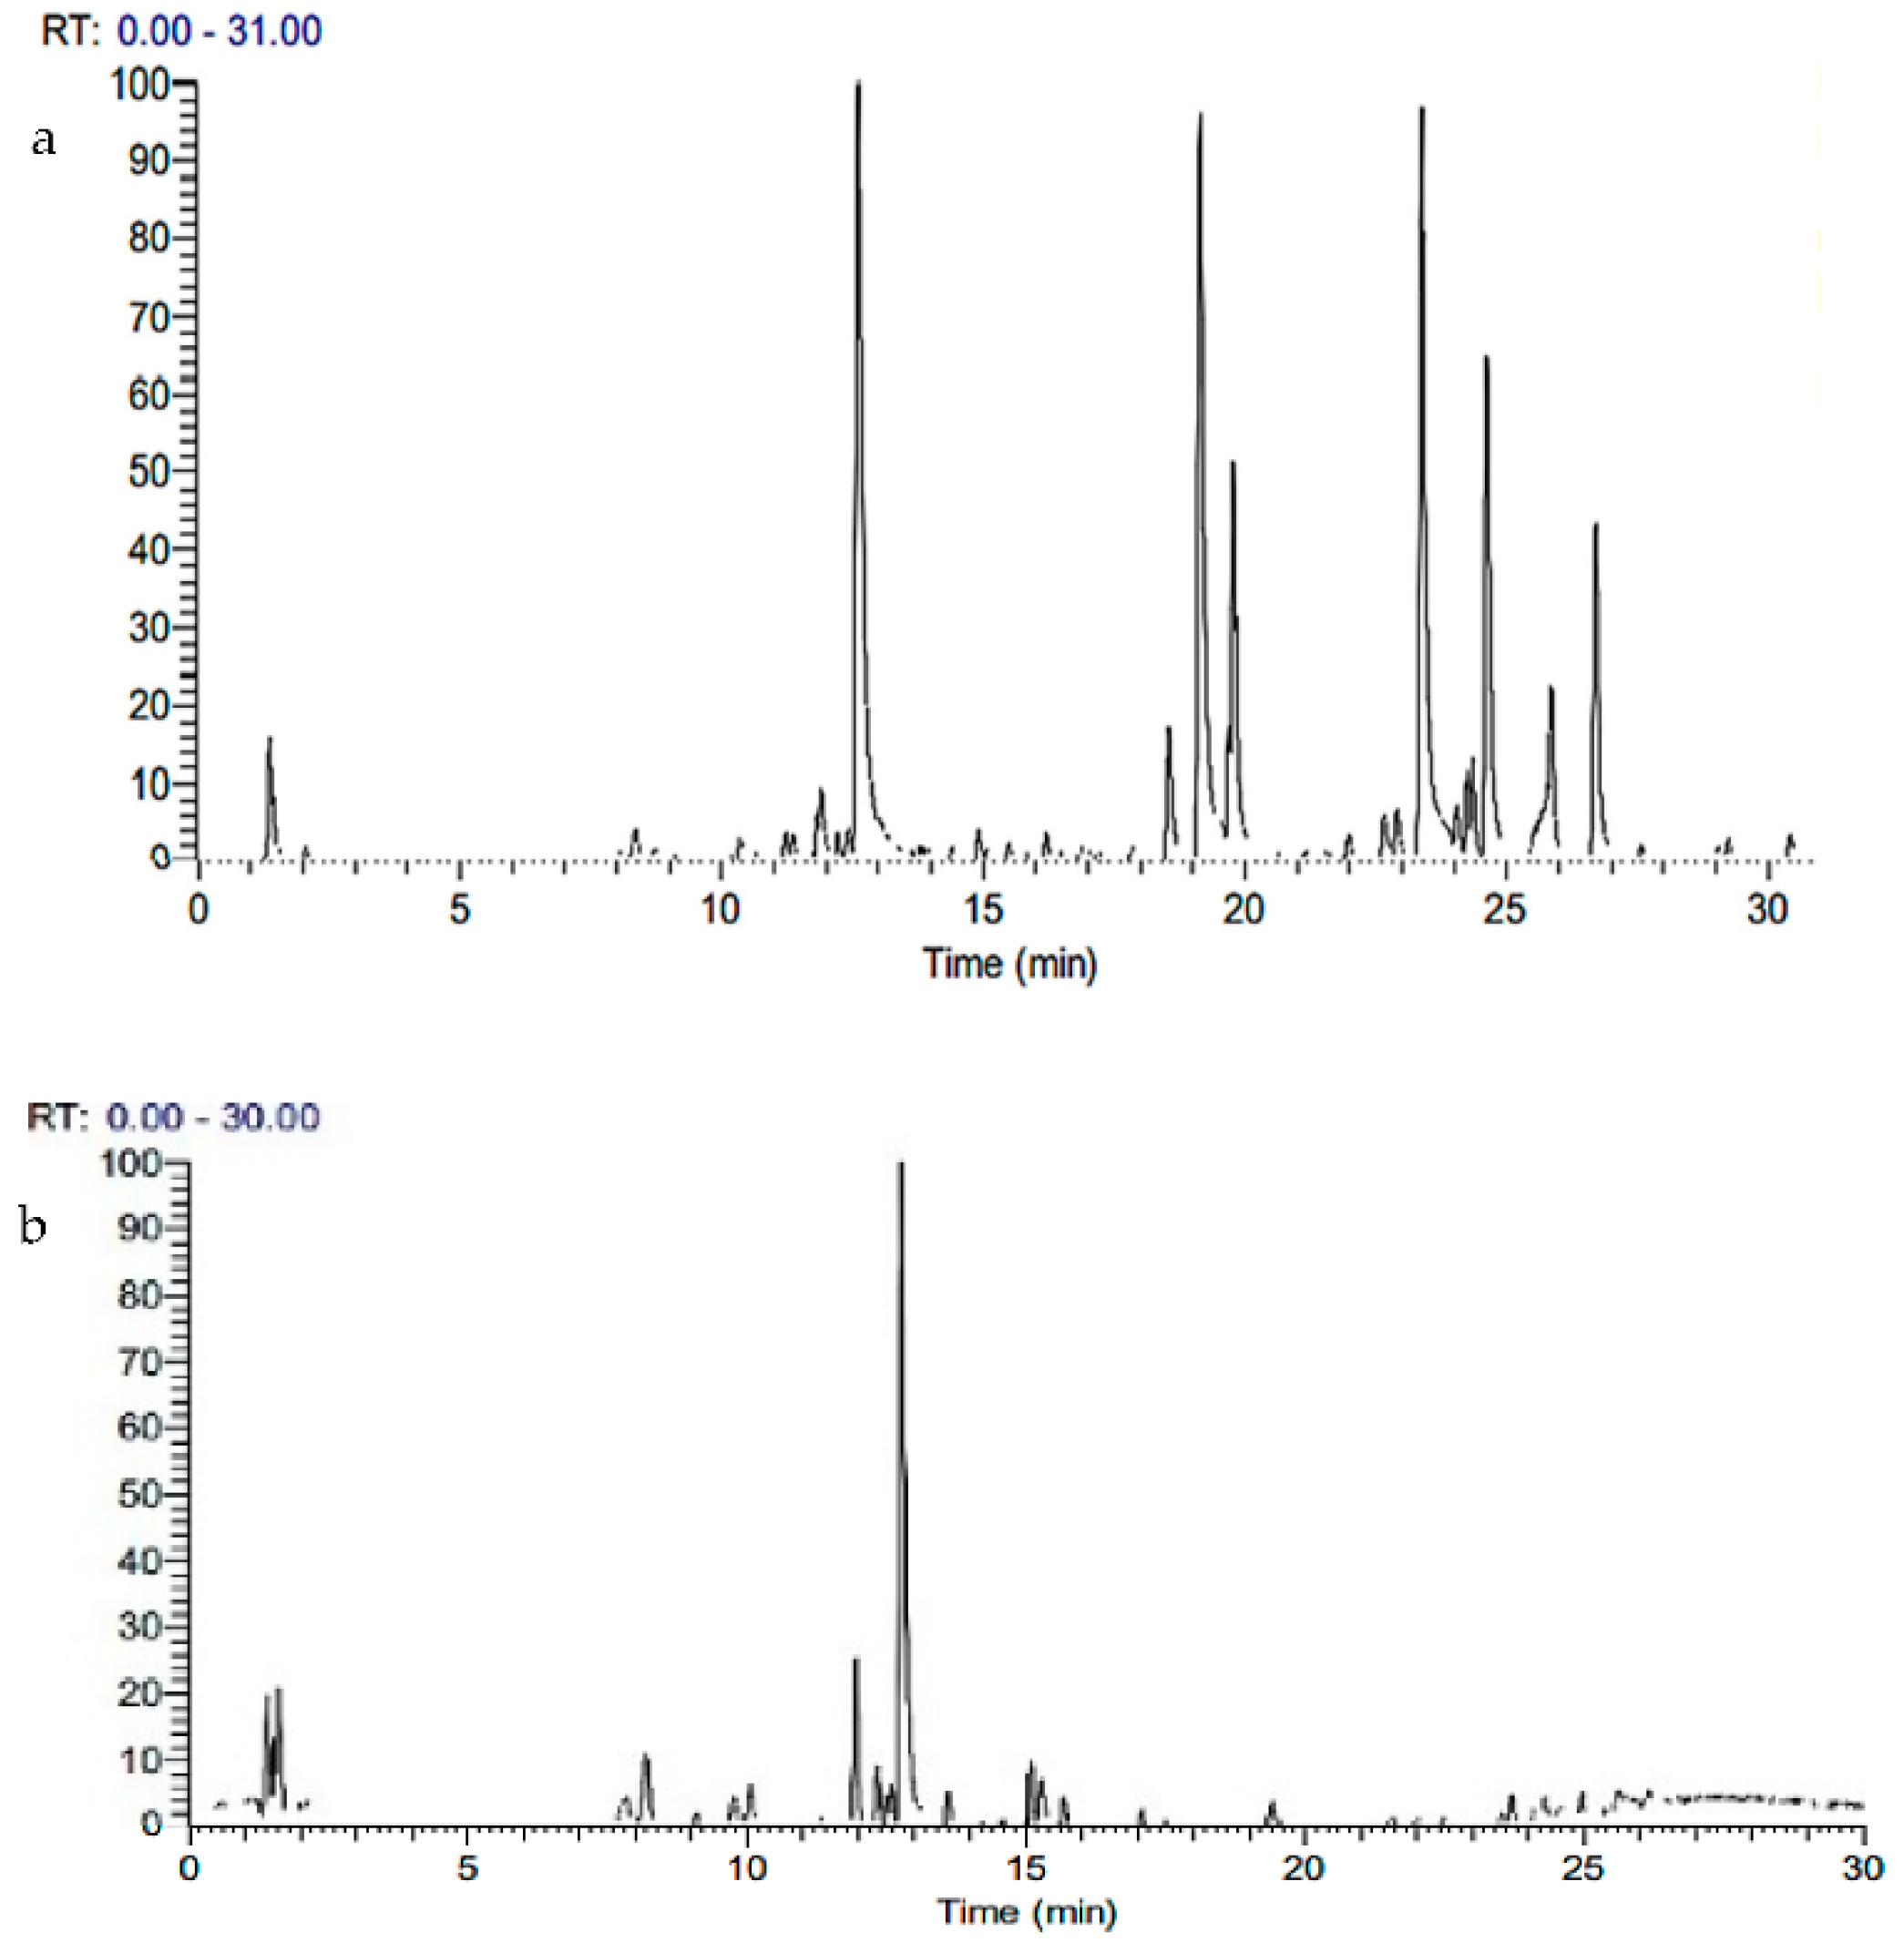
3.1. Identification of Flavonoids by HPLC-MS

Figure 1a,b show the chromatograms of the ethanolic extract and ethanol fraction (EF), respectively. The chromatogram of the extract showed compounds that included saccharides, organic acids, amino acids, cinnamic and caffeic acid derivatives, lignans, flavonoids, triterpenes and fatty acids. In the retention time zone between 0 and 15 min, the most intense signal corresponds to rosmarinic acid (12.66 min), while in the zone between 15 and 30 min, the most intense signals were not conclusively determined; however, it is possible that they correspond to diterpenes derived from carnosic acid [60]. In addition, the following flavonoids were identified with their respective retention times: apigenin 6,8-C-di-glucopyranoside (9.01 min), quercetin rutinoside (10.27 min), quercetin glucuronide (10.32 min), isoquercetrin (10.40 min), kaempferol-7-O-neohesperidoside (11.13 min), hesperetin-7-O-rutinoside (12.26 min) and diosmin (12.36 min). The chromatogram of the ethanolic fraction also shows rosmarinic acid as the most intense signal (12.63 min). In addition, the following flavonoids were identified with their respective retention times: hesperetin-7-O-rutinoside (12.22 min) and diosmin (12.36 min). Similar investigations have reported the presence of rosmarinic acid as the major component in ethanolic or methanolic extracts of Lepechinia meyenii (salvia), with retention times around 12.09 min [61] and 14.5 min [62,63]. Likewise, Zuo et al. [62] reported the presence of hesperidin and diosmetin, from which diosmin is derived.

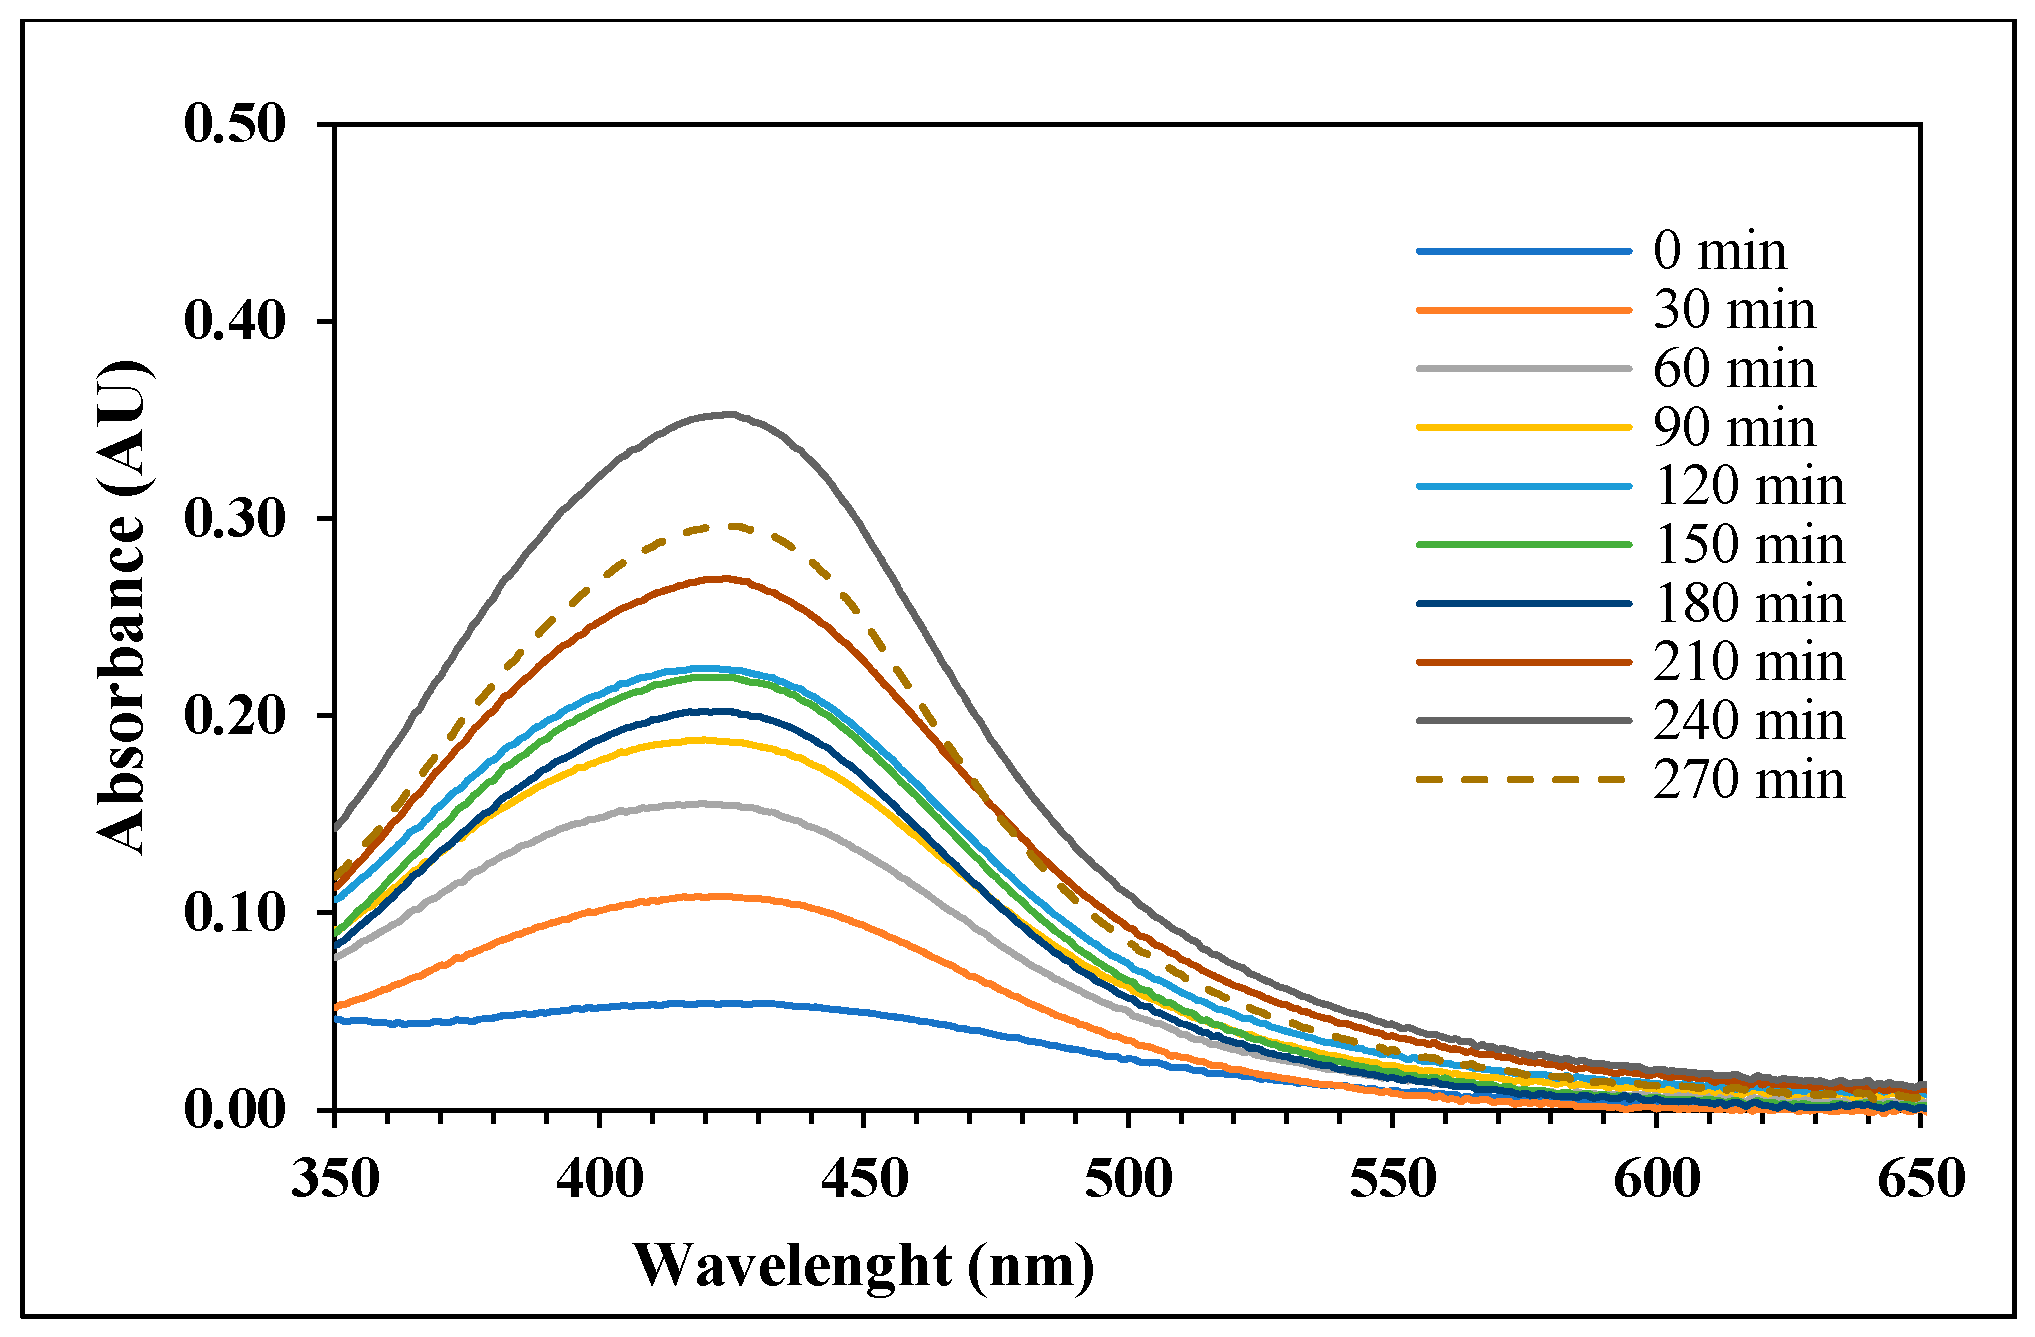
3.2. UV-Visible Spectra Analysis

Figure 2 shows the UV-visible spectra of the AgNPs showing the absorbance at different time intervals. The formation and optimization of AgNPs was monitored by UV-visible spectroscopy by measuring the absorbance in the scanning range from 350 to 700 nm. An absorption maximum peak was seen between 410 and 420 nm, corresponding to the surface plasmon resonance (SPR). An increase in absorbance with respect to synthesis time was also observed, reaching a maximum at 240 min, with a maximum absorbance of 0.35 absorption units (AU). The presence of these peaks has been previously reported and demonstrates the formation of silver nanoparticles monitored by the bioreduction process of silver ions (Ag+) to AgNPs (Ag0) by UV-visible spectroscopy [64]. Furthermore, the visible color change and the appearance of the characteristic surface plasmon resonance (SPR) peak between 400 and 500 nm indicates the formation of AgNPs [65].
The reduction of silver ions (Ag+) present in the reaction solution was mediated by the reducing effect of the added volume of EF from Lepechinia meyenii (salvia), which was validated by the change of the reaction color to a translucent golden yellow color with the formation of AgNPs. This correlates with a previous study that reported that the UV-visible spectra obtained from the formed AgNPs revealed an absorbance peak maximum of AgNPs between 410 and 420 nm due to the surface plasmon resonance (SPR) effect [66]. Another study reported a gradual increase in color density as an indicator of the increase in the rate of AgNPs formation in the reaction mixture [67]. Furthermore, UV-visible spectroscopy is considered as one of the important procedures to establish the development of metal nanoparticles [68]. The maximum absorbance peak for AgNPs has been reported to range between 400 nm [69,70,71] and 432 nm [67].

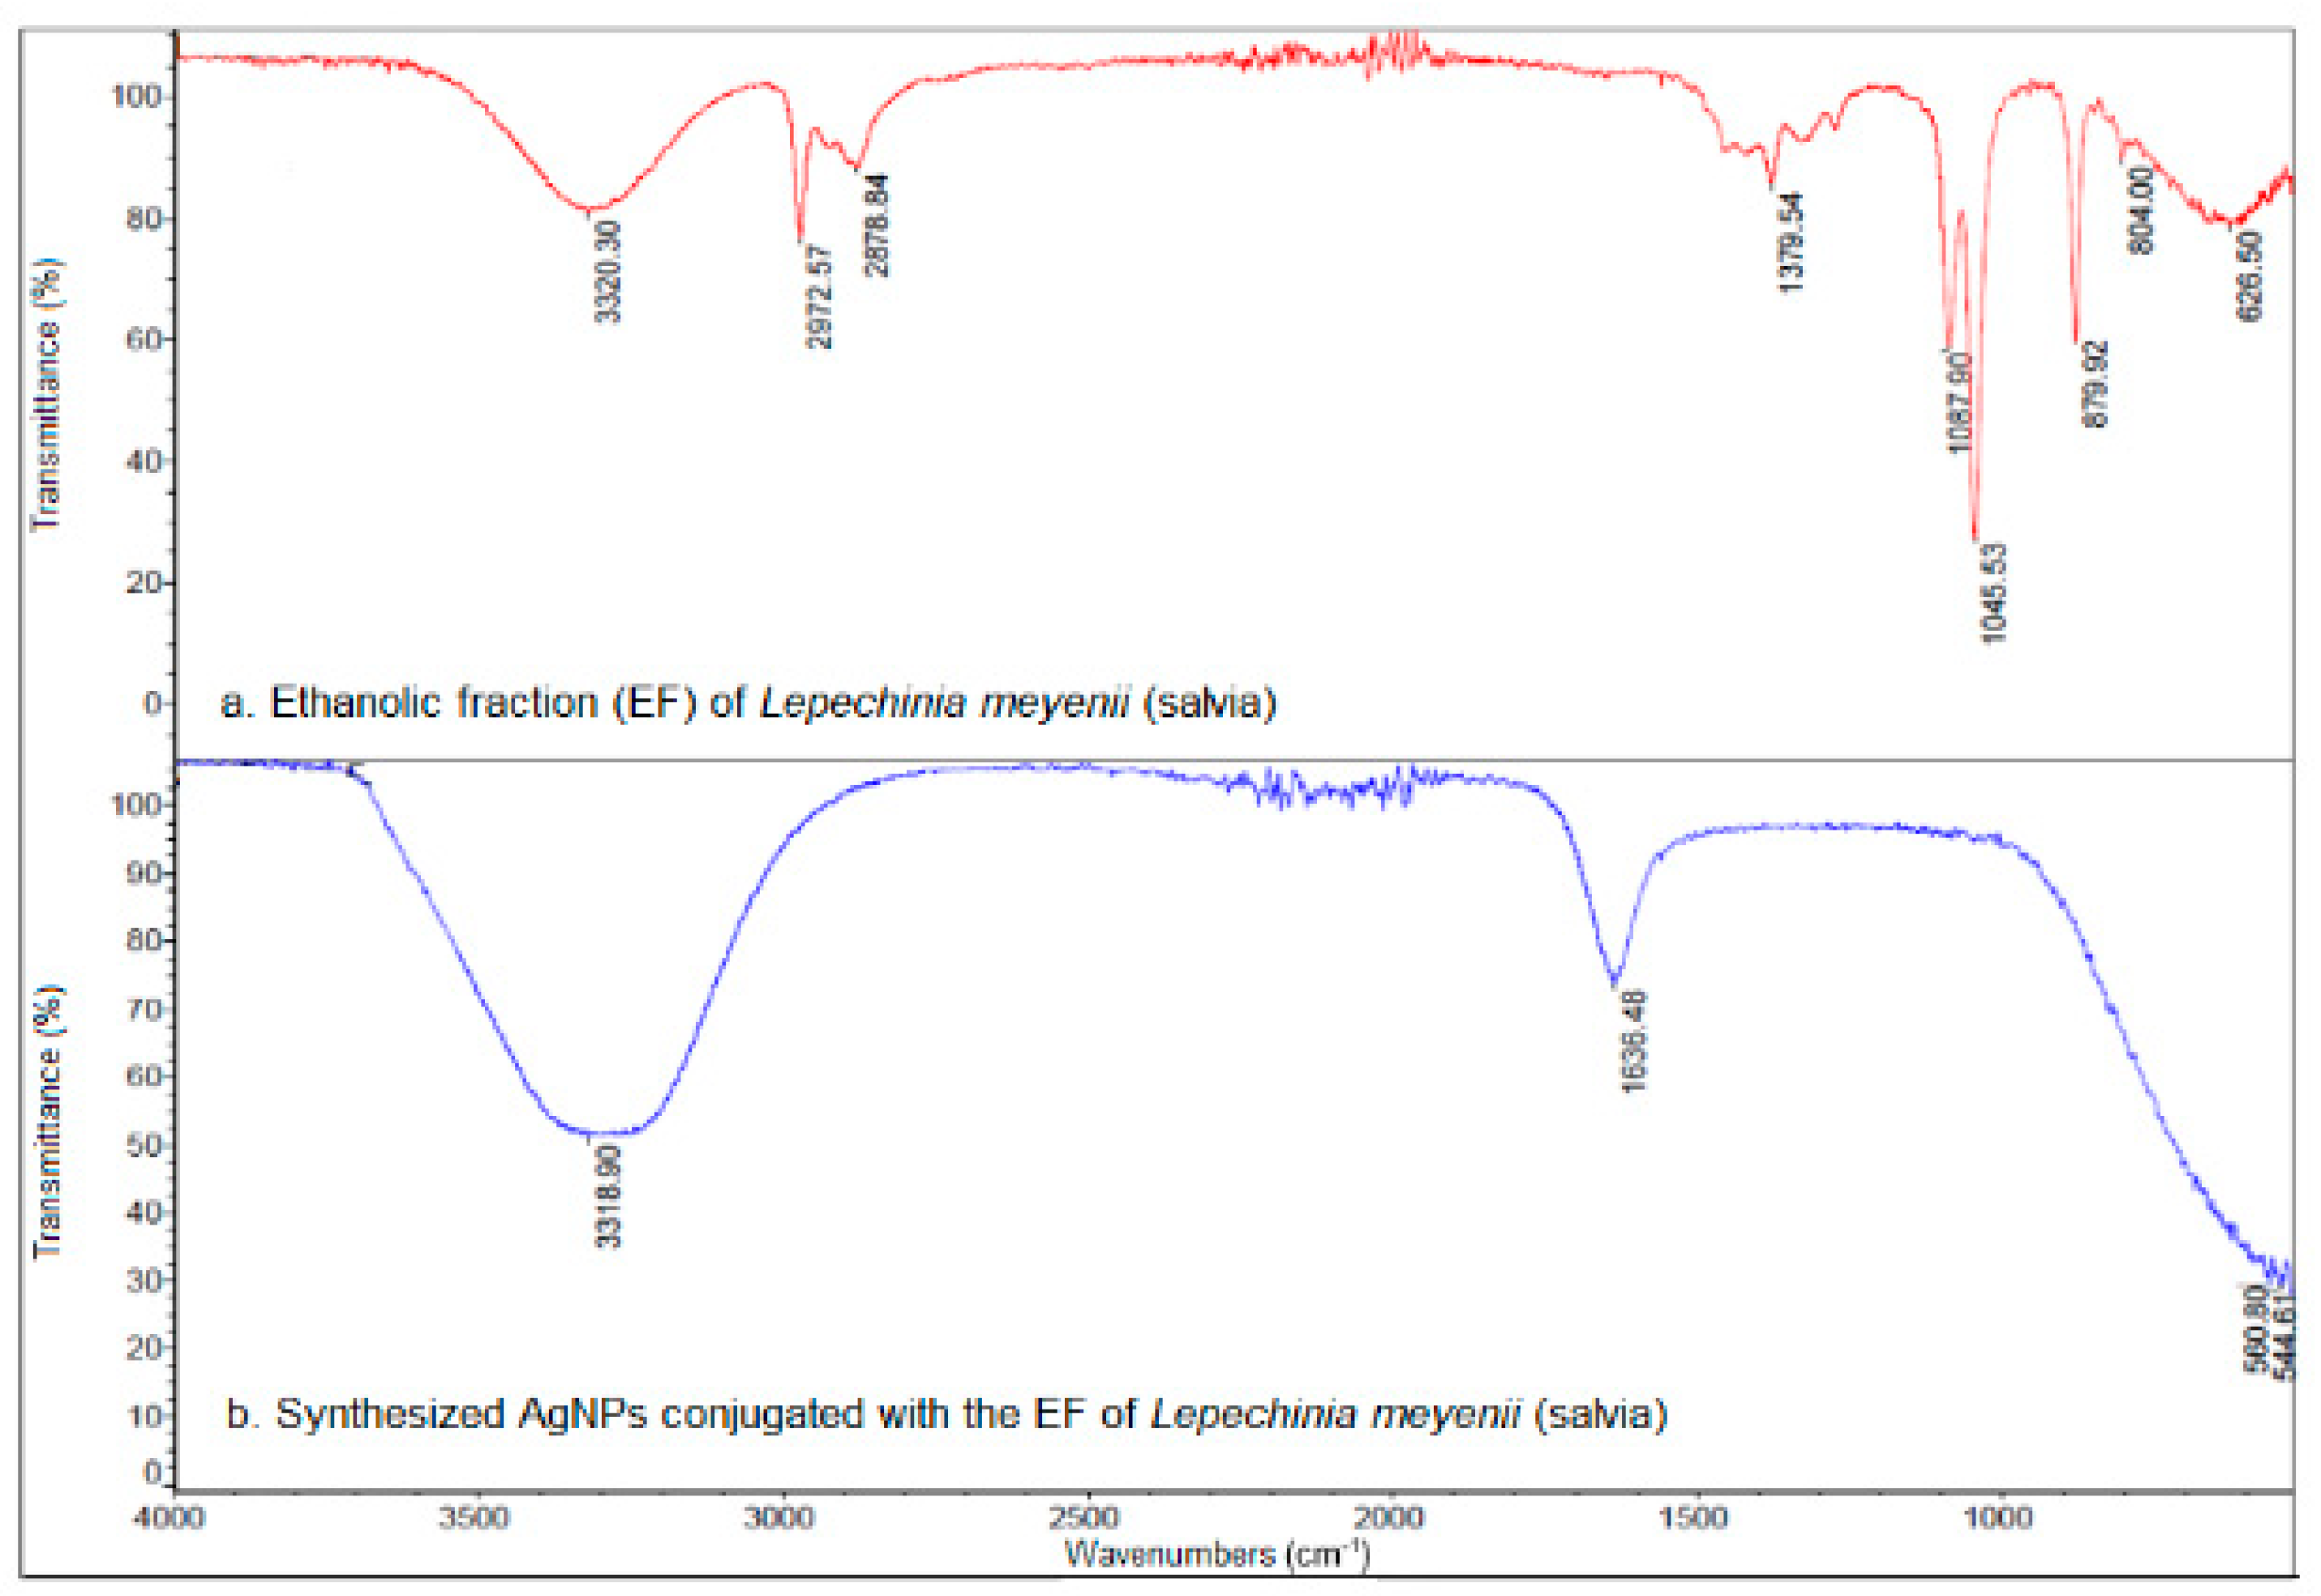
3.3. FT-IR Spectrophotometry

FTIR spectroscopy for ethanolic fraction (EF) was carried out to determine the possible bioactive compounds with the ability to reduce Ag+ ions and stabilize the formed nanoparticles [72,73]. As observed in Figure 3a, there are some transmission peaks at 3320.30, 2972.57, 2878.84, 1379.54, 1087.90, 1045. 53, 879.98 and 804.00 cm−1. The band in the range of 3000 to 3400 cm−1 is the indicator of stretching of the OH group within free hydroxyl groups or may be an indicator of OH groups attached to aromatic structures, which confirms the existence of phenolic compounds in the EF [74]. The band between 2972.57 and 2878.84 cm−1 is an indicator of the presence of carboxylic acids [75]. The band at 1379.54 cm−1 would correspond to S=O or the N-O group [76]. The band observed at 1087.90 and 1045.53 cm−1 demonstrates the alcohols used in the C-OH extract and the band between 879.98 and 804 cm−1 demonstrates an out-of-plane stretching in the C=C or an out-of-plane stretching of the C-H in aromatic structures or S-OR bonds within ester compounds [76]. Finally, the band at 629.50 cm−1 corresponds to a bending in the C=C bond or stretching in alkyl halides [76].
Figure 3b shows the spectrum of the synthesized AgNPs conjugated with the ethanolic fraction of Lepechinia meyenii (salvia). Three representative peaks are observed at 3318.90, 1636.48 and 560.80 cm−1, which present some changes in shape and position compared to the peaks observed in the ethanolic extract. The appearance and change of position of the peaks at 3600–3200 cm−1 and 1610–1550 cm−1 indicates the presence of OH groups and carboxylic acids and probably NH amine groups, in the protection agents that act as stabilizers from the Lepechinia meyenii (salvia) ethanolic fraction [76]. It was also observed that the position of the band at 1379.54 cm−1 in the ethanolic fraction was displaced to a lower region at 1636.48 cm−1, indicating the possibility of an asymmetrical stretching of carboxylic (COO) anions and the stretching of amino groups, which are capable of attracting silver ions and providing an electron source for the process of reduction [77,78].

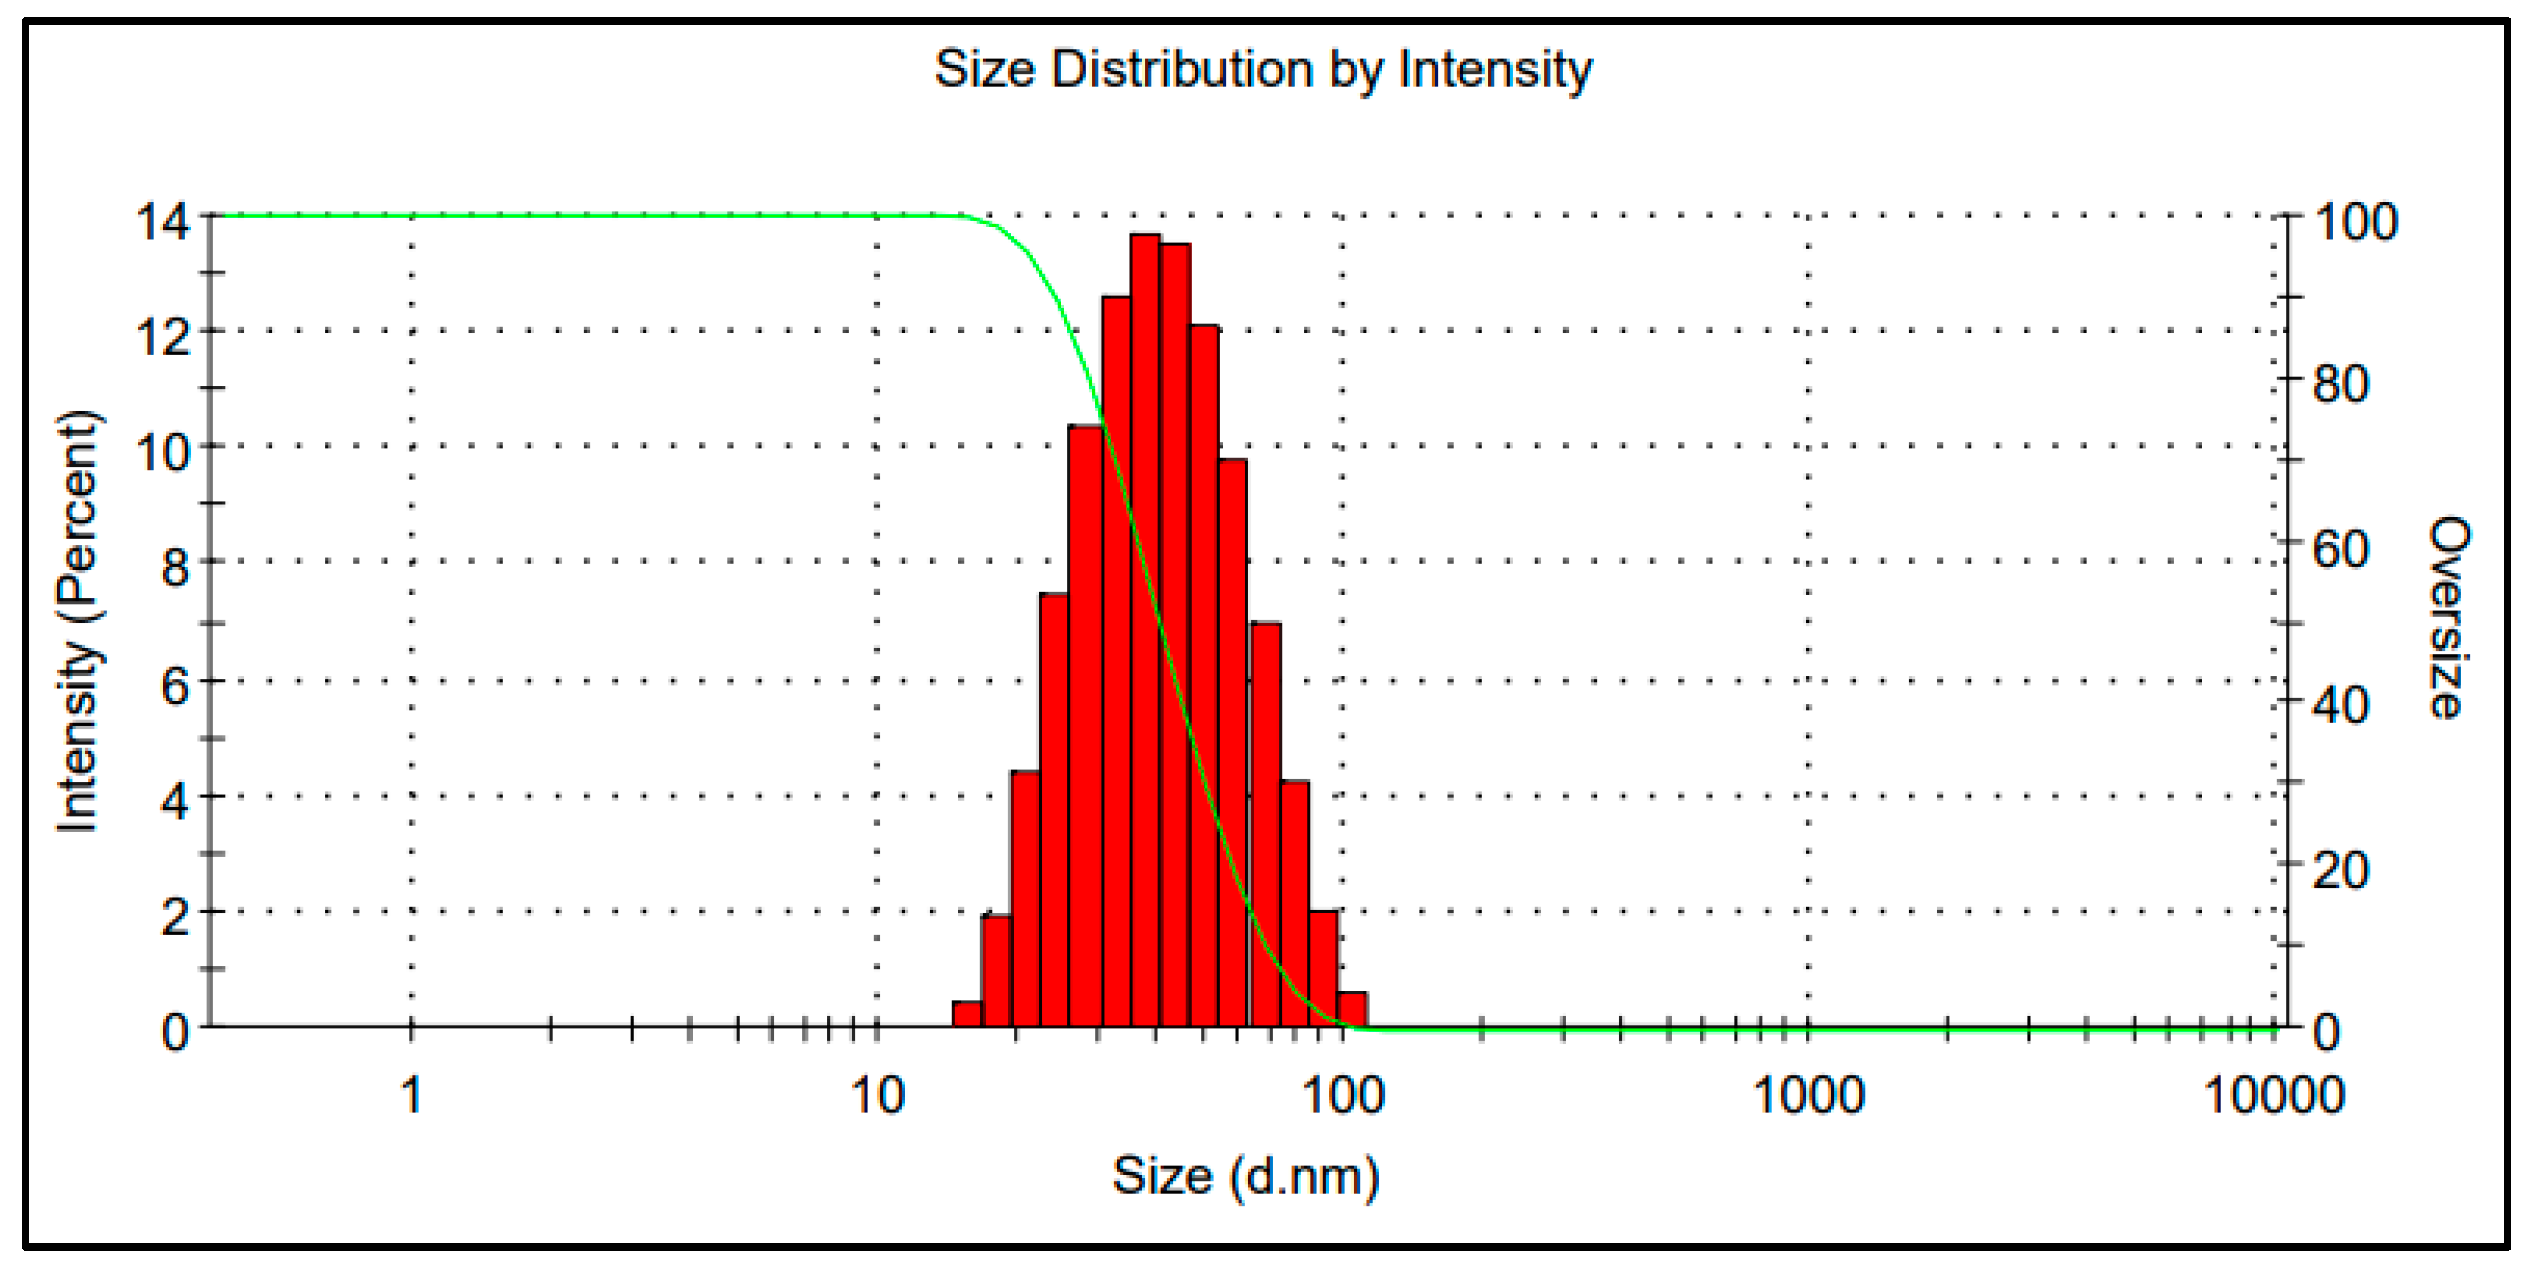
3.4. Dynamic Light Scattering (DLS)

Figure 4 shows the size distribution by DLS of the AgNPs using the ethanolic fraction with the optimized synthesis parameters applying response surface methodology (RSM); an average hydrodynamic diameter of 43.71 ± 17.37 nm was obtained. A previous study that optimized AgNPs synthesis conditions using RSM reported an average hydrodynamic diameter of 37.65 nm [79], which agrees with the obtained results in the current study.

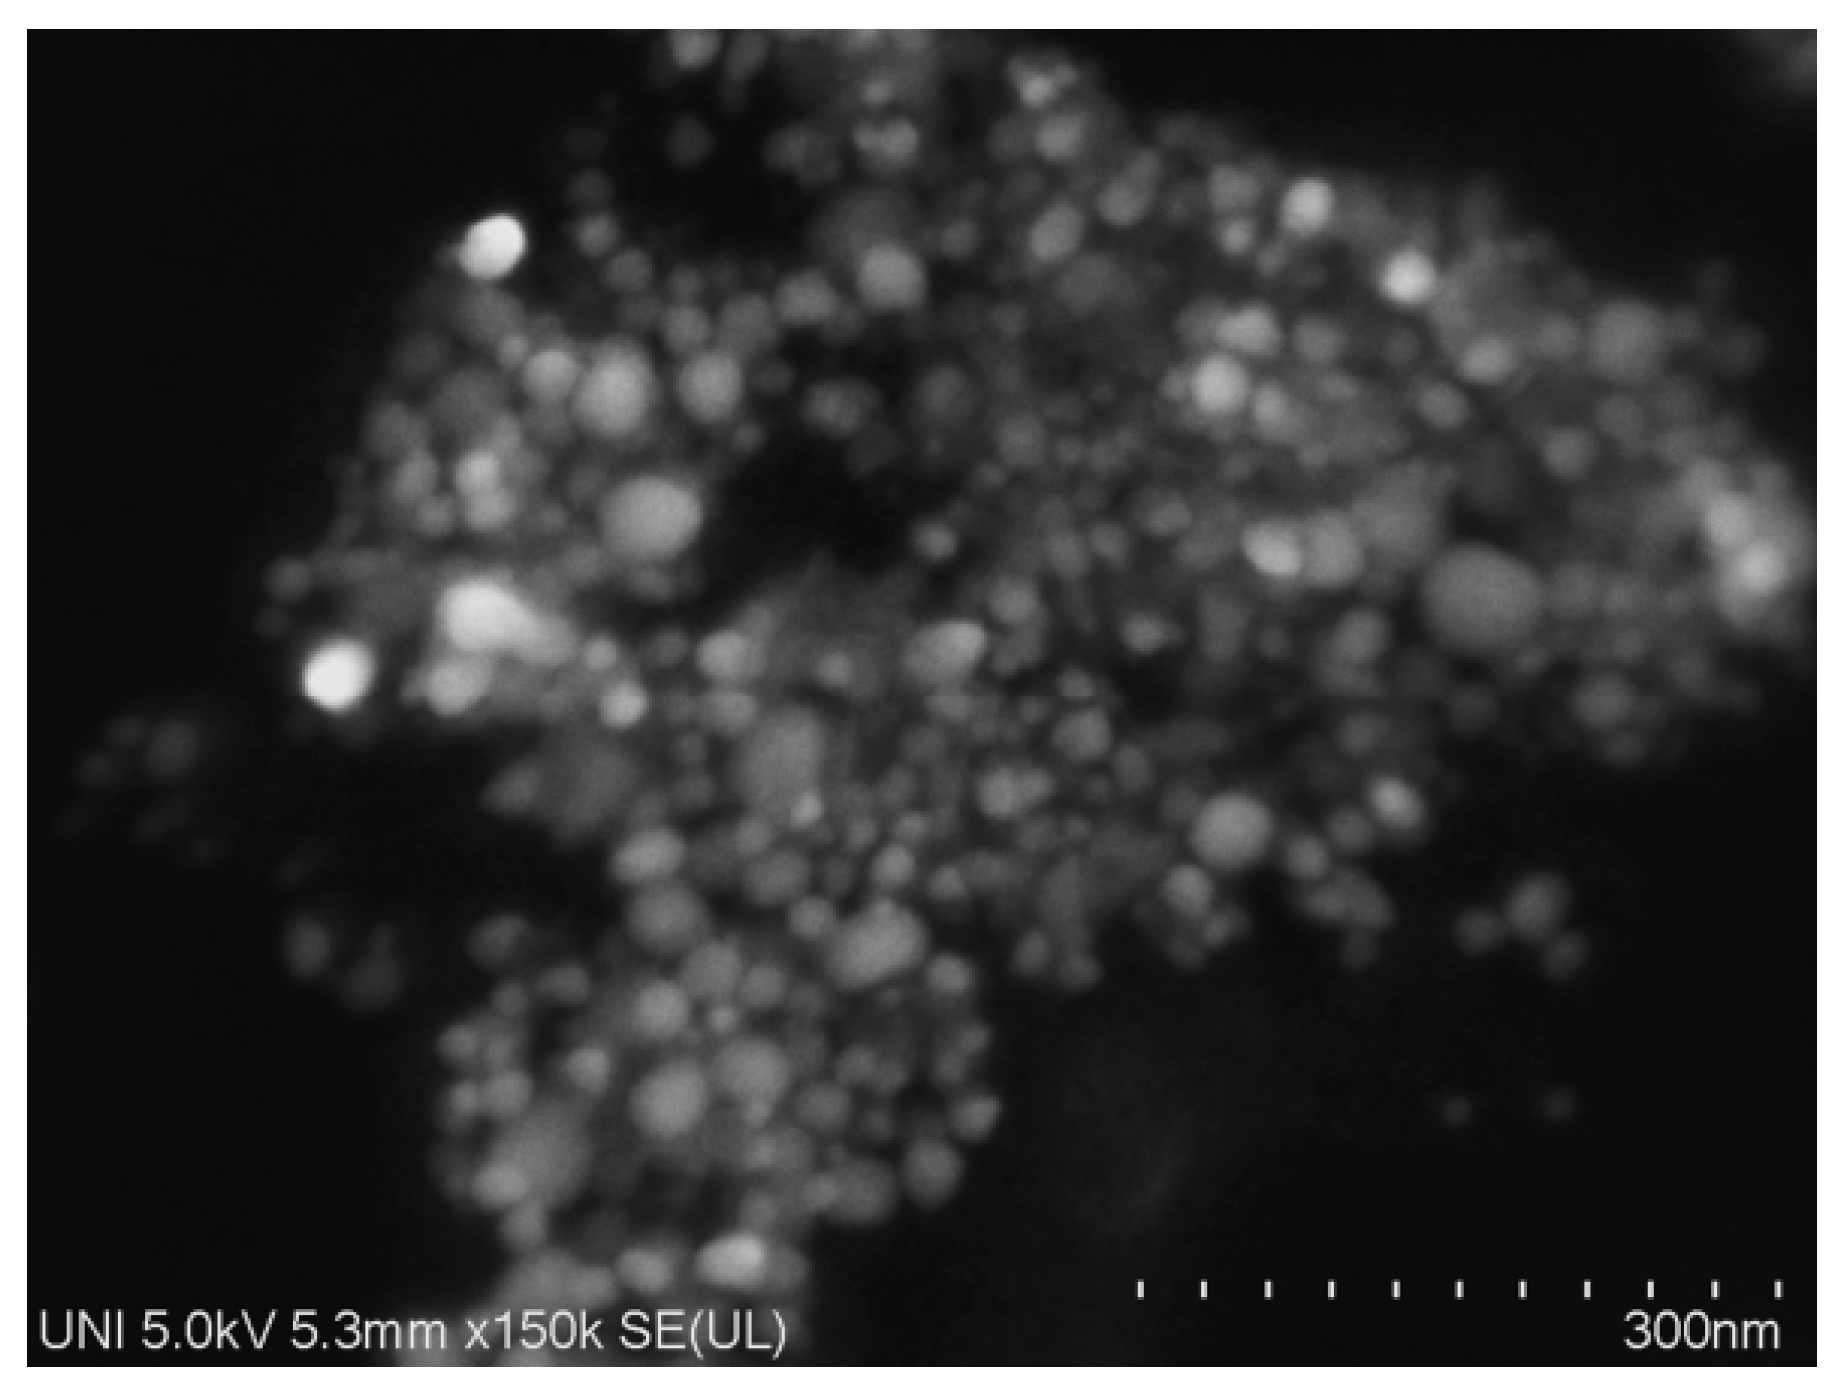
3.5. Scanning Transmission Electron Microscopy (STEM)

STEM provides information on sample size and morphology by providing high resolution images of samples by focusing on the primary electron beam and detecting secondary or backscattered electron signals [80]. Figure 5 shows the morphology and size (below 60 nm) of the synthesized AgNPs conjugated with the ethanolic fraction of Lepechinia meyenii (salvia). These results are in agreement with a previous study that reported the spherical shape and the particle size between 20 and 60 nm for AgNPs [79,81].

3.6. Screening of Important Variables Using Plackett-Burman Design

Table 1 shows the initial levels of the variables tested in the Plackett-Burman design for AgNPs biosynthesis. As shown in Table 3, the analysis of the regression coefficients reported that synthesis pH, synthesis temperature and ethanolic fraction volume had positive effects on the predicted response (maximum absorbance at 411 nm), whereas stirring speed and synthesis time had negative effects. It was determined that these five variables have greater significance in the biosynthesis process of AgNPs. The multiple linear statistical model is represented below, with the values coded by Equation (4).
Y = 0.3792 0.2240   X 1 + 0.3124   X 2 0.0116 X 3 + 0.0506   X 4 + 0.2460   X 5

3.7. Optimization by Response Surface Methodology

3.7.1. RSM Regression Equation and Model Analysis

CCD was used to assess the interaction between the significant factors to optimize the biosynthesis of AgNPs conjugated with the ethanolic fraction of Lepechinia meyenii (salvia). The results obtained from the experimental in-tests were related to the estimated (predicted) and experimental (observed) values. A second-order polynomial mathematical model to calculate the optimal levels in the experimental design was proposed to provide adequate fit between the estimated (predicted) and experimental (observed) values [82]. Therefore, multiple regression analysis was used, and the second-order polynomial equation is shown in Equation (5).
Y = 0.7739 + 0.0405 X 2 + 0.0534 X 3 + 0.0961 X 4 + 0.0405 X 5 + 0.0488 X 2 2 + 0.0964 X 3 2 + 0.0440 X 4 2 + 0.05290 X 5 2 + 0.1941 X 3 2 0.0568 X 3 X 5 + 0.0604 X 4 X 5
Table 4 shows the adequacy of the model using ANOVA; the F-value of the model was 1.78, and the linear term ethanolic fraction volume ( X 5 ), the quadratic term synthesis temperature* synthesis temperature ( X 4 4 ), and the interactive term synthesis pH* synthesis temperature ( X 2 X 4 ) were significant for the predicted response (maximum absorbance at 411 nm). The R2 is the coefficient of determination used to measure the goodness of fit of the model [83], and the obtained adjusted R2 was 0.9723 between the predicted (estimated) response values and the experimental (observed) response values for maximum absorbance at 411 nm, indicating that the model had a high correlation and a satisfactory response prediction. The adjusted R2 can correct the value of R2 for the size of the sample and the number of terms in the model [84].

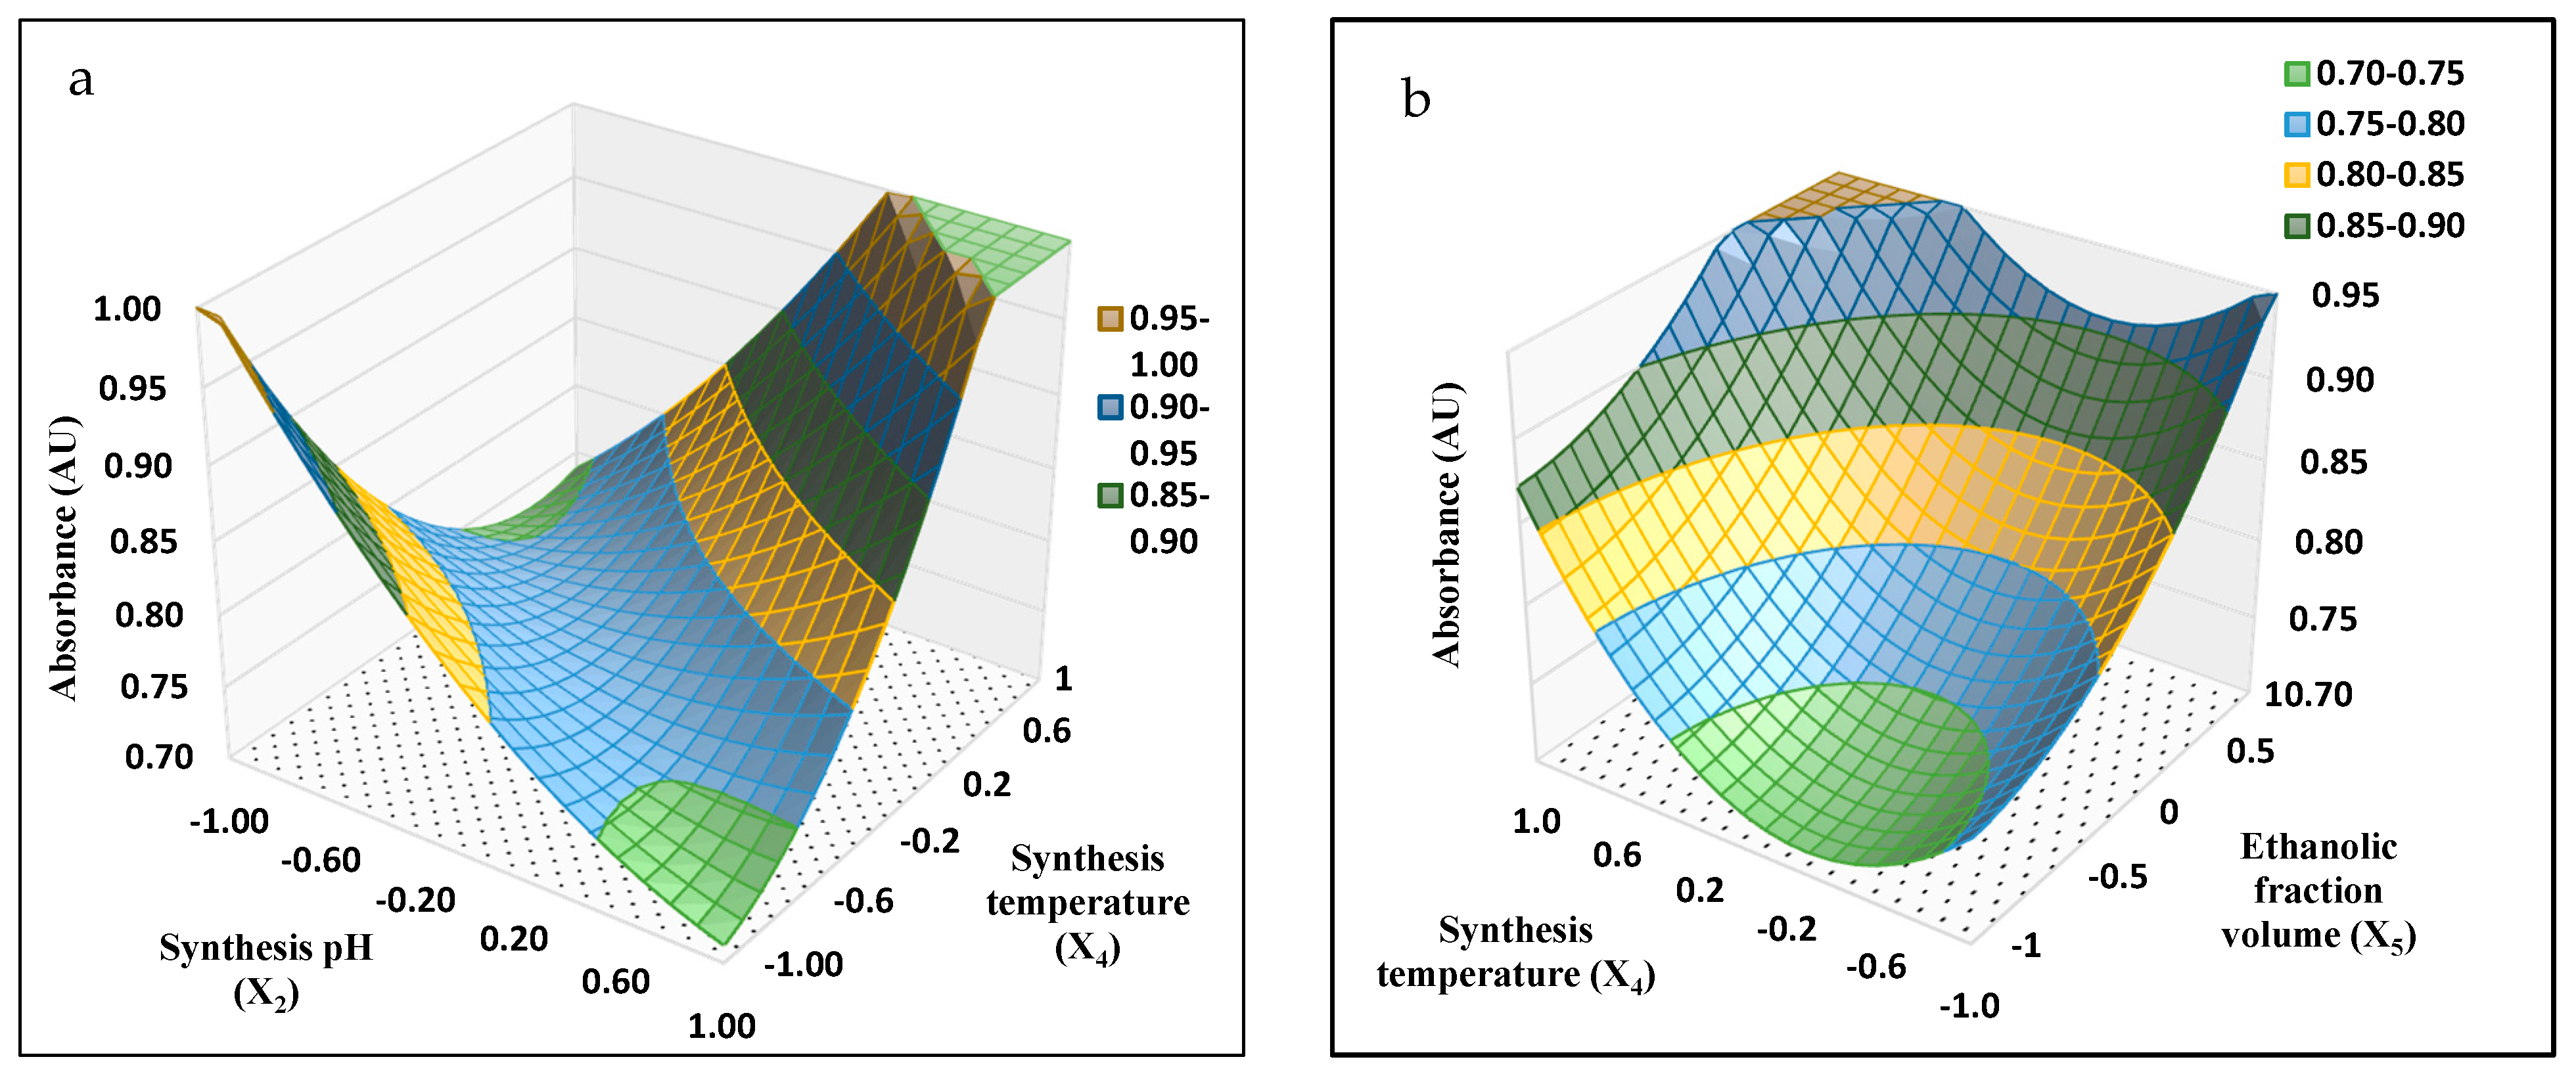
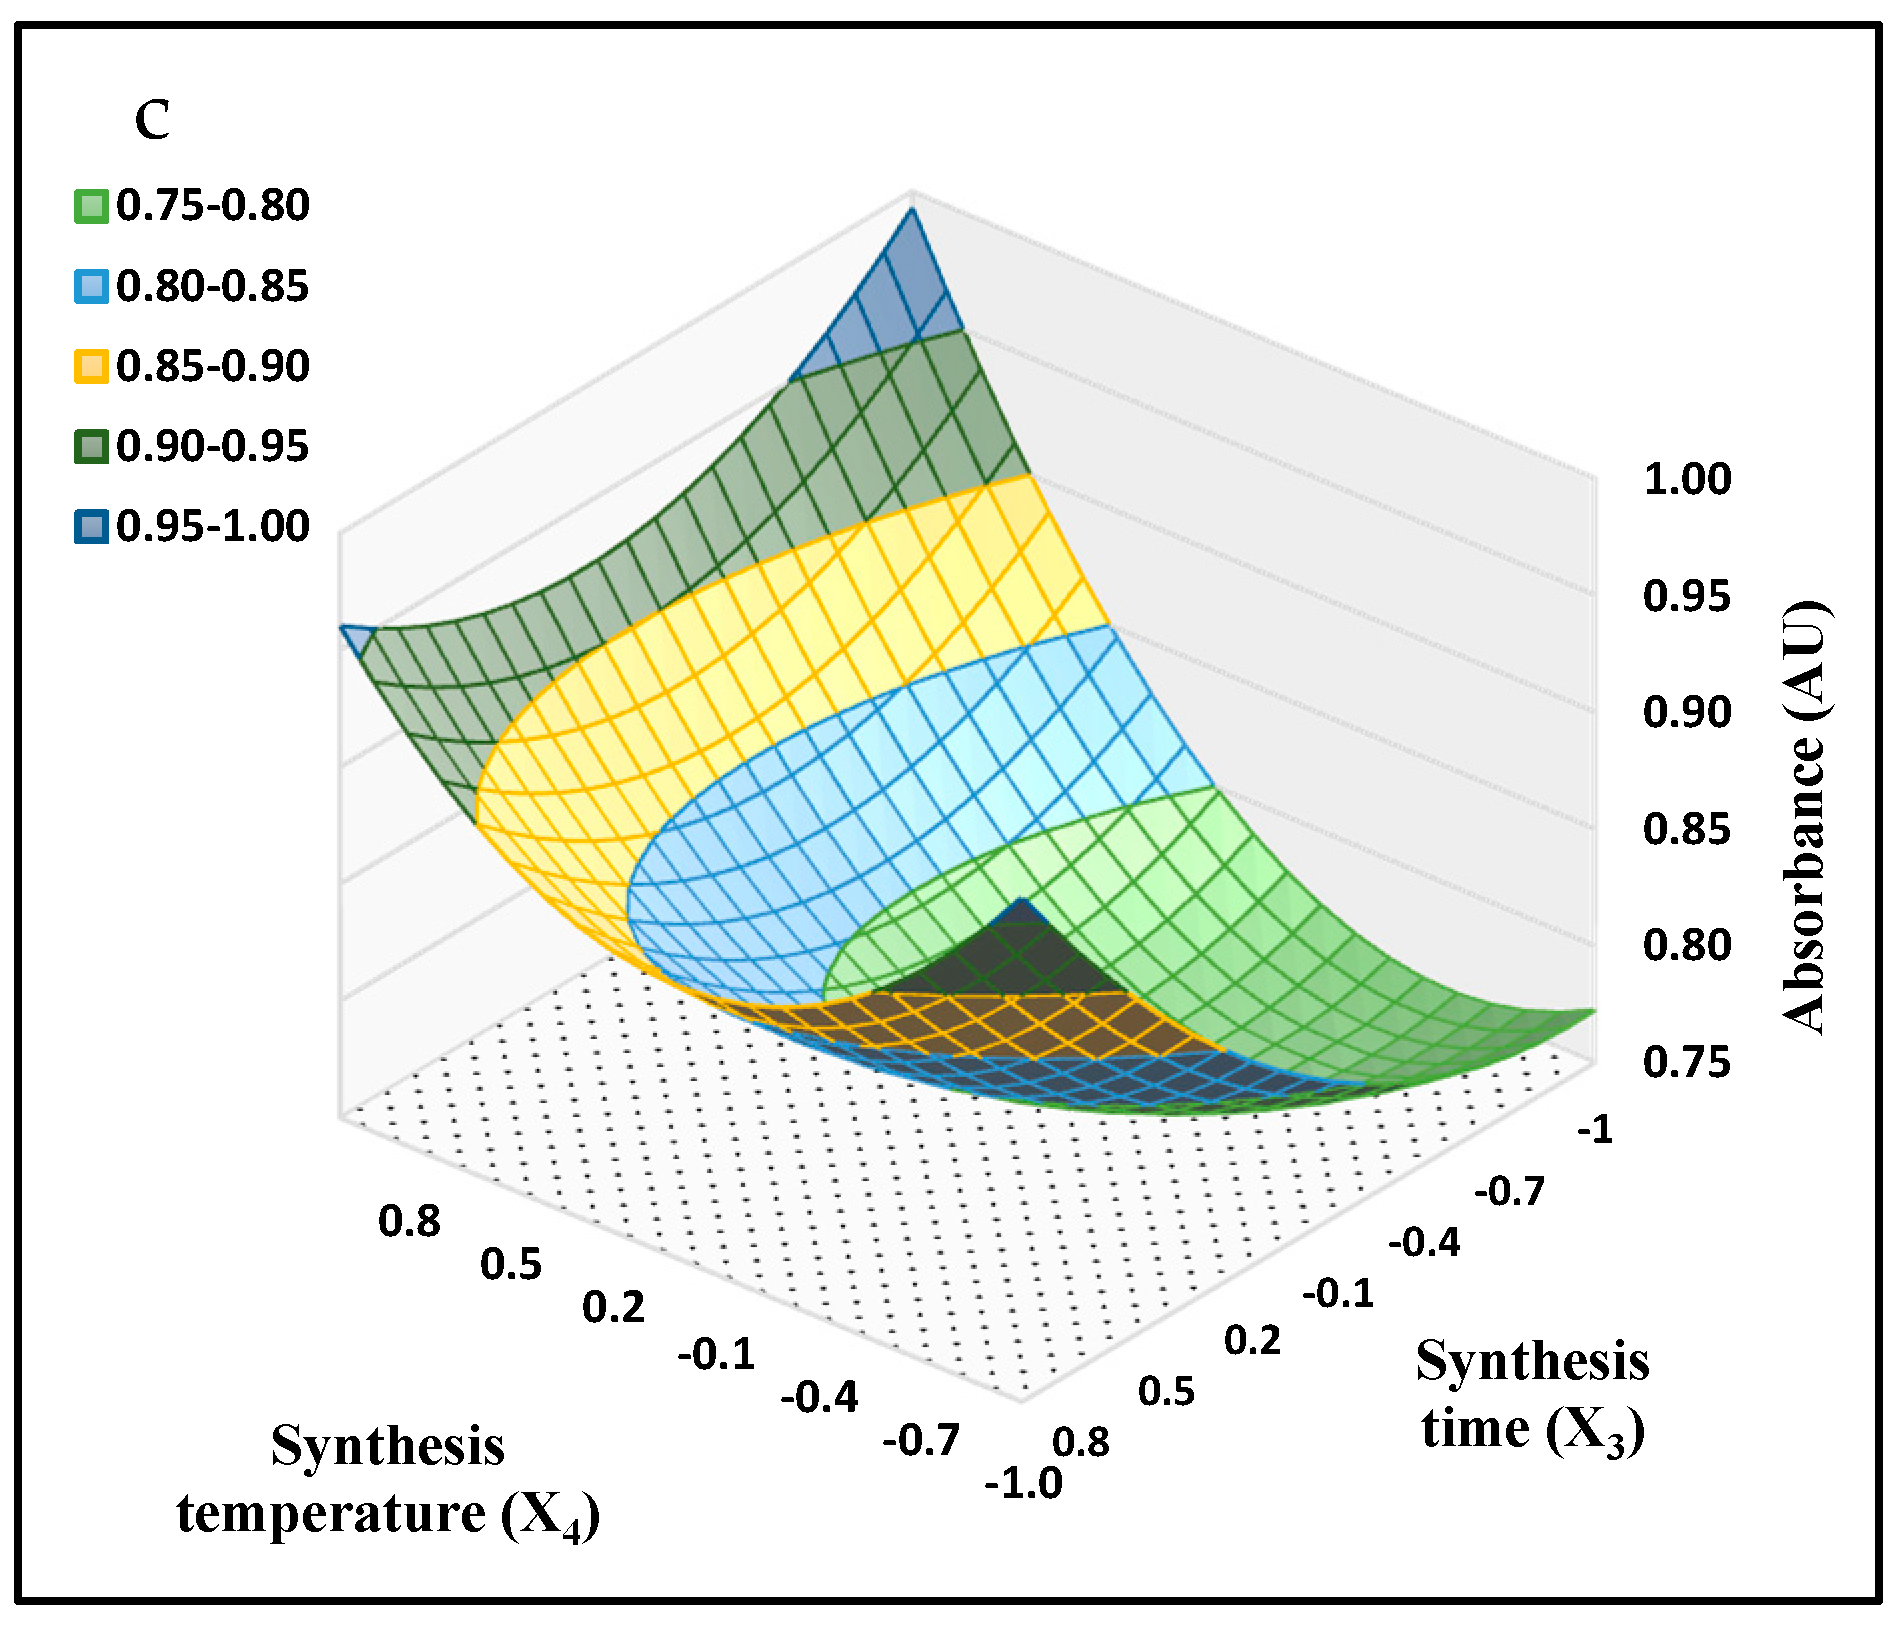
3.7.2. Mutual Interactions between the Significant Factors

The response surface plots and their corresponding contour plots are shown in Figure 6. Each response surface plot represents the effect of two independent variables while the other variables are maintained at zero; the shape of the corresponding contour plot indicates if the interaction between the independent variables is significant [52]. As shown in Figure 6a, each response surface of Y indicates a clear valley, indicating that the optimum apex exhibited a bimodal behavior. The effect of synthesis pH (X2) and synthesis temperature (X4) on absorbance while keeping stirring speed (X1), synthesis time (X3) and ethanolic fraction volume (X5) constant are depicted in Figure 6a. An increase in Y could be achieved when the synthesis temperature ranged between +0.2 and +0.6, and the synthesis pH ranged from −0.2 to +0.6, which indicates that Y increases as synthesis pH and synthesis temperature increased towards optical synthesis conditions. The even running distribution of the contour plot suggests that the mutual interaction between the two independent variables (X2, X4) was significant.
As shown in Figure 6b, each response surface of Y indicates a clear peak, which reflects the optimum point is inside the design boundary. The effect of synthesis temperature (X4) and ethanolic fraction volume (X5) on absorbance while keeping stirring speed (X1), synthesis pH (X2) and synthesis time (X3) constant are depicted in Figure 6b. An increase in Y could be achieved when the synthesis temperature ranged between +0.6 and +1.0, and the ethanolic fraction volume ranged from +0.5 to +1.0, which indicates that Y increases as synthesis temperature and ethanolic fraction volume increased towards optimum conditions. The contour plot showed a clearly elongated running on plot, suggesting that the interaction between synthesis temperature (X4) and ethanolic fraction volume (X5) was not significant on Y.
Figure 6c shows that each response surface of Y indicates a clear peak, which suggests that the optimum point is inside the design boundary. The effect of synthesis temperature (X4) and synthesis time (X3) on absorbance while keeping stirring speed (X1), synthesis pH (X2) and ethanolic fraction volume (X5) constant are depicted in Figure 6c. An increase in Y could be achieved when the synthesis temperature ranged between +0.8 and +1.0, and the synthesis time ranged from −0.7 to −1.0, which indicates that Y increases as synthesis temperature increased and synthesis time decreased to optimum conditions. The contour plot shows a clearly elongated running on plot, suggesting that the interaction between synthesis temperature (X4) and synthesis time (X3) was not significant on Y. The optimized conditions for the synthesis of nanoparticles were pH 9.45, temperature 49.8 °C, volume of ethanolic fraction 152.6 µL and a reaction time of 213.2 min.

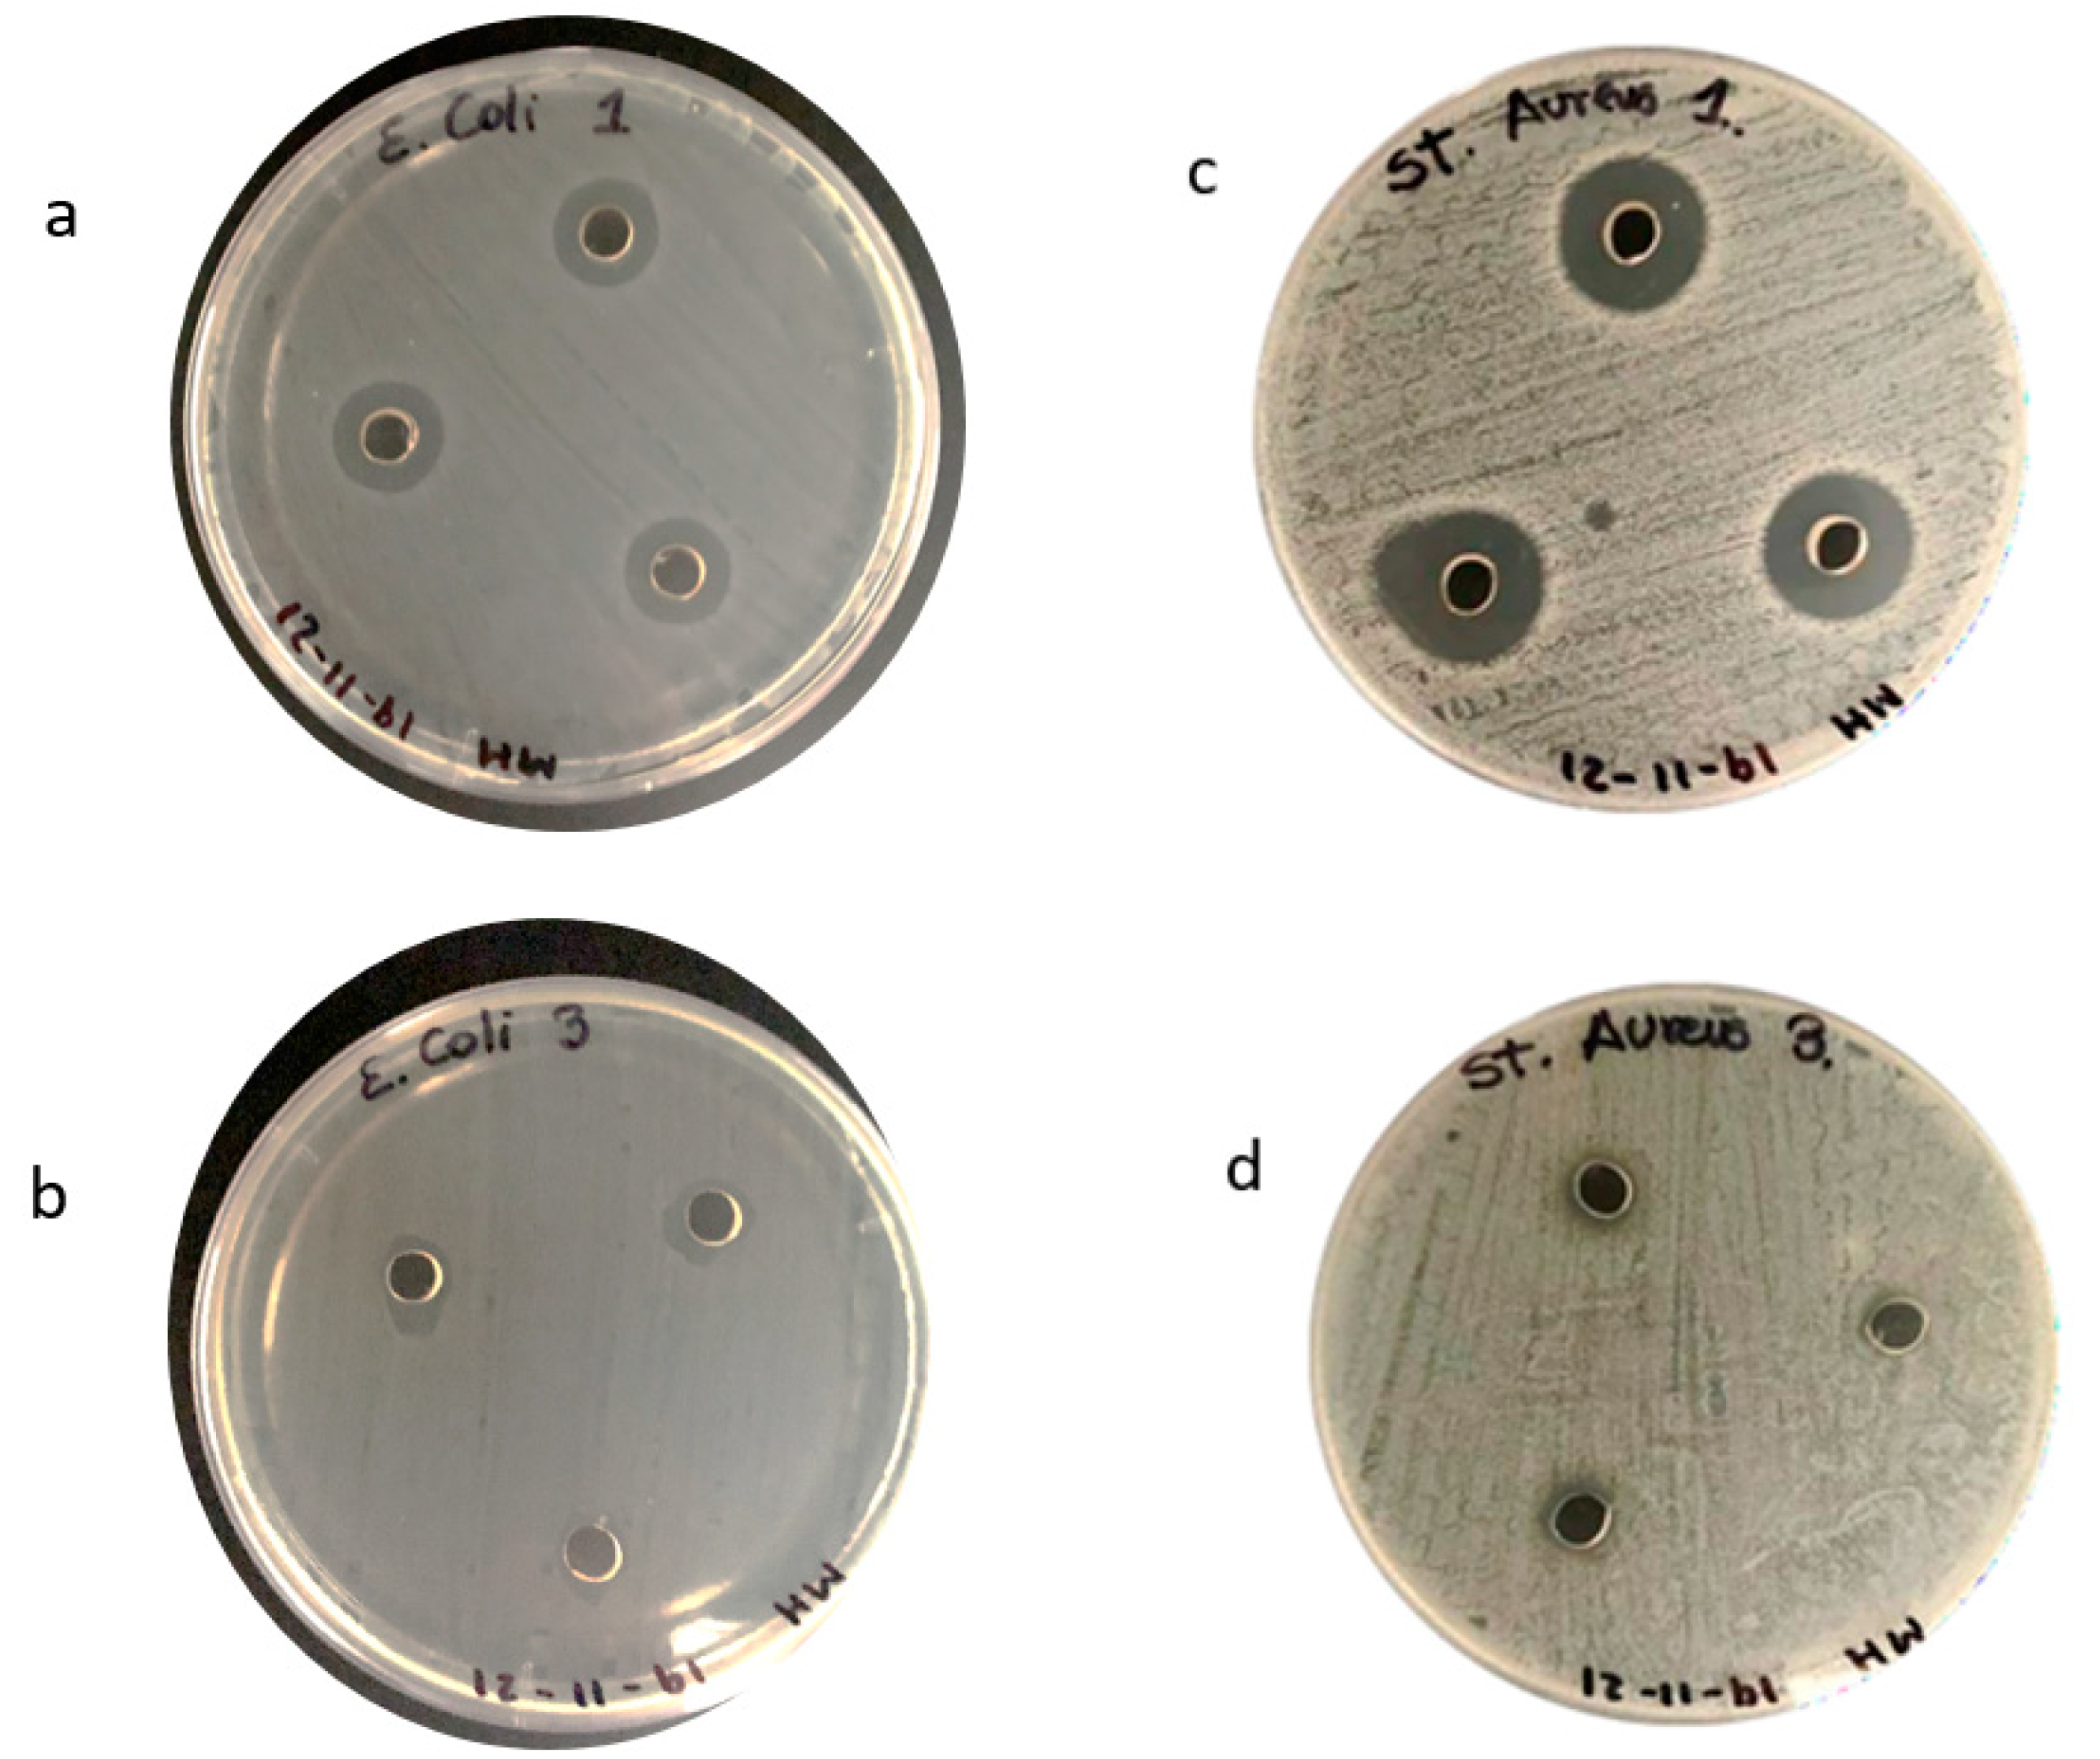
3.8. Antibacterial Activity

Figure 7 shows the results of the antimicrobial activity of the biosynthesized AgNPs. The synthesized AgNPs conjugated with the ethanolic fraction showed a higher antibacterial activity against Escherichia coli ATCC 33876 with respect to the ethanolic fraction (EF) alone, with inhibition halos of 5.33 and 3.66 mm, respectively. Similarly, the synthesized AgNPs conjugated with the ethanolic fraction presented a larger inhibition halo (6.33 mm) compared to the EF alone (1 mm) against Staphylococcus aureus ATCC 25923. The antimicrobial effects determined for nanoparticles can be partially explained due to the binding capacity of nanoparticles to the bacterial cell membrane, which may lead to an increase in membrane permeability [76]. It has also been reported that nanoparticles can alter the enzymatic activity of bacteria through interaction with sulfhydryl (SH) groups of bacterial enzymes [76].

4. Conclusions

The ethanolic fraction (EF) of Lepechinia meyenii (salvia) was found to contain rosmarinic acid, diosmin and Hesperetin-7-O-rutinoside. Silver nanoparticles (AgNPs) were synthesized using the ethanolic fraction, which was optimized using Plackett-Burman design and response surface methodology (RSM). The optimized conditions for the synthesis were a synthesis pH of 9.45, synthesis temperature of 49.8 °C, volume of ethanolic fraction volume of 152.6 µL and synthesis time of 213.2 min. The optimized silver nanoparticles presented a surface plasmon resonance (SPR) with an absorption maximum between 410 and 420 nm, presenting an average hydrodynamic size of 43.71 nm by DLS and 40–60 nm by STEM. The silver nanoparticles synthesized with the ethanolic fraction presented an enhanced antibacterial activity against Escherichia coli ATCC 33876 and Staphylococcus aureus ATCC 25923 compared to the ethanolic fraction alone.

Author Contributions

Conceptualization, L.A.L.-O., A.A.S.-C., G.P.-A., C.A.A.-C., J.C.D.-R. and C.V.-G.; methodology, L.A.L.-O., A.A.S.-C., C.A.A.-C., J.C.D.-R. and C.V.-G.; software, L.A.L.-O., A.A.S.-C., C.A.A.-C., J.C.D.-R. and C.V.-G.; validation, L.A.L.-O., A.A.S.-C., C.A.A.-C., J.C.D.-R. and C.V.-G.; formal analysis, L.A.L.-O., A.A.S.-C., C.A.A.-C., J.C.D.-R., C.V.-G., J.L.P.-T., A.A.-R., S.D.-A.-A., N.M.D. and J.A.Y.; investigation, L.A.L.-O., A.A.S.-C., C.A.A.-C. and C.V.-G.; resources, L.A.L.-O., A.A.S.-C., C.A.A.-C. and C.V.-G.; data curation, L.A.L.-O., A.A.S.-C., C.A.A.-C. and C.V.-G.; writing—original draft preparation, L.A.L.-O., A.A.S.-C., G.P.-A., C.A.A.-C., C.V.-G., J.L.P.-T., A.A.-R., S.D.-A.-A., N.M.D. and J.A.Y.; writing—review and editing, L.A.L.-O., A.A.S.-C., G.P.-A., C.A.A.-C., C.V.-G., J.L.P.-T., A.A.-R., S.D.-A.-A., N.M.D. and J.A.Y.; visualization, L.A.L.-O., A.A.S.-C., G.P.-A., C.A.A.-C., C.V.-G., J.L.P.-T., A.A.-R., S.D.-A.-A., N.M.D. and J.A.Y. All authors have read and agreed to the published version of the manuscript.

Funding

This research received funding from Prociencia, contract # 441-2019-FONDECYT.

Data Availability Statement

The data presented in this study are available on request from the corresponding author.

Conflicts of Interest

The authors declare no conflict of interest.

References

  1. Bermudez-Aguirre, D.; Yáñez, J.; Dunne, C.; Davies, N.; Barbosa-Cánovas, G. Study of strawberry flavored milk under pulsed electric field processing. Food Res. Int. 2010, 43, 2201–2207. [Google Scholar] [CrossRef]
  2. Yáñez, J.A.; Miranda, N.D.; Remsberg, C.M.; Ohgami, Y.; Davies, N.M. Stereospecific high-performance liquid chromatographic analysis of eriodictyol in urine. J. Pharm. Biomed. Anal. 2007, 43, 255–262. [Google Scholar] [CrossRef] [PubMed]
  3. Vega-Villa, K.R.; Remsberg, C.M.; Ohgami, Y.; Yanez, J.A.; Takemoto, J.K.; Andrews, P.K.; Davies, N.M. Stereospecific high-performance liquid chromatography of taxifolin, applications in pharmacokinetics, and determination in tu fu ling (Rhizoma smilacis glabrae) and apple (Malus × domestica). Biomed. Chromatogr. 2009, 23, 638–646. [Google Scholar] [CrossRef] [PubMed]
  4. Ramos-Escudero, F.; Santos-Buelga, C.; Pérez-Alonso, J.J.; Yáñez, J.A.; Dueñas, M. HPLC-DAD-ESI/MS identification of anthocyanins in Dioscorea trifida L. yam tubers (purple sachapapa). Eur. Food Res. Technol. 2010, 230, 745–752. [Google Scholar] [CrossRef]
  5. Roupe, K.A.; Helms, G.L.; Halls, S.C.; Yanez, J.A.; Davies, N.M. Preparative enzymatic synthesis and HPLC analysis of rhapontigenin: Applications to metabolism, pharmacokinetics and anti-cancer studies. J. Pharm. Pharm. Sci. 2005, 8, 374–386. [Google Scholar]
  6. Yáñez, J.A.; Remsberg, C.M.; Takemoto, J.K.; Vega-Villa, K.R.; Andrews, P.K.; Sayre, C.L.; Martinez, S.E.; Davies, N.M. Polyphenols and Flavonoids: An Overview. In Flavonoid Pharmacokinetics: Methods of Analysis, Preclinical and Clinical Pharmacokinetics, Safety, and Toxicology; Davies, N.M., Yáñez, J.A., Eds.; John Wiley & Sons: Hoboken, NJ, USA, 2012; pp. 1–69. [Google Scholar]
  7. Bonin, A.M.; Yáñez, J.A.; Fukuda, C.; Teng, X.W.; Dillon, C.T.; Hambley, T.W.; Lay, P.A.; Davies, N.M. Inhibition of experimental colorectal cancer and reduction in renal and gastrointestinal toxicities by copper-indomethacin in rats. Cancer Chemother. Pharmacol. 2010, 66, 755–764. [Google Scholar] [CrossRef]
  8. Yáñez, J.A.; Teng, X.W.; Roupe, K.A.; Davies, N.M. Stereospecific high-performance liquid chromatographic analysis of hesperetin in biological matrices. J. Pharm. Biomed. Anal. 2005, 37, 591–595. [Google Scholar] [CrossRef]
  9. Remsberg, C.M.; Yanez, J.A.; Roupe, K.A.; Davies, N.M. High-performance liquid chromatographic analysis of pterostilbene in biological fluids using fluorescence detection. J. Pharm. Biomed. Anal. 2007, 43, 250–254. [Google Scholar] [CrossRef]
  10. Xiong, M.P.; Yáñez, J.A.; Kwon, G.S.; Davies, N.M.; Forrest, M.L. A cremophor-free formulation for tanespimycin (17-AAG) using PEO-b-PDLLA micelles: Characterization and pharmacokinetics in rats. J. Pharm. Sci. 2009, 98, 1577–1586. [Google Scholar] [CrossRef]
  11. Yanez, J.A.; Davies, N.M. Stereospecific high-performance liquid chromatographic analysis of naringenin in urine. J. Pharm. Biomed. Anal. 2005, 39, 164–169. [Google Scholar] [CrossRef]
  12. Remsberg, C.M.; Yanez, J.A.; Ohgami, Y.; Vega-Villa, K.R.; Rimando, A.M.; Davies, N.M. Pharmacometrics of pterostilbene: Preclinical pharmacokinetics and metabolism, anticancer, antiinflammatory, antioxidant and analgesic activity. Phytother. Res. 2008, 22, 169–179. [Google Scholar] [CrossRef]
  13. Takemoto, J.K.; Remsberg, C.M.; Yanez, J.A.; Vega-Villa, K.R.; Davies, N.M. Stereospecific analysis of sakuranetin by high-performance liquid chromatography: Pharmacokinetic and botanical applications. J. Chromatogr. B Anal. Technol. Biomed. Life Sci. 2008, 875, 136–141. [Google Scholar] [CrossRef]
  14. Vega-Villa, K.R.; Yanez, J.A.; Remsberg, C.M.; Ohgami, Y.; Davies, N.M. Stereospecific high-performance liquid chromatographic validation of homoeriodictyol in serum and Yerba Santa (Eriodictyon glutinosum). J. Pharm. Biomed. Anal. 2008, 46, 971–974. [Google Scholar] [CrossRef] [PubMed]
  15. Alvarez-Risco, A.; Delgado-Zegarra, J.; Yáñez, J.A.; Diaz-Risco, S.; Del-Aguila-Arcentales, S. Predation Risk by Gastronomic Boom—Case Peru. J. Landsc. Ecol. 2018, 11, 100–103. [Google Scholar] [CrossRef]
  16. Vega-Villa, K.R.; Remsberg, C.M.; Takemoto, J.K.; Ohgami, Y.; Yanez, J.A.; Andrews, P.K.; Davies, N.M. Stereospecific pharmacokinetics of racemic homoeriodictyol, isosakuranetin, and taxifolin in rats and their disposition in fruit. Chirality 2011, 23, 339–348. [Google Scholar] [CrossRef] [PubMed]
  17. Mejia-Meza, E.I.; Yáñez, J.A.; Davies, N.M.; Clary, C.D. Dried Raspberries: Phytochemicals and Health Effects. In Dried Fruits; John Wiley & Sons, Inc.: Hoboken, NJ, USA, 2013; pp. 161–174. [Google Scholar]
  18. Delgado-Zegarra, J.; Alvarez-Risco, A.; Cárdenas, C.; Donoso, M.; Moscoso, S.; Rojas Román, B.; Del-Aguila-Arcentales, S.; Davies, N.M.; Yáñez, J.A. Labeling of Genetically Modified (GM) Foods in Peru: Current Dogma and Insights of the Regulatory and Legal Statutes. Int. J. Food Sci. 2022, 2022, 3489785. [Google Scholar] [CrossRef]
  19. Vera-Nuñez, L.D.C.; Cornejo-Ruiz, J.O.; Arenas-Chávez, C.A.; de Hollanda, L.M.; Alvarez-Risco, A.; Del-Aguila-Arcentales, S.; Davies, N.M.; Yáñez, J.A.; Vera-Gonzales, C. Green Synthesis of a Novel Silver Nanoparticle Conjugated with Thelypteris glandulosolanosa (Raqui-Raqui). Preliminary Characterization and Anticancer Activity. Processes 2022, 10, 1308. [Google Scholar] [CrossRef]
  20. Quispe-Quispe, L.G.; Limpe-Ramos, P.; Arenas Chávez, C.A.; Gomez, M.M.; Mejia, C.R.; Alvarez-Risco, A.; Del-Aguila-Arcentales, S.; Yáñez, J.A.; Vera-Gonzales, C. Physical and mechanical characterization of a functionalized cotton fabric with nanocomposite based on silver nanoparticles and carboxymethyl chitosan using green chemistry. Processes 2022, 10, 1207. [Google Scholar] [CrossRef]
  21. Arenas-Chávez, C.A.; Hollanda, L.M.; Arce-Esquivel, A.A.; Alvarez-Risco, A.; Del-Aguila-Arcentales, S.; Yáñez, J.A.; Vera-Gonzales, C. Antibacterial and Antifungal Activity of Functionalized Cotton Fabric with Nanocomposite Based on Silver Nanoparticles and Carboxymethyl Chitosan. Processes 2022, 10, 1088. [Google Scholar] [CrossRef]
  22. Delgado-Zegarra, J.; Alvarez-Risco, A.; Yáñez, J.A. Indiscriminate use of pesticides and lack of sanitary control in the domestic market in Peru/Uso indiscriminado de pesticidas e falta de controle sanitário do mercado interno no Peru. Rev. Panam. Salud Publica 2018, 42, e3. [Google Scholar] [CrossRef]
  23. Yáñez, J.A.; Sayre, C.L.; Martinez, S.E.; Davies, N.M. Chiral Methods of Flavonoid Analysis. In Flavonoid Pharmacokinetics: Methods of Analysis, Preclinical and Clinical Pharmacokinetics, Safety, and Toxicology; Davies, N.M., Yáñez, J.A., Eds.; John Wiley & Sons: Hoboken, NJ, USA, 2012; pp. 117–159. [Google Scholar]
  24. Yáñez, J.A.; Sayre, C.L.; Davies, N.M. Preclinical Pharmacokinetics of Flavonoids. In Flavonoid Pharmacokinetics: Methods of Analysis, Preclinical and Clinical Pharmacokinetics, Safety, and Toxicology; Davies, N.M., Yáñez, J.A., Eds.; John Wiley & Sons: Hoboken, NJ, USA, 2012; pp. 161–193. [Google Scholar]
  25. Yáñez, J.A.; Chemuturi, N.V.; Womble, S.W.; Sayre, C.L.; Davies, N.M. Flavonoids and Drug Interactions. In Flavonoid Pharmacokinetics: Methods of Analysis, Preclinical and Clinical Pharmacokinetics, Safety, and Toxicology; Davies, N.M., Yáñez, J.A., Eds.; John Wiley & Sons: Hoboken, NJ, USA, 2012; pp. 281–319. [Google Scholar]
  26. Sayre, C.L.; Gerde, K.D.; Yáñez, J.A.; Davies, N.M. Clinical Pharmacokinetics of Flavonoids. In Flavonoid Pharmacokinetics: Methods of Analysis, Preclinical and Clinical Pharmacokinetics, Safety, and Toxicology; Davies, N.M., Yáñez, J.A., Eds.; John Wiley & Sons: Hoboken, NJ, USA, 2012; pp. 195–247. [Google Scholar]
  27. Serve, K.M.; Yáñez, J.A.; Remsberg, C.M.; Davies, N.M.; Black, M.E. Development and validation of a rapid and sensitive HPLC method for the quantification of 5-fluorocytosine and its metabolites. Biomed. Chromatogr. 2010, 24, 556–561. [Google Scholar] [CrossRef] [PubMed]
  28. Yanez, J.A.; Brocks, D.R.; Forrest, M.L.; Davies, N.M. Pharmacokinetic Behaviors of Orally Administered Drugs. In Oral Bioavailability: Basic Principles, Advan.nced Concepts, and Applications; Hu, M., Li, X., Eds.; John Wiley & Sons, Inc.: Hoboken, NJ, USA, 2011; pp. 183–220. [Google Scholar]
  29. Chemuturi, N.; Yanez, J.A. The role of xenobiotic transporters in ophthalmic drug delivery. J. Pharm. Pharm. Sci. 2013, 16, 683–707. [Google Scholar] [CrossRef] [PubMed]
  30. Guntur, S.R.; Kumar, N.S.; Hegde, M.M.; Dirisala, V.R. In Vitro Studies of the Antimicrobial and Free-Radical Scavenging Potentials of Silver Nanoparticles Biosynthesized From the Extract of Desmostachya bipinnata. Anal. Chem. Insights 2018, 13, 1177390118782877. [Google Scholar] [CrossRef] [PubMed]
  31. Mohammadzadeh, V.; Barani, M.; Amiri, M.S.; Yazdi, M.E.T.; Hassanisaadi, M.; Rahdar, A.; Varma, R.S. Applications of plant-based nanoparticles in nanomedicine: A review. Sustain. Chem. Pharm. 2022, 25, 100606. [Google Scholar] [CrossRef]
  32. Sargazi, S.; Laraib, U.; Er, S.; Rahdar, A.; Hassanisaadi, M.; Zafar, M.N.; Díez-Pascual, A.M.; Bilal, M. Application of Green Gold Nanoparticles in Cancer Therapy and Diagnosis. Nanomaterials 2022, 12, 1102. [Google Scholar] [CrossRef]
  33. Hashemi, S.F.; Tasharrofi, N.; Saber, M.M. Green synthesis of silver nanoparticles using Teucrium polium leaf extract and assessment of their antitumor effects against MNK45 human gastric cancer cell line. J. Mol. Struct. 2020, 1208, 127889. [Google Scholar] [CrossRef]
  34. Pannerselvam, B.; Durai, P.; Thiyagarajan, D.; Song, H.J.; Kim, K.J.; Jung, Y.S.; Kim, H.J.; Rangarajulu, S.K. Facile Synthesis of Silver Nanoparticles Using Asian Spider Flower and Its In Vitro Cytotoxic Activity against Human Breast Carcinoma Cells. Processes 2020, 8, 430. [Google Scholar] [CrossRef]
  35. Hashim, N.; Paramasivam, M.; Tan, J.S.; Kernain, D.; Hussin, M.H.; Brosse, N.; Gambier, F.; Raja, P.B. Green mode synthesis of silver nanoparticles using Vitis vinifera’s tannin and screening its antimicrobial activity/apoptotic potential versus cancer cells. Mater. Today Commun. 2020, 25, 101511. [Google Scholar] [CrossRef]
  36. Pagani, M.; Bavbek, S.; Alvarez-Cuesta, E.; Berna Dursun, A.; Bonadonna, P.; Castells, M.; Cernadas, J.; Chiriac, A.; Sahar, H.; Madrigal-Burgaleta, R.; et al. Hypersensitivity reactions to chemotherapy: An EAACI Position Paper. Allergy 2022, 77, 388–403. [Google Scholar] [CrossRef]
  37. Yanez, J.A.; Forrest, M.L.; Ohgami, Y.; Kwon, G.S.; Davies, N.M. Pharmacometrics and delivery of novel nanoformulated PEG-b-poly(ε-caprolactone) micelles of rapamycin. Cancer Chemother. Pharmacol. 2008, 61, 133–144. [Google Scholar] [CrossRef]
  38. Yanez, J.A.; Teng, X.W.; Roupe, K.A.; Davies, N.M. Alternative Methods for Assessing Experimental Colitis In Vivo and Ex Vivo. J. Med. Sci. 2006, 6, 356–365. [Google Scholar] [CrossRef] [Green Version]
  39. Jahangirian, H.; Kalantari, K.; Izadiyan, Z.; Rafiee-Moghaddam, R.; Shameli, K.; Webster, T.J. A review of small molecules and drug delivery applications using gold and iron nanoparticles. Int. J. Nanomed. 2019, 14, 1633–1657. [Google Scholar] [CrossRef] [PubMed]
  40. Mangal, S.; Gao, W.; Li, T.; Zhou, Q. Pulmonary delivery of nanoparticle chemotherapy for the treatment of lung cancers: Challenges and opportunities. Acta Pharmacol. Sin. 2017, 38, 782–797. [Google Scholar] [CrossRef] [PubMed]
  41. Wauthoz, N.; Rosière, R.; Amighi, K. Inhaled cytotoxic chemotherapy: Clinical challenges, recent developments, and future prospects. Expert Opin. Drug Deliv. 2021, 18, 333–354. [Google Scholar] [CrossRef] [PubMed]
  42. Alrushaid, S.; Davies, N.M.; Anderson, J.E.; Le, T.; Yáñez, J.A.; Maayah, Z.H.; El-Kadi, A.O.S.; Rachid, O.; Sayre, C.L.; Löbenberg, R.; et al. Pharmaceutical characterization of myonovin, a novel skeletal muscle regenerator: In silico, in vitro and in vivo studies. J. Pharm. Pharm. Sci. 2018, 21, 1s–18s. [Google Scholar] [CrossRef]
  43. Alrushaid, S.; Sayre, C.L.; Yáñez, J.A.; Forrest, M.L.; Senadheera, S.N.; Burczynski, F.J.; Löbenberg, R.; Davies, N.M. Pharmacokinetic and Toxicodynamic Characterization of a Novel Doxorubicin Derivative. Pharmaceutics 2017, 9, 35. [Google Scholar] [CrossRef]
  44. Xiong, M.P.; Yanez, J.A.; Remsberg, C.M.; Ohgami, Y.; Kwon, G.S.; Davies, N.M.; Forrest, M.L. Formulation of a geldanamycin prodrug in mPEG-b-PCL micelles greatly enhances tolerability and pharmacokinetics in rats. J. Control. Release 2008, 129, 33–40. [Google Scholar] [CrossRef]
  45. DeMario, M.D.; Ratain, M.J. Oral chemotherapy: Rationale and future directions. J. Clin. Oncol. 1998, 16, 2557–2567. [Google Scholar] [CrossRef]
  46. Freyer, G.; Ligneau, B.; Tranchand, B.; Ardiet, C.; Serre-Debeauvais, F.; Trillet-Lenoir, V. Pharmacokinetic studies in cancer chemotherapy: Usefulness in clinical practice. Cancer Treat. Rev. 1997, 23, 153–169. [Google Scholar] [CrossRef]
  47. Kashkouli, S.; Jamzad, M.; Nouri, A. Total Phenolic and Flavonoids Contents, Radical Scavenging Activity and Green Synthesis of Silver Nanoparticles by Laurus nobilis L. Leaves Aqueous Extract. J. Med. Plants By-Prod. 2018, 7, 25–32. [Google Scholar] [CrossRef]
  48. Zea Álvarez, J.L.; Talavera Núñez, M.E.; Arenas Chávez, C.; Pacheco Salazar, D.; Osorio Anaya, A.M.; Vera Gonzales, C. Obtención y caracterización del nanocomposito: Nanopartículas de plata y carboximetilquitosano (NPsAg-CMQ). Rev. Soc. Química Perú 2019, 85, 14–24. [Google Scholar] [CrossRef] [Green Version]
  49. Kryuchkov, M.; Adamcik, J.; Katanaev, V.L. Bactericidal and Antiviral Bionic Metalized Nanocoatings. Nanomaterials 2022, 12, 1868. [Google Scholar] [CrossRef] [PubMed]
  50. Saha, N.; Trivedi, P.; Dutta Gupta, S. Surface Plasmon Resonance (SPR) Based Optimization of Biosynthesis of Silver Nanoparticles from Rhizome Extract of Curculigo orchioides Gaertn. and Its Antioxidant Potential. J. Clust. Sci. 2016, 27, 1893–1912. [Google Scholar] [CrossRef]
  51. Kennedy, M.; Krouse, D. Strategies for improving fermentation medium performance: A review. J. Ind. Microbiol. Biotechnol. 1999, 23, 456–475. [Google Scholar] [CrossRef]
  52. Zhou, J.; Yu, X.; Ding, C.; Wang, Z.; Zhou, Q.; Pao, H.; Cai, W. Optimization of phenol degradation by Candida tropicalis Z-04 using Plackett-Burman design and response surface methodology. J. Environ. Sci. 2011, 23, 22–30. [Google Scholar] [CrossRef]
  53. Abdel-Fattah, Y.R.; Saeed, H.M.; Gohar, Y.M.; El-Baz, M.A. Improved production of Pseudomonas aeruginosa uricase by optimization of process parameters through statistical experimental designs. Process Biochem. 2005, 40, 1707–1714. [Google Scholar] [CrossRef]
  54. Agarry, S.; Solomon, B.; Layokun, S. Optimization of process variables for the microbial degradation of phenol by Pseudomonas aeruginosa using response surface methodology. Afr. J. Biotechnol. 2008, 7, 2409–2416. [Google Scholar]
  55. Francis, F.; Sabu, A.; Nampoothiri, K.M.; Ramachandran, S.; Ghosh, S.; Szakacs, G.; Pandey, A. Use of response surface methodology for optimizing process parameters for the production of α-amylase by Aspergillus oryzae. Biochem. Eng. J. 2003, 15, 107–115. [Google Scholar] [CrossRef]
  56. Imandi, S.B.; Bandaru, V.V.; Somalanka, S.R.; Bandaru, S.R.; Garapati, H.R. Application of statistical experimental designs for the optimization of medium constituents for the production of citric acid from pineapple waste. Bioresour. Technol. 2008, 99, 4445–4450. [Google Scholar] [CrossRef]
  57. Liu, B.; Li, X.; Zheng, C.; Wang, X.; Sun, R. Facile and green synthesis of silver nanoparticles in quaternized carboxymethyl chitosan solution. Nanotechnology 2013, 24, 235601. [Google Scholar] [CrossRef]
  58. Tripathi, D.; Modi, A.; Narayan, G.; Rai, S.P. Green and cost effective synthesis of silver nanoparticles from endangered medicinal plant Withania coagulans and their potential biomedical properties. Mater. Sci. Eng. C 2019, 100, 152–164. [Google Scholar] [CrossRef] [PubMed]
  59. Balandin, G.V.; Suvorov, O.A.; Shaburova, L.N.; Podkopaev, D.O.; Frolova, Y.V.; Ermolaeva, G.A. The study of the antimicrobial activity of colloidal solutions of silver nanoparticles prepared using food stabilizers. J. Food Sci. Technol. 2015, 52, 3881–3886. [Google Scholar] [CrossRef] [PubMed] [Green Version]
  60. Oliveira Gde, A.; de Oliveira, A.E.; da Conceição, E.C.; Leles, M.I. Multiresponse optimization of an extraction procedure of carnosol and rosmarinic and carnosic acids from rosemary. Food Chem. 2016, 211, 465–473. [Google Scholar] [CrossRef] [PubMed]
  61. Serrano, C.A.; Villena, G.K.; Rodríguez, E.F. Phytochemical profile and rosmarinic acid purification from two Peruvian Lepechinia Willd. species (Salviinae, Mentheae, Lamiaceae). Sci. Rep. 2021, 11, 7260. [Google Scholar] [CrossRef]
  62. Zuo, G.; Je, K.-H.; Guillen Quispe, Y.N.; Shin, K.-O.; Kim, H.Y.; Kim, K.H.; Arce, P.H.G.; Lim, S.S. Separation and Identification of Antioxidants and Aldose Reductase Inhibitors in Lepechinia meyenii (Walp.) Epling. Plants 2021, 10, 2773. [Google Scholar] [CrossRef]
  63. Crespo, M.I.; Chabán, M.F.; Lanza, P.A.; Joray, M.B.; Palacios, S.M.; Vera, D.M.A.; Carpinella, M.C. Inhibitory effects of compounds isolated from Lepechinia meyenii on tyrosinase. Food Chem. Toxicol. 2019, 125, 383–391. [Google Scholar] [CrossRef]
  64. Melkamu, W.W.; Bitew, L.T. Green synthesis of silver nanoparticles using Hagenia abyssinica (Bruce) J.F. Gmel plant leaf extract and their antibacterial and anti-oxidant activities. Heliyon 2021, 7, E08459. [Google Scholar] [CrossRef]
  65. Kredy, H.M. The effect of pH, temperature on the green synthesis and biochemical activities of silver nanoparticles from Lawsonia inermis extract. J. Pharm. Sci. Res. 2018, 10, 2022–2026. [Google Scholar]
  66. Ahmad, A.; Mukherjee, P.; Senapati, S.; Mandal, D.; Khan, M.I.; Kumar, R.; Sastry, M. Extracellular biosynthesis of silver nanoparticles using the fungus Fusarium oxysporum. Colloids Surf. B Biointerfaces 2003, 28, 313–318. [Google Scholar] [CrossRef]
  67. Sahayaraj, K.; Balasubramanyam, G.; Chavali, M. Green synthesis of silver nanoparticles using dry leaf aqueous extract of Pongamia glabra Vent (Fab.), Characterization and phytofungicidal activity. Environ. Nanotechnol. Monit. Manag. 2020, 14, 100349. [Google Scholar] [CrossRef]
  68. Khan, M.N.; Khan, T.A.; Khan, Z.; Al-Thabaiti, S.A. Green synthesis of biogenic silver nanomaterials using Raphanus sativus extract, effects of stabilizers on the morphology, and their antimicrobial activities. Bioprocess Biosyst. Eng. 2015, 38, 2397–2416. [Google Scholar] [CrossRef] [PubMed]
  69. Chokshi, K.; Pancha, I.; Ghosh, T.; Paliwal, C.; Maurya, R.; Ghosh, A.; Mishra, S. Green synthesis, characterization and antioxidant potential of silver nanoparticles biosynthesized from de-oiled biomass of thermotolerant oleaginous microalgae Acutodesmus dimorphus. RSC Adv. 2016, 6, 72269–72274. [Google Scholar] [CrossRef]
  70. Naik, B.R.; Gowreeswari, G.S.; Singh, Y.; Satyavathi, R.; Daravath, S.; Reddy, P.R. Bio-synthesis of silver nanoparticles from leaf extract of Pongamia pinnata as an effective larvicide on dengue vector Aedes albopictus (Skuse) (Diptera: Culicidae). Adv. Entomol. 2014, 2014, 45433. [Google Scholar]
  71. Rajeshkumar, S. Green synthesis of different sized antimicrobial silver nanoparticles using different parts of plants—A review. Int. J. ChemTech Res. 2016, 19, 197–208. [Google Scholar]
  72. El-Naggar, N.E.-A.; Hussein, M.H.; El-Sawah, A.A. Bio-fabrication of silver nanoparticles by phycocyanin, characterization, in vitro anticancer activity against breast cancer cell line and in vivo cytotxicity. Sci. Rep. 2017, 7, 10844. [Google Scholar] [CrossRef] [PubMed] [Green Version]
  73. Devamani, R.H.P.; Alagar, M. Synthesis and characterisation of copper II hydroxide nano particles. Nano Biomed. Eng. 2013, 5, 116–120. [Google Scholar] [CrossRef]
  74. Jyoti, K.; Baunthiyal, M.; Singh, A. Characterization of silver nanoparticles synthesized using Urtica dioica Linn. leaves and their synergistic effects with antibiotics. J. Radiat. Res. Appl. Sci. 2016, 9, 217–227. [Google Scholar] [CrossRef]
  75. Awad, T.S.; Moharram, H.A.; Shaltout, O.E.; Asker, D.; Youssef, M.M. Applications of ultrasound in analysis, processing and quality control of food: A review. Food Res. Int. 2012, 48, 410–427. [Google Scholar] [CrossRef]
  76. Nikaeen, G.; Yousefinejad, S.; Rahmdel, S.; Samari, F.; Mahdavinia, S. Central Composite Design for Optimizing the Biosynthesis of Silver Nanoparticles using Plantago major Extract and Investigating Antibacterial, Antifungal and Antioxidant Activity. Sci. Rep. 2020, 10, 9642. [Google Scholar] [CrossRef]
  77. Xu, Q.; Xie, L.; Diao, H.; Li, F.; Zhang, Y.; Fu, F.; Liu, X. Antibacterial cotton fabric with enhanced durability prepared using silver nanoparticles and carboxymethyl chitosan. Carbohydr. Polym. 2017, 177, 187–193. [Google Scholar] [CrossRef]
  78. Zhang, G.; Liu, Y.; Gao, X.; Chen, Y. Synthesis of silver nanoparticles and antibacterial property of silk fabrics treated by silver nanoparticles. Nanoscale Res. Lett. 2014, 9, 216. [Google Scholar] [CrossRef] [PubMed]
  79. Ahani, M.; Khatibzadeh, M. Optimisation of significant parameters through response surface methodology in the synthesis of silver nanoparticles by chemical reduction method. Micro Nano Lett. 2017, 12, 705–710. [Google Scholar] [CrossRef]
  80. Ibrahim, S.; Ahmad, Z.; Manzoor, M.Z.; Mujahid, M.; Faheem, Z.; Adnan, A. Optimization for biogenic microbial synthesis of silver nanoparticles through response surface methodology, characterization, their antimicrobial, antioxidant, and catalytic potential. Sci. Rep. 2021, 11, 770. [Google Scholar] [CrossRef]
  81. Chinnasamy, G.; Chandrasekharan, S.; Bhatnagar, S. Biosynthesis of Silver Nanoparticles from Melia azedarach: Enhancement of Antibacterial, Wound Healing, Antidiabetic and Antioxidant Activities. Int. J. Nanomed. 2019, 14, 9823–9836. [Google Scholar] [CrossRef] [PubMed]
  82. Dinarvand, M.; Rezaee, M.; Foroughi, M. Optimizing culture conditions for production of intra and extracellular inulinase and invertase from Aspergillus niger ATCC 20611 by response surface methodology (RSM). Braz. J. Microbiol. 2017, 48, 427–441. [Google Scholar] [CrossRef]
  83. Jabeen, H.; Iqbal, S.; Anwar, S.; Parales, R.E. Optimization of profenofos degradation by a novel bacterial consortium PBAC using response surface methodology. Int. Biodeterior. Biodegrad. 2015, 100, 89–97. [Google Scholar] [CrossRef]
  84. Box, G.E.; Draper, N.R. Empirical Model-Building and Response Surfaces; John Wiley & Sons: Hoboken, NJ, USA, 1987. [Google Scholar]
Figure 1. Chromatograms of the ethanolic extract (a) and ethanolic fraction (b) of Lepechinia meyenii (salvia).
Processes 10 01727 g001
Figure 2. UV-visible spectra of the AgNPs showing the absorbance at different time intervals.
Processes 10 01727 g002
Figure 3. FT-IR spectra of the (a) ethanolic fraction (EF) and the (b) synthesized AgNPs conjugated with the ethanolic fraction of Lepechinia meyenii (salvia).
Processes 10 01727 g003
Figure 4. Hydrodynamic size distribution of the synthesized AgNPs conjugated with the ethanolic fraction of Lepechinia meyenii (salvia).
Processes 10 01727 g004
Figure 5. STEM photomicrograph of the synthesized AgNPs conjugated with the ethanolic fraction of Lepechinia meyenii (salvia).
Processes 10 01727 g005
Figure 6. Three-dimensional response surface plots for synthesis temperature on absorbance of the synthesized AgNPs conjugated with the ethanolic fraction of Lepechinia meyenii (salvia), showing variable interactions: (a) synthesis pH, (b) ethanolic fraction and (c) synthesis time.
Processes 10 01727 g006aProcesses 10 01727 g006b
Figure 7. Antibacterial activity against Escherichia coli ATCC 33876 of AgNPs conjugated with the ethanolic fraction (EF) of Lepechinia meyenii (salvia) (a) and EF of Lepechinia meyenii (salvia) (b), and against Staphylococcus aureus ATCC 25923 of AgNPs conjugated with the ethanolic fraction (EF) of Lepechinia meyenii (salvia) (c) and EF of Lepechinia meyenii (salvia) (d).
Processes 10 01727 g007
Table 1. Levels of the variables tested in the Plackett-Burman design for AgNPs biosynthesis.
#VariablesSymbolUnitExperimental Value
Low (−1)High (+1)
1Stirring speedX1RPM300900
2Synthesis pHX2 810
3Synthesis timeX3min140330
4Synthesis temperatureX4°C4555
5Ethanolic fraction (EF) volumeX5µL50200
6DummyF1 00
7DummyF2 00
Table 2. Levels of the variables tested in the central composite design (CCD) for AgNPs biosynthesis.
#VariablesSymbolUnitCoded Level
−10+1
1Stirring speedX1RPM400500600
2Synthesis pHX2 99.510
3Synthesis timeX3min180210240
4Synthesis temperatureX4°C4849.551
5Ethanolic fraction (EF) volumeX5µL120150180
Table 3. Effects of the variables and statistical analysis of the Plackett-Burman design for AgNPs biosynthesis.
EffectCoefficientStandard ErrorF-Valuep-Value
Prob > F
Intercept 0.37920.0076
Stirring speed (X1)−0.4264−0.22400.00766277.40.0003 a
Synthesis pH (X2)0.60130.31240.0076124850.0002 a
Synthesis time (X3)−0.0232−0.01160.007618.620.0927
Synthesis
temperature (X4)
0.07460.05060.0076192.170.0102 a
Ethanolic fraction volume (X5)0.46890.24600.00767591.80.0003 a
Predicted R2 = 0.9998; adjusted R2 = 0.9995; a 5% significance level.
Table 4. ANOVA for response surface quadratic model for AgNPs biosynthesis.
Mean SquareF-Valuep-Value
Prob > F
Model0.0799711.780.163
Stirring speed (X1)0.0026650.060.812
Synthesis pH (X2)0.0392770.880.370
Synthesis time (X3)0.0394230.880.369
Synthesis temperature (X4)0.0684271.530.243
Ethanolic fraction volume (X5)0.2217414.940.048 a
X120.0181720.400.538
X220.0740381.650.225
X320.0866561.930.192
X420.2807976.260.029 a
X520.0606001.350.270
X1X20.0328610.730.410
X1X30.0277970.620.448
X1X40.0059640.130.722
X1X50.0230810.510.488
X2X30.0007550.020.899
X2X40.60306913.440.004 a
X2X50.0052160.120.740
X4X30.0515401.150.307
X4X50.0004590.010.921
X5X30.0584071.300.278
Lack of fit0.0505581.330.386
Adjusted R2 = 0.9723; a 5% significance level.
Publisher’s Note: MDPI stays neutral with regard to jurisdictional claims in published maps and institutional affiliations.

