
Synthesis, Characterization, and Antibacterial Efficacy of Borosilicate Compound against Escherichia coli
 , , , , ,
Abstract
:1. Introduction
2. Material and Methods
2.1. Synthesis of Borosilicate (BSAS and BSC) Compounds
2.2. Materials Characterization
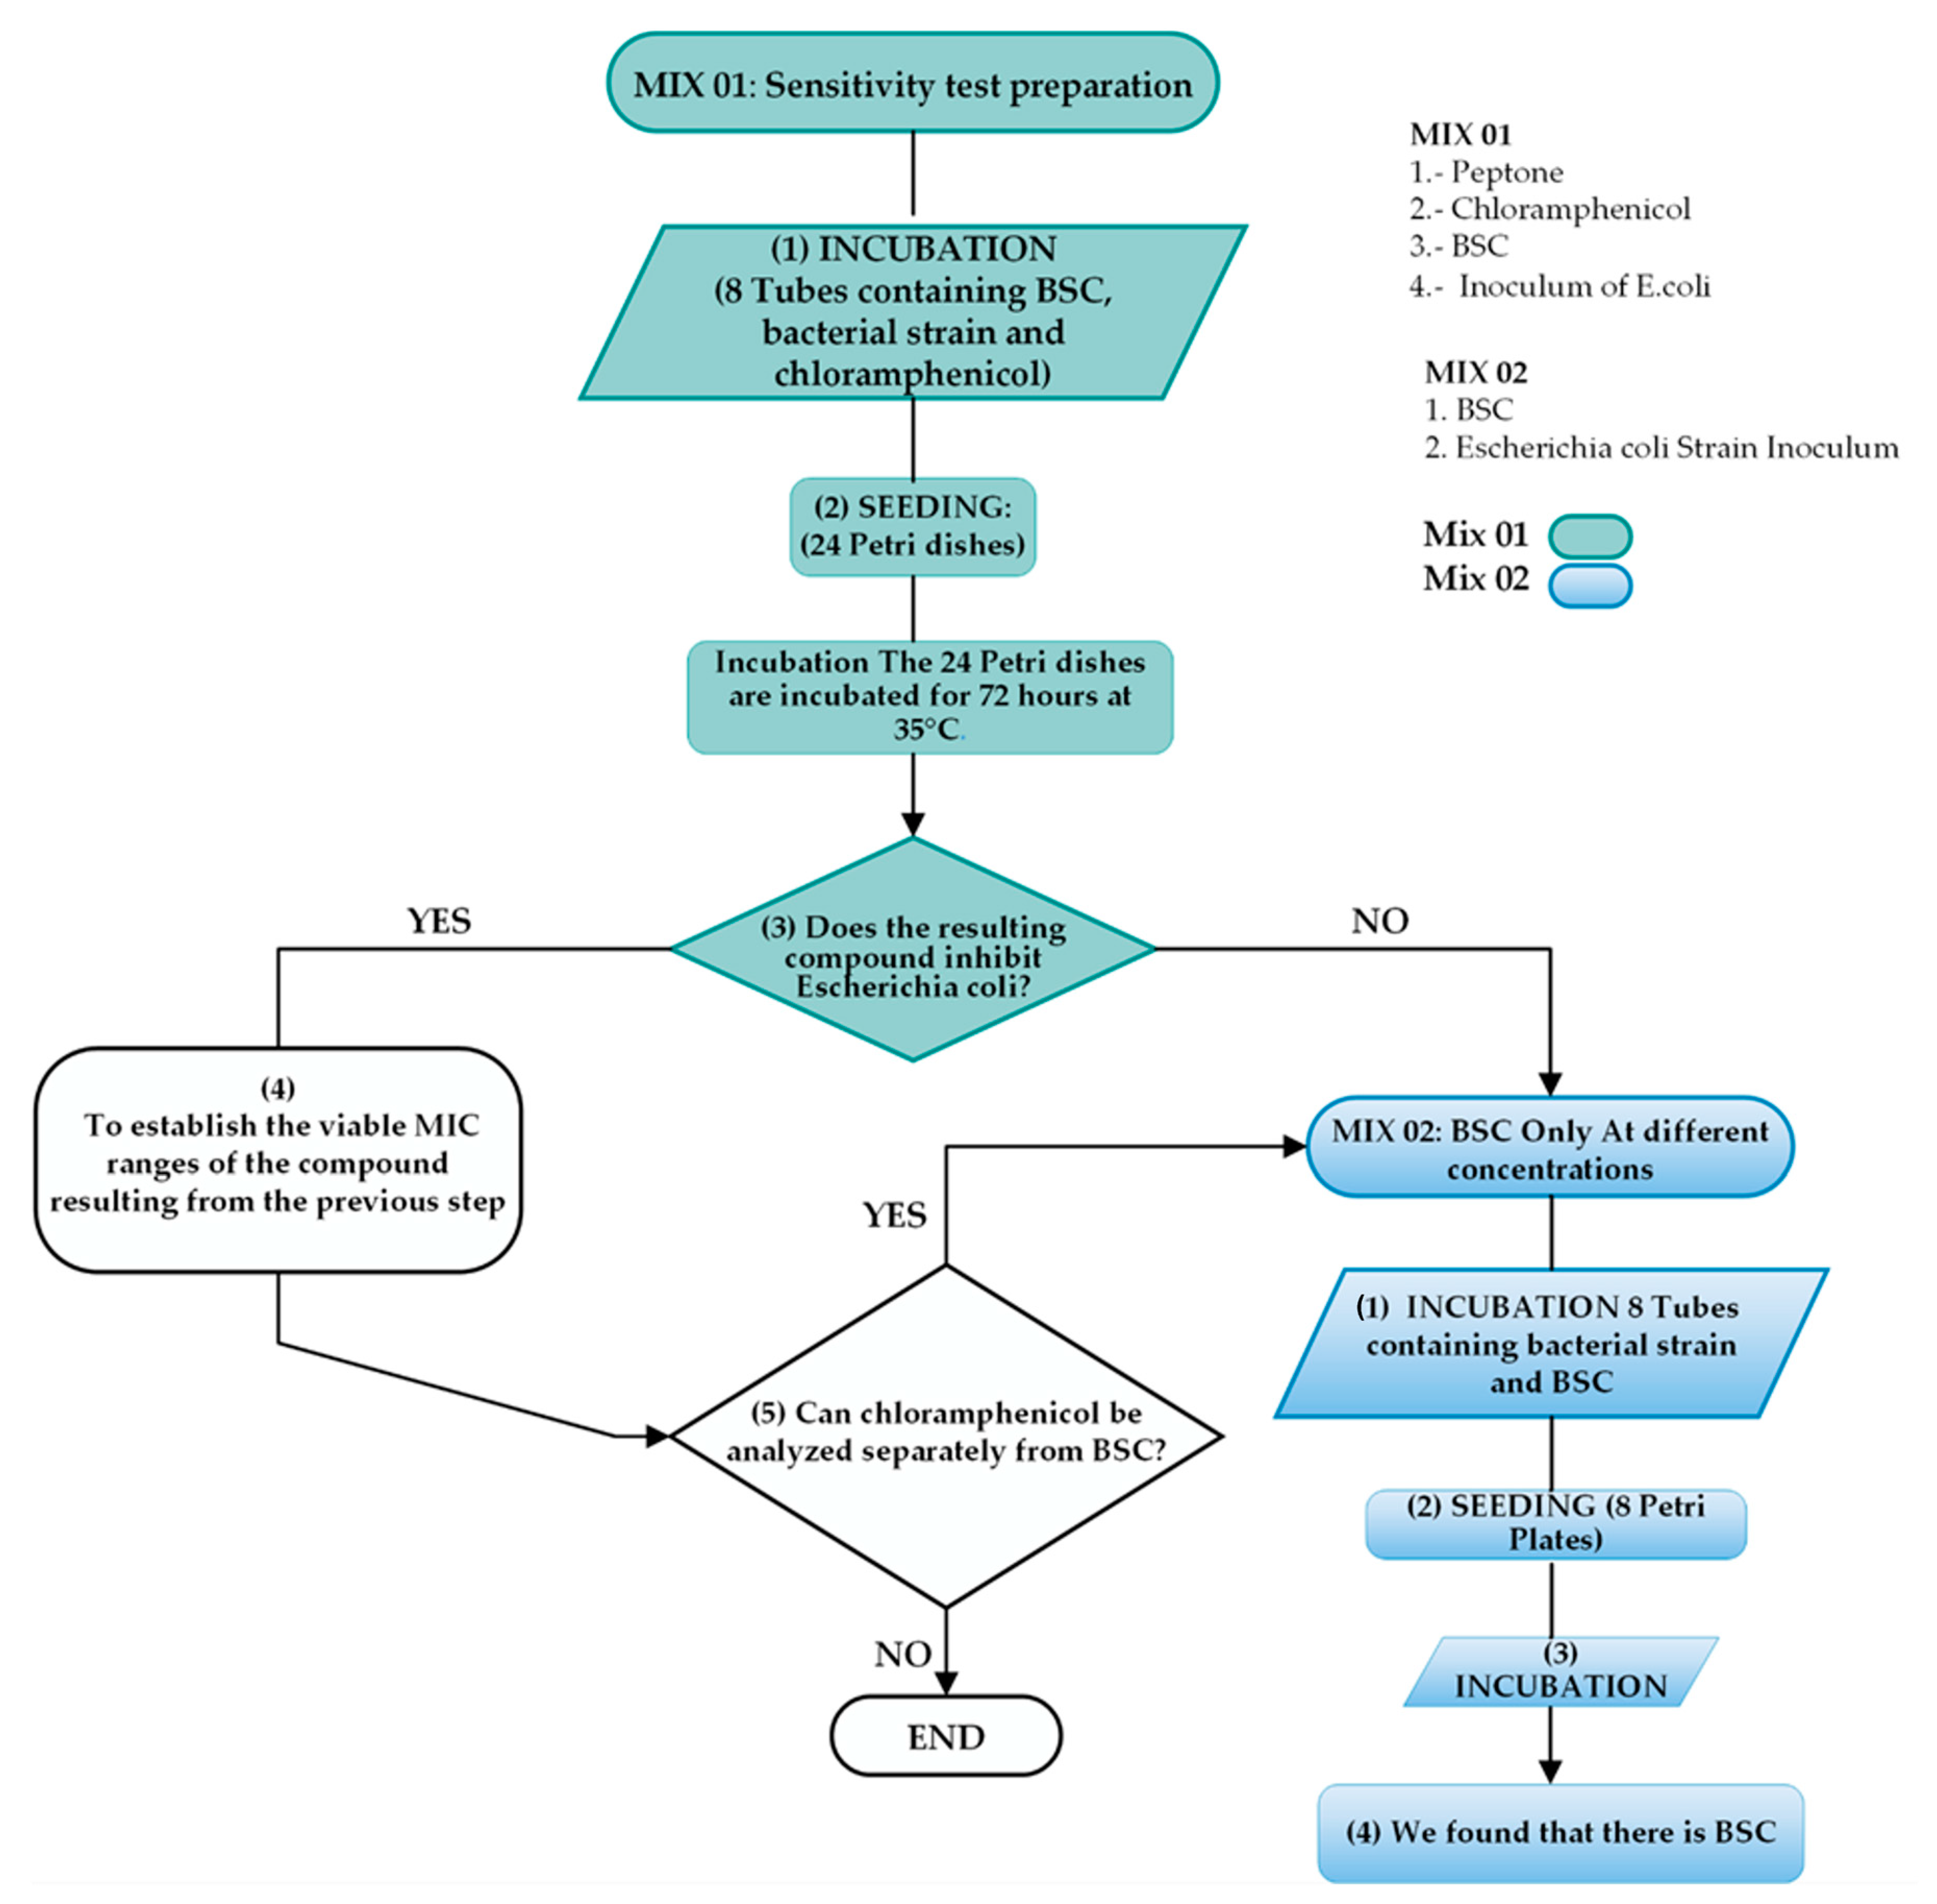
2.3. Antibacterial Experimental Procedure
2.3.1. Stage 1
2.3.2. Stage 2
2.3.3. Stage 3
3. Results
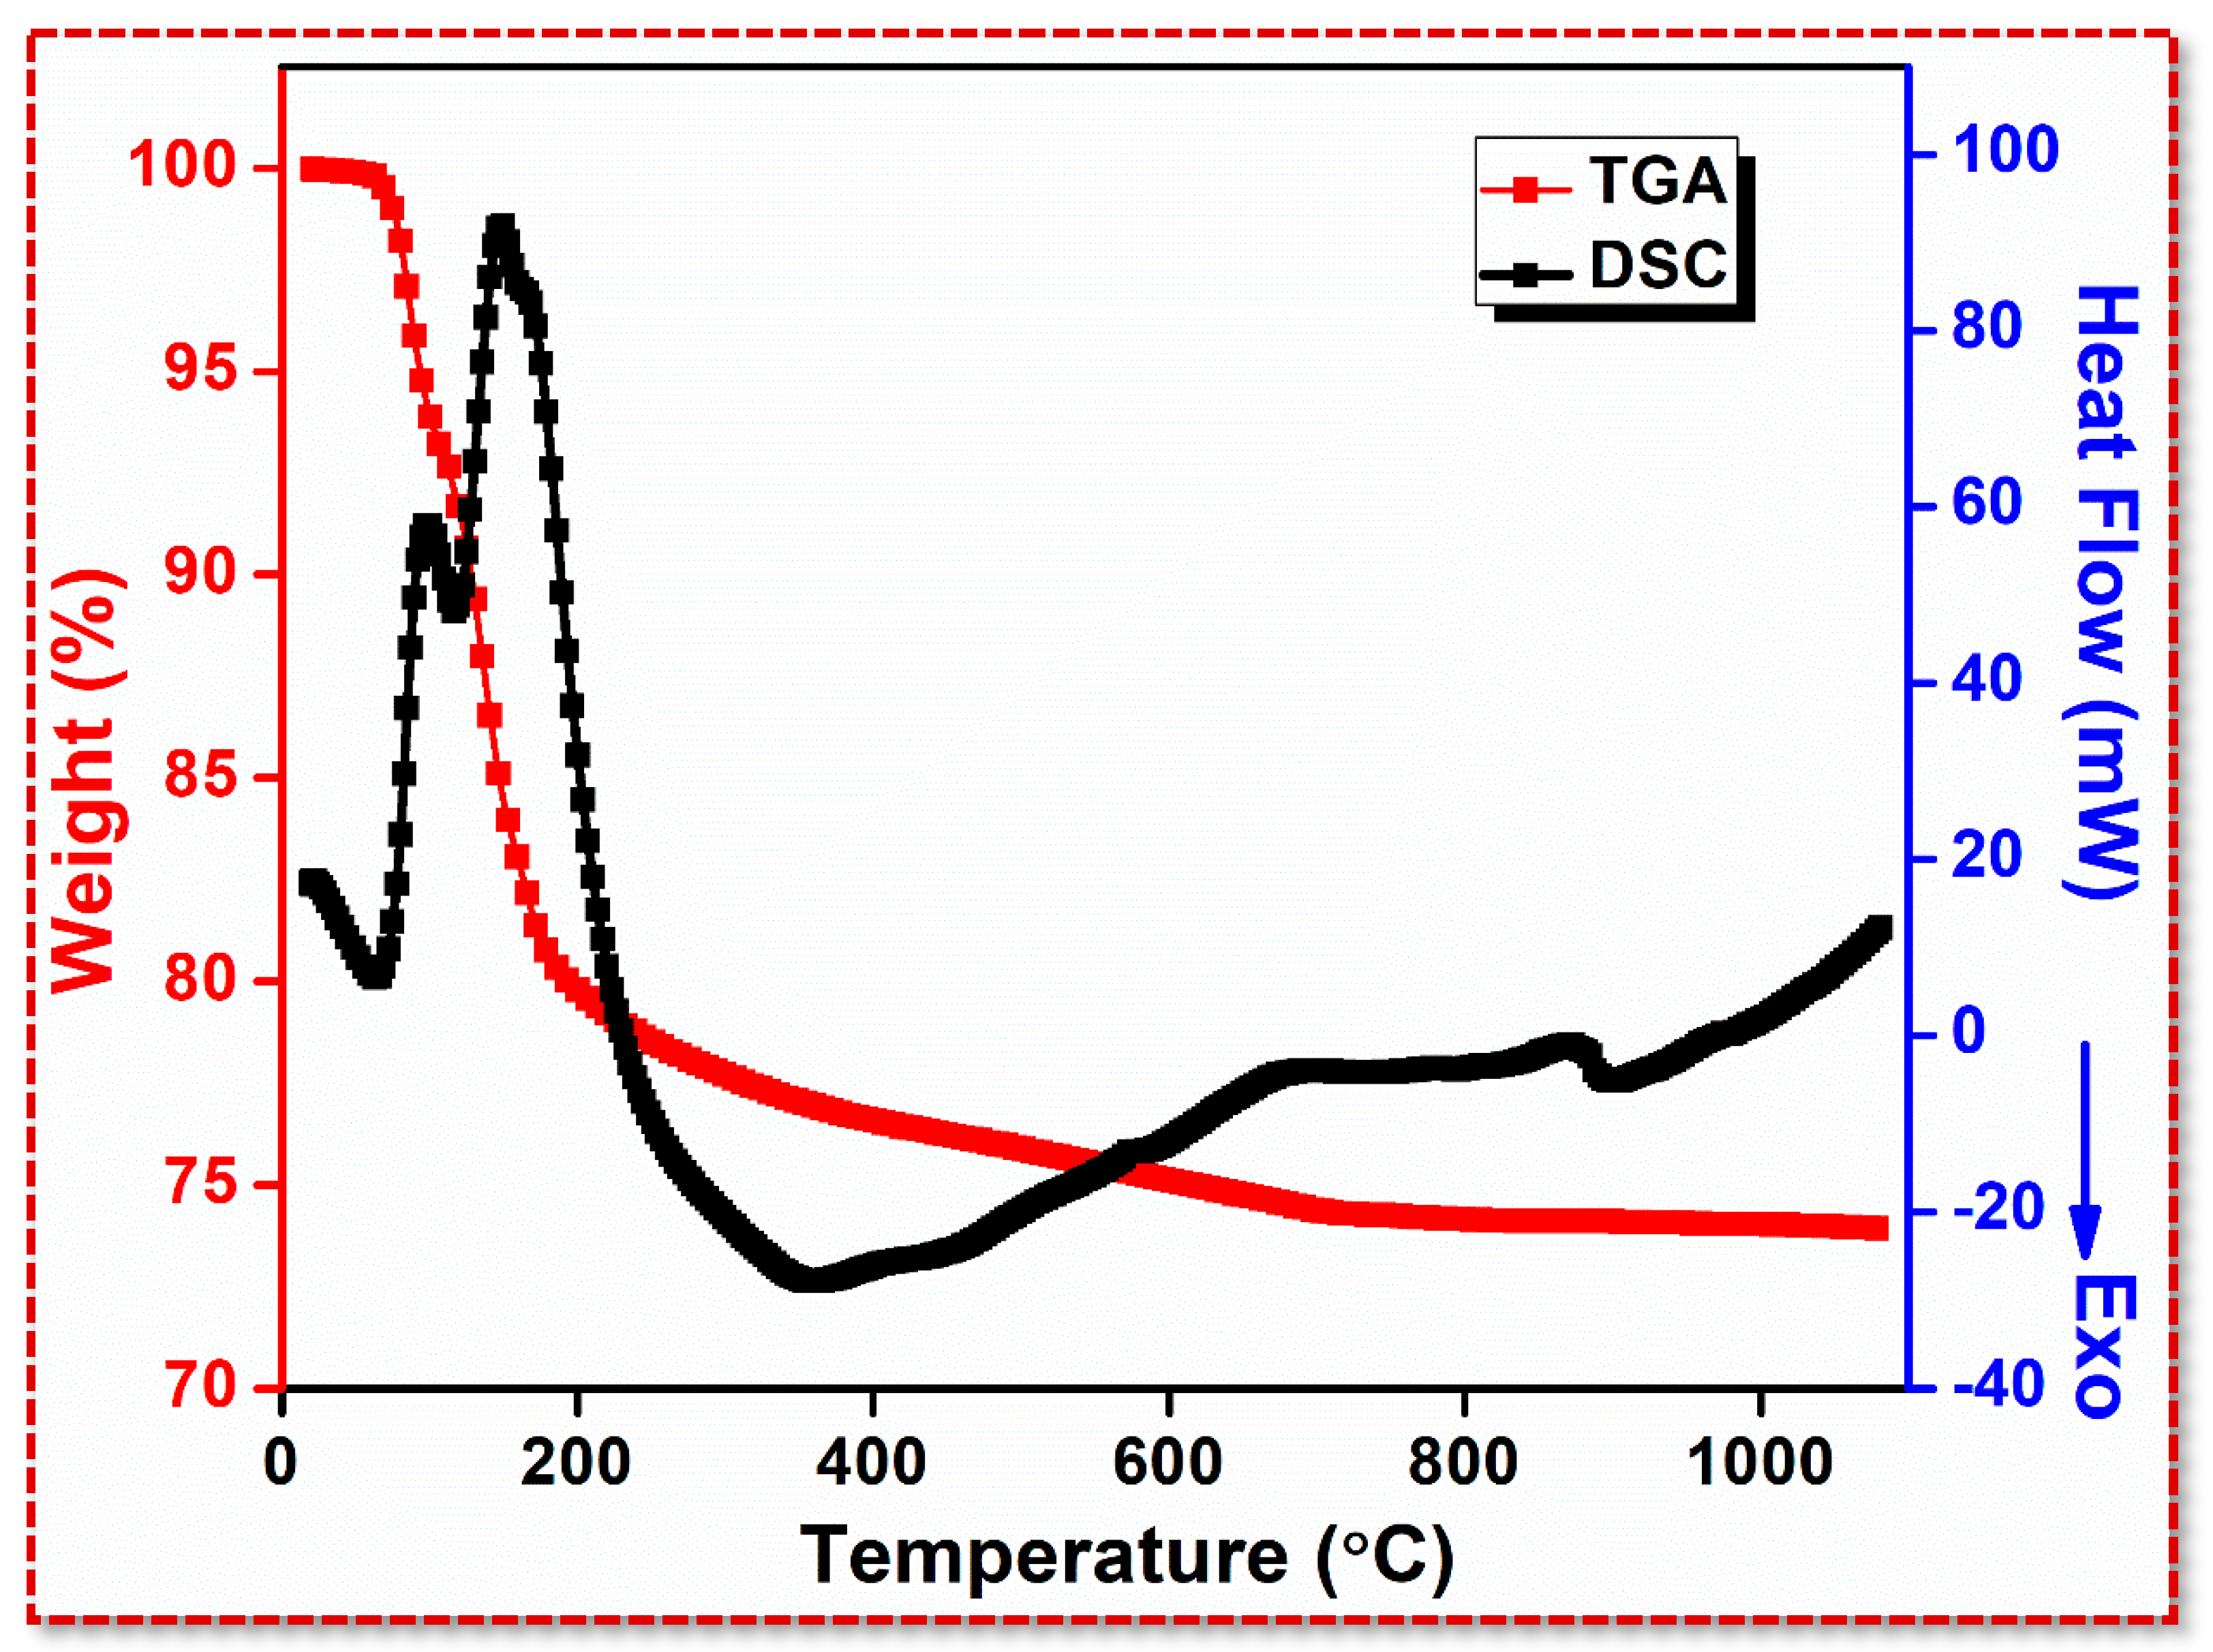
3.1. Thermal Analysis
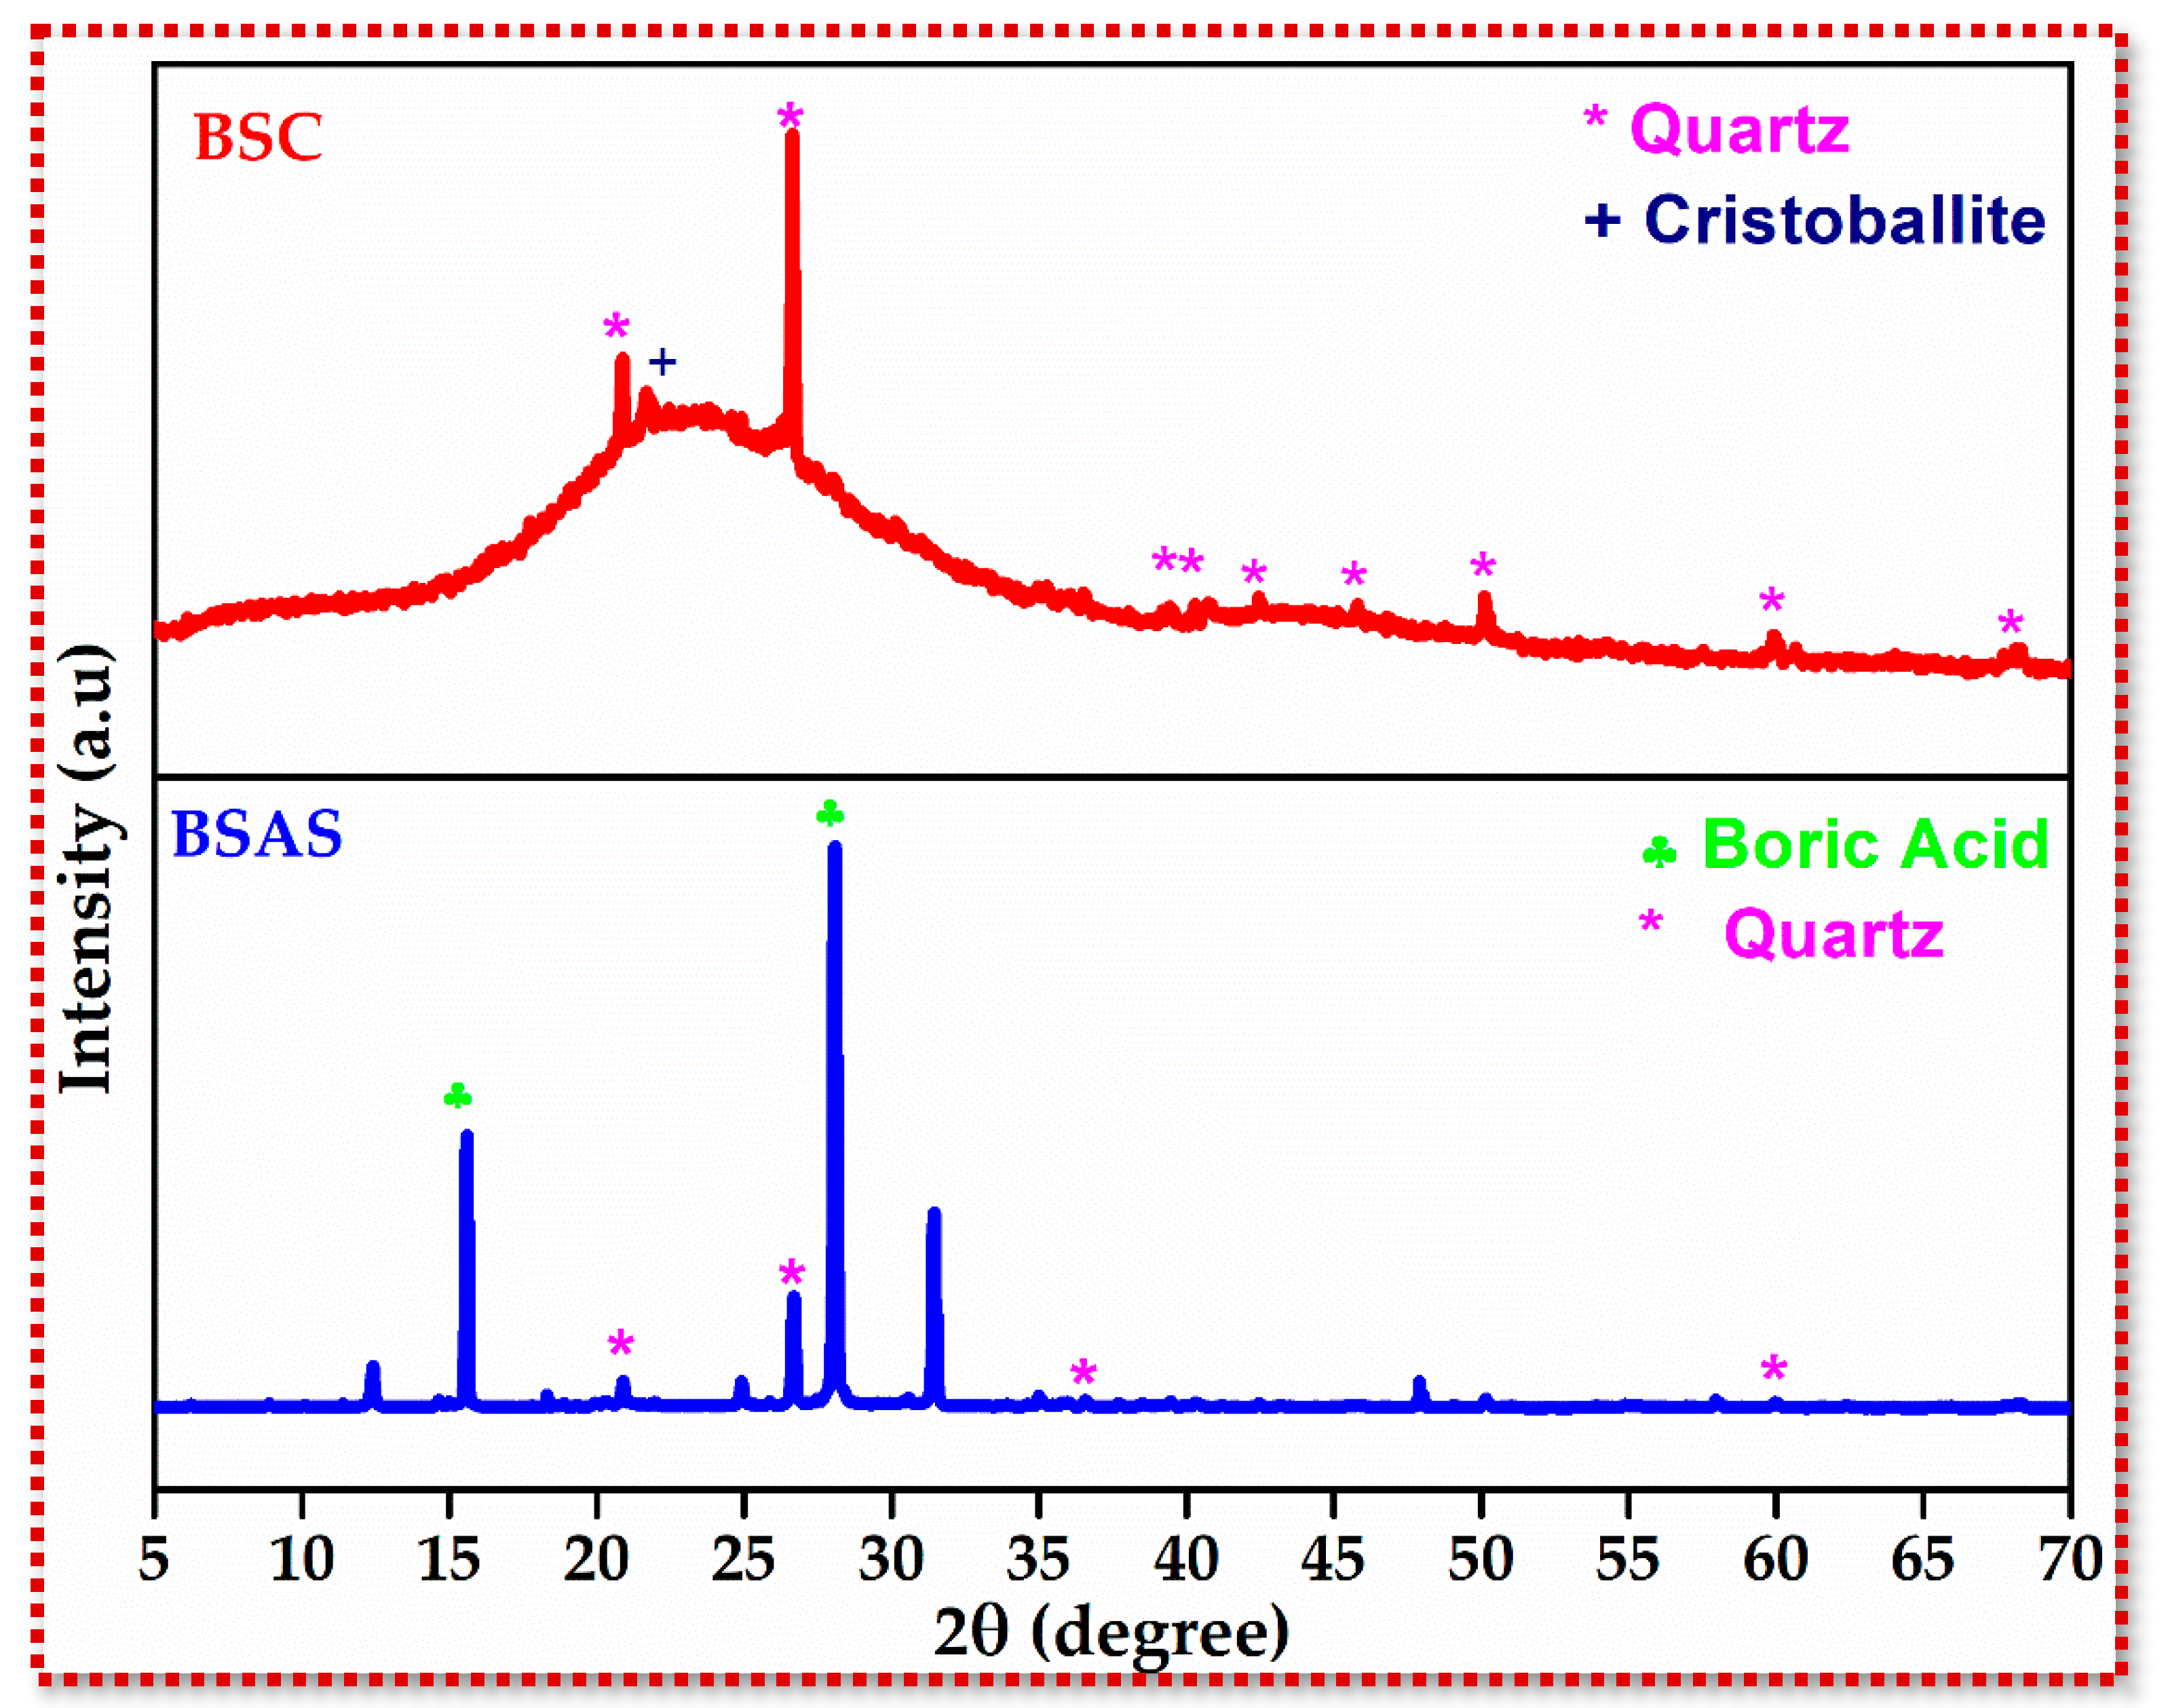
3.2. Phase and Structural Analysis
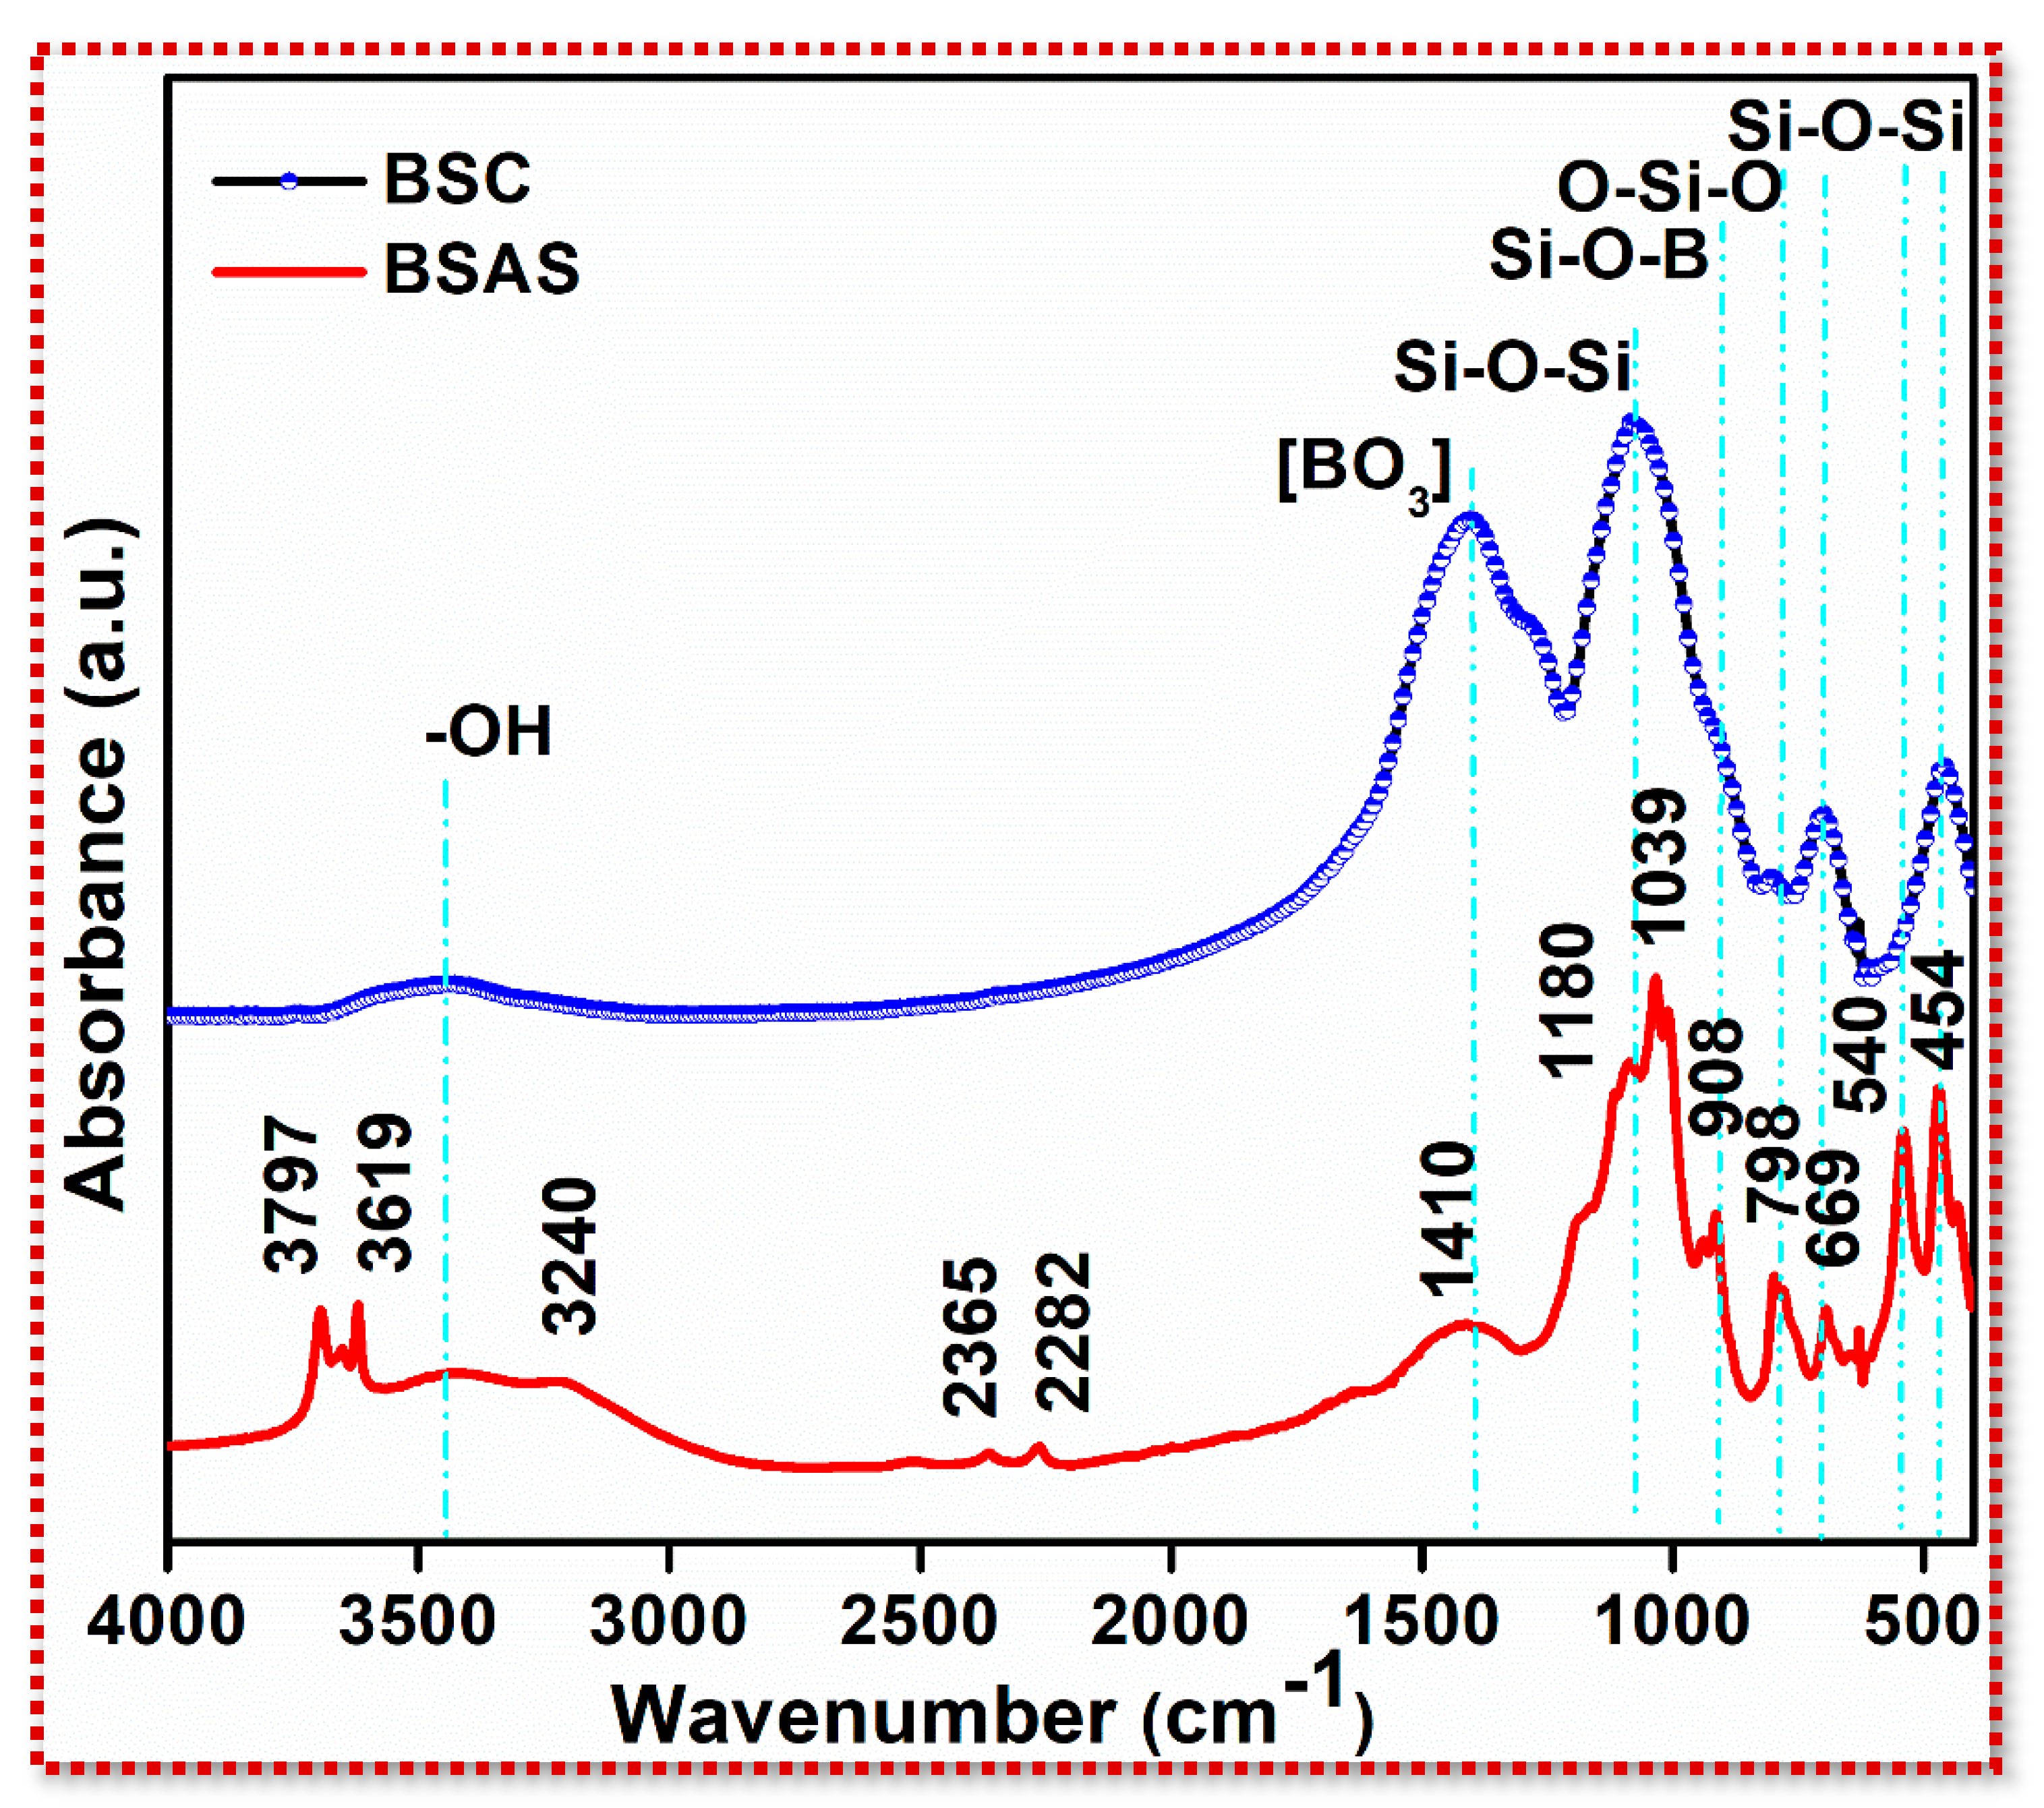
3.3. Functional Group Analysis Using FTIR
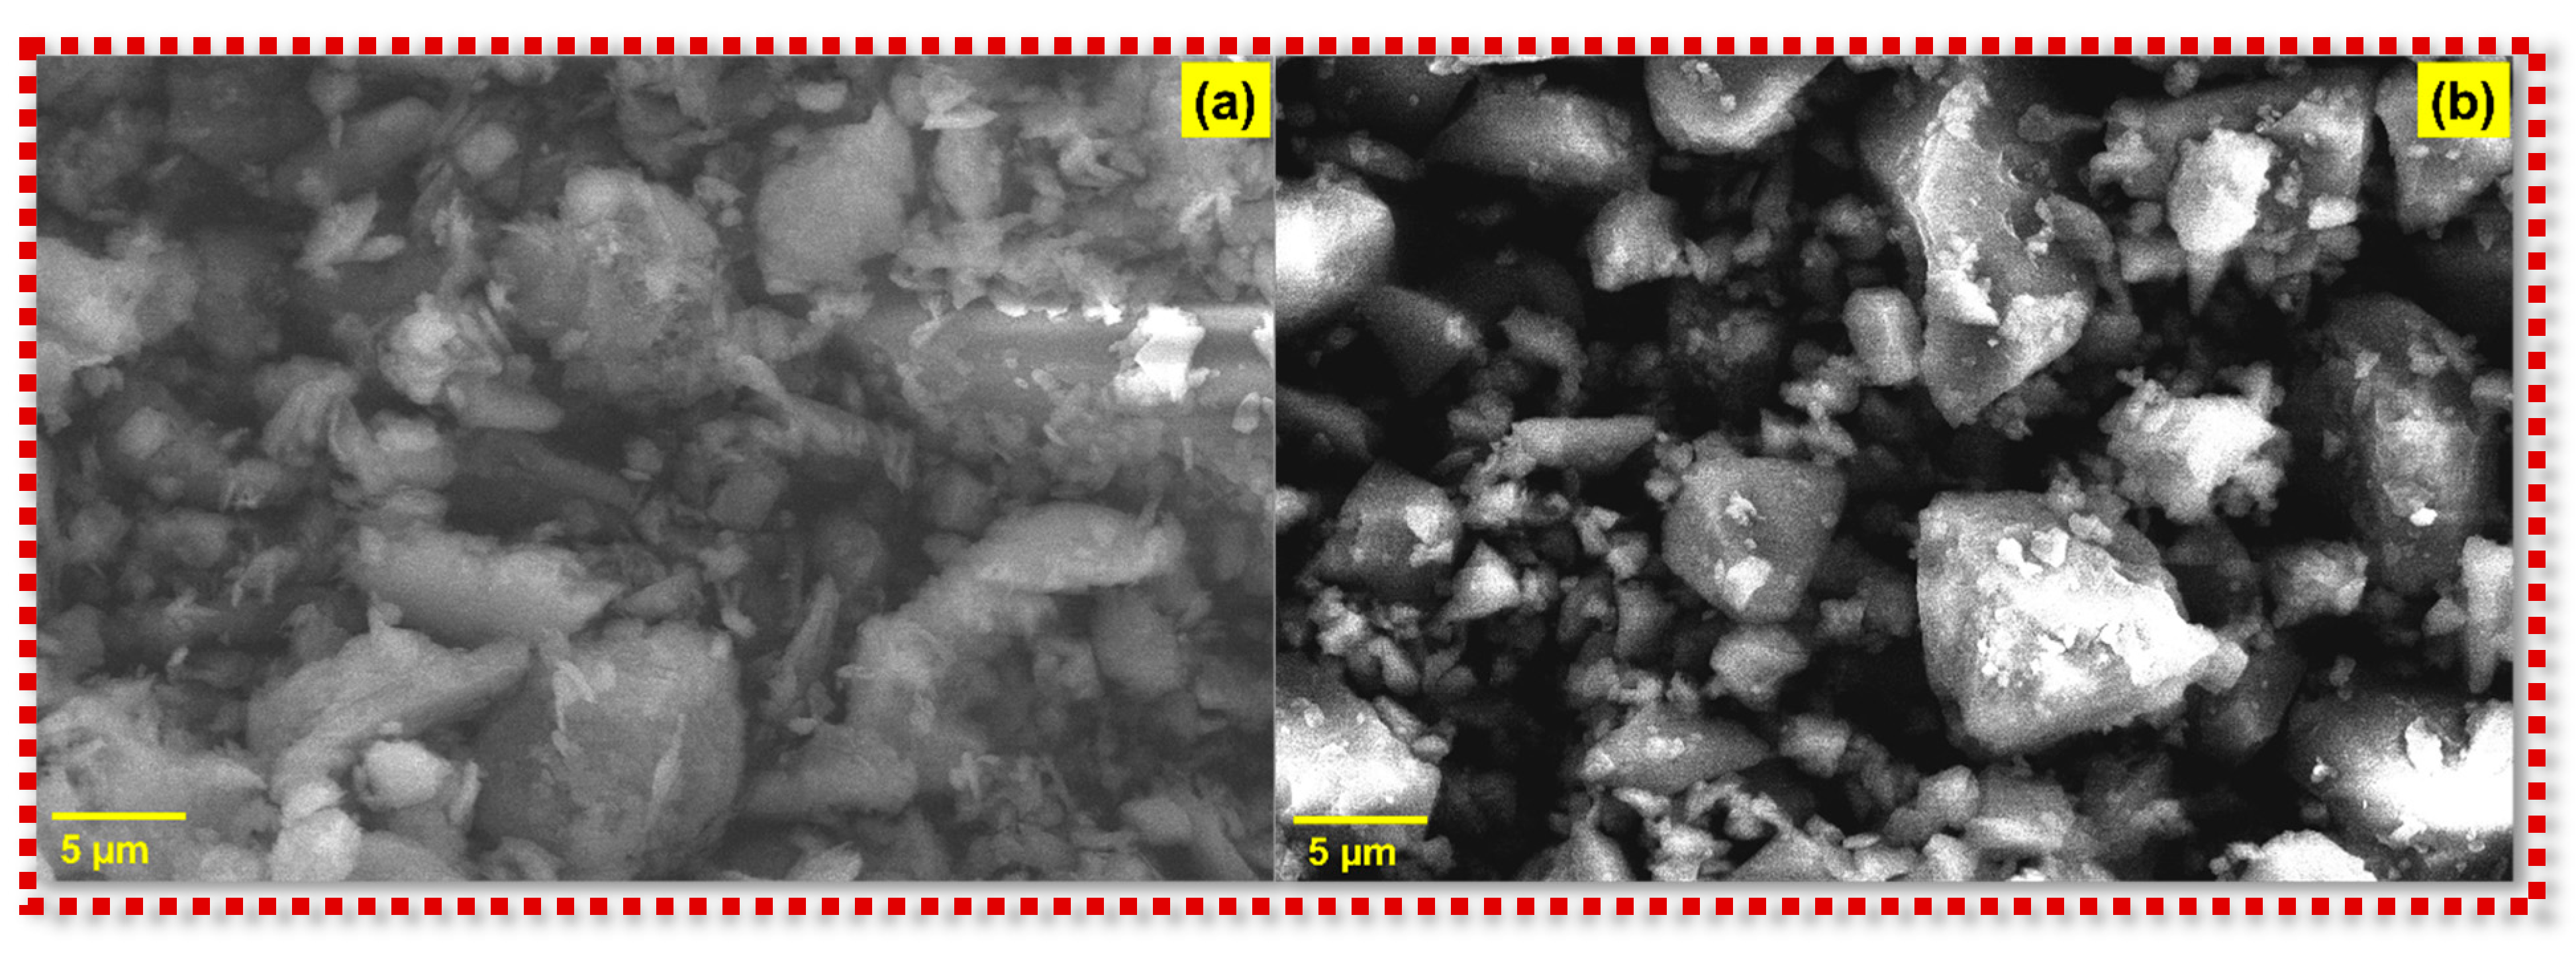
3.4. Morphological Analysis
3.5. Antibacterial Activity
3.6. Statistical Analysis
3.6.1. Validation of the Method Determining Bacteriostatic Effect of the First Stage of Research Using Chloramphenicol and BSC at the Same Time
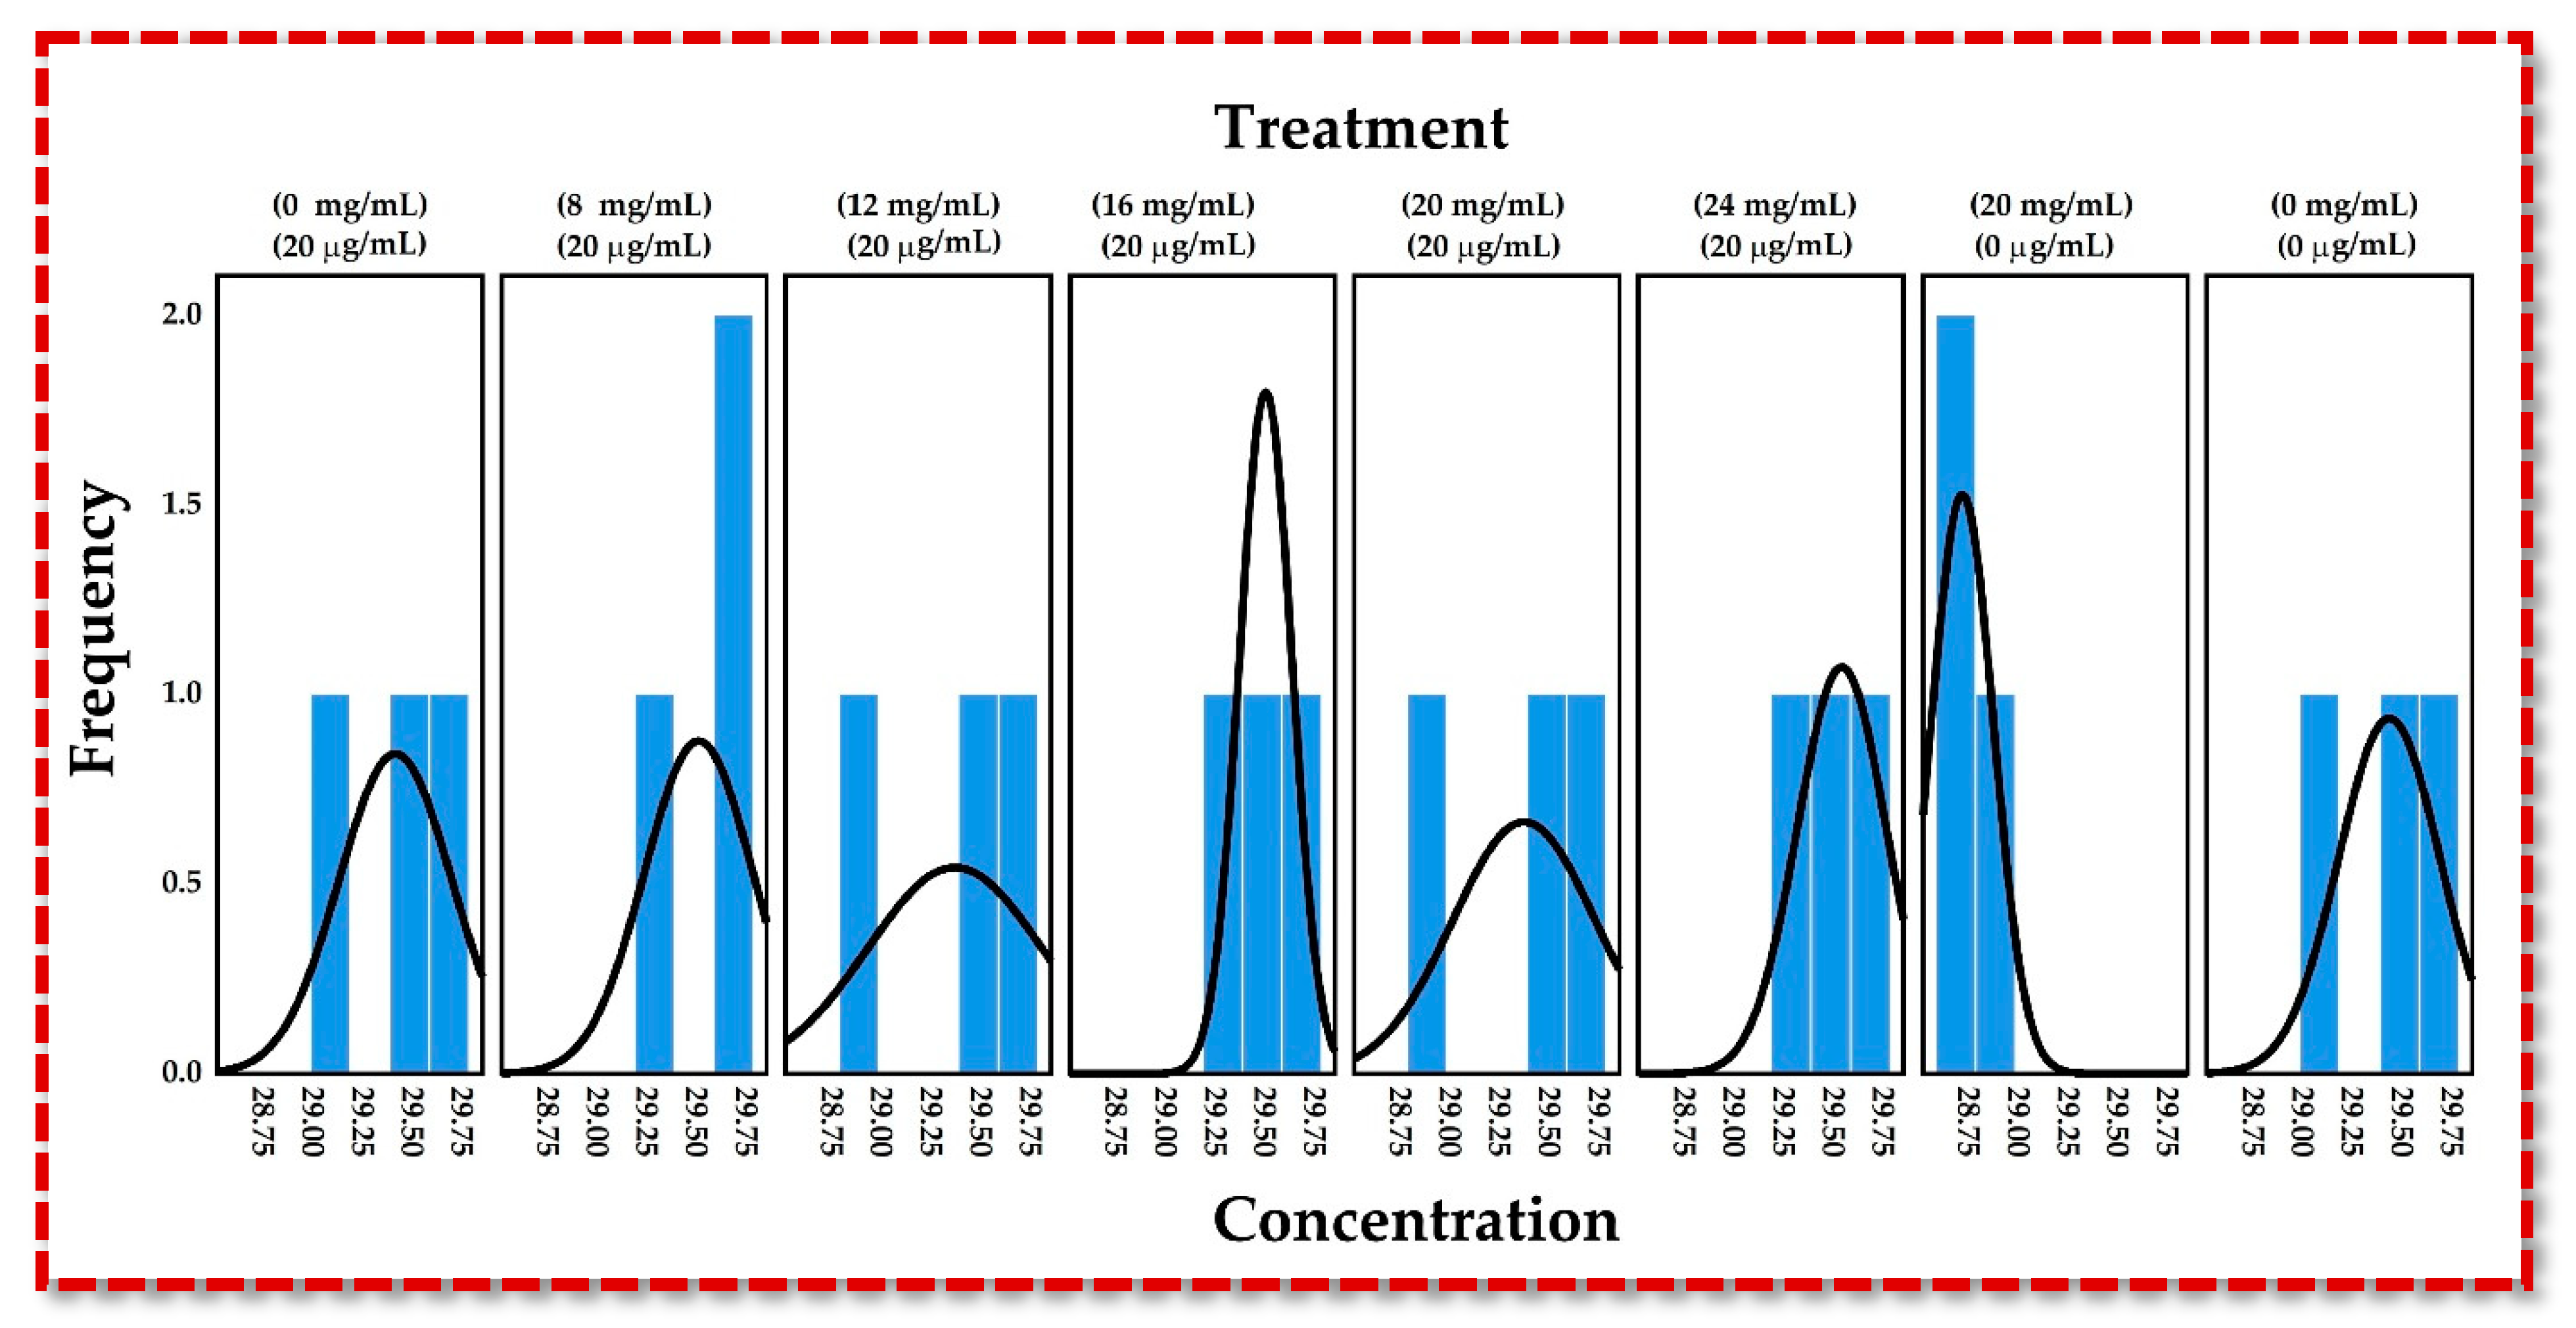
- Normality assumption:

| Treatment | Statistics | gl | Sig. |
|---|---|---|---|
| (0 mg/mL) (20 µg/mL) | 0.995 | 3 | 0.868 |
| (8 mg/mL) (20 µg/mL) | 0.934 | 3 | 0.504 |
| (12 mg/mL) (20 µg/mL) | 0.980 | 3 | 0.728 |
| (16 mg/mL) (20 µg/mL) | 0.960 | 3 | 0.617 |
| (20 mg/mL) (20 µg/mL) | 0.959 | 3 | 0.610 |
| (24 mg/mL) (20 µg/mL) | 0.981 | 3 | 0.738 |
| (20 mg/mL) (0 µg/mL) | 0.843 | 3 | 0.222 |
| (0 mg/mL) (0 µg/mL) | 0.984 | 3 | 0.760 |
- 2.
- Heteroscedasticity assumption
- 3.
- Analysis of variance
3.6.2. Validation of the Statistical Method That Determined the Bacteriostatic Effect of BSC with Concentrations of 28–40 mg/mL
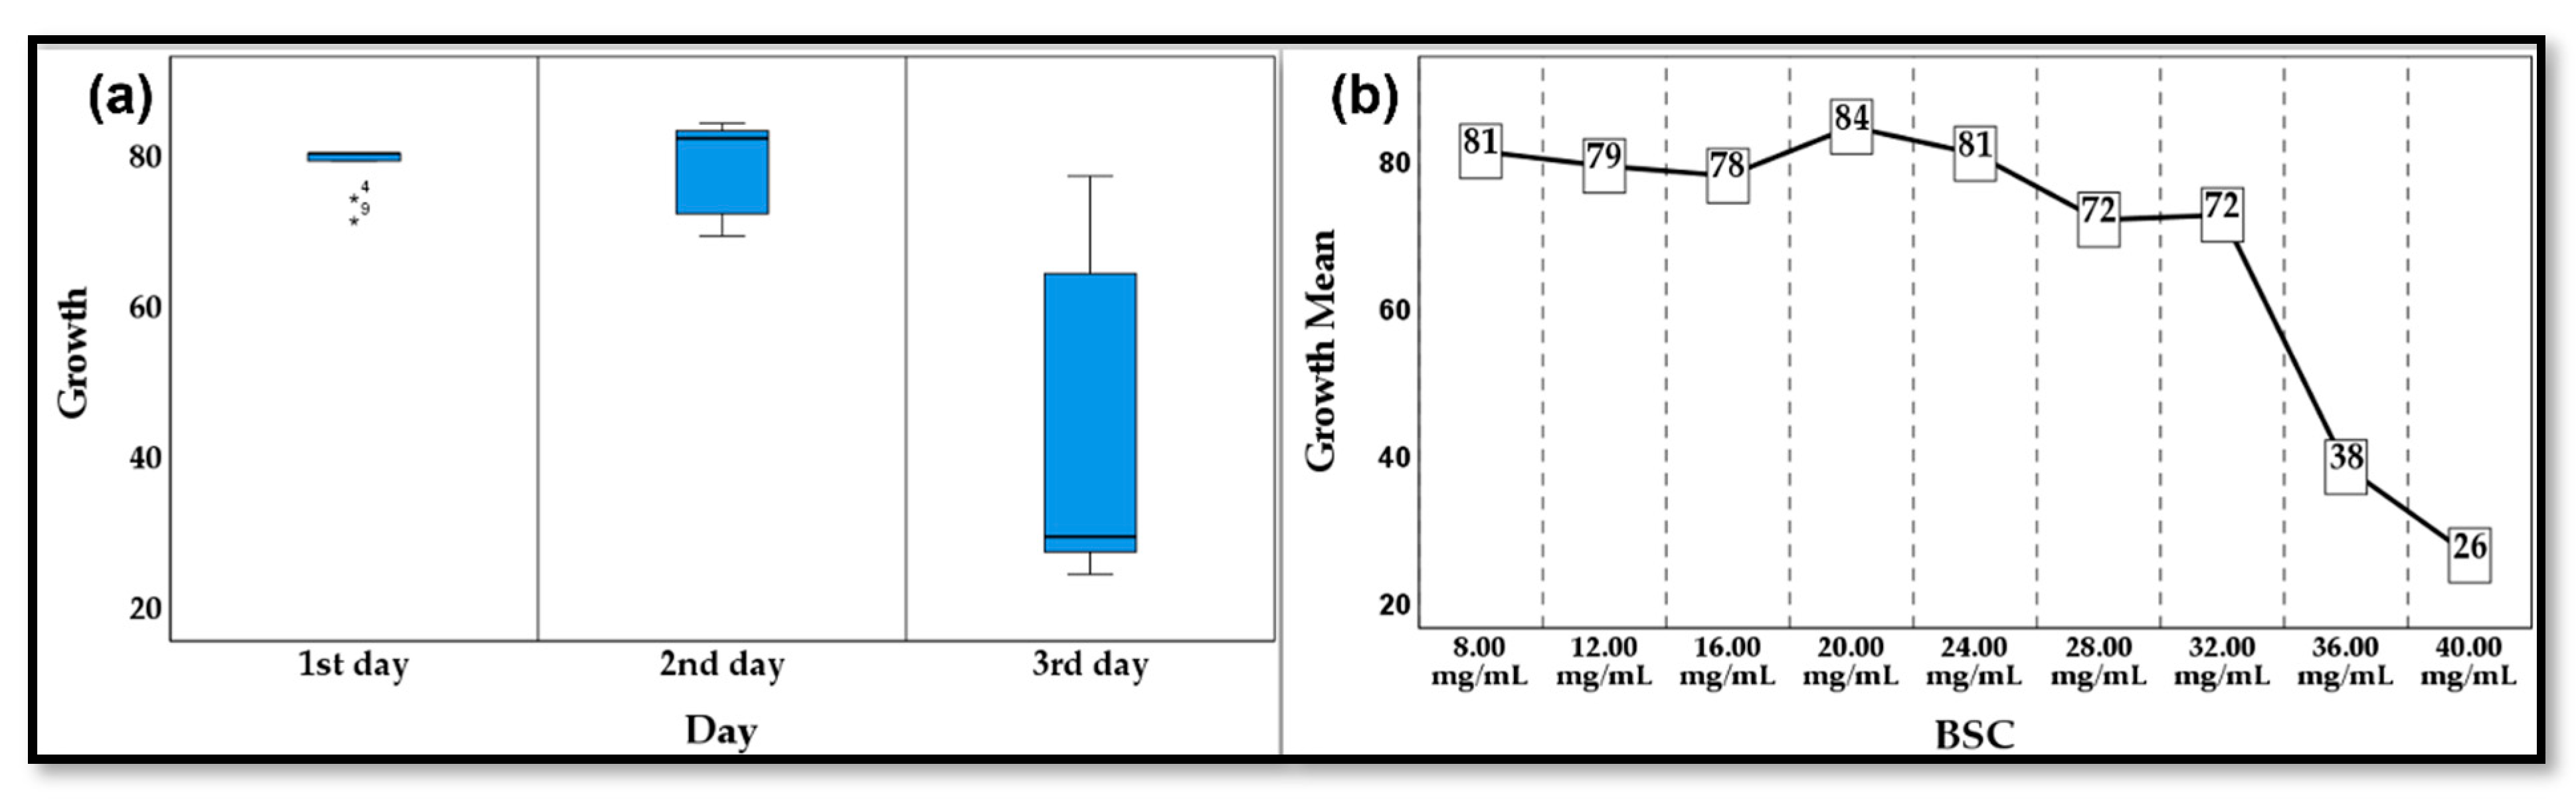
- Normality assumption
- 2.
- Heteroscedasticity assumption
- 3.
- Analysis of variance
4. Discussion
5. Conclusions
6. Patent
Author Contributions
Funding
Data Availability Statement
Conflicts of Interest
References
- Younsi, A.; Mahi, M.A.; Hamami, A.E.A.; Belarbi, R.; Bastidas-Arteaga, E. High-Volume Recycled Waste Glass Powder Cement-Based Materials: Role of Glass Powder Granularity. Buildings 2023, 13, 1783. [Google Scholar] [CrossRef]
- Larionau, P.; Hujova, M.; Michalková, M.; Mahmoud, M.; Švančárková, A.; Galusková, D.; Parchoviansky, M.; Bernardo, E.; Galusek, D.; Kraxner, J. Low-alkali borosilicate glass micro-spheres from waste cullet prepared by flame synthesis. Int. J. Appl. Glas. Sci. 2021, 12, 562–569. [Google Scholar] [CrossRef]
- Ramteke, D.D.; Hujova, M.; Kraxner, J.; Galusek, D.; Romero, A.R.; Falcone, R.; Bernardo, E. Up-cycling of ‘unrecyclable’ glasses in glass-based foams by weak alkali-activation, gel casting and low-temperature sintering. J. Clean. Prod. 2021, 278, 123985. [Google Scholar] [CrossRef]
- Gin, S.; Guo, X.; Delaye, J.-M.; Angeli, F.; Damodaran, K.; Testud, V.; Du, J.; Kerisit, S.; Kim, S.H. Insights into the mechanisms controlling the residual corrosion rate of borosilicate glasses. Npj Mater. Degrad. 2020, 4, 41. [Google Scholar] [CrossRef]
- Lonergan, J.M.; Lonergan, C.; Silverstein, J.; Cholsaipant, P.; McCloy, J. Thermal properties of sodium borosilicate glasses as a function of sulfur content. J. Am. Ceram. Soc. 2020, 103, 3610–3619. [Google Scholar] [CrossRef]
- Luo, Y.; Bao, S.; Zhang, Y. Recycling of granite powder and waste marble produced from stone processing for the preparation of architectural glass–ceramic. Constr. Build. Mater. 2022, 346, 128408. [Google Scholar] [CrossRef]
- Fabert, M.; Ojha, N.; Erasmus, E.; Hannula, M.; Hokka, M.; Hyttinen, J.; Rocherullé, J.; Sigalascd, I.; Massera, J. Crystallization and sintering of borosilicate bioactive glasses for application in tissue engineering. J. Mater. Chem. B 2017, 5, 4514–4525. [Google Scholar] [CrossRef] [PubMed]
- Fink, K.; Uchman, M. Boron cluster compounds as new chemical leads for antimicrobial therapy. Co-Ord. Chem. Rev. 2021, 431, 213684. [Google Scholar] [CrossRef]
- Thorley, N.; Ross, J. Intravaginal boric acid: Is it an alternative therapeutic option for vaginal trichomoniasis? Sex Transm. Infect. 2018, 94, 574–577. [Google Scholar] [CrossRef]
- García-García, J.A.; Azofeifa-Bolaños, J.B. Efecto del ácido bórico y la luz en el número y biomasa de microtubérculos de papa cv. “Floresta”. Uniciencia 2017, 31, 121. [Google Scholar] [CrossRef]
- Kumar, A.; Mittal, A.; Das, A.; Sen, D.; Mariappan, C.R. Mesoporous electroactive silver doped calcium borosilicates: Structural, anti-bacterial and myogenic potential relationship of improved bio-ceramics. Ceram. Int. 2021, 47, 3586–3596. [Google Scholar] [CrossRef]
- Balestriere, M.; Schuhladen, K.; Seitz, K.H.; Boccaccini, A.; Cere, S.; Ballarre, J. Sol-gel coatings incorporating borosilicate bioactive glass enhance anti corrosive and surface performance of stainless steel implants. J. Electroanal. Chem. 2020, 876, 114735. [Google Scholar] [CrossRef]
- Kumar, A.; Mariappan, C. A new biocompatible phosphate free mesoporous calcium borosilicate glass-ceramics for medical application. Mater. Lett. 2021, 305, 130752. [Google Scholar] [CrossRef]
- Kayani, Z.N.; Bashir, Z.; Mohsin, M.; Riaz, S.; Naseem, S. Sol-Gel Synthesized Boron nitride (BN) Thin Films for Antibacterial and Magnetic Applications. Optik 2021, 243, 167502. [Google Scholar] [CrossRef]
- Arciénaga, I.M.; Moraga, N.B.; Rajal, V.B.; Romano Armada, N. Influencia del ácido bórico sobre propiedades promotoras de creci-miento vegetal de Pseudomonas putida KT2440. Agrotecnia 2017, 25, 41. [Google Scholar] [CrossRef]
- Drago, L. Chloramphenicol Resurrected: A Journey from Antibiotic Resistance in Eye Infections to Biofilm and Ocular Micro-biota. Microorganisms 2019, 7, 278. [Google Scholar]
- Tevyashova, A.N. Recent Trends in Synthesis of Chloramphenicol New Derivatives. Antibiotics 2021, 10, 370. [Google Scholar] [CrossRef] [PubMed]
- Wei, W.-J.; Yang, H.-F. Synergy against extensively drug-resistant Acinetobacter baumannii in vitro by two old antibiotics: Colistin and chloramphenicol. Int. J. Antimicrob. Agents 2017, 49, 321–326. [Google Scholar] [CrossRef]
- Altaf, M.; Ijaz, M.; Ghaffar, A.; Rehman, A.; Avais, M. Antibiotic susceptibility profile and synergistic effect of non-steroidal an-ti-inflammatory drugs on antibacterial activity of resistant antibiotics (Oxytetracycline and Gentamicin) against methicillin re-sistant Staphylococcus aureus (MRSA). Microb. Pathog. 2019, 137, 103755. [Google Scholar] [CrossRef]
- Sevim, F.; Demir, F.; Bilen, M.; Okur, H. Kinetic analysis of thermal decomposition of boric acid from thermogravimetric data. Korean J. Chem. Eng. 2006, 23, 736–740. [Google Scholar] [CrossRef]
- Pignatel, G.; Queirolo, G. Further insight on boron diffusion in silicon obtained with Auger electron spectroscopy. Thin Solid Film. 1980, 67, 233–238. [Google Scholar] [CrossRef]
- Xie, F.; Juan, I.G.; Arango-Ospina, M.; Riedel, R.; Boccaccini, A.R.; Ionescu, E. Apatite Forming Ability and Dissolution Behavior of Boron- and Calcium-Modified Silicon Oxycarbides in Comparison to Silicate Bioactive Glass. ACS Biomater. Sci. Eng. 2019, 5, 5337–5347. [Google Scholar] [CrossRef]
- Degen, T.; Sadki, M.; Bron, E.; König, U.; Nénert, G. The HighScore suite. Powder Diffr. 2014, 29, S13–S18. [Google Scholar] [CrossRef]
- D’Souza, M.J.; Koyoshi, F. Extracting Relevant Information from FDA Drug Files to Create a Structurally Diverse Drug Database Using KnowItAll®. Pharm Rev. 2009, 7, 1–15. [Google Scholar]
- Munno, K.; De Frond, H.; O’donnell, B.; Rochman, C.M. Increasing the Accessibility for Characterizing Microplastics: Introducing New Application-Based and Spectral Libraries of Plastic Particles (SLoPP and SLoPP-E). Anal. Chem. 2020, 92, 2443–2451. [Google Scholar] [CrossRef] [PubMed]
- Messori, A. Survival curve fitting using the Gompertz function: A methodology for conducting cost-effectiveness analyses on mortality data. Comput. Methods Programs Biomed. 1997, 52, 157–164. [Google Scholar] [CrossRef]
- Yu, H.; Wehrhahn, M. Implementation of EUCAST short incubation break points directly from blood culture bottles in a private microbiology laboratory. Pathology 2020, 52, S128. [Google Scholar] [CrossRef]
- Rodriguez, O.; Stone, W.; Schemitsch, E.H.; Zalzal, P.; Waldman, S.; Papini, M.; Towler, M.R. Titanium addition influences antibacterial activity of bioactive glass coatings on metallic implants. Heliyon 2017, 3, e00420. [Google Scholar] [CrossRef]
- Ochoa Sangrador, C.; Brezmes Raposo, M. Tratamiento antibiótico recomendado en episodios de infección urinaria. Pediatría 2007, 67, 485–497. [Google Scholar] [CrossRef] [PubMed]
- Buffet-Bataillon, S.; Branger, B.; Cormier, M.; Bonnaure-Mallet, M.; Jolivet-Gougeon, A. Effect of higher minimum inhibitory concen-trations of quaternary ammonium compounds in clinical E. coli isolates on antibiotic susceptibilities and clinical outcomes. J. Hosp. Infect. 2011, 79, 141–146. [Google Scholar] [CrossRef]
- Demirel, B.; Taygun, M.E. Antibacterial Borosilicate Glass and Glass Ceramic Materials Doped with ZnO for Usage in the Pharmaceutical Industry. ACS Omega 2023, 8, 18735–18742. [Google Scholar] [CrossRef]
- Canovas, J.; Petitjean, G.; Chau, F.; Le Monnier, A.; Fantin, B.; Lefort, A. Expression of CTX-M-15 limits the efficacy of ceftolozane/tazobactam against Escherichia coli in a high-inoculum murine peritonitis model. Clin. Microbiol. Infect. 2020, 26, 1416.e5–1416.e9. [Google Scholar] [CrossRef] [PubMed]
- Imane, N.I.; Fouzia, H.; Azzahra, L.F.; Ahmed, E.; Ismail, G.; Idrissa, D.; Mohamed, K.-H.; Sirine, F.; L’Houcine, O.; Noureddine, B. Chemical composition, antibacterial and antioxidant activ-ities of some essential oils against multidrug resistant bacteria. Eur. J. Integr. Med. 2020, 35, 101074. [Google Scholar] [CrossRef]
- Witt, L.S.; Spicer, J.O.; Burd, E.; Kraft, C.S.; Babiker, A. Evaluation of clinicians’ knowledge and use of minimum inhibitory concentration values. Braz. J. Infect. Dis. 2021, 25, 101656. [Google Scholar] [CrossRef] [PubMed]
- Mouton, J.W.; Muller, A.E.; Canton, R.; Giske, C.G.; Kahlmeter, G.; Turnidge, J. MIC-based dose adjustment: Facts and fables. J. Antimicrob. Chemother. 2018, 73, 564–568. [Google Scholar] [CrossRef]
- Kowalska-Krochmal, B.; Dudek-Wicher, R. The Minimum Inhibitory Concentration of Antibiotics: Methods, Interpretation, Clinical Relevance. Pathogens 2021, 10, 165. [Google Scholar] [CrossRef]
- Bidlas, E.; Du, T.; Lambert, R.J. An explanation for the effect of inoculum size on MIC and the growth/no growth interface. Int. J. Food Microbiol. 2008, 126, 140–152. [Google Scholar] [CrossRef] [PubMed]


| Samples | ||
|---|---|---|
| Elements | BSAS | BSC |
| B | 0.29 | 0.17 |
| C | 12.54 | 7.71 |
| O | 45.86 | 55.96 |
| Na | 0.47 | 0.12 |
| Mg | 0.84 | 0.8 |
| Al | 9.95 | 6.07 |
| Si | 30.05 | 29.17 |
| Total | 100 | 100 |
| Independent Variable | Dependent Variable | |||||
|---|---|---|---|---|---|---|
| E. coli ATCC 25922 WDCM 0013 | Initial Inoculum | 790,000 CFU/mL | Remarks | |||
| Sample No. | BSC (µg/mL) | Chloramphenicol (µg/mL) | 24 h Count (CFU/mL) | 48 h Count (CFU/mL) | 72 h Count (CFU/mL) | |
| 1 | 0 | 20 | 8.1 × 10¹² | 4.6 × 10¹² | 5.9 × 10¹² | None |
| 2 | 8 | 20 | 7.2 × 10¹² | 4.9 × 10¹² | 8.3 × 10¹² | None |
| 3 | 12 | 20 | 8.6 × 10¹² | 3.6 × 10¹² | 6.2 × 10¹² | None |
| 4 | 16 | 20 | 6.8 × 10¹² | 5.7 × 10¹² | 7.4 × 10¹² | None |
| 5 | 20 | 20 | 3.9 × 10¹² | 6.3 × 10¹² | 7.9 × 10¹² | None |
| 6 | 24 | 20 | 8.4 × 10¹² | 5.4 × 10¹² | 7.1 × 10¹² | None |
| 7 | 20 | 0 | 5.6 × 10¹² | 3 × 10¹² | 4.5 × 10¹² | None |
| 8 (White) C/inoculum | 0 | 0 | 4.7 × 10¹² | 6.4 × 10¹² | 7.8 × 10¹² | Increased turbidity |
| Negative control s/inoculum | 0 | 0 | <1 | <1 | <1 | None |
| Sample | Description | Dosage by Weight (µg/mL) | Column 1 First Day (CFU/mL) 24 h Count | Column 2 Second Day (CFU/mL) 48 h Count | Column 3 Third Day (CFU/mL) 72 h Count | Remarks |
|---|---|---|---|---|---|---|
| 1 | BSC | 8 | 8.1 × 10¹² | 8.5 × 10¹² | 7.8 × 10¹² | No antimicrobial effect |
| 2 | 12 | 8.1 × 10¹² | 8.4 × 10¹² | 7.4 × 10¹² | No antimicrobial effect | |
| 3 | 16 | 8.1 × 10¹² | 8.4 × 10¹² | 6.5 × 10¹² | Low antimicrobial effect | |
| 4 | 20 | 7.5 × 10¹² | 8.3 × 10¹² | 5.6 × 10¹² | Low antimicrobial effect | |
| 5 | 24 | 8.1 × 10¹² | 8.4 × 10¹² | 3.0 × 10¹² | Moderate antimicrobial effect | |
| 6 | 28 | 8.1 × 10¹² | 7.5 × 10¹² | 2.8 × 10¹² | Moderate antimicrobial effect | |
| 7 | 32 | 8.0 × 10¹² | 7.3 × 10¹² | 2.8 × 10¹² | Moderate antimicrobial effect | |
| 8 | 36 | 8.1 × 10¹² | 7.2 × 10¹² | 2.5 × 10¹² | High antimicrobial effect | |
| 9 | 40 | 7.2 × 10¹² | 7.0 × 10¹² | 2.5 × 10¹² | High antimicrobial effect |
| Levene’s Statistic | gl1 | gl2 | Sig. | |
|---|---|---|---|---|
| Based on the mean | 0.866 | 7 | 16 | 0.553 |
| Based on the median | 0.408 | 7 | 16 | 0.883 |
| Based on the median and with adjusted Gl | 0.408 | 7 | 11.490 | 0.879 |
| Based on the trimmed mean | 0.831 | 7 | 16 | 0.577 |
| Sum of Squares | gl | Root Mean Square (RMS) | F | Sig. | |
|---|---|---|---|---|---|
| Between groups | 1.491 | 7 | 0.213 | 2.682 | 0.048 |
| Within groups | 1.271 | 16 | 0.079 | ||
| Total | 2.762 | 23 |
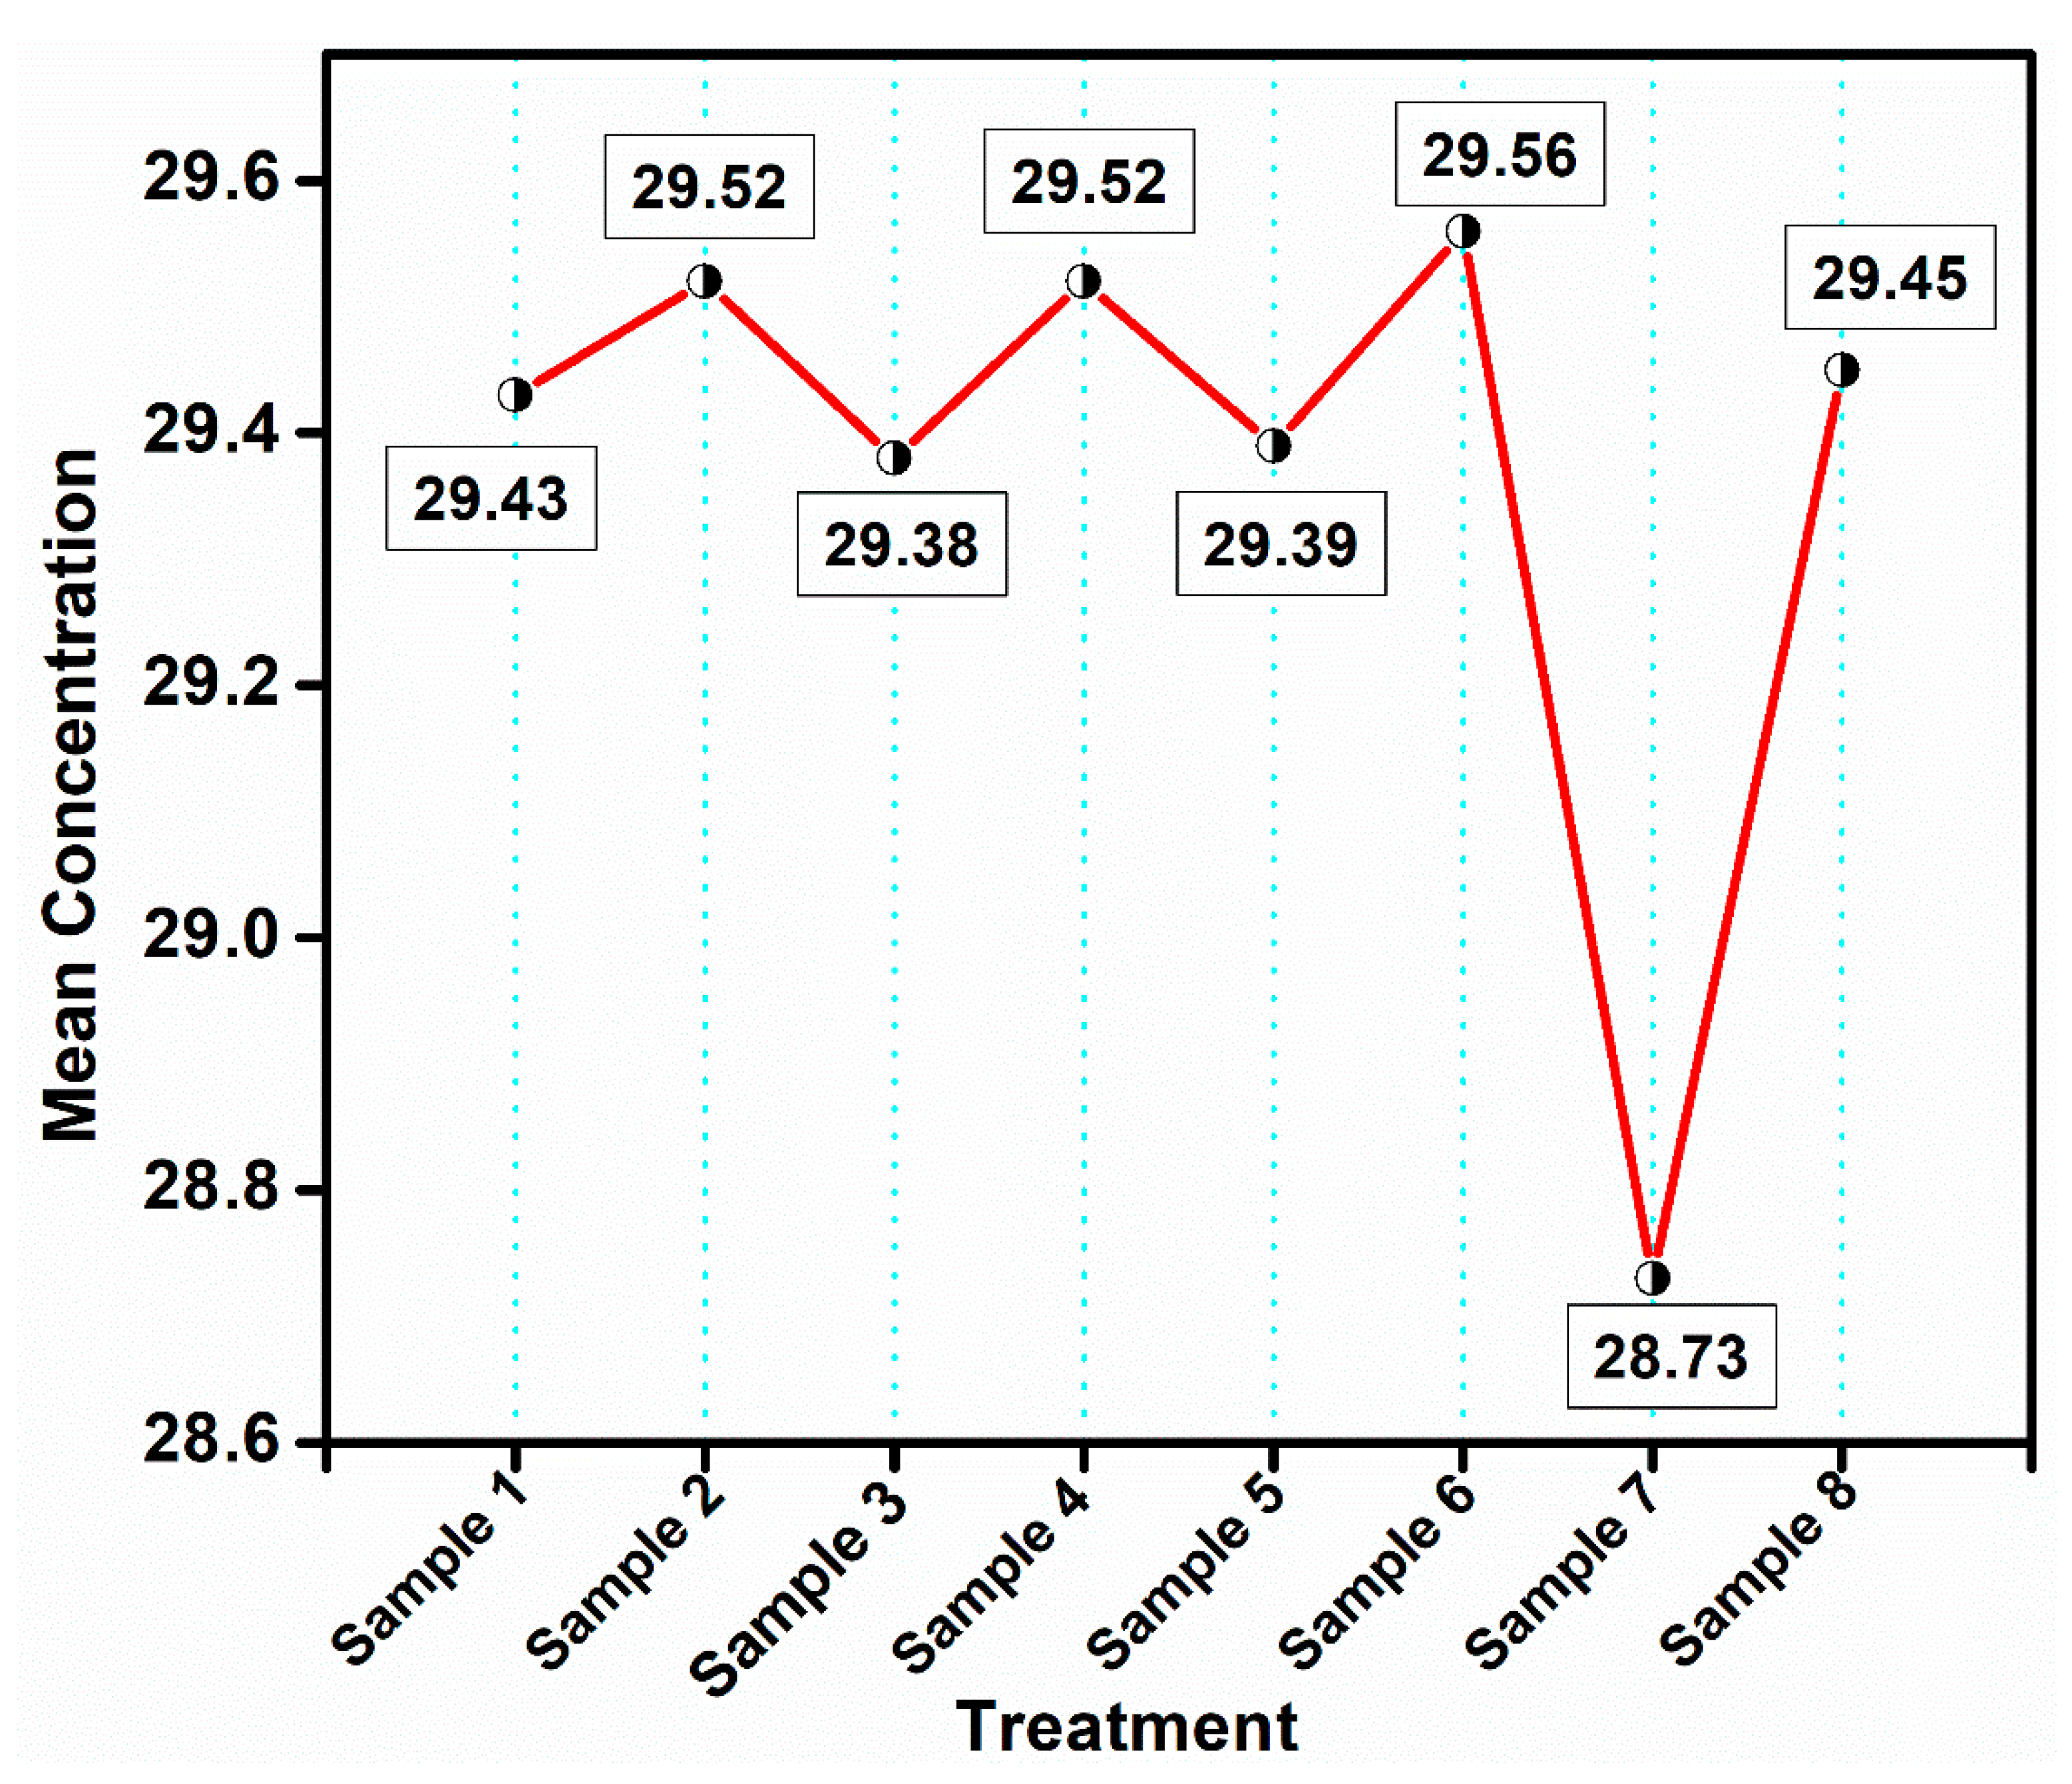
| Treatment | N | Subset for Alpha = 0.05 | |
|---|---|---|---|
| 1 | 2 | ||
| (20 mg/mL) (0 µg/mL) | 3 | 28.7323 | |
| (12 mg/mL) (20 µg/mL) | 3 | 29.3835 | |
| (20 mg/mL) (20 µg/mL) | 3 | 29.3872 | |
| (0 mg/mL) (20 µg/mL) | 3 | 29.4287 | |
| (0 mg/mL) (0 µg/mL) | 3 | 29.4503 | |
| (16 mg/mL) (20 µg/mL) | 3 | 29.5173 | |
| (8 mg/mL) (20 µg/mL) | 3 | 29.5242 | |
| (24 mg/mL) (20 µg/mL) | 3 | 29.5559 | |
| Sig. | 1.000 | 0.513 | |
| Day | Kolmogorov–Smirnov | Shapiro–Wilk | ||||
|---|---|---|---|---|---|---|
| Statistics | gl | Sig. | Statistics | gl | Sig. | |
| First day | 0.370 | 9 | 0.001 | 0.618 | 9 | 0.060 |
| Second day | 0.301 | 9 | 0.018 | 0.804 | 9 | 0.053 |
| Third day | 0.309 | 9 | 0.013 | 0.804 | 9 | 0.073 |
| Levene’s Statistic | gl1 | gl2 | Sig. | |
|---|---|---|---|---|
| Based on the mean | 47.887 | 2 | 24 | 0.073 |
| Based on the median | 4.981 | 2 | 24 | 0.066 |
| Based on the median and with adjusted Gl | 4.981 | 2 | 9.598 | 0.053 |
| Based on the trimmed mean | 43.632 | 2 | 24 | 0.045 |
| Source of Variation | Sum of the Squares | gl | Root Mean Square | F | Sig. |
|---|---|---|---|---|---|
| Between groups | 6778.741 | 2 | 3389.370 | 18.277 | 0.000 |
| Within groups | 4450.667 | 24 | 185.444 | ||
| Total | 11,229.407 | 26 |
| Day | N | Subset for Alpha = 0.05 | |
|---|---|---|---|
| 1 | 2 | ||
| Third day | 9 | 45.4444 | |
| Second day | 9 | 78.8889 | |
| First day | 9 | 79.2222 | |
| Sig. | 1.000 | 0.959 | |
Disclaimer/Publisher’s Note: The statements, opinions and data contained in all publications are solely those of the individual author(s) and contributor(s) and not of MDPI and/or the editor(s). MDPI and/or the editor(s) disclaim responsibility for any injury to people or property resulting from any ideas, methods, instructions or products referred to in the content. |
© 2023 by the authors. Licensee MDPI, Basel, Switzerland. This article is an open access article distributed under the terms and conditions of the Creative Commons Attribution (CC BY) license (https://creativecommons.org/licenses/by/4.0/).
Share and Cite
Vera Barrios, B.S.; Sacari Sacari, E.J.; Mangalaraja, R.V.; Arulraj, A.; Espinoza Reynoso, I.d.C.; Cano de Terrones, T.; Aguilar Martínez, J.A.; del Carpio Delgado, F.; Lazo Alarcón, L.A. Synthesis, Characterization, and Antibacterial Efficacy of Borosilicate Compound against Escherichia coli. Processes 2023, 11, 3414. https://doi.org/10.3390/pr11123414
Vera Barrios BS, Sacari Sacari EJ, Mangalaraja RV, Arulraj A, Espinoza Reynoso IdC, Cano de Terrones T, Aguilar Martínez JA, del Carpio Delgado F, Lazo Alarcón LA. Synthesis, Characterization, and Antibacterial Efficacy of Borosilicate Compound against Escherichia coli. Processes. 2023; 11(12):3414. https://doi.org/10.3390/pr11123414
Chicago/Turabian StyleVera Barrios, Bertha Silvana, Elisban Juani Sacari Sacari, Ramalinga Viswanathan Mangalaraja, Arunachalam Arulraj, Isabel del Carmen Espinoza Reynoso, Teresa Cano de Terrones, Josué Amílcar Aguilar Martínez, Fabrizio del Carpio Delgado, and Luis Antonio Lazo Alarcón. 2023. "Synthesis, Characterization, and Antibacterial Efficacy of Borosilicate Compound against Escherichia coli" Processes 11, no. 12: 3414. https://doi.org/10.3390/pr11123414