
Wind Characteristics and Wind Energy Potential in Andean Towns in Northern Peru between 2016 and 2020: A Case Study of the City of Chachapoyas


Abstract
:1. Introduction
2. Materials and Methods
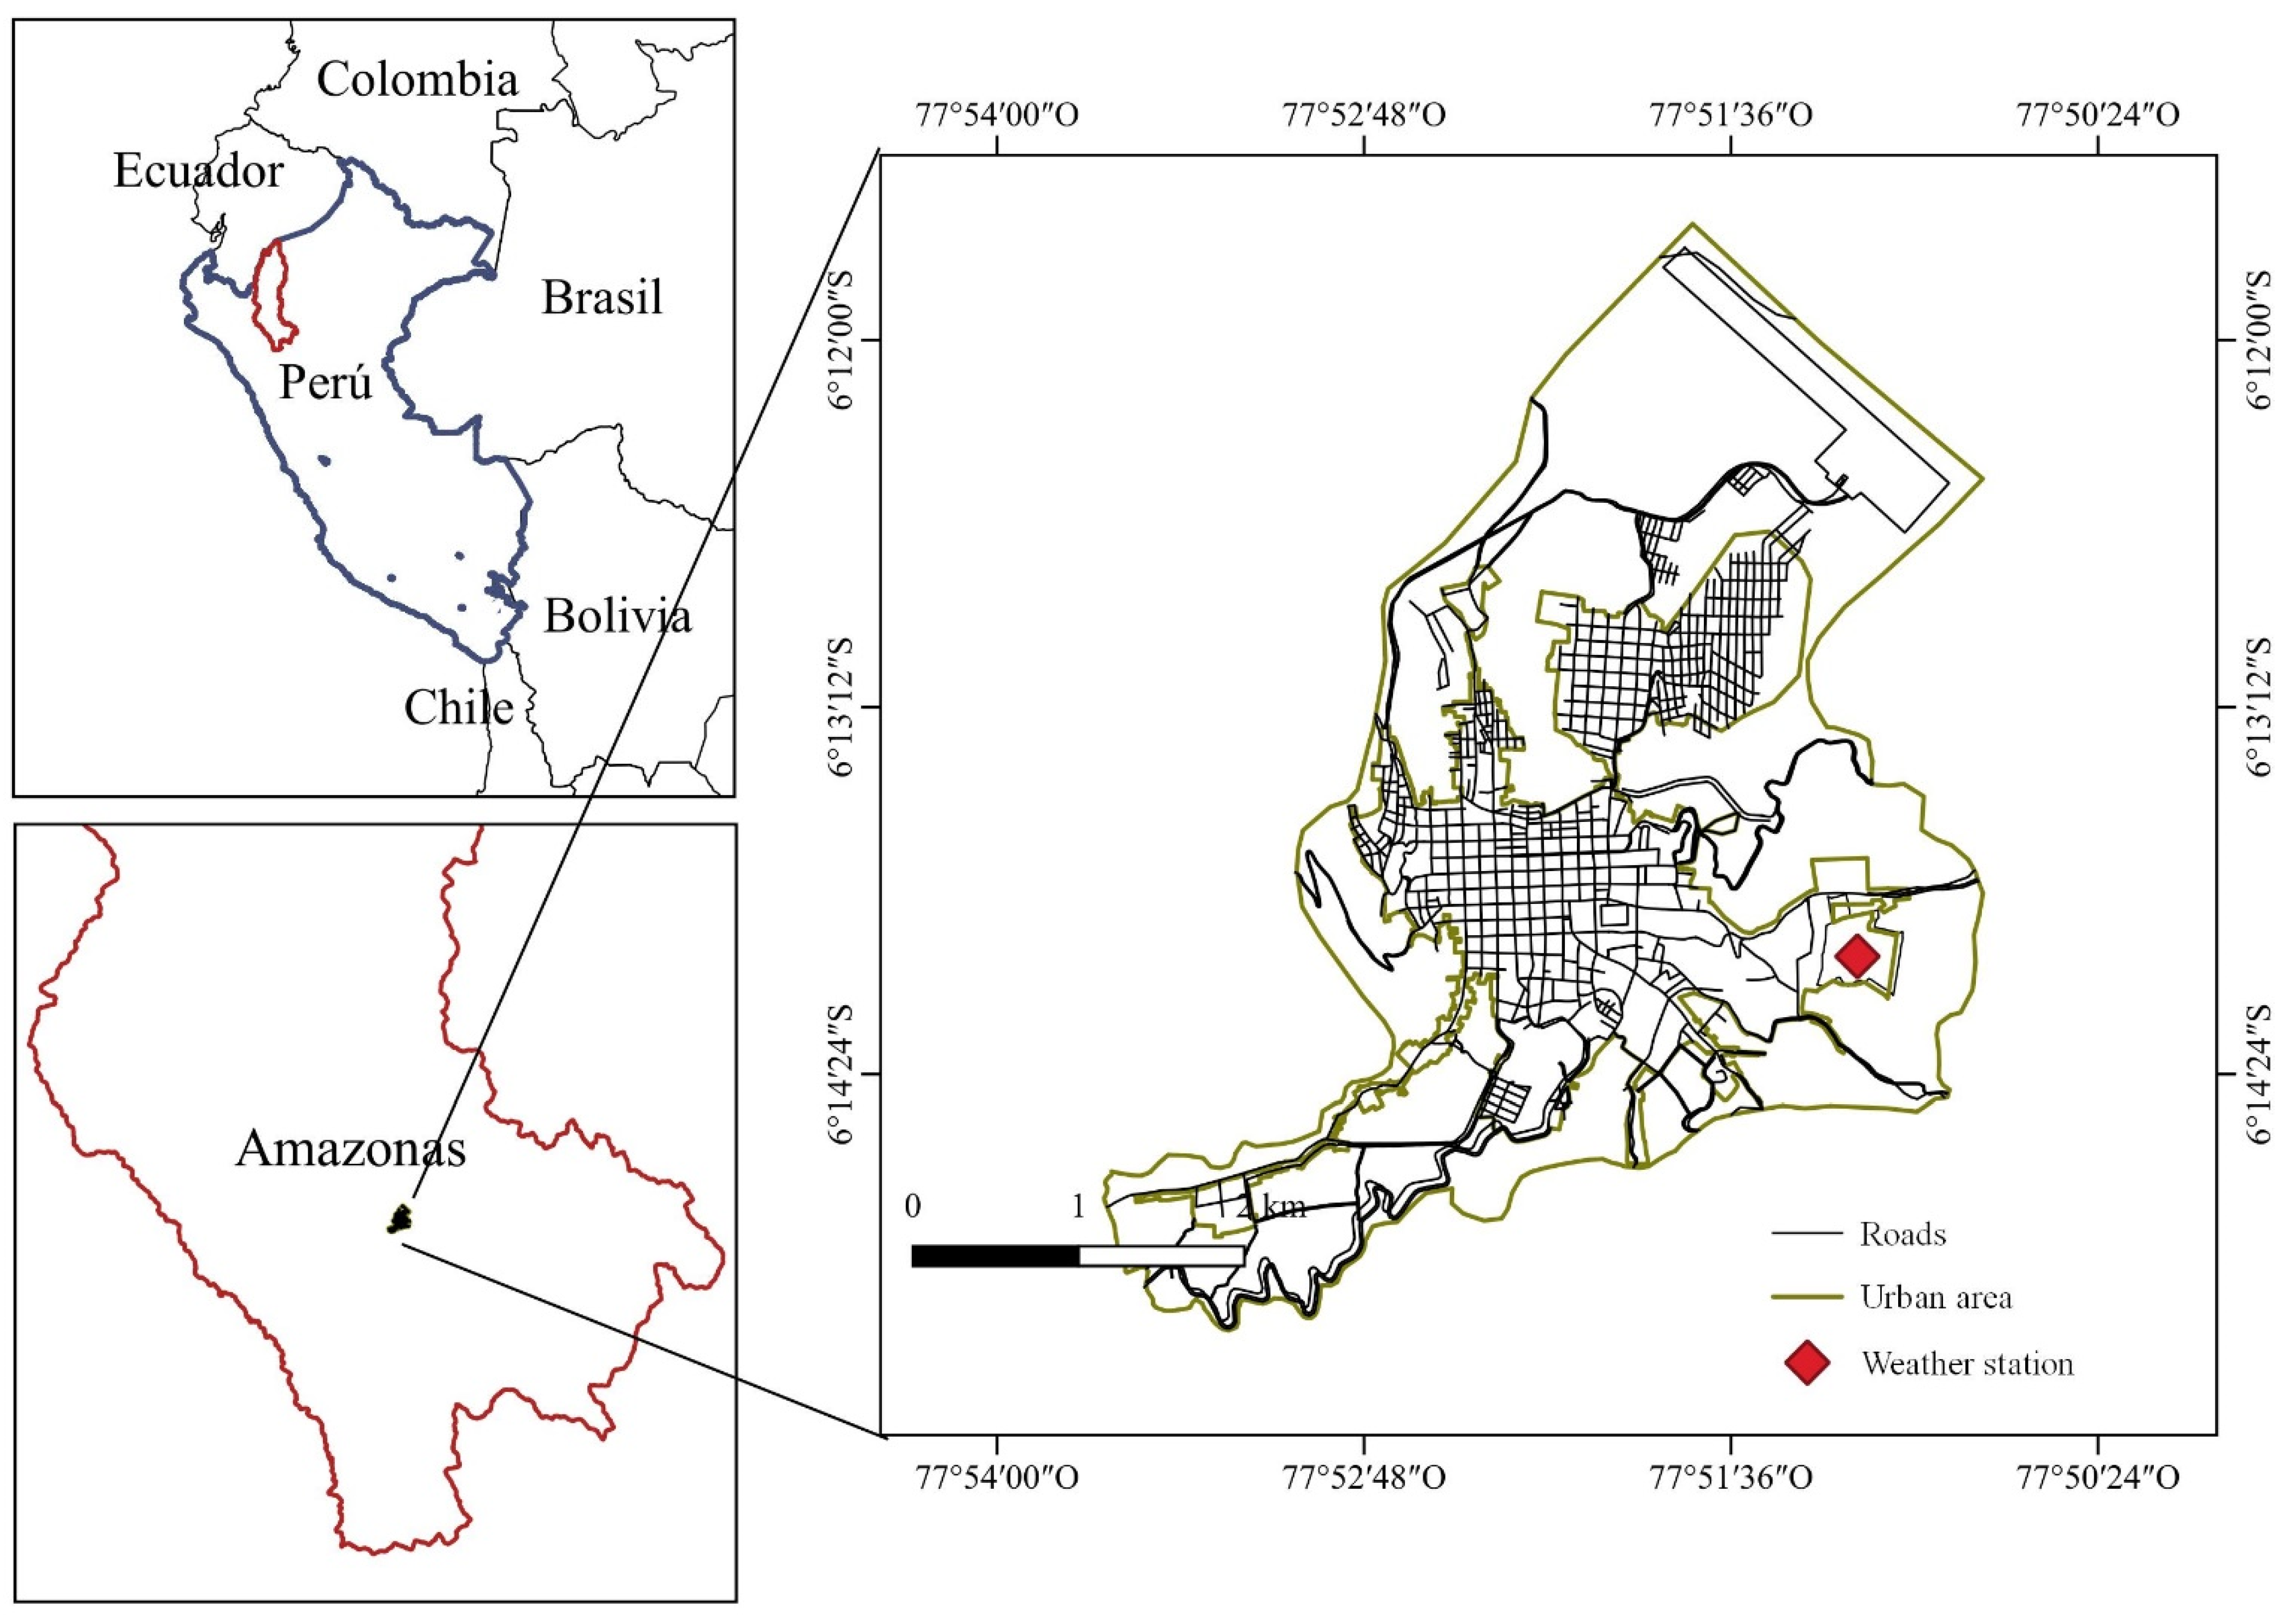
2.1. Study Area and City Areas
2.2. Selection of the Period and Weather Station
2.3. Data and Quality Control
2.4. Description of Wind Speed and Wind Direction
3. Results and Discussion
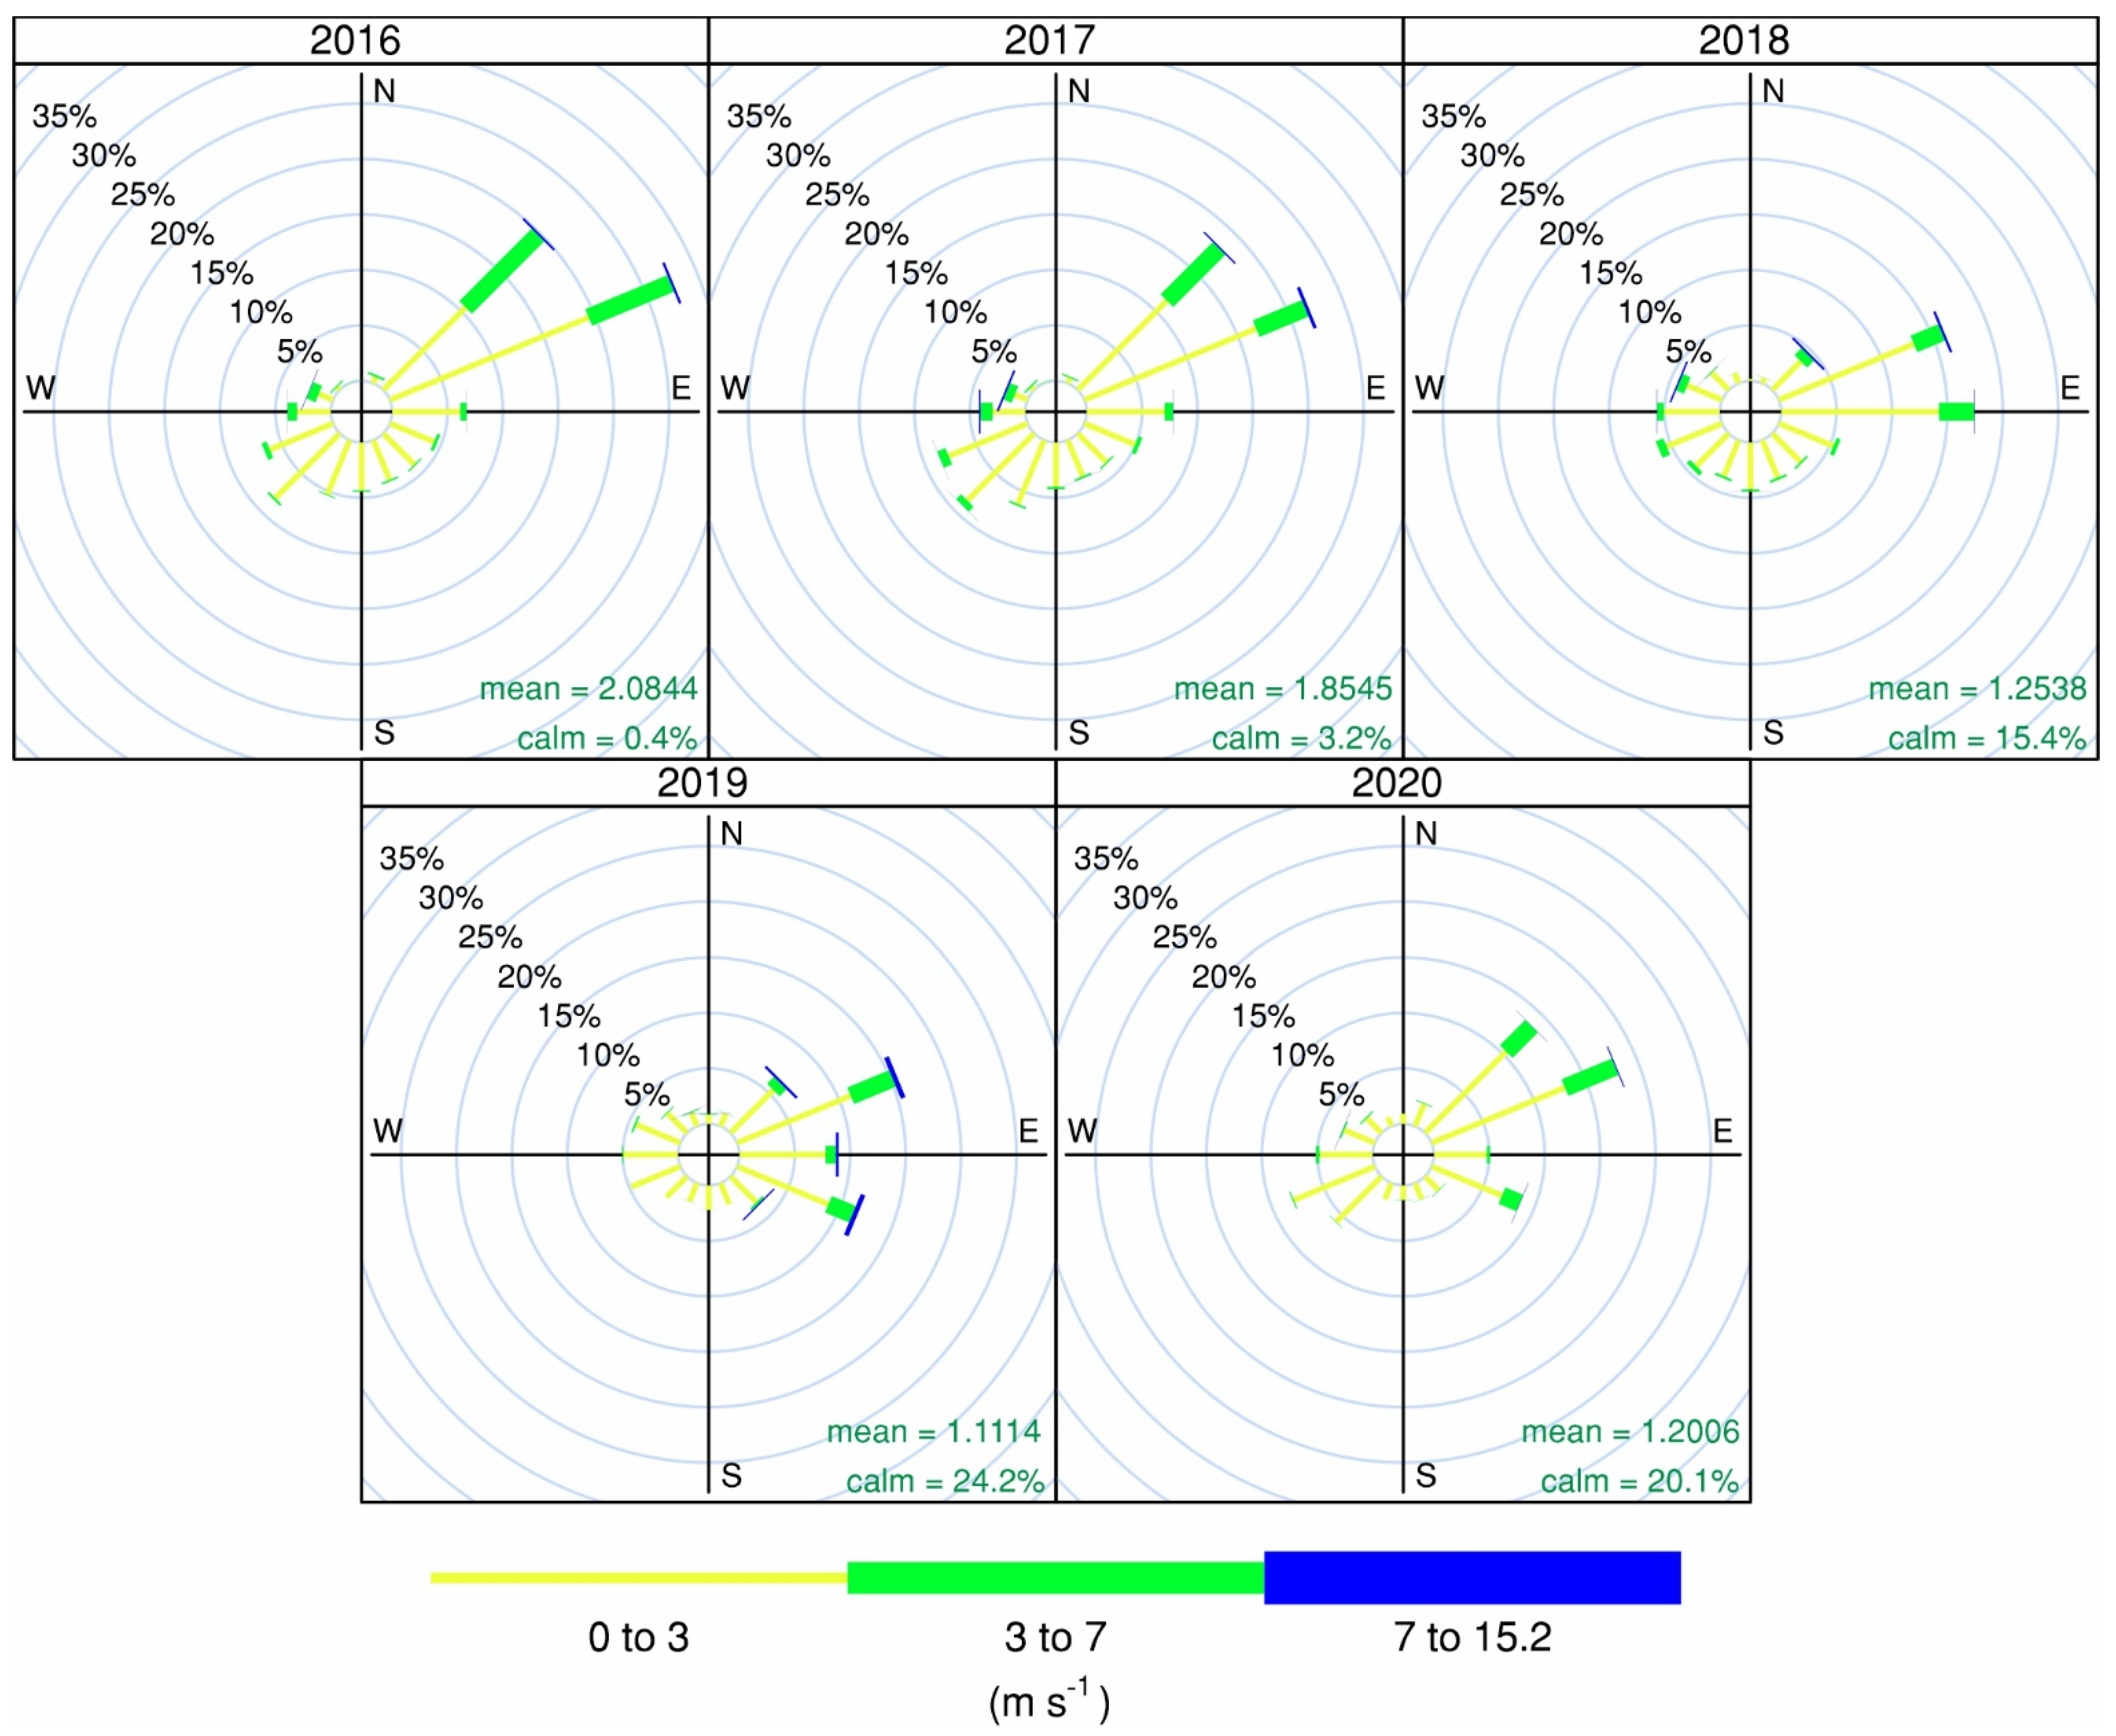
3.1. Wind Behavior in the Period 2016–2020
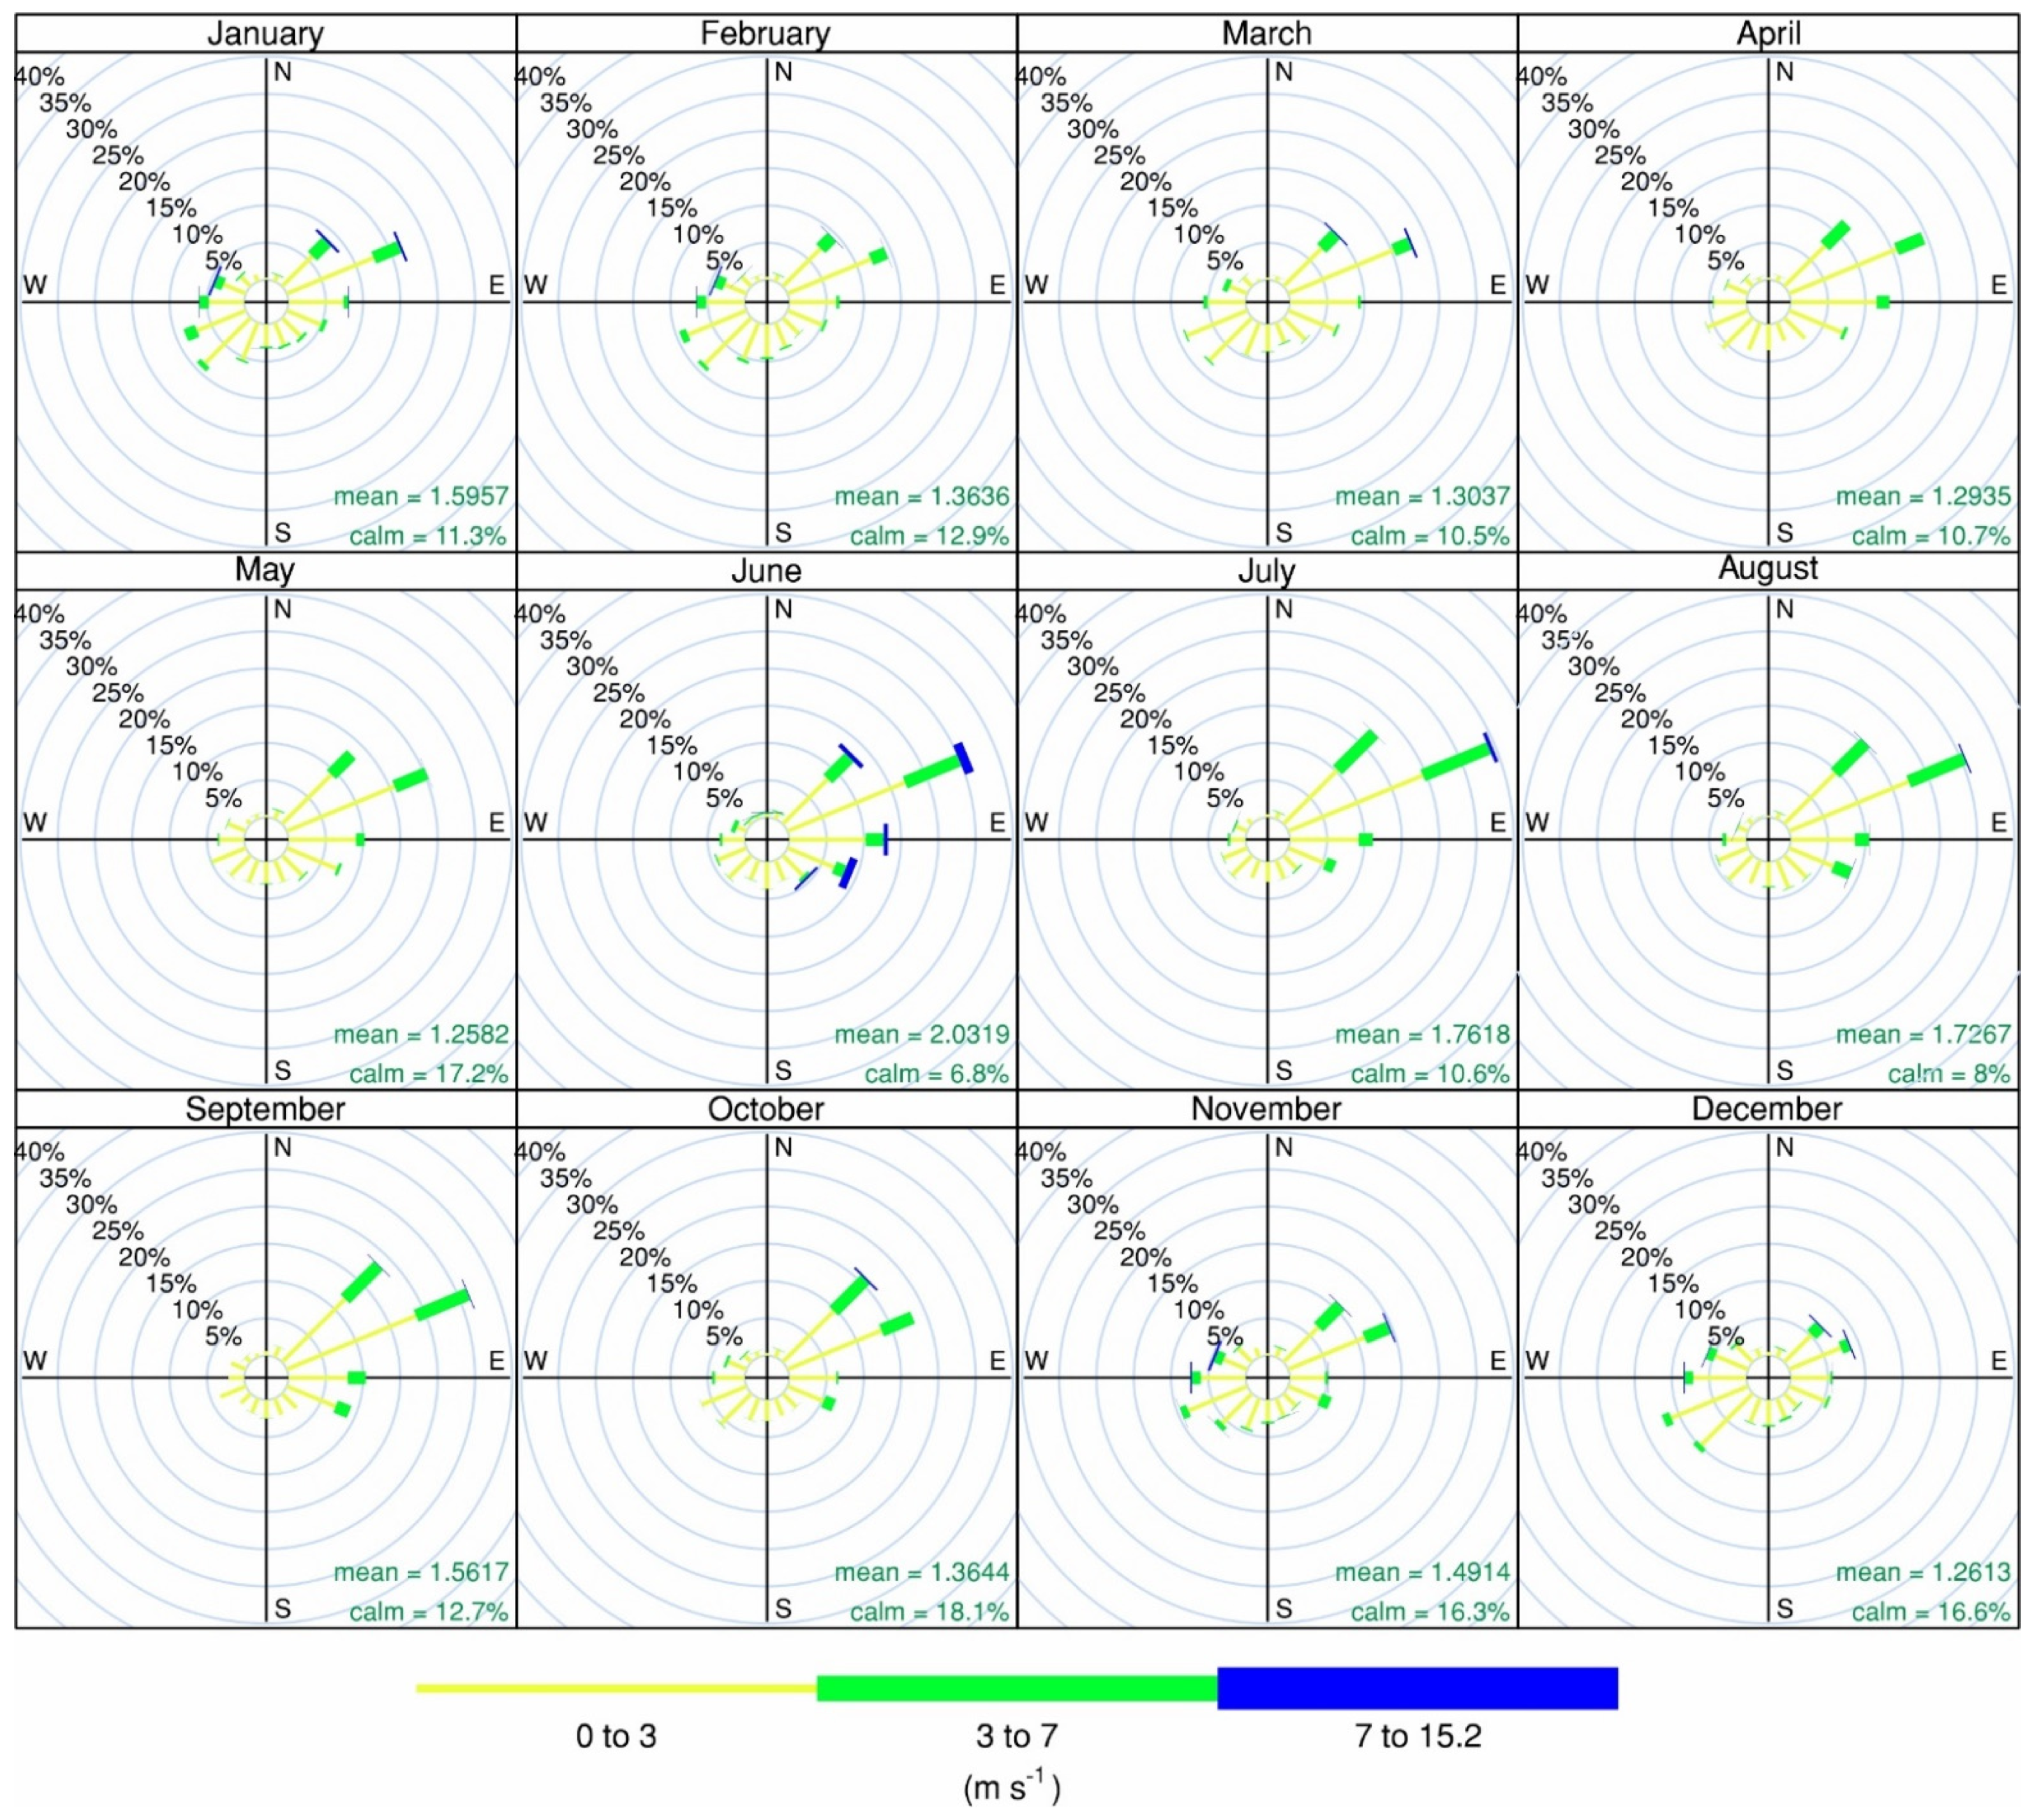
3.2. Seasonal Wind Behavior
3.3. Wind Turbines Based on Wind Speed
4. Conclusions
Author Contributions
Funding
Institutional Review Board Statement
Informed Consent Statement
Data Availability Statement
Acknowledgments
Conflicts of Interest
References
- Chandio, A.A.; Shah, M.I.; Sethi, N.; Mushtaq, Z. Assessing the Effect of Climate Change and Financial Development on Agricultural Production in ASEAN-4: The Role of Renewable Energy, Institutional Quality, and Human Capital as Moderators. Environ. Sci. Pollut. Res. 2022, 29, 13211–13225. [Google Scholar] [CrossRef] [PubMed]
- Máté, D.; Fazle Rabbi, M.; Novotny, A.; Kovács, S. Grand Challenges in Central Europe: The Relationship of Food Security, Climate Change, and Energy Use. Energies 2020, 13, 5422. [Google Scholar] [CrossRef]
- Lin, I.I.; Chan, J.C.L. Recent Decrease in Typhoon Destructive Potential and Global Warming Implications. Nat. Commun. 2015, 6, 7182. [Google Scholar] [CrossRef] [PubMed] [Green Version]
- Altieri, M.A.; Nicholls, C.I. The Adaptation and Mitigation Potential of Traditional Agriculture in a Changing Climate. Clim. Chang. 2017, 140, 33–45. [Google Scholar] [CrossRef]
- Jat, M.L.; Dagar, J.C.; Sapkota, T.B.; Yadvinder-Singh; Govaerts, B.; Ridaura, S.L.; Saharawat, Y.S.; Sharma, R.K.; Tetarwal, J.P.; Jat, R.K.; et al. Climate change and agriculture: Adaptation strategies and mitigation opportunities for food security in South Asia and Latin America. In Advances in Agronomy; Sparks, D.L., Ed.; Elsevier: London, UK, 2016; Volume 137, pp. 127–235. ISBN 9780128046920. [Google Scholar]
- Jones, P.G.; Thornton, P.K. The Potential Impacts of Climate Change on Maize Production in Africa and Latin America in 2055. Glob. Environ. Chang. 2003, 13, 51–59. [Google Scholar] [CrossRef]
- de Moraes Sá, J.C.; Lal, R.; Cerri, C.C.; Lorenz, K.; Hungria, M.; de Faccio Carvalho, P.C. Low-Carbon Agriculture in South America to Mitigate Global Climate Change and Advance Food Security. Environ. Int. 2017, 98, 102–112. [Google Scholar] [CrossRef] [Green Version]
- Berrang-Ford, L.; Ford, J.D.; Paterson, J. Are We Adapting to Climate Change? Glob. Environ. Chang. 2011, 21, 25–33. [Google Scholar] [CrossRef]
- Fuso Nerini, F.; Sovacool, B.; Hughes, N.; Cozzi, L.; Cosgrave, E.; Howells, M.; Tavoni, M.; Tomei, J.; Zerriffi, H.; Milligan, B. Connecting Climate Action with Other Sustainable Development Goals. Nat. Sustain. 2019, 2, 674–680. [Google Scholar] [CrossRef]
- Mabon, L.; Kondo, K.; Kanekiyo, H.; Hayabuchi, Y.; Yamaguchi, A. Fukuoka: Adapting to Climate Change through Urban Green Space and the Built Environment? Cities 2019, 93, 273–285. [Google Scholar] [CrossRef]
- Sharma, V.K.; Johnson, N.; Cizmas, L.; McDonald, T.J.; Kim, H. A Review of the Influence of Treatment Strategies on Antibiotic Resistant Bacteria and Antibiotic Resistance Genes. Chemosphere 2016, 150, 702–714. [Google Scholar] [CrossRef]
- Mostafaeipour, A.; Khayyami, M.; Sedaghat, A.; Mohammadi, K.; Shamshirband, S.; Sehati, M.A.; Gorakifard, E. Evaluating the Wind Energy Potential for Hydrogen Production: A Case Study. Int. J. Hydrogen Energy 2016, 41, 6200–6210. [Google Scholar] [CrossRef]
- Ouyang, T.; Kusiak, A.; He, Y. Predictive Model of Yaw Error in a Wind Turbine. Energy 2017, 123, 119–130. [Google Scholar] [CrossRef]
- Alavi, O.; Mostafaeipour, A.; Qolipour, M. Analysis of Hydrogen Production from Wind Energy in the Southeast of Iran. Int. J. Hydrogen Energy 2016, 41, 15158–15171. [Google Scholar] [CrossRef]
- Langodan, S.; Viswanadhapalli, Y.; Dasari, H.P.; Knio, O.; Hoteit, I. A High-Resolution Assessment of Wind and Wave Energy Potentials in the Red Sea. Appl. Energy 2016, 181, 244–255. [Google Scholar] [CrossRef]
- Fernandez-García, F. Manual de Climatologia Aplicada: Clima, Medio Ambiente Planificacion; Editorial Síntesis: Madrid, España, 1996. [Google Scholar]
- World Meteorological Organization. Guide to Climatological Practices; WMO: Geneva, Switzerland, 2011; ISBN 978-92-63-10100-6. [Google Scholar]
- Parajuli, A. A Statistical Analysis of Wind Speed and Power Density Based on Weibull and Rayleigh Models of Jumla, Nepal. Energy Power Eng. 2016, 8, 271–282. [Google Scholar] [CrossRef] [Green Version]
- Ramli, M.A.M.; Twaha, S.; Alghamdi, A.U. Energy Production Potential and Economic Viability of Grid-Connected Wind/PV Systems at Saudi Arabian Coastal Areas. J. Renew. Sustain. Energy 2017, 9, 65910. [Google Scholar] [CrossRef]
- Fenerci, A.; Øiseth, O.; Rønnquist, A. Long-Term Monitoring of Wind Field Characteristics and Dynamic Response of a Long-Span Suspension Bridge in Complex Terrain. Eng. Struct. 2017, 147, 269–284. [Google Scholar] [CrossRef]
- Méndez, C.; Bicer, Y. Qatar’s Wind Energy Potential with Associated Financial and Environmental Benefits for the Natural Gas Industry. Energies 2019, 12, 3329. [Google Scholar] [CrossRef] [Green Version]
- Minaeian, A.; Sedaghat, A.; Mostafaeipour, A.; Akbar Alemrajabi, A. Exploring Economy of Small Communities and Households by Investing on Harnessing Wind Energy in the Province of Sistan-Baluchestan in Iran. Renew. Sustain. Energy Rev. 2017, 74, 835–847. [Google Scholar] [CrossRef]
- Pishgar-Komleh, S.H.; Keyhani, A.; Sefeedpari, P. Wind Speed and Power Density Analysis Based on Weibull and Rayleigh Distributions (A Case Study: Firouzkooh County of Iran). Renew. Sustain. Energy Rev. 2015, 42, 313–322. [Google Scholar] [CrossRef]
- Pishgar-Komleh, S.H.; Akram, A. Evaluation of Wind Energy Potential for Different Turbine Models Based on the Wind Speed Data of Zabol Region, Iran. Sustain. Energy Technol. Assess. 2017, 22, 34–40. [Google Scholar] [CrossRef]
- Weerasuriya, A.U.; Tse, K.T.; Zhang, X.; Li, S.W. A Wind Tunnel Study of Effects of Twisted Wind Flows on the Pedestrian-Level Wind Field in an Urban Environment. Build. Environ. 2018, 128, 225–235. [Google Scholar] [CrossRef]
- Byrne, R.; Hewitt, N.J.; Griffiths, P.; MacArtain, P. Observed Site Obstacle Impacts on the Energy Performance of a Large Scale Urban Wind Turbine Using an Electrical Energy Rose. Energy Sustain. Dev. 2018, 43, 23–37. [Google Scholar] [CrossRef]
- Shami, S.H.; Ahmad, J.; Zafar, R.; Haris, M.; Bashir, S. Evaluating Wind Energy Potential in Pakistan’s Three Provinces, with Proposal for Integration into National Power Grid. Renew. Sustain. Energy Rev. 2016, 53, 408–421. [Google Scholar] [CrossRef]
- Bashir, M.B.A. Principle Parameters and Environmental Impacts That Affect the Performance of Wind Turbine: An Overview. Arab. J. Sci. Eng. 2021, 46, 1–19. [Google Scholar] [CrossRef]
- Pourrajabian, A.; Dehghan, M.; Rahgozar, S. Genetic Algorithms for the Design and Optimization of Horizontal Axis Wind Turbine (HAWT) Blades: A Continuous Approach or a Binary One? Sustain. Energy Technol. Assess. 2021, 44, 101022. [Google Scholar] [CrossRef]
- Manganhar, A.L.; Rajpar, A.H.; Luhur, M.R.; Samo, S.R.; Manganhar, M. Performance Analysis of a Savonius Vertical Axis Wind Turbine Integrated with Wind Accelerating and Guiding Rotor House. Renew. Energy 2019, 136, 512–520. [Google Scholar] [CrossRef]
- Nasab, N.M.; Kilby, J.; Bakhtiaryfard, L. Effect of Rotor Length on Generating Power in Horizontal Axis Wind Turbines. IOP Conf. Ser. Earth Environ. Sci. 2020, 463, 12108. [Google Scholar] [CrossRef]
- Tawfiq, K.B.; Mansour, A.S.; Ramadan, H.S.; Becherif, M.; El-Kholy, E.E. Wind Energy Conversion System Topologies and Converters: Comparative Review. Energy Procedia 2019, 162, 38–47. [Google Scholar] [CrossRef]
- Xu, W.; Li, C.C.; Huang, S.X.; Wang, Y. Aerodynamic Performance Improvement Analysis of Savonius Vertical Axis Wind Turbine Utilizing Plasma Excitation Flow Control. Energy 2022, 239, 122133. [Google Scholar] [CrossRef]
- Li, S.; Li, Y.; Yang, C.; Wang, Q.; Zhao, B.; Li, D.; Zhao, R.; Ren, T.; Zheng, X.; Gao, Z.; et al. Experimental Investigation of Solidity and Other Characteristics on Dual Vertical Axis Wind Turbines in an Urban Environment. Energy Convers. Manag. 2021, 229, 113689. [Google Scholar] [CrossRef]
- Liu, J.; Lin, H.; Zhang, J. Review on the Technical Perspectives and Commercial Viability of Vertical Axis Wind Turbines. Ocean Eng. 2019, 182, 608–626. [Google Scholar] [CrossRef]
- INEI Amazonas. Resultados Definitivos; Tomo I; Instituto Nacinal de Estadistica e Informatica (INEI): Lima, Perú, 2018; ISBN 9789892501857. [Google Scholar]
- Rascón, J.; Angeles, W.G.; Oliva, M.; Quiñones, L.; Barrena Gurbillón, M.Á. Determinación de Las Épocas Lluviosas y Secas En La Ciudad de Chachapoyas Para El Periodo de 2014–2018. Rev. Climatol. 2020, 20, 15–28. [Google Scholar]
- Mejía-Veintimilla, D.; Ochoa-Cueva, P.; Samaniego-Rojas, N.; Félix, R.; Arteaga, J.; Crespo, P.; Oñate-Valdivieso, F.; Fries, A. River Discharge Simulation in the High Andes of Southern Ecuador Using High-Resolution Radar Observations and Meteorological Station Data. Remote Sens. 2019, 11, 2804. [Google Scholar] [CrossRef] [Green Version]
- Domínguez-Castro, F.; Vicente-Serrano, S.M.; López-Moreno, J.I.; Correa, K.; Ávalos, G.; Azorin-Molina, C.; El Kenawy, A.; Tomas-Burguera, M.; Navarro-Serrano, F.; Peña-Gallardo, M.; et al. Mapping Seasonal and Annual Extreme Precipitation over the Peruvian Andes. Int. J. Climatol. 2018, 38, 5459–5475. [Google Scholar] [CrossRef]
- Sattari, M.T.; Rezazadeh-Joudi, A.; Kusiak, A. Assessment of Different Methods for Estimation of Missing Data in Precipitation Studies. Hydrol. Res. 2017, 48, 1032–1044. [Google Scholar] [CrossRef]
- Zapata-Sierra, A.J.; Cama-Pinto, A.; Montoya, F.G.; Alcayde, A.; Manzano-Agugliaro, F. Wind Missing Data Arrangement Using Wavelet Based Techniques for Getting Maximum Likelihood. Energy Convers. Manag. 2019, 185, 552–561. [Google Scholar] [CrossRef]
- R Development Core Team. R: A Language and Environment for Statistical Computing; R Development Core Team: Vienna, Austria, 2021. [Google Scholar]
- van Buuren, S.; Groothuis-Oudshoorn, K. Mice: Multivariate Imputation by Chained. J. Stat. Softw. 2011, 45, 1–67. [Google Scholar]
- Schafer, J.L. Multiple Imputation in Multivariate Problems When the Imputation and Analysis Models Differ. Stat. Neerl. 2003, 57, 19–35. [Google Scholar] [CrossRef]
- Gelman, A.; Carlin, J.B.; Stern, H.S.; Dunson, D.B.; Vehtari, A.; Rubin, D.B. Bayesian Data Analysis; CRC Press: Boca Raton, FL, USA, 2014; ISBN 9781439898208. [Google Scholar]
- Rubin, D.B. Multiple Imputation after 18+ Years MUltiple Imputation After 18+ Years. J. Am. Stat. Assoc. 1996, 91, 473–489. [Google Scholar] [CrossRef]
- Cabrera-Garcia, V.M. Aprovechamiento Energético de Los Molinos de Viento Tradicionales de Las Islas Canarias. Técnica Ind. 2017, 321, 58–66. [Google Scholar] [CrossRef]
- Carslaw, D.C.; Ropkins, K. Openair—An R Package for Air Quality Data Analysis. Environ. Model. Softw. 2012, 27, 52–61. [Google Scholar] [CrossRef]
- Dabbaghiyan, A.; Fazelpour, F.; Abnavi, M.D.; Rosen, M.A. Evaluation of Wind Energy Potential in Province of Bushehr, Iran. Renew. Sustain. Energy Rev. 2016, 55, 455–466. [Google Scholar] [CrossRef]
- Mass, C.F.; Ovens, D.; Westrick, K.; Colle, B.A. Does Increasing Horizontal Resolution Produce More Skillful Forecasts? The Results of Two Years of Real-Time Numerical Weather Prediction over the Pacific Northwest. Bull. Am. Meteorol. Soc. 2002, 83, 407–430. [Google Scholar] [CrossRef]
- Argüeso, D.; Hidalgo-Muñoz, J.M.; Gámiz-Fortis, S.R.; Esteban-Parra, M.J.; Dudhia, J.; Castro-Díez, Y. Evaluation of WRF Parameterizations for Climate Studies over Southern Spain Using a Multistep Regionalization. J. Clim. 2011, 24, 5633–5651. [Google Scholar] [CrossRef]
- Kossmann, M.; Sturman, A.P. Pressure-Driven Channeling Effects in Bent Valleys. J. Appl. Meteorol. 2003, 42, 151–158. [Google Scholar] [CrossRef]
- Cantelli, A.; Monti, P.; Leuzzi, G.; Valerio, G.; Pilotti, M. Numerical Simulations of Mountain Winds in an Alpine Valley. Wind Struct. Int. J. 2017, 24, 565–578. [Google Scholar] [CrossRef]
- Sommerfeld, M.; Crawford, C.; Monahan, A.; Bastigkeit, I. LiDAR-Based Characterization of Mid-Altitude Wind Conditions for Airborne Wind Energy Systems. Wind Energy 2019, 22, 1101–1120. [Google Scholar] [CrossRef]
- Solari, G. Wind Science and Engineering Origins, Developments, Fundamentals and Advancements; Springer Nature: Cham, Switzerland, 2019; ISBN 978-3-030-18815-3. [Google Scholar]
- Moreno, J.A.A.; Martínez, L.I.E.; Garzón, P.A.C. An Approach for the Identification of Particulate Matter in the Clouds of Bogotá Using Satellite Imagery Analysis. Ing. Y Univ. 2019, 23, 1–26. [Google Scholar] [CrossRef] [Green Version]
- Ortiz-Prado, E.; Henriquez-Trujillo, A.R.; Rivera-Olivero, I.A.; Lozada, T.; Garcia-Bereguiain, M.A. High Prevalence of SARS-CoV-2 Infection among Food Delivery Riders. A Case Study from Quito, Ecuador. Sci. Total Environ. 2021, 770, 145225. [Google Scholar] [CrossRef]
- Medina, C.; Ginn, O.; Brown, J.; Soria, F.; Garvizu, C.; Salazar, Á.; Tancara, A.; Herrera, J. Detection and Assessment of the Antibiotic Resistance of Enterobacteriaceae Recovered from Bioaerosols in the Choqueyapu River Area, La Paz—Bolivia. Sci. Total Environ. 2021, 760, 143340. [Google Scholar] [CrossRef]
- Li, C. Technical and Economic Potential Evaluation of an Off-Grid Hybrid Wind-Fuel Cell-Battery Energy System in Xining, China. Int. J. Green Energy 2021, 18, 258–270. [Google Scholar] [CrossRef]
- Aguilar-Rodríguez, C.E.; Flores-Velázquez, J.; Rojano, F.; Flores-Magdaleno, H.; Panta, E.R. Simulation of Water Vapor and near Infrared Radiation to Predict Vapor Pressure Deficit in a Greenhouse Using Cfd. Processes 2021, 9, 1587. [Google Scholar] [CrossRef]
- Rascón, J.; Gosgot Angeles, W.; Quiñones Huatangari, L.; Oliva, M.; Barrena Gurbillón, M.Á. Dry and Wet Events in Andean Populations of Northern Peru: A Case Study of Chachapoyas, Peru. Front. Environ. Sci. 2021, 9, 614438. [Google Scholar] [CrossRef]
- Waliser, D.; Guan, B. Extreme Winds and Precipitation during Landfall of Atmospheric Rivers. Nat. Geosci. 2017, 10, 179–183. [Google Scholar] [CrossRef]
- Yamada, K.; Hirasawa, N. Analysis of a Record-Breaking Strong Wind Event at Syowa Station in January 2015. J. Geophys. Res. Atmos. 2018, 123, 13643–13657. [Google Scholar] [CrossRef]
- Ali, S.; Lee, S.M.; Jang, C.M. Statistical Analysis of Wind Characteristics Using Weibull and Rayleigh Distributions in Deokjeok-Do Island—Incheon, South Korea. Renew. Energy 2018, 123, 652–663. [Google Scholar] [CrossRef]
- Hernández-Pérez, E.; Levresse, G.; Carrera-Hernández, J.; García-Martínez, R. Short Term Evaporation Estimation in a Natural Semiarid Environment: New Perspective of the Craig—Gordon Isotopic Model. J. Hydrol. 2020, 587, 124926. [Google Scholar] [CrossRef]
- Adeniji, A.E.; Olusola, O.I.; Njah, A.N. Comparative Study of Chaotic Features in Hourly Wind Speed Using Recurrence Quantification Analysis. AIP Adv. 2018, 8, 25102. [Google Scholar] [CrossRef]
- Zalakeviciute, R.; Rybarczyk, Y.; Granda-Albuja, M.G.; Diaz Suarez, M.V.; Alexandrino, K. Chemical Characterization of Urban PM10 in the Tropical Andes. Atmos. Pollut. Res. 2020, 11, 343–356. [Google Scholar] [CrossRef]
- Mohammadi-Moghadam, F.; Heidari, M.; Farhadkhani, M.; Sadeghi, M.; Forouzandeh, S.; Ahmadi, A.; Khabaz-Ghasemi, E. TSP, PM10, PM2.5, and PM1 in Ambient Air of Shahr-e Kord, Iran’s Rooftop; Levels, Characterisation and Health Risk Assessment of Particles-Bound Heavy Metals. Int. J. Environ. Anal. Chem. 2020, 100, 1–17. [Google Scholar] [CrossRef]
- Salam, M.A.; Yazdani, M.G.; Rahman, Q.M.; Nurul, D.; Mei, S.F.; Hasan, S. Investigation of Wind Energy Potentials in Brunei Darussalam. Front. Energy 2019, 13, 731–741. [Google Scholar] [CrossRef]
- Baseer, M.A.; Meyer, J.P.; Alam, M.M.; Rehman, S. Wind Speed and Power Characteristics for Jubail Industrial City, Saudi Arabia. Renew. Sustain. Energy Rev. 2015, 52, 1193–1204. [Google Scholar] [CrossRef] [Green Version]
- Choqucota, J.Q.; Huanca, E.; Holguino, A. Caracterización Del Recurso Eólico En La Ciudad de Juliaca. Rev. Investig. Altoandinas 2019, 21, 57–68. [Google Scholar] [CrossRef]
- Liang, X.; Fu, S.; Ou, B.; Wu, C.; Chao, C.Y.; Pi, K. A Computational Study of the Effects of the Radius Ratio and Attachment Angle on the Performance of a Darrieus-Savonius Combined Wind Turbine. Renew. Energy 2017, 113, 329–334. [Google Scholar] [CrossRef]
- Kaya, M.N.; Kose, F.; Ingham, D.; Ma, L.; Pourkashanian, M. Aerodynamic Performance of a Horizontal Axis Wind Turbine with Forward and Backward Swept Blades. J. Wind Eng. Ind. Aerodyn. 2018, 176, 166–173. [Google Scholar] [CrossRef] [Green Version]
- Kothe, L.B.; Möller, S.V.; Petry, A.P. Numerical and Experimental Study of a Helical Savonius Wind Turbine and a Comparison Whith a Two-Stage Savonius Turbine. Renew. Energy 2020, 148, 627–638. [Google Scholar] [CrossRef]
- Ferrari, G.; Federici, D.; Schito, P.; Inzoli, F.; Mereu, R. CFD Study of Savonius Wind Turbine: 3D Model Validation and Parametric Analysis. Renew. Energy 2017, 105, 722–734. [Google Scholar] [CrossRef]
- Zemamou, M.; Aggour, M.; Toumi, A. Review of Savonius Wind Turbine Design and Performance. In Proceedings of the Energy Procedia, Berlin, Germany, 25–29 September 2017; Volume 141, pp. 383–388. [Google Scholar]
- Balduzzi, F.; Drofelnik, J.; Bianchini, A.; Ferrara, G.; Ferrari, L.; Campobasso, M.S. Darrieus Wind Turbine Blade Unsteady Aerodynamics: A Three-Dimensional Navier-Stokes CFD Assessment. Energy 2017, 128, 550–563. [Google Scholar] [CrossRef] [Green Version]
- Mohamed, O.S.; Ibrahim, A.A.; Etman, A.K.; Abdelfatah, A.A.; Elbaz, A.M.R. Numerical Investigation of Darrieus Wind Turbine with Slotted Airfoil Blades. Energy Convers. Manag. X 2020, 5, 100026. [Google Scholar] [CrossRef]
- Chan, C.M.; Bai, H.L.; He, D.Q. Blade Shape Optimization of the Savonius Wind Turbine Using a Genetic Algorithm. Appl. Energy 2018, 213, 148–157. [Google Scholar] [CrossRef]
- Hashem, I.; Mohamed, M.H. Aerodynamic Performance Enhancements of H-Rotor Darrieus Wind Turbine. Energy 2018, 142, 531–545. [Google Scholar] [CrossRef]
- Du, L.; Ingram, G.; Dominy, R.G. A Review of H-Darrieus Wind Turbine Aerodynamic Research. Proc. Inst. Mech. Eng. Part C J. Mech. Eng. Sci. 2019, 233, 7590–7616. [Google Scholar] [CrossRef] [Green Version]
- Abdalrahman, G.; Melek, W.; Lien, F.S. Pitch Angle Control for a Small-Scale Darrieus Vertical Axis Wind Turbine with Straight Blades (H-Type VAWT). Renew. Energy 2017, 114, 1353–1362. [Google Scholar] [CrossRef] [Green Version]
- Oghoghorie, O.; Ebunilo, P.O.; Orhorhoro, E.K. Development of a Savonius Vertical Axis Wind Turbine Operated Water Pump. J. Appl. Res. Ind. Eng. 2020, 7, 190–202. [Google Scholar] [CrossRef]
- Cotrina Sánchez, D.A.; Castillo, E.B.; Rojas Briceño, N.B.; Oliva, M.; Guzman, C.T.; Amasifuen Guerra, C.A.; Bandopadhyay, S. Distribution Models of Timber Species for Forest Conservation and Restoration in the Andean-Amazonian Landscape, North of Peru. Sustainability 2020, 12, 7945. [Google Scholar] [CrossRef]
- Mori, G.M.; Castillo, E.B.; Guzmán, C.T.; Cotrina Sánchez, D.A.; Guzman Valqui, B.K.; Oliva, M.; Bandopadhyay, S.; López, R.S.; Rojas Briceño, N.B. Predictive Modelling of Current and Future Potential Distribution of the Spectacled Bear (Tremarctos Ornatus) in Amazonas, Northeast Peru. Animals 2020, 10, 1816. [Google Scholar] [CrossRef]
- Rojas Briceño, N.B.; Cotrina Sánchez, D.A.; Barboza Castillo, E.; Barrena Gurbillón, M.Á.; Sarmiento, F.O.; Sotomayor, D.A.; Oliva, M.; Salas López, R. Current and Future Distribution of Five Timber Forest Species in Amazonas, Northeast Peru: Contributions towards a Restoration Strategy. Diversity 2020, 12, 305. [Google Scholar] [CrossRef]
- Delgado, E.; Mori, G.M.; Barboza, E.; Rojas Briceño, N.B.; Guzmán, C.T.; Oliva-Cruz, M.; Chavez-Quintana, S.G.; López, R.S.; de la Lama, R.L.; Sevillano-Ríos, C.S.; et al. Effectiveness of Communal Privately Protected Areas in Montane Cloud Forests of Northern Peru. Pirineos 2021, 176, e067. [Google Scholar] [CrossRef]


Publisher’s Note: MDPI stays neutral with regard to jurisdictional claims in published maps and institutional affiliations. |
© 2022 by the authors. Licensee MDPI, Basel, Switzerland. This article is an open access article distributed under the terms and conditions of the Creative Commons Attribution (CC BY) license (https://creativecommons.org/licenses/by/4.0/).
Share and Cite
Rascón, J.; Gosgot Angeles, W.; Oliva-Cruz, M.; Barrena Gurbillón, M.Á. Wind Characteristics and Wind Energy Potential in Andean Towns in Northern Peru between 2016 and 2020: A Case Study of the City of Chachapoyas. Sustainability 2022, 14, 5918. https://doi.org/10.3390/su14105918
Rascón J, Gosgot Angeles W, Oliva-Cruz M, Barrena Gurbillón MÁ. Wind Characteristics and Wind Energy Potential in Andean Towns in Northern Peru between 2016 and 2020: A Case Study of the City of Chachapoyas. Sustainability. 2022; 14(10):5918. https://doi.org/10.3390/su14105918
Chicago/Turabian StyleRascón, Jesús, Wildor Gosgot Angeles, Manuel Oliva-Cruz, and Miguel Ángel Barrena Gurbillón. 2022. "Wind Characteristics and Wind Energy Potential in Andean Towns in Northern Peru between 2016 and 2020: A Case Study of the City of Chachapoyas" Sustainability 14, no. 10: 5918. https://doi.org/10.3390/su14105918