Article

Spatial Analysis of Environmentally Sensitive Areas to Soil Degradation Using MEDALUS Model and GIS in Amazonas (Peru): An Alternative for Ecological Restoration

by
Gerson Meza Mori
1,*,
Cristóbal Torres Guzmán
1,
Manuel Oliva-Cruz
1,
Rolando Salas López
1,
Gladys Marlo
1 and
Elgar Barboza
1,2
1
Instituto de Investigación para el Desarrollo Sustentable de Ceja de Selva (INDES-CES), National University Toribio Rodríguez de Mendoza de Amazonas (UNTRM), Chachapoyas 01001, Peru
2
Dirección de Desarrollo Tecnológico Agrario, Instituto Nacional de Innovación Agraria (INIA), Av. La Molina 1981, Lima 15024, Peru
*
Author to whom correspondence should be addressed.
Sustainability 2022, 14(22), 14866; https://doi.org/10.3390/su142214866
Submission received: 1 October 2022 / Revised: 5 November 2022 / Accepted: 8 November 2022 / Published: 10 November 2022

Abstract

:
Land degradation is a permanent global threat that requires an interdisciplinary approach to addressing solutions in a given territory. This study, therefore, analyses environmentally sensitive areas to land degradation using the Mediterranean Desertification and Land Use (MEDALUS) and Geographic Information System (GIS) method through a multi-criteria approach in the district of Florida (Peru). For the method, we considered the main quality indicators such as: Climate Quality Index (CQI), Soil Quality Index (SQI), Vegetation Quality Index (VQI), and Management Quality Index (MQI). There were also identified groups of parameters for each of the quality indicators analyzed. The results showed that 2.96% of the study area is classified as critical; 48.85% of the surface is classified as fragile; 15.48% of the areas are potentially endangered, and 30.46% are not threatened by degradation processes. Furthermore, SQI, VQI, and MQI induced degradation processes in the area. Based on the results, five restoration proposals were made in the study area: (i) organic manure production, (ii) cultivated and improved pastures and livestock improvement, (iii) native forest restoration, (iv) construction of reservoirs in the top hills and (v) uses of new technologies. The findings and proposals can be a basic support and further improved by decision-makers when implemented in situ to mitigate degradation for a sustainable use of the territory.

1. Introduction

One of the most critical global environmental problems is soil degradation [1,2]. The main causes of degradation are over-tillage, inappropriate crop rotations, overgrazing, deforestation, mining, infrastructure construction and urban sprawl [3,4]. It has been estimated that one fifth of the land is degraded and that 5–10,000 Mha are degraded per year [5,6]. This problem affects 40% of agricultural land, costing approximately USD 500 billion per year [7]. Consequently, it limits agricultural production, since, by 2050, ~70% of current agricultural production will be required to supply the world’s population [8].
In the last decade, several methodologies have been developed to identify and evaluate degraded areas. Among the most widely used methods for assessing land degradation and desertification are field studies [9]. Some studies use spectral biophysical indicators [10,11,12], but others integrate social, economic, and environmental factors [13,14]. A large number of mathematical models have also been proposed as methods for quantifying soil sensitivity to desertification and detecting areas under high vulnerability [15]. However, the Mediterranean Desertification and Land Use (MEDALUS) method, successfully developed, has been largely used to identify lands sensitive to degradation [16]. The methodology was validated and applied in Mediterranean conditions [17,18,19]. Subsequently, it has been applied in non-Mediterranean areas [20,21,22], allowing for adopting preventative measures to tackle degradation process [23]. An integrated representation of land degradation processes can be achieved using qualitative and quantitative methods [9,24]. Thus, the use of geographic information system (GIS) tools and remote sensing (RS) techniques, key for soil assessment, enables the analysis, assessment, monitoring, and representation of degraded soil dynamics [25].
Peru is also affected by land degradation; as of recent data, one-third of its population works in the agricultural sector, with a 29.6% contribution to the gross domestic product (GDP) [26,27]. Traditional agricultural practices, which include slash-and-burn activities, have a negative impact on soil quality [28,29]. In Peru, overgrazing, mining, and forest fires are the drivers for about 180,123.79 km2 of land degradation [30], and this problem spreads throughout the country [31,32,33,34,35,36,37,38,39,40]. In the department of Amazonas in 2020, 115.72 km2 was deforested, and 10878.04 km2 was degraded [30,41]. Experiences have been documented and guidelines implemented for forest restauration in degraded ecosystems [42,43,44,45,46]. However, further efforts to estimate degradation require an in-depth process with a multi-criteria approach, such as MEDALUS [47]. Notwithstanding, reducing degradation risks is a difficult and complex process, especially in small areas [15].
In this research work, we applied the MEDALUS methodology to analyze environmentally sensitive areas to soil degradation in the district of Florida (Amazonas, Peru). For this purpose, (i) we evaluated environmentally sensitive areas to degradation; (ii) we applied four main indices of the original MEDALUS method: climate quality index (CQI), soil quality index (SQI), vegetation quality index (VQI), and management quality index (MQI); (iii) we analyzed the possible causes of land degradation; and (iv) we aim to contribute with ecological restoration strategies in Amazonas lands.

2. Materials and Methods
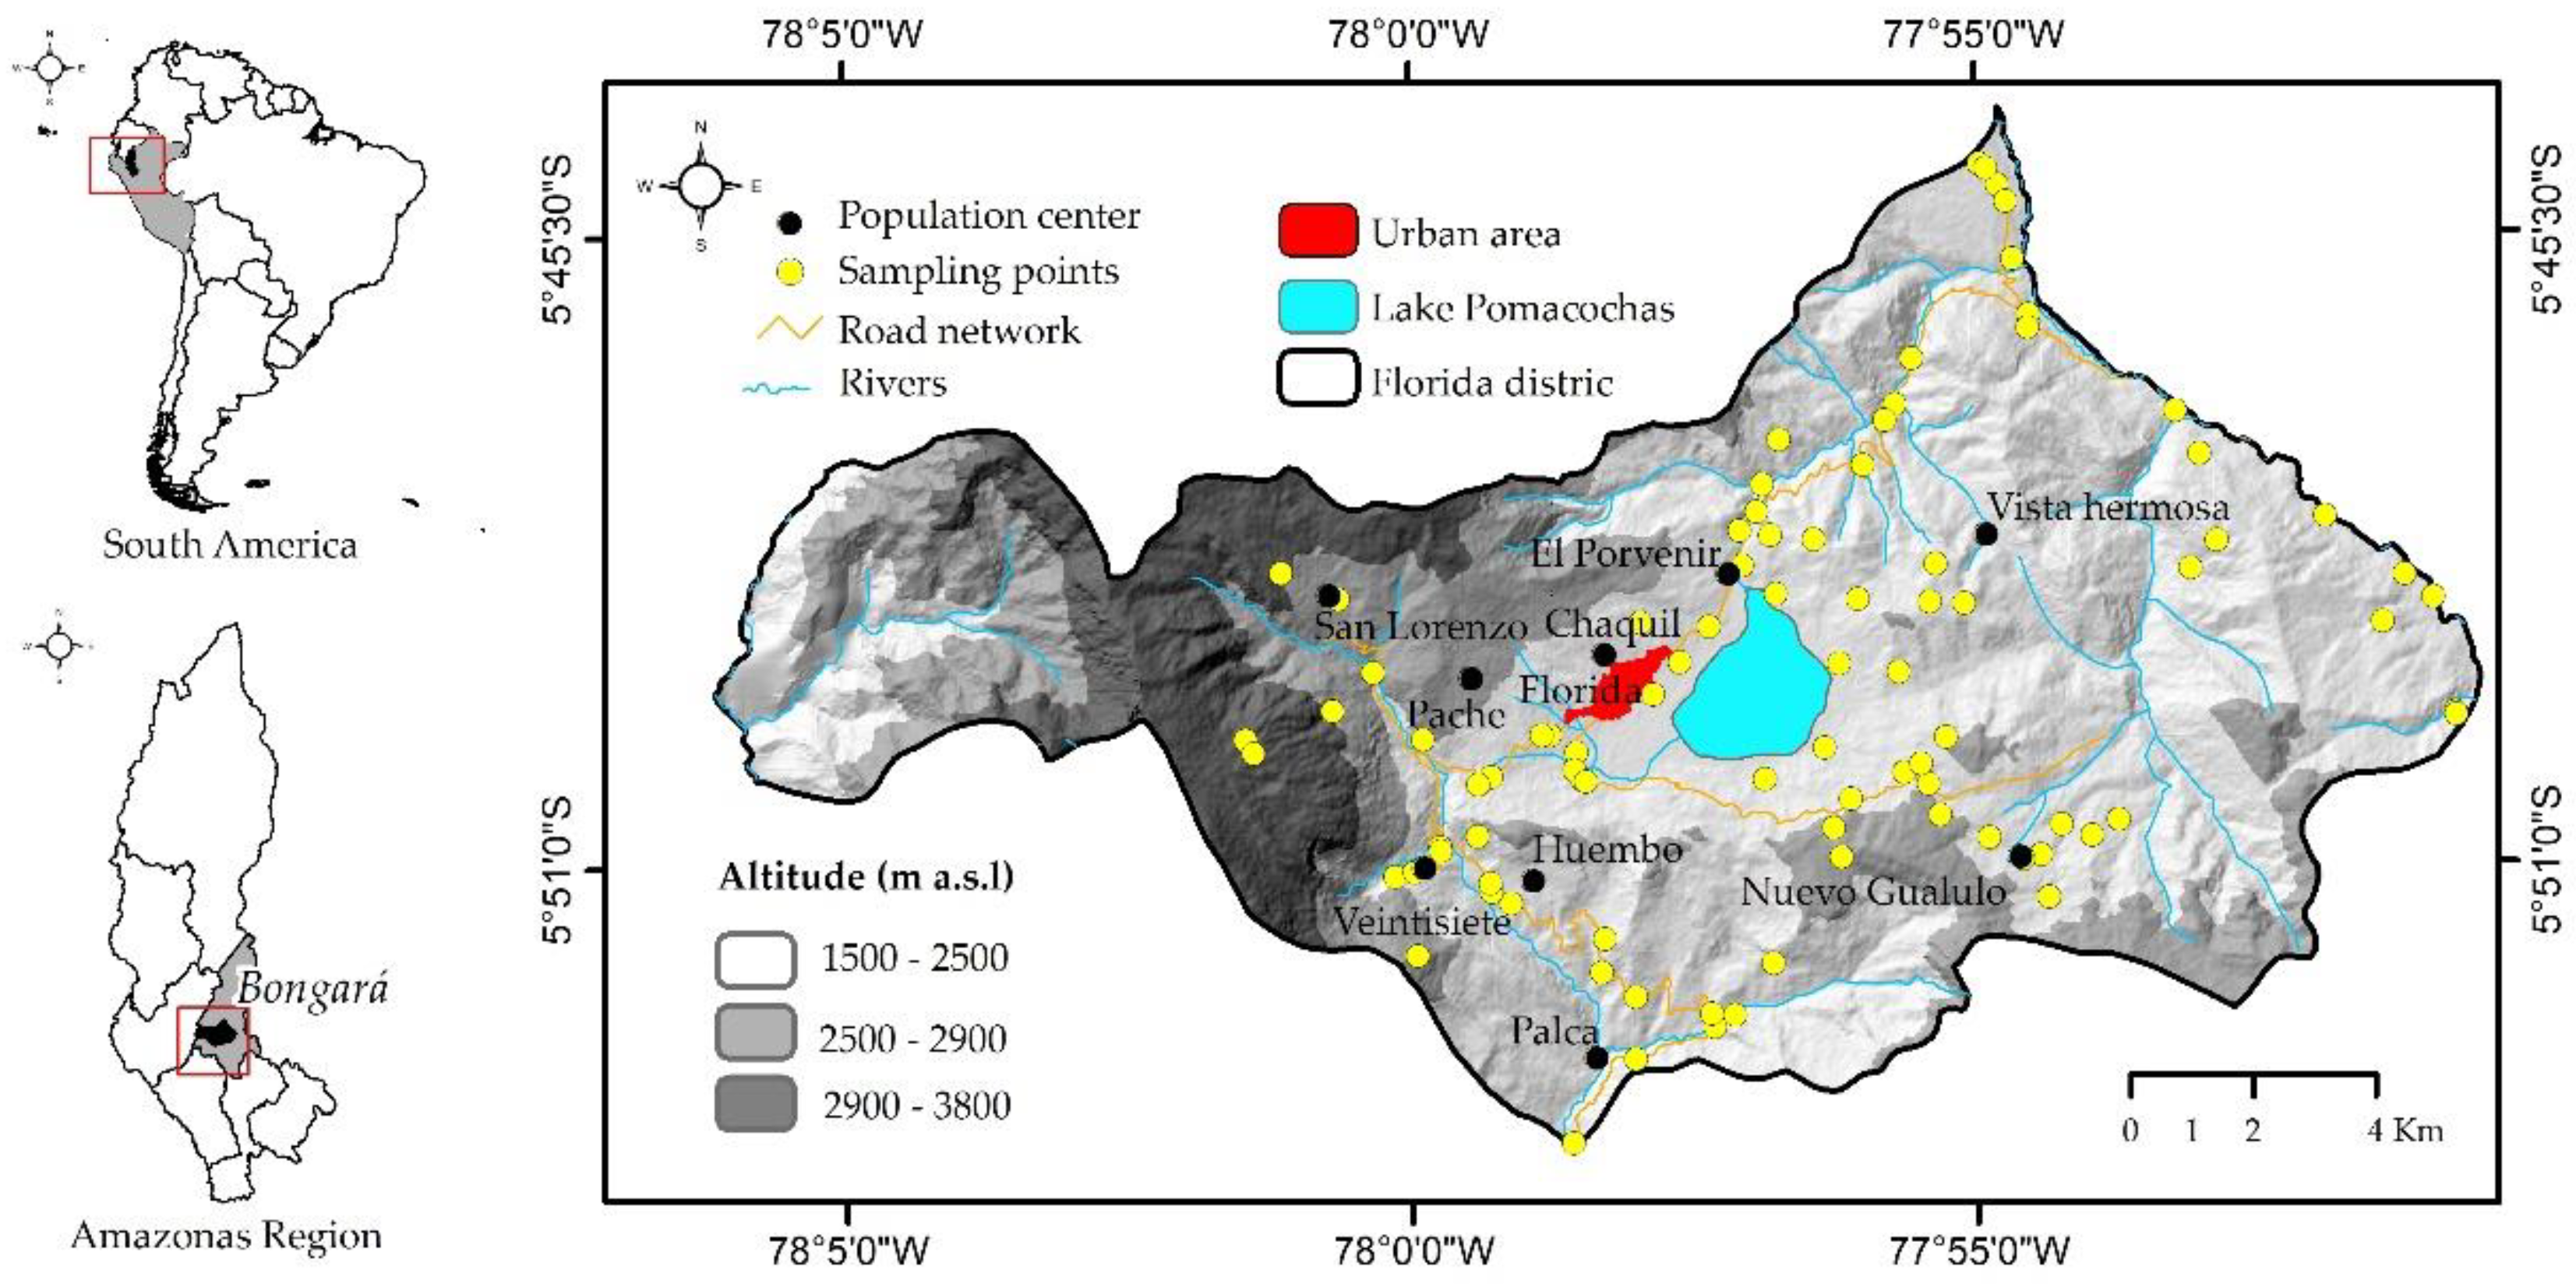
2.1. Study Area

The district of Florida is located in northern Peru between parallels 5°45′25″ and 5°60′ South latitude and meridians 77°51′ and 78°8′ West longitude, in the province of Bongará in the southeast of the department of Amazonas (Figure 1). The study area covers 222.40 km2, at an altitude of 1500 to 3800 m a.s.l. The climate is characterized by a humid tropical climate with average annual temperature and precipitation between 14.3–17 °C and 682–1092 mm, respectively, and a relative humidity of 87% [48]. There are two distinct seasons during the year, the dry season from May to October and the wet season from November to April [49,50]. The physiography is characterized by high mountains with steep to extremely steep slopes [51]. In turn, the vegetation cover is represented by altimontane forest, montane forest, and jalca formation [52]. The soil type is developed on residual sandstone and limestone materials with AC profiles from medium to moderate texture and pH between 4.5 to 7.0 (Condor and Apurimac Series) and ABC profiles with medium to moderately fine texture, good drainage, and strongly acidic pH (3.9 to 4.8) (Calera I-Pillualla and Calera I-Teata Associations) [53].
In the most recent census conducted by the Statistics and Informatics Institute (INEI), Florida district had a total population of 5999 inhabitants, distributed among 2117 homes [54]. Most of the population here depend on livestock and agriculture for their livelihoods [31,55], especially the production of dairy products, which are distributed to local and regional markets [48]. These activities lead to deforestation, overgrazing, soil degradation, and water pollution [31,56,57], causing the significant loss of biodiversity; in fact, between 2001 and 2019, around 2270 m2 ha was deforested, causing land degradation [41]. This is a consequence of agricultural expansion, the installation of new pasture areas, and the immigration of people to the area mainly from Cajamarca [31,48].

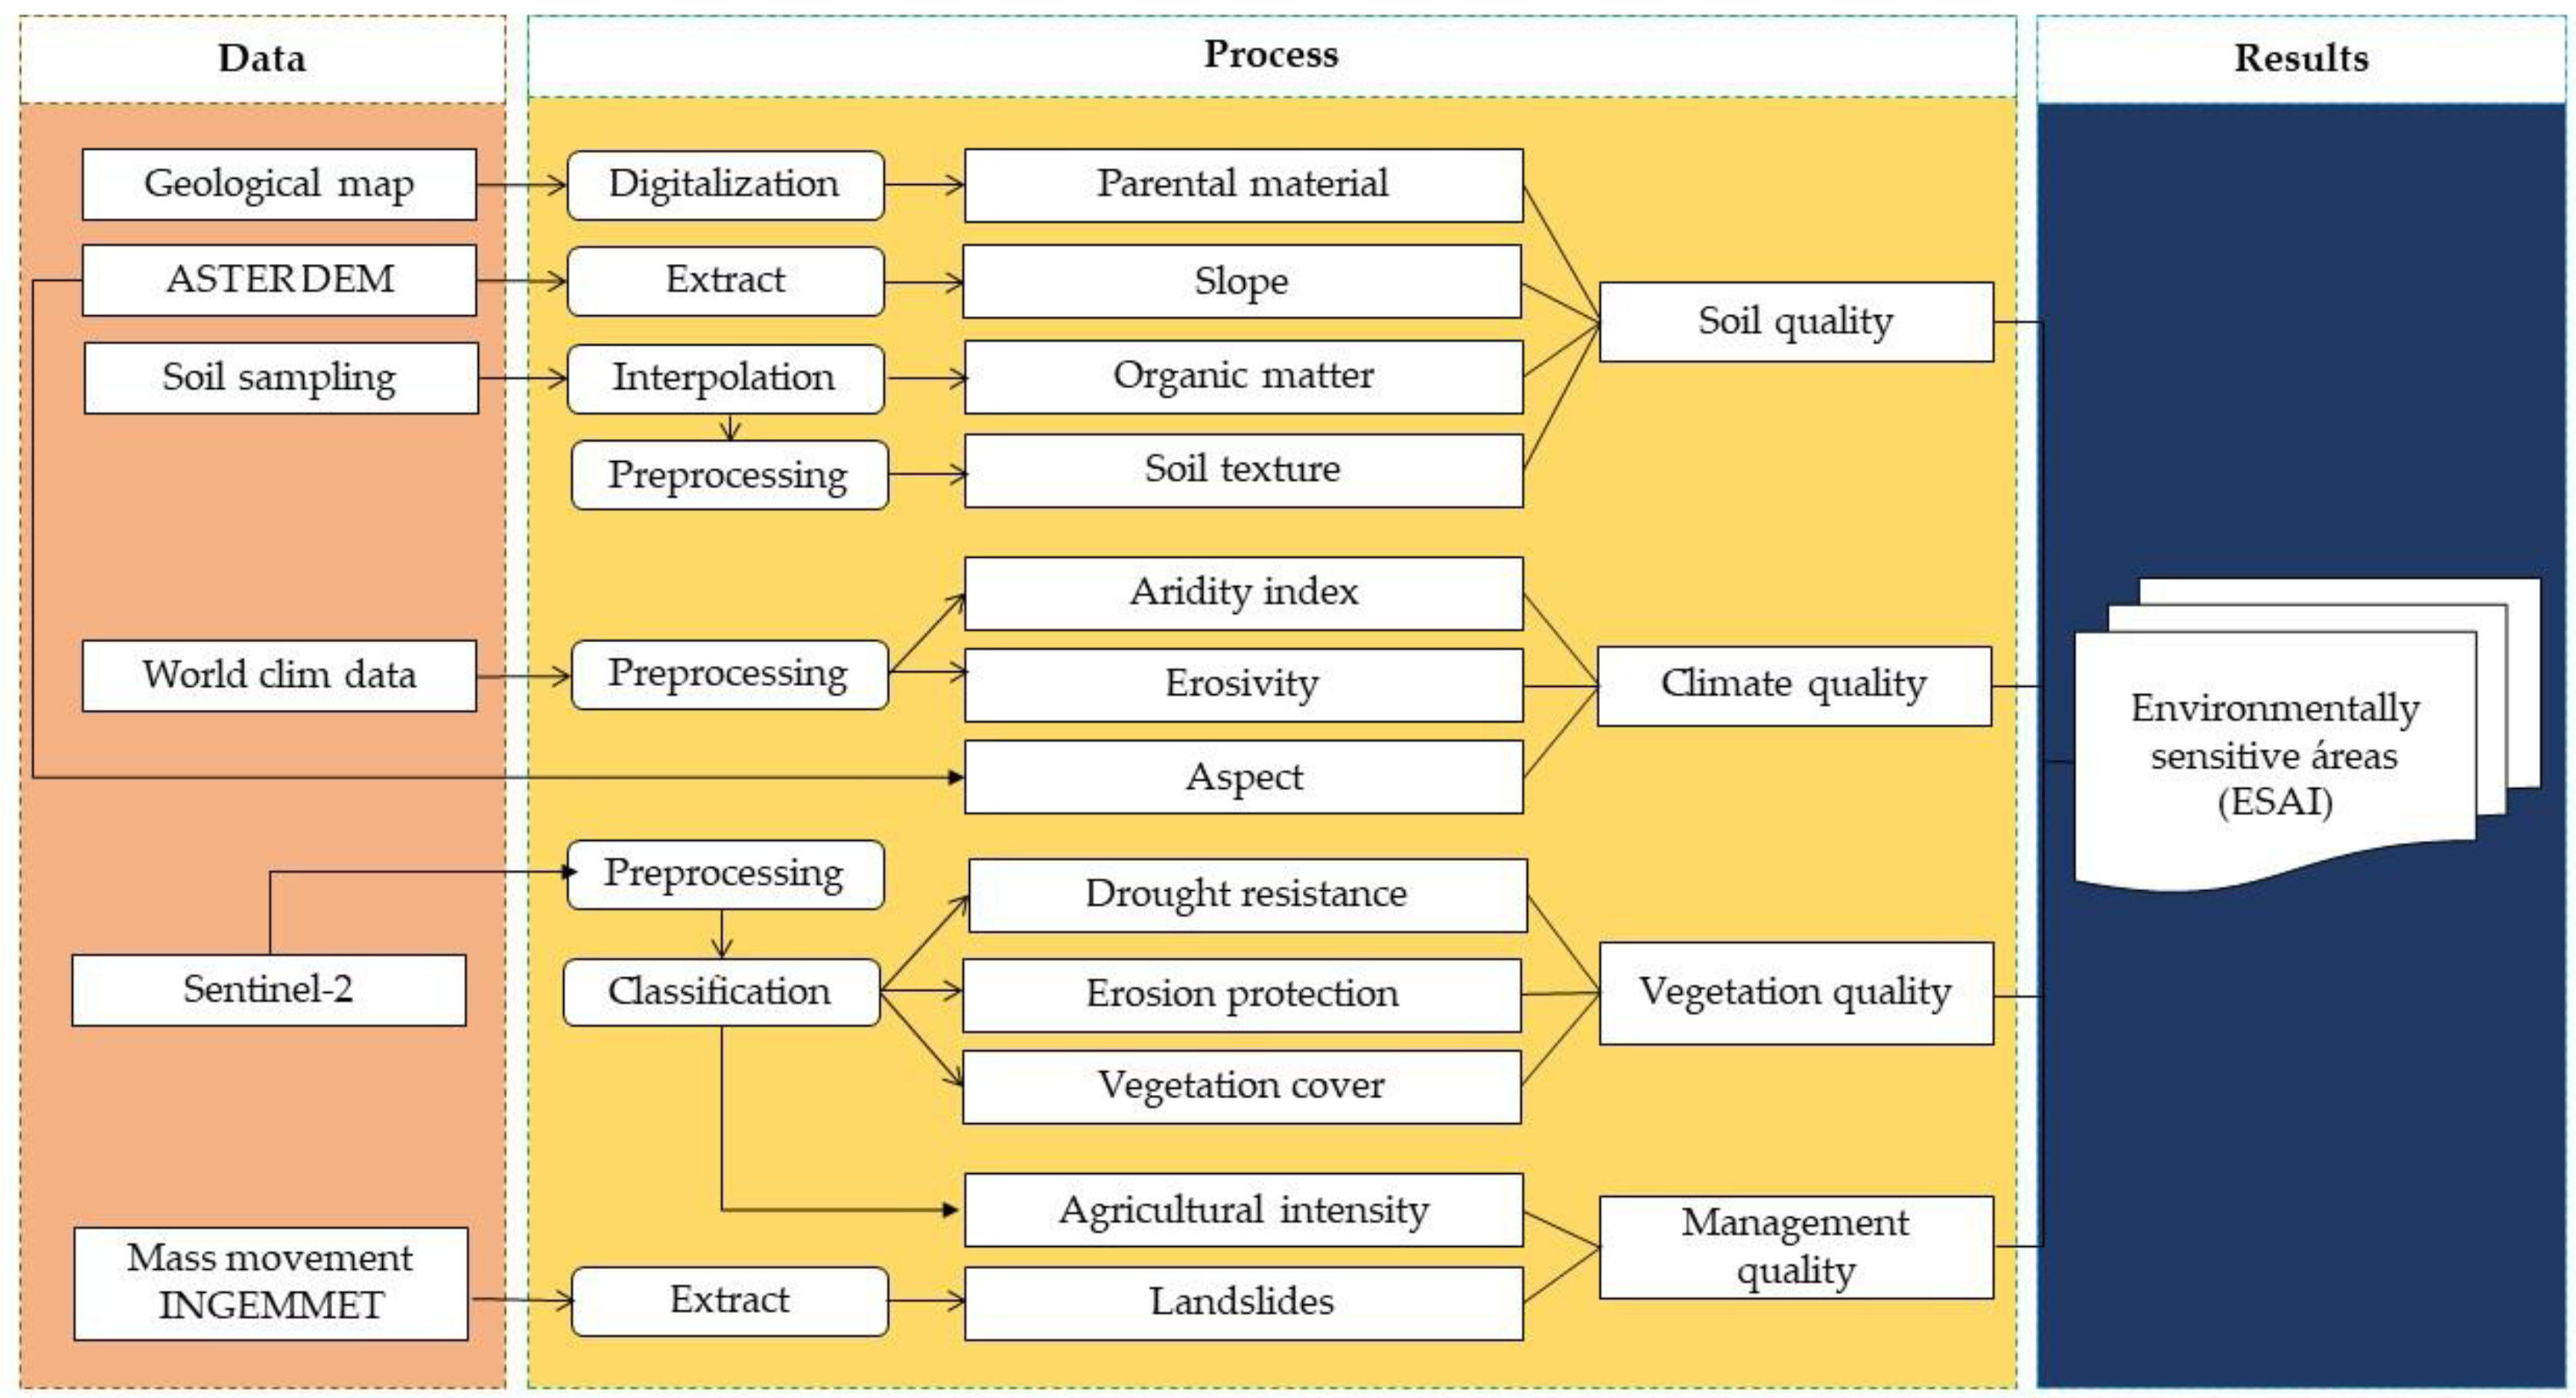
2.2. Data Used and Processing

To generate the mapping of environmentally sensitive areas susceptible to degradation in district Florida, the ASTER digital elevation model (DEM), obtained from (https://lpdaac.usgs.gov/, accessed on 16 June 2022) with a spatial resolution of 30 m, was used with an accuracy of ±16 m [58]. The DEM generated the slope and terrain aspect.
For the calculation of the aridity index and erosivity, raster data of monthly precipitation from 1970 to 2000 with a spatial resolution of 1 km2 were used [59], available at (http://www.worldClim.org, accessed on 29 May 2022). The geological map was obtained from the Amazonas Ecological Economic Zoning (ZEE-A) [60]. The map regarding mass movement susceptibility was obtained from the Geological, Mining and Metallurgical Institute (INGENMET) [61]. We used a Sentinel-2 space satellite image, obtained from the United States Geological Survey (USGS) website (https://earthexplorer.usgs.gov/, accessed on 5 April 2022), to generate the coverage map. The image was acquired on 2 August 2019. Automatic supervised classification using the maximum likelihood algorithm with ArcGIS version 10.5 was used [31,32,62,63]. Therefore, coverages were classified into five classes, namely, urban area, grassland, pasture and crops, water bodies, and forests. Thematic accuracy was evaluated based on 210 validation points, randomly distributed for each class and the whole study area, obtaining a kappa index of 92%.
Soil organic matter (SOM) and textural class layers were generated from specific data of 91 arable land samples collected in field sampling (Figure 1). The approximate arable sampling depth was 25 cm. The samples were distributed according to the variability of the physiographic units, accessibility to the area and based on the regulations (D.S. N° 13-2010-AG), a document for soil sampling by the Ministry of Agriculture (MINAGRI) [64] in Peru. These samples were analyzed at the Water and Soil Research Laboratory (LABISAG) of the National University Toribio Rodríguez de Mendoza de Amazonas (UNTRM). Then, the results of the SOM samples were interpolated by the Ordinary Kriging (OK) method using the geostatistical analysis extension of ArcGIS 10.5 based on three models Gaussian, spherical and exponential [65,66,67,68,69,70]. Cross-validation statistically reported that the Gaussian model achieved the best results with a with a coefficient of determination (R2) of 0.04 and root mean squared error (RMSE) of 1.85. On the other hand, to determinate textural class, sand, silt, and clay data were individually interpolated with the Gaussian model and then integrated into the QGIS 3.12 raster calculator to obtain the textural class [71]. In sum, 12 thematic layers were constructed (constituent parameters of the indicators) and classified as stated in the United States Department of Agriculture (USDA) at a spatial resolution of 30 m.

2.3. Methodology

MEDALUS, a successful tool for assessing, mapping, and identifying environmentally sensitive areas (ESAs), using the environmentally sensitive areas index (ESAI), was employed for this methodology [15,23]. The simplicity and flexibility of the model allows for adjusting or changing the number of indicators (parameters or variables) to be used to assess the quality [9,15,18,22,47,72,73]. In that sense, users can easily add and adjust further spatial factors according to local conditions [15,23]. It is calculated according to the geometric mean value of indices SQI, CQI, VQI, and MQI. Figure 2 shows the Methodological flowchart used to evaluate Environmentally Sensitive Areas to degradation in Florida district.

2.3.1. Soil Quality Index

Desertification and land degradation are determined by the cohesive strength between soil particles, water retention capacity, level of development of the surface horizon, texture, and structure [74]. The soil quality involves measuring fertility and predisposition to be preserved against climate hazards using agricultural techniques and intrinsic characteristics [46,74]. Therefore, to determine the SQI, four parameters were considered and evaluated, three soil characteristics (parent material, soil texture, and topsoil organic matter) and topography (slope), the result was obtained by geometric mean (Table 1). Scores were then assigned to each parameter [16,21,75]. The SQI, finality, was calculated using the following Equation (1):
SQI = (parent material × slope × soil organic matter × soil texture)1/4

2.3.2. Climate Quality Index

The CQI reflects the impact of climatic variation on land degradation and desertification, where precipitation, the most important factor, influences drainage and soil water capacity [16,76,77]. To determine this index, three parameters were evaluated: aridity, soil erosion, and aspect indices (Table 2): namely the aridity index, which influences the availability of water for plants [16]; soil erosion, which is the estimate of the aggressiveness of rainfall [23]; and aspect, which is driven by the distribution of solar irradiation surface temperatures. The three have important effects on vegetation growth and the rate of soil erosion [76,78]. Each parameter was measured in the following way:

Aridity Index

The aridity index (AI) was estimated using the following Equation (2), set by the United Nations Environment Programme (UNEP) [79], where P is mean annual precipitation and PET is potential evapotranspiration, calculated by the method of Thornthwaite.
AI = P/PET

Soil Erosion

It was estimated according to the modified Fournier index (MFI) [80] by the following Equation (3) where Pi is monthly precipitation and P is annual precipitation.
MFI = i   1 12 P i 2 / P
Finally, descriptions and scores of the climate quality parameters were assigned [20,22,23]. The CQI was calculated using the following Equation (4).
CQI = (Aridity index × erosivity × aspect)1/3

2.3.3. Vegetation Cover Index

Vegetation makes a vital contribution to preventing landslides by fixing soil with the root system [81] and by rain obstruction with foliage [82]. Vegetation thus reduces the impact of raindrops and runoff, promoting water infiltration, enriches the soil surface with organic matter, and improves its structure and cohesion [74]. In that sense, to determine the VQI, three parameters were considered and evaluated (Table 3): drought resistance, which directly indicates the ability of an ecosystem to adapt to climatic aridity and severe drought events [78]; erosion protection, which is provided by plants against soil erosion; and vegetation cover, which reduces runoff and loss of sediment [23]. Descriptions and quality scores for the three parameters of vegetation quality were assigned according to Pravalie et al. [22]. The VQI was obtained using the Equation (5).
VQI = (Drought resistance × Erosion protection × Vegetation cover)1/3

2.3.4. Management Quality Index

The MQI assesses the anthropogenic impact on the environment through the various anthropogenic activities (overgrazing, water supply, and agriculture), which lead to land degradation and desertification [9,22]. The MQI was calculated by combining agricultural intensity and landslide (Table 4). The latter proposed by Momirović et al. [23] and the hazard/susceptibility assessment thereof. Descriptions and quality scores for the MQI parameters were assigned as follows: for agricultural intensity according to Salvati and Bajocco [19] and Pravalie et al. [22] and for landslide according to Momirović et al. [23]. The MQI was evaluated as the product of the aforementioned parameters using Equation (6).
MQI = (agricultural intensity × Landslides)1/2

2.3.5. Environmentally Sensitive Areas (ESA)

The environmentally sensitive areas (ESA) to degradation were determined using SQI, CQI, VQI, and MQI, which were integrated in the QGIS raster calculator. The environmentally sensitive areas index (ESAI) of the studied area was calculated from Equation (7) based on the MEDALUS approach [16]: Finally, correlations were calculated between indices (SQI, CQI, VQI and MQI) using the Band Collection Statistics tool in ArcGIS [23,83].
ESAI = (SQI × CQI × VQI × MQI)1/4

3. Results

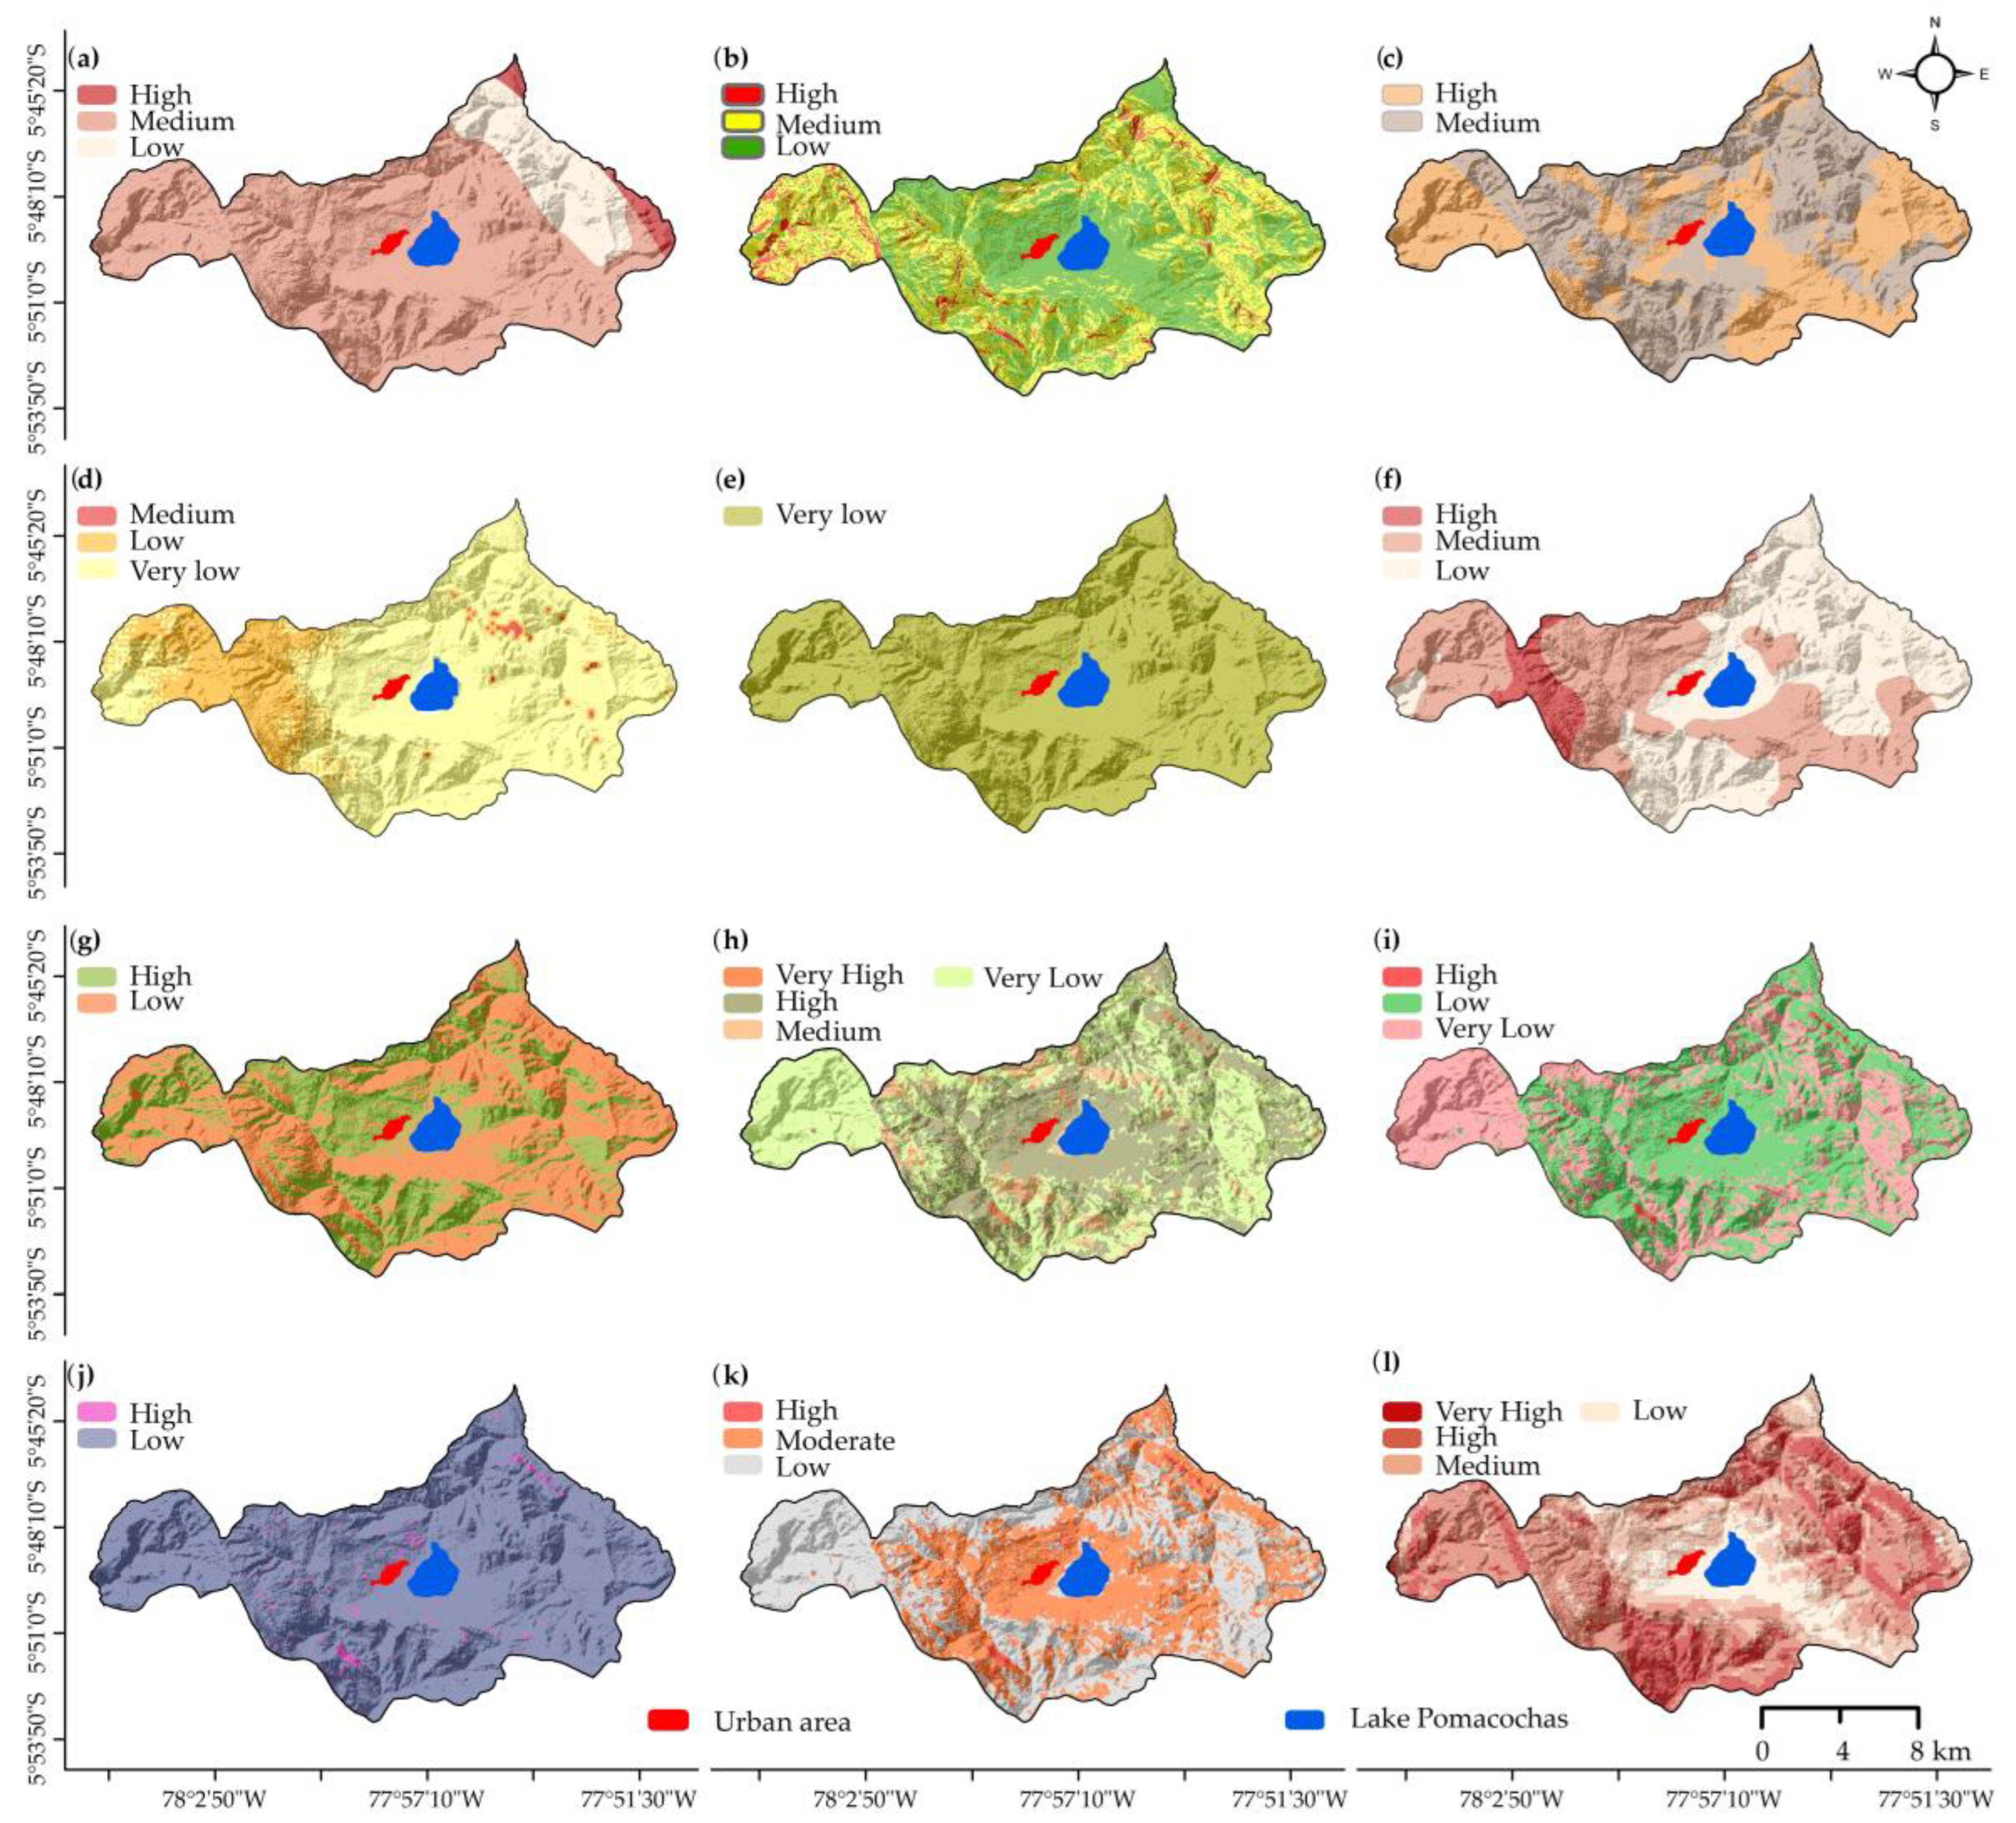
3.1. Spatial Assessment of Constituent Parameters of Quality Indicators

Figure 3 show the 12 geographic parameters processed. It highlights significant spatial differences in terms of land sensitivity to degradation in the study area. The constituent parameters in SQI were shaped by the geology that was represented by Mitu Group, which are reddish layers composed of reddish-toned sandstone conglomerates (Figure 3a). On the other hand, the slope presented gradients ranging from flat to very steep (Figure 3b). In the study area, the organic matter content was distributed from very low to high (Figure 3c). Soil texture was largely sandy clay loam (in the center-east in the study area), with fine granular structure and moderately slow permeability (Figure 3d).
As for the CQI constituent parameters, the study area is characterized by continuous rainfall, consequently, and the area is classified as nonarid (Figure 3e); however, the aggressiveness of rainfall generates low to high erosivity (Figure 3f). Aspect classes varied from low to high, which has a positive impact on vegetation growth but facilitates erosion (Figure 3g). Meanwhile, the VQI parameters, as expected, reflect the fact that due to agricultural and livestock practices, there is limited protection against erosion (Figure 3i) as a result of loss of vegetation (Figure 3j), generating low resistance to drought (Figure 3h). Finally, among the MQI parameters, the agricultural intensity, largely rated as moderate (Figure 3k), positively affects the susceptibility of the land to landslides (Figure 3l).

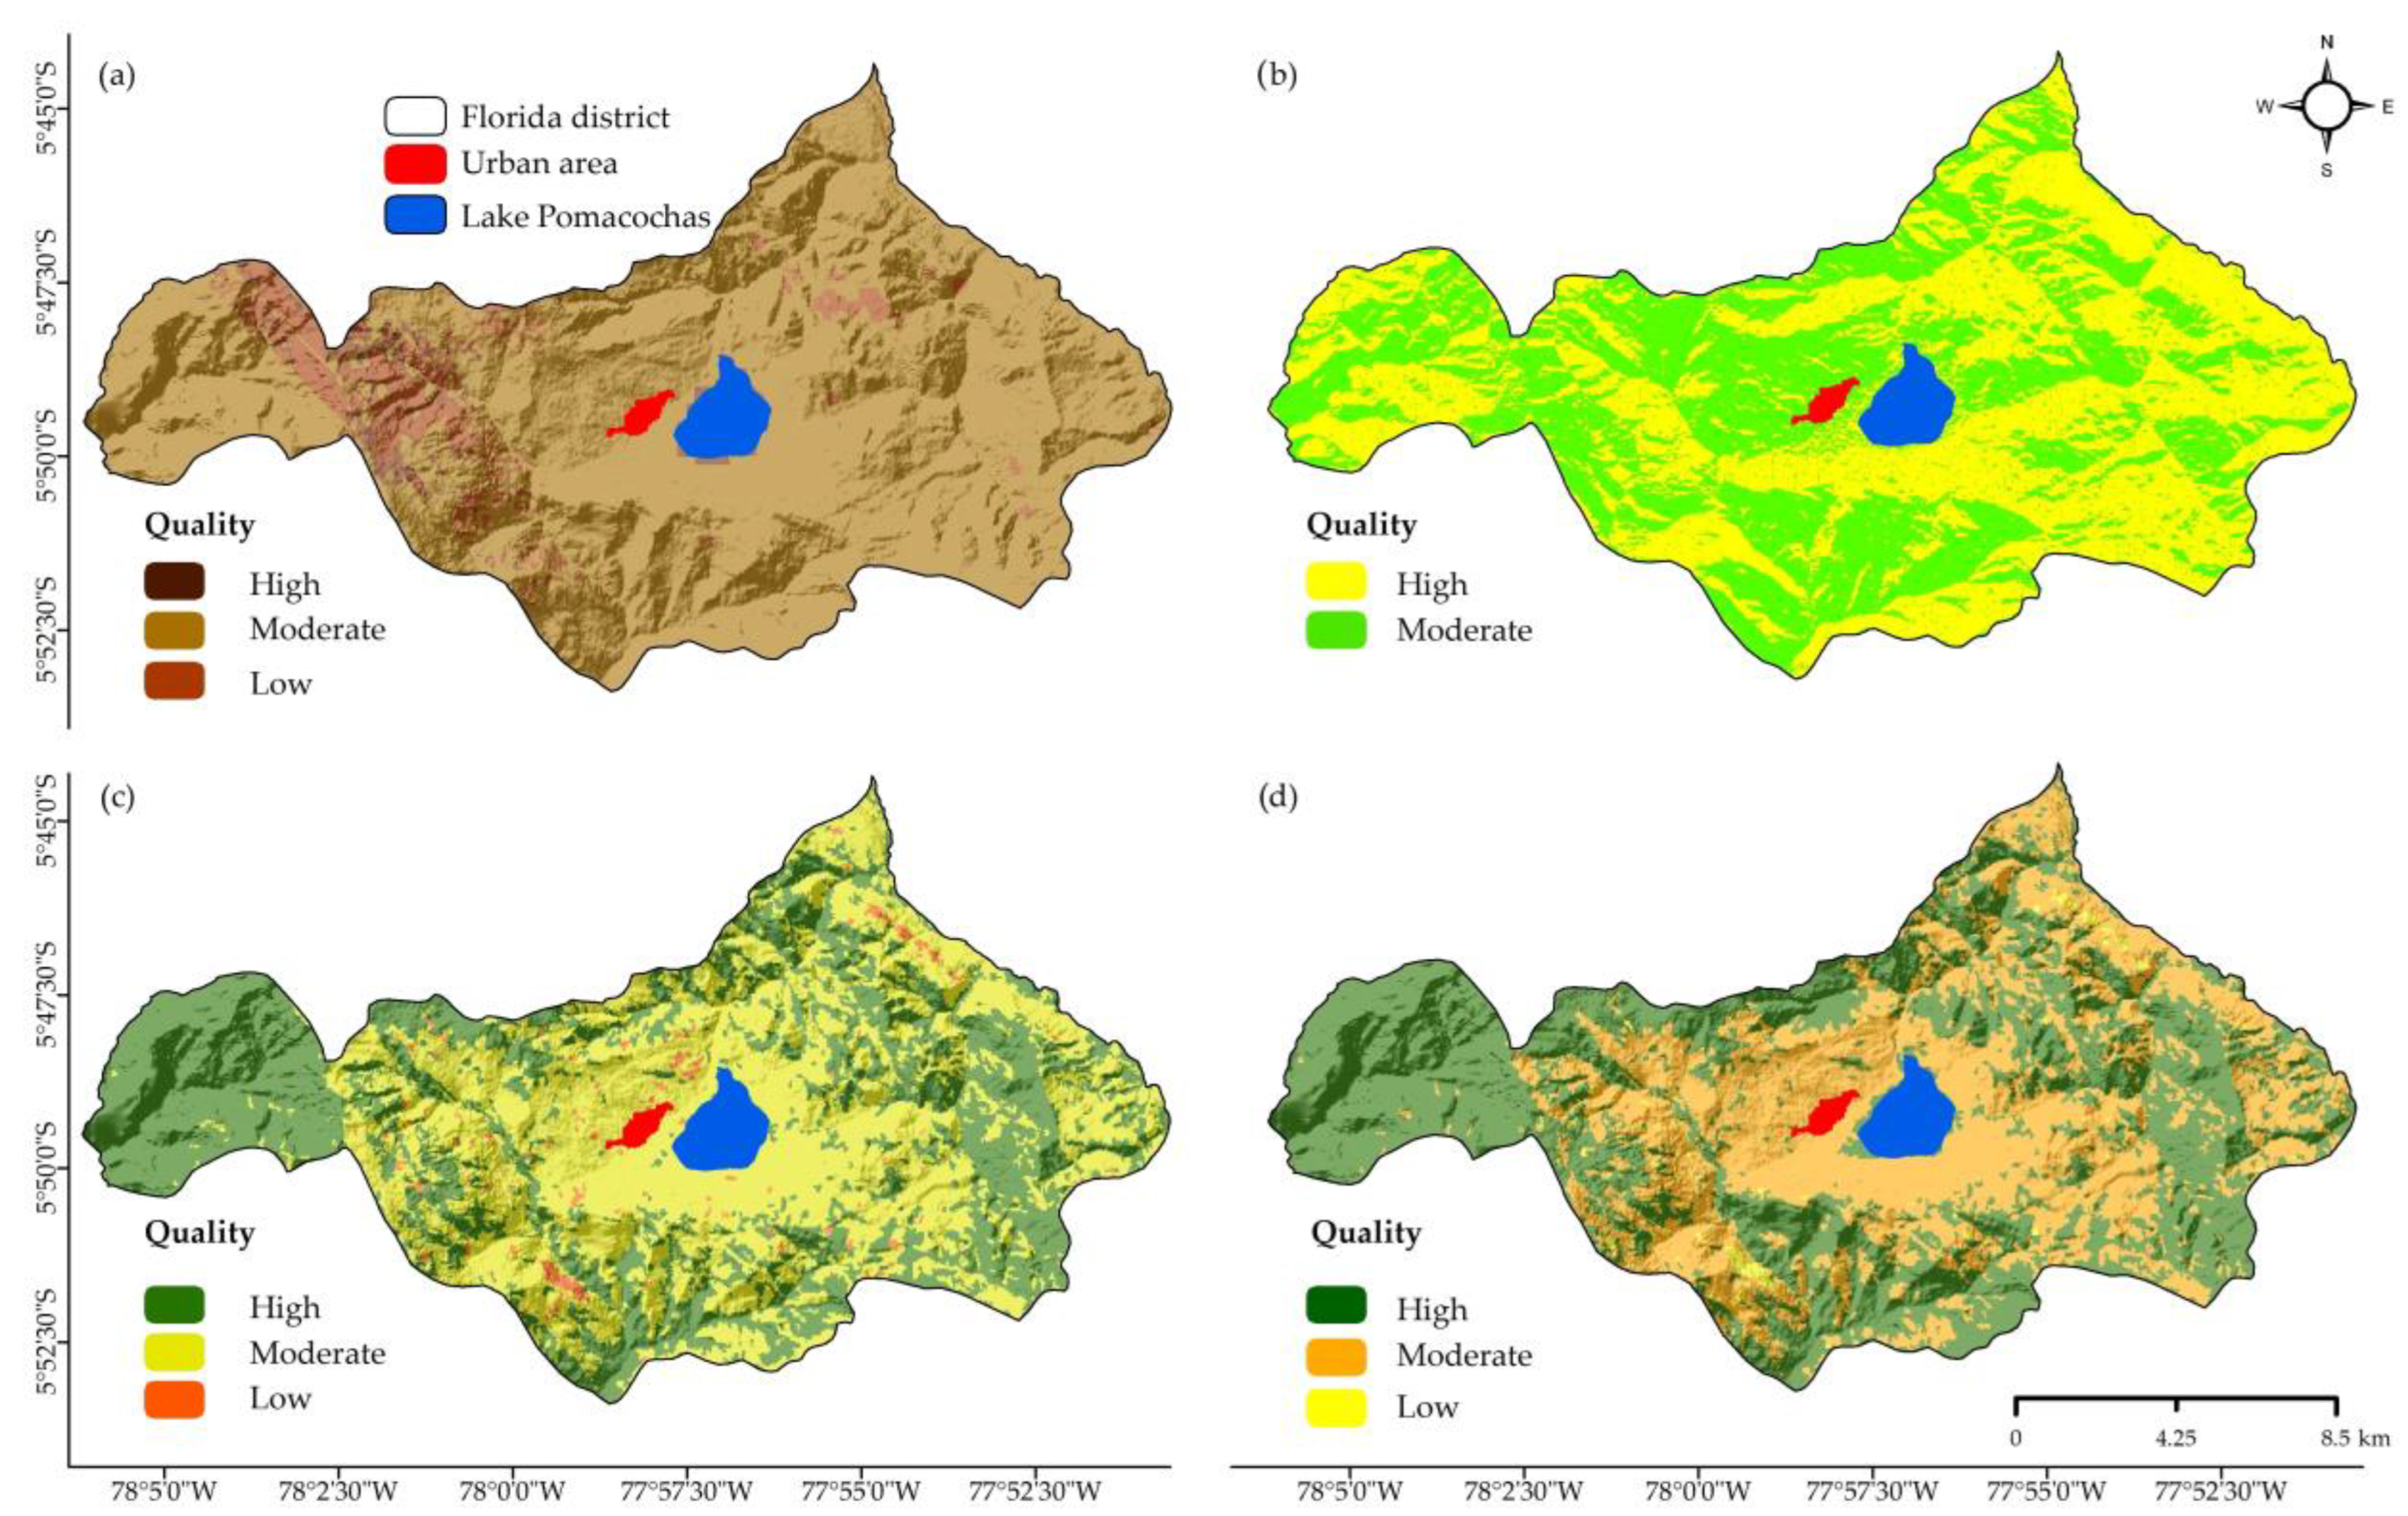
3.2. Spatial Assessment of Quality Indicators

Based on the 12 geographic parameters processed (Figure 3), the 4 quality indicators (SQI, CQI, VQI, and MQI) were obtained (Table 5 and Figure 4). The first indicator, SQI of the total area 88.61% (197.07 km2), is of moderate quality, followed by low quality of 6.99% (15.54 km2) and high quality of 2.16% (4.8 km2) (Table 5). Moderate quality covers mainly areas of extensive agriculture and livestock farming, distributed in the west and central-east of the study area (Figure 4a), with low quality and high quality throughout the west. The CQI analysis revealed that in the study area, 52.14% (115.97 km2) was of high quality, and 45.61% (101.44 km2) was of moderate quality in relation to the total area (Table 5).
The indicator CQI showed moderate to high quality and was distributed in the west and east throughout the study area (Figure 4b). Therefore, this indicator may contribute less to the aridity process, which is confirmed by the limited presence of the low class in the CQI.
The vegetation quality assessed using the VQI (Figure 4c), reported from the total area that 50.88% (113.16 km2) was of moderate quality, 45.43% (101.03 km2) was high quality, and 1.45% (3.22 km2) of low quality (Table 5). Moderate quality zones, therefore, are exposed to degradation; most of this land is used for agriculture and livestock farming. While the high-quality zones is extended by forests with little anthropic intervention, the low-quality zones are characterized by barren lands and rainfed crops.
The MQI of the study area, 53.22% (118.37 km2), is characterized by forested areas with fragments of small crops (Figure 4d). 43.69% (97.17 km2) of the territory presents moderate management and is generally located in pastures and crops. On the other hand, only 0.84% (1.88 km2) reports low management quality and is located in barren soils and urban crops.

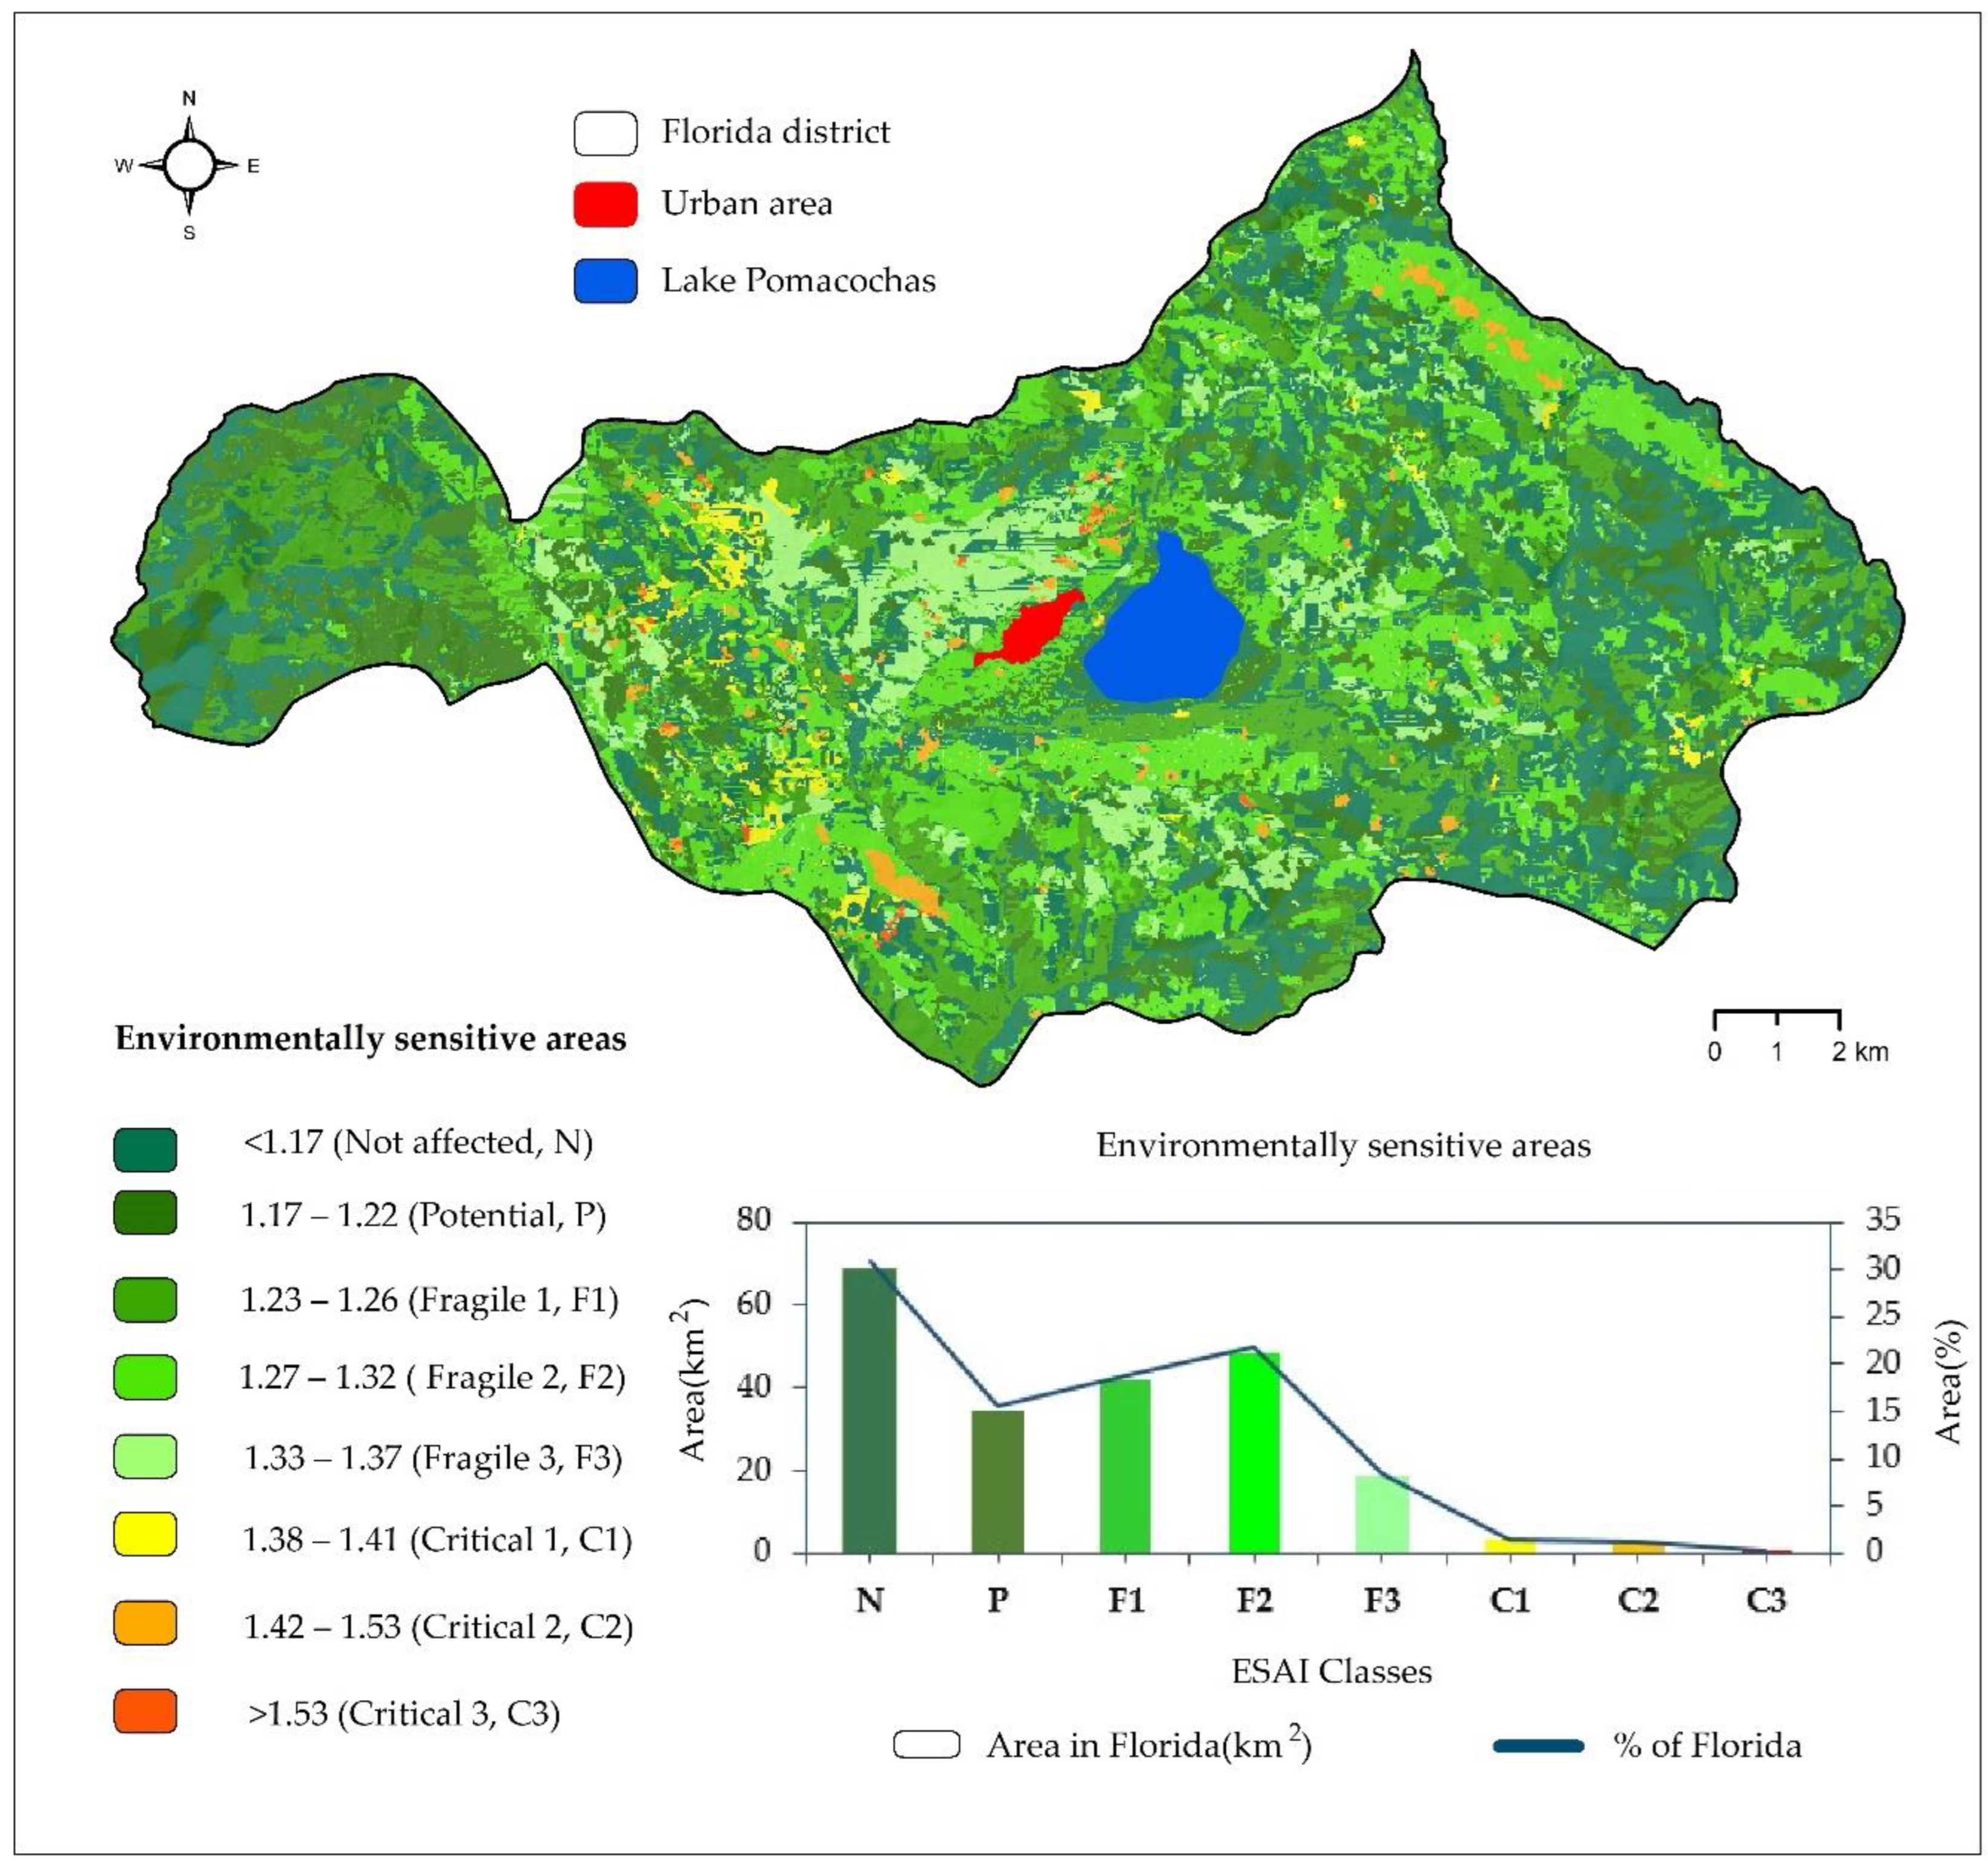
3.3. Environmentally Sensitive Area Index (ESAI)

The spatial analysis of the ESAI final product of the four indices (SQI, CQI, VQI, and MQI) pointed out lands highly sensitive to degradation throughout the study area. The areas in the critical classes (C1, C2, and C3) represented 2.96% with scores > 1.38 and clearly are of great importance in terms of sensitivity to degradation (Figure 5 and Table 6).
The fragile class (F1, F2, and F3) covers the most area, 108.65 km2 (48.85%), with respect to the other classes, while the potential class (P) covers 15.48% and the non-affected class (N) covers about 30.46% areas in Florida (Figure 5). The water body (lake Pomacochas) and urban area, which represent 1.91% and 0.33%,, respectively, were not included in the calculation.
In critical areas we found bare soils, non-irrigated crops, eroded soils and abandoned lands, while the fragile class, spread both in the flat parts and largely throughout the study territory, were found mainly on agricultural and livestock lands. Meanwhile, in the potential class areas, there are small patches of natural vegetation and occasional silvopastoral systems. Finally, the non-affected areas with no intervention at all included forests distant from urban populations or on steep slopes.

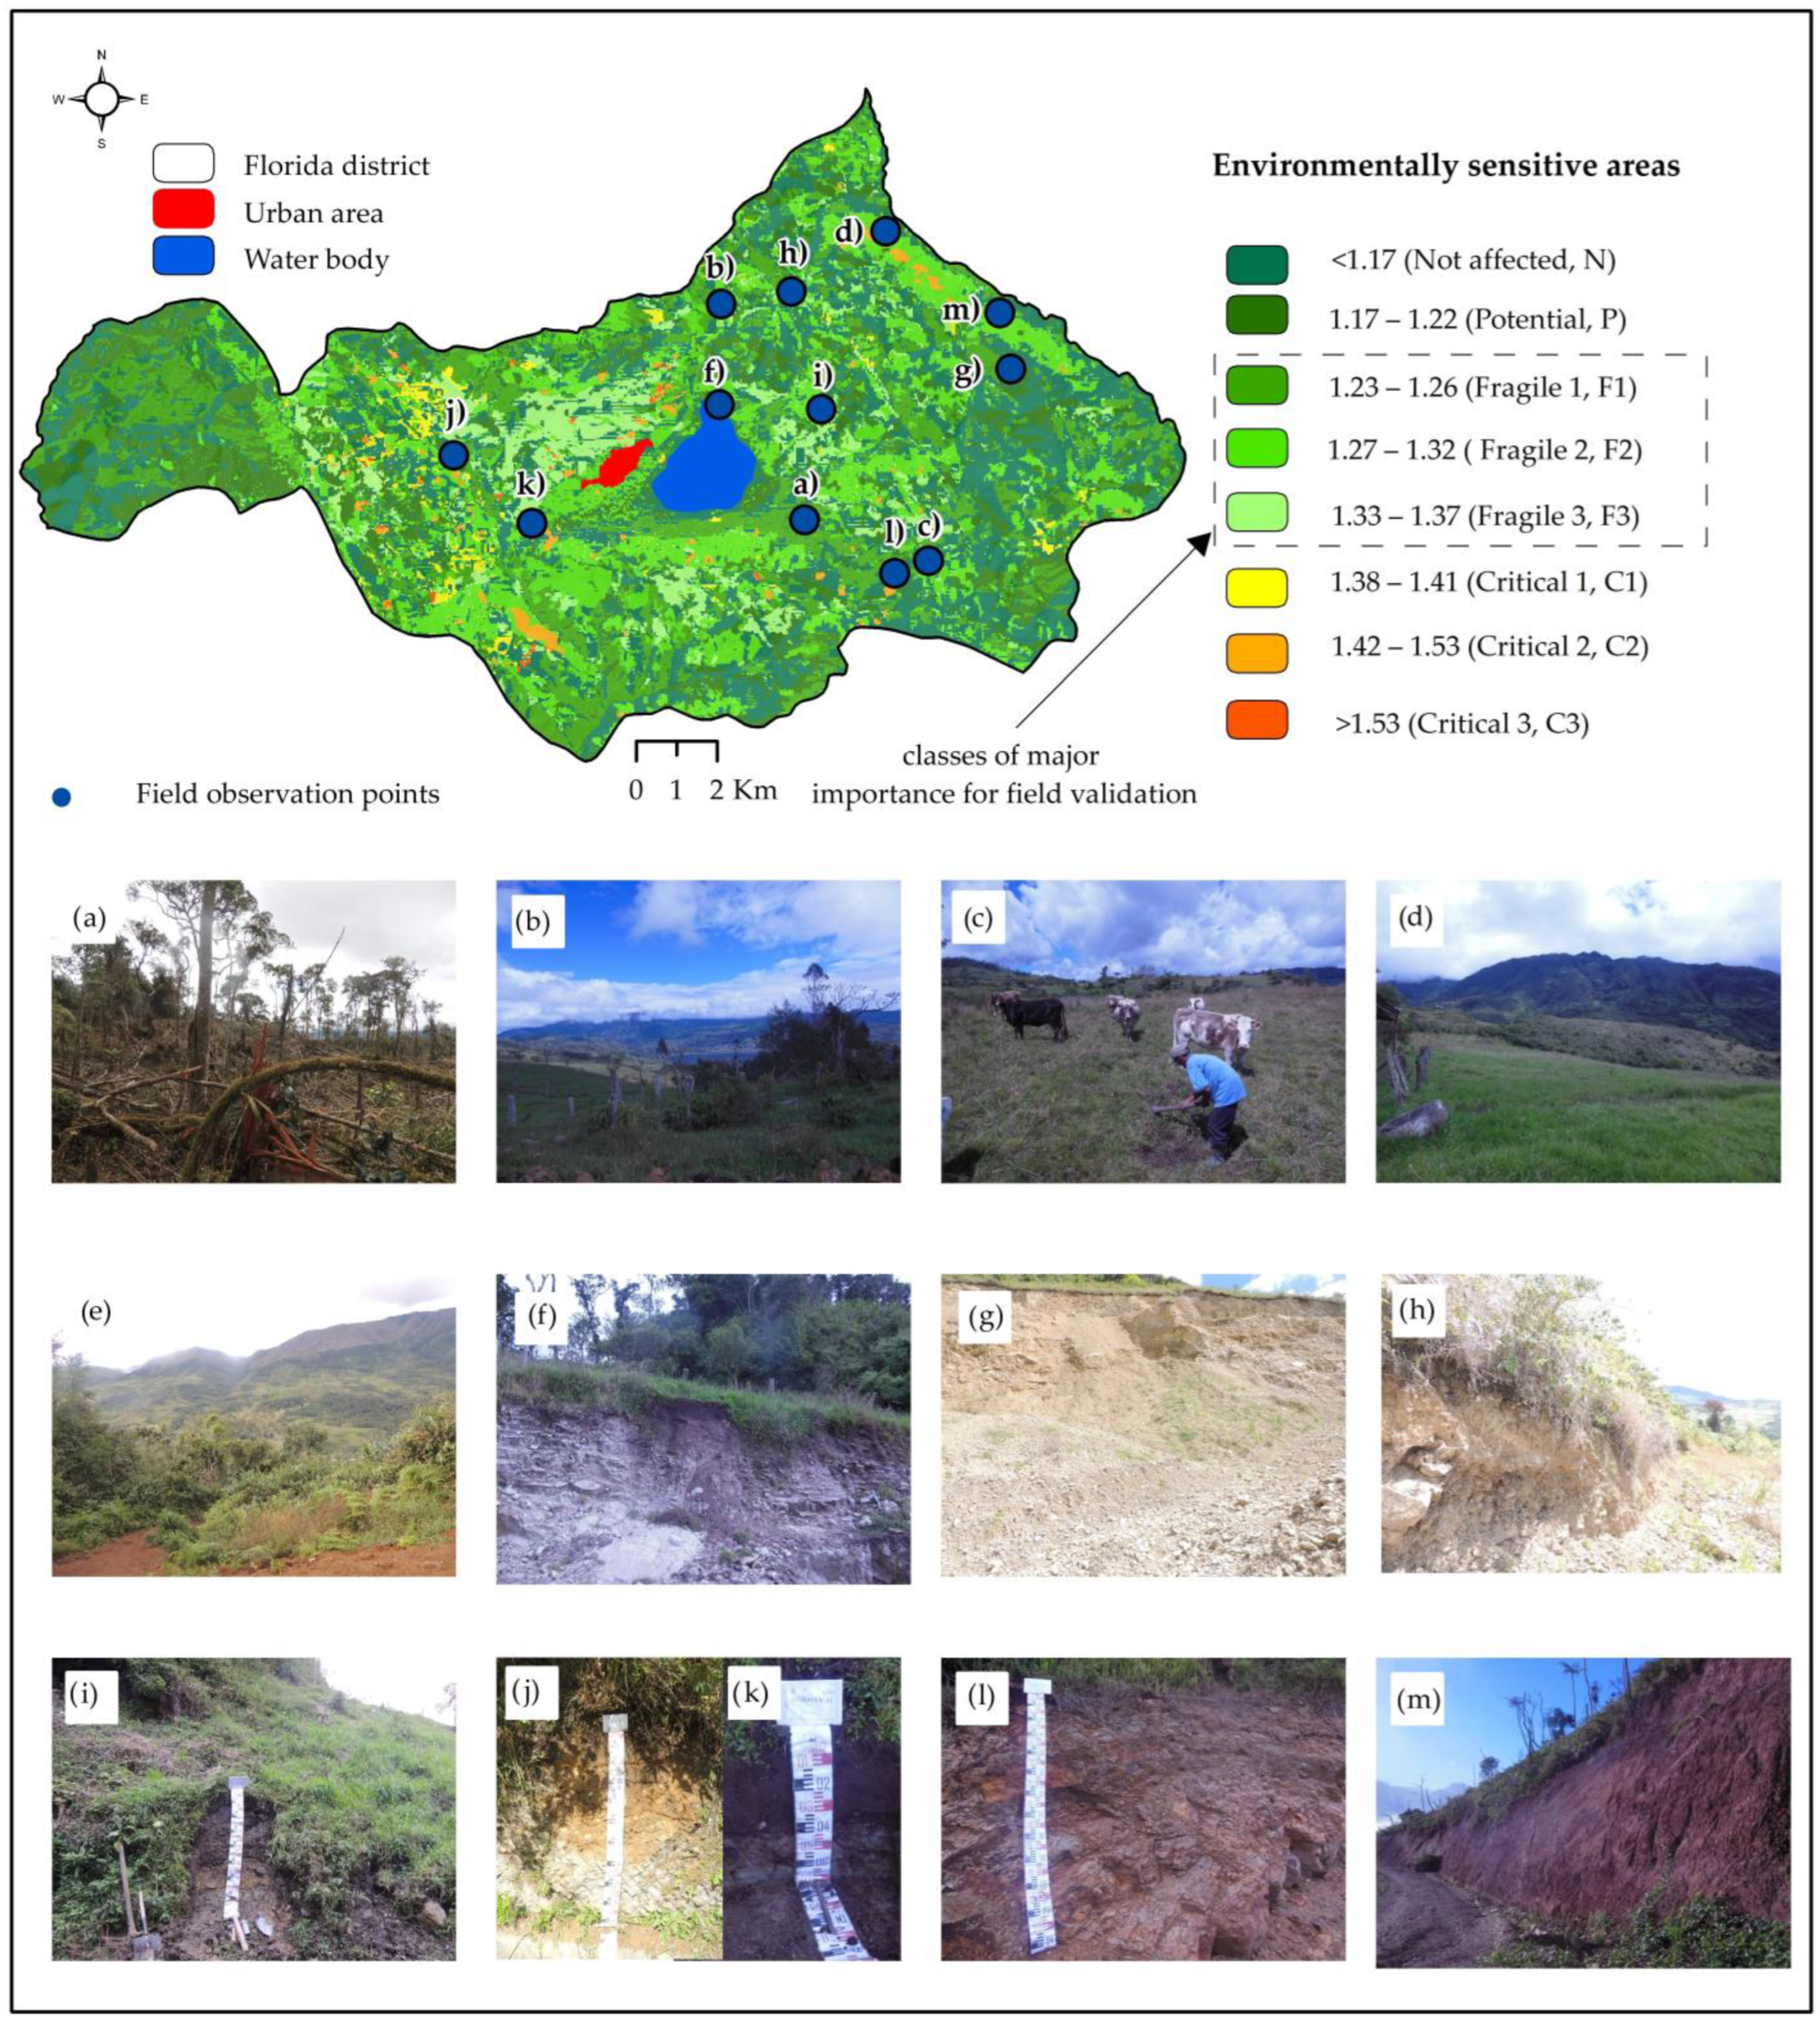
3.4. Validation of the Index of Environmentally Sensitive Areas

Field observations throughout the study area revealed critical areas (C1, C2, and C3), and fragile areas (F1, F2, and F3), which were subject to severe economic and ecological land decline (Figure 6). The validation results were consistent with the theoretical data characterizing the ESAI’s three critical and fragile classes (Table 6). Therefore, several forms of in situ land degradation were concretely identified in the study area, especially in human-intervened areas (Figure 6a). Forested areas that have been transformed into pastures for cattle raising (Figure 6b–e) are over-exploited with little vegetation, which favors erosion and active landslides and consequently land degradation in the study area (Figure 6f–i). In addition, there are partially developed soils (Figure 6j,k) with degradation processes of the granular structure (Figure 6l), and reddish soils with a sandy clay loam texture (Figure 6m).

3.5. Correlation Coefficients between Quality Indices

Table 7 displays the correlation coefficient between the indices (SQI, CQI, VQI, MQI) and the ESAI. The CQI showed the lowest correlation (0.05), in relation to the VQI (0.79), SQI (0.86), and MQI (0.93).

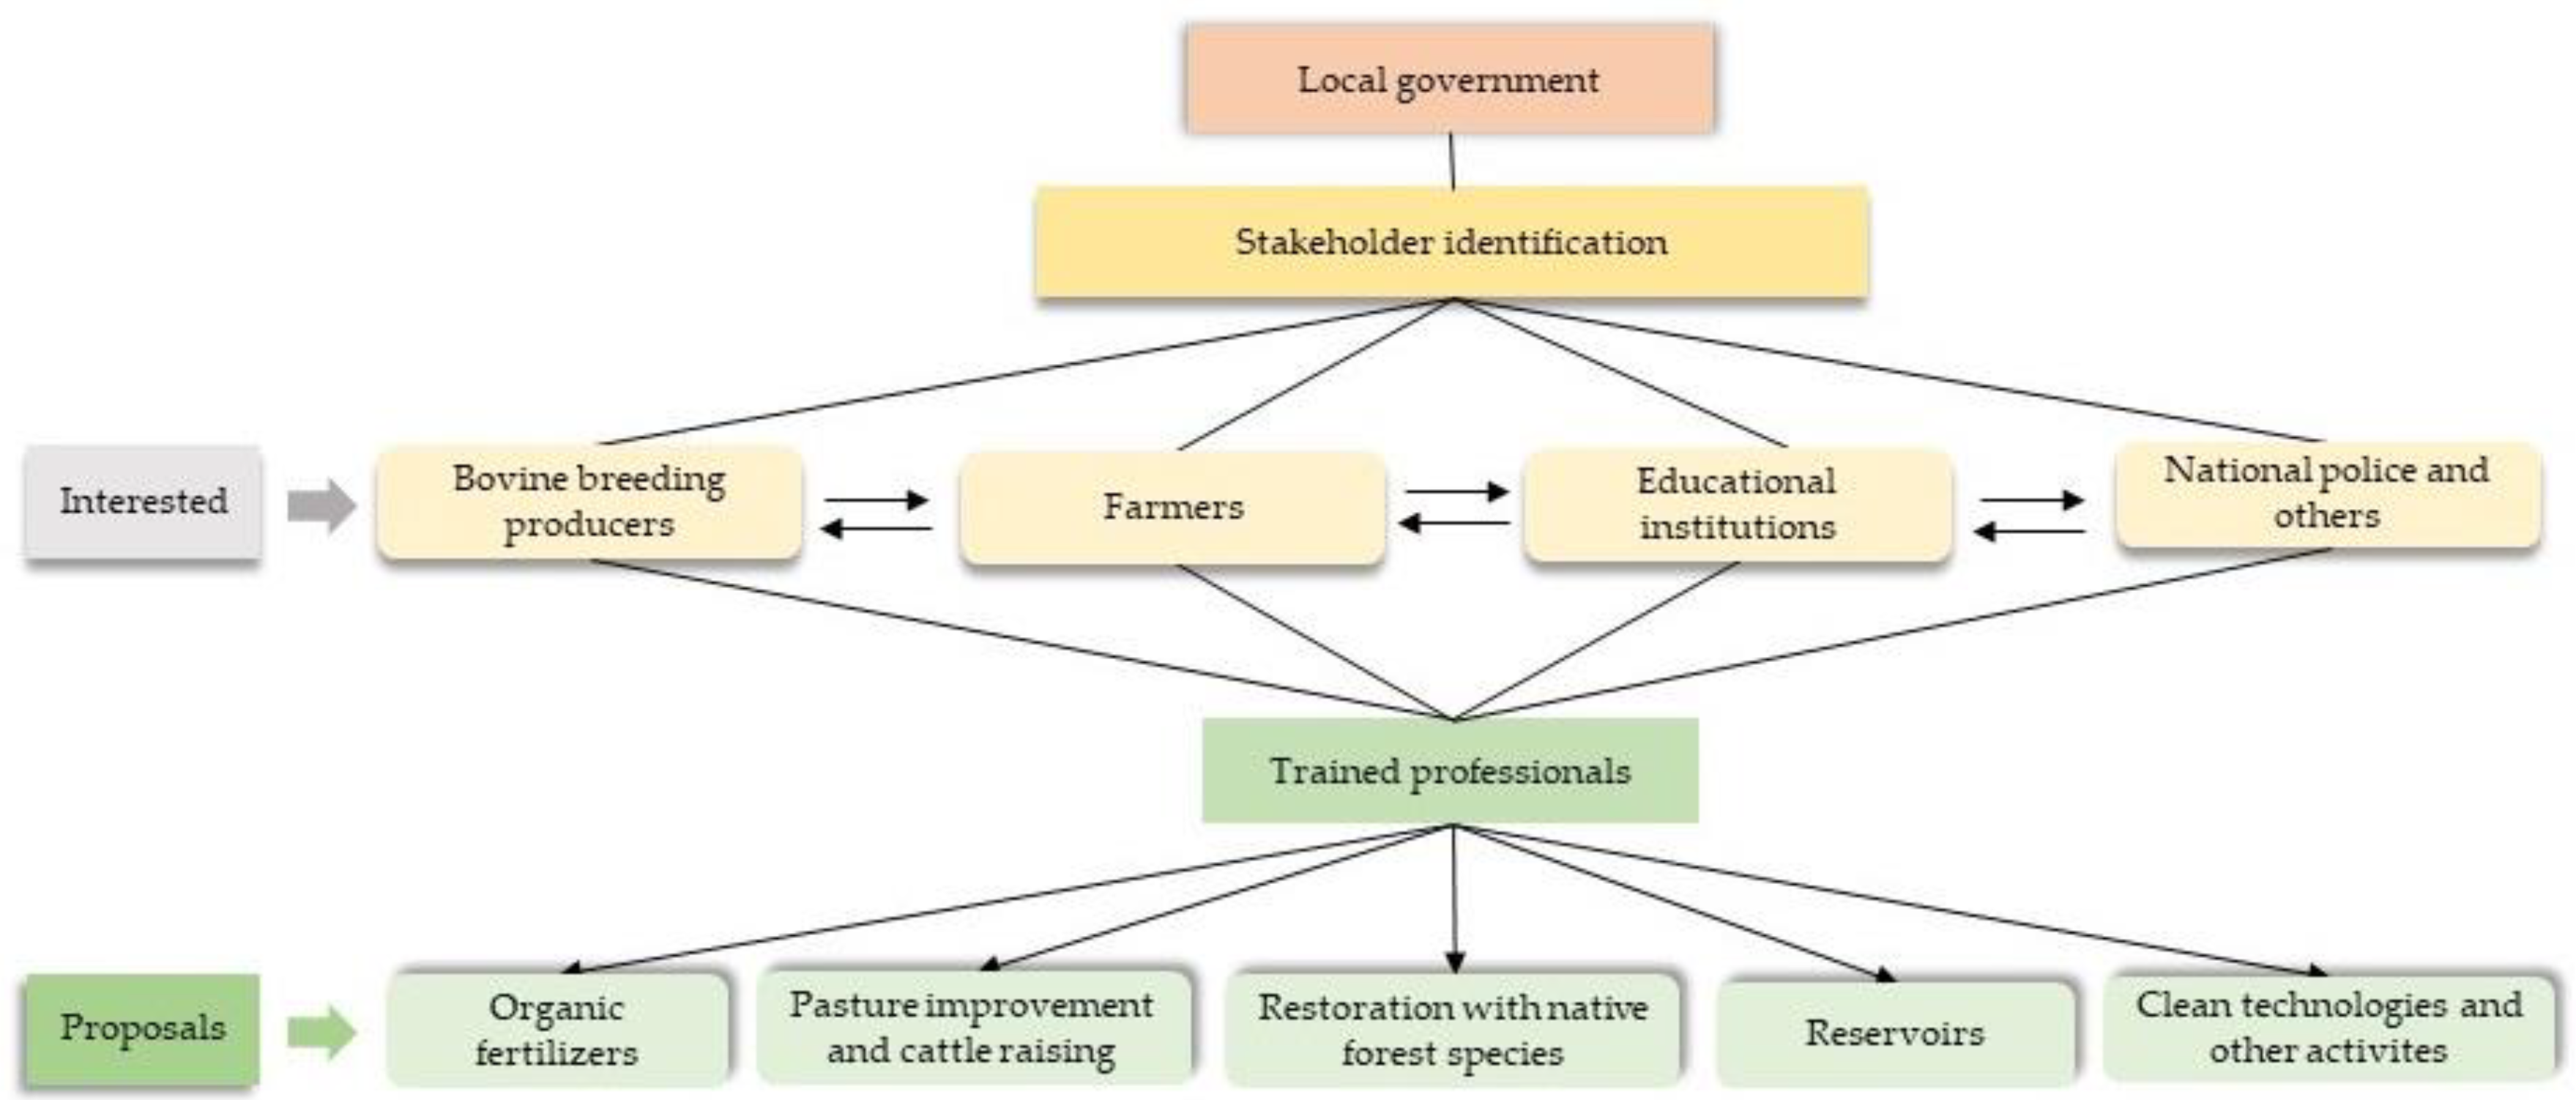
3.6. Ecological Restoration Proposal

The results of the ESAI identified that land in the critical class (2.96%) covers a smaller percentage of the studied territory than land in the fragile class (48.85%); hence, taking corrective measures may improve soil quality in the long term. It is clear that degradation is a complex process involving a holistic approach [84]. Specifically, we provide five proposals, in contribution to the Sustainable Development Goals (SDG) particularly 15.3, by 2030 [15,84,85]. Restoration should focus on the following proposals: (i) organic manure production, (ii) cultivated and improved pastures and livestock improvement, (iii) native forest restoration (iv) construction of reservoirs in the top hills, and (v) uses of new technologies (Figure 7). However, for these activities to be implemented, local stakeholders and institutions must be involved, and committed with clear ideas and leadership [15,84,85].
The public and private sectors’ involvement in land restoration processes, is definite-ly, a good way to achieve sustainable development goals [84]. Some governmental programs related to pasture and livestock improvement, and application of production technologies may contribute to land restoration [15,48,86,87], like the production of organic manures could increase soil fertility, reduce soil erosion [15]. It could also mitigate fragile areas in this sector.
It is important to install a forest nursery with native plants for the production of seedlings to accelerate forest succession on degraded land [48,88]. These native species may be Mahogany (Swietenia macrophylla King), Alchornea sp., Parathesis sp., Alnus acuminata [48], Cedrelinga cateniformis, Ceiba pentandra, Apuleia leiocarpa, Cariniana decandra and Cedrela montana [15,89,90,91]. Another alternative, also practiced in Florida district, is silvopastoral systems (SPS), giving several benefits (fertilizing the soil, providing better forage, providing a high-protein diet for livestock and essential chemical elements) [92,93,94,95]. This practice can be retributed to farmers by environmental services payment [96].
The construction of friendly environmentally reservoirs for water storage, strategically located at the top of the hill on agricultural land or pasture, will allow better distribution of water through gravity pipe networks, which could be used in various local activities [15]. The improvement of firewood stoves and anaerobic biodigesters will contribute to fuelwood and electricity saving, mitigating greenhouse gases [97,98,99]. Once implemented, it is important to continuously monitor and raise awareness in the communities.

4. Discussion

4.1. On Quality Indicators

The SQI, more than 85% of Florida’s territory is classified as moderate, which may result in two possible scenarios in the near future. In The first scenario low quality land could increase due to anthropogenic activities, and the second high quality land could increase with good land management, both depending on human activities. On the other hand, to determine the SQI, the parameters of parental material, slope, organic matter and texture were used for the flexibility of MEDALUS [9,15,18,22,47,72,73]. External parameters based on the characteristics in degraded areas can successfully lead to ecological succession for re-establishment of secondary forests and cost-effective restoration [48,100]. In Florida, there is a variation in organic matter, which varied from medium to high. This is consistent with a previous study [48], where it was determined that the organic horizon is thicker in forests than in grasslands. This parameter consequently provides so far nutrient availability, gas exchange and water supply to the soil [101]. Nevertheless, it should be noted that SOM content responds rapidly to anthropogenic manipulation and alteration, in contrast to texture and mineralogy, which change slowly over time [102,103,104]. Regarding soil texture, soils are mostly sandy loam clay loam, according to the classification of Komas et al. [16], classified with a very low susceptibility, consequently, the soil is not of low quality. However, Walentowski et al. [48], found high percentages of sandy soils under forests and more clay conditions in grasslands. Unfortunately, slope is one of the most important parameters driving degradation in different soil types [75]. In this study, we confirm such statement as slopes greater than 21% present high susceptibility to soil degradations, as it facilitates soil erosion [9,75,77]. Finally, SQI should be understood as the degree of sensitivity to soil degradation according to the parameters used and not as agronomic quality [105].
With regard to CQI, more than 50% is qualified as high quality and more than 40% as moderate quality, this could be related to the high precipitation (up to 1092 mm per year) [48,106]. This high precipitation means that the study area does not present arid lands, and as a consequence, there is no low class in climatic indicator. In this sense, aridity is an indicator of desertification and degradation [9,47]. However, regular rainfall causes soil erosivity [23,75], and here a classification of susceptibility to erosivity from low to high was determined. On the other hand, we expect that the aspect and type of climate of the Humid Cold Tropics [48], characteristic of the study area, influence even in the CQI, which is the reason for moderate to high CQI values. As supported by Xu et al. [76] and Salvati et al. [78], the aspect has important effects on vegetation growth and soil erosion rate. However, we suggest that further studies should be conducted to evaluate the effect of climate change in Amazonia and other areas of the world, as there is a probability that new areas will become arid in a short period of time [9,15,20,23,47,74,77,107,108,109].
The VQI, moderate class predominates with more than 50%, it is spread over agricultural and livestock lands. Lamentably, the forests have been exploited for timber sales since 1960 [48,106], and the establishment of pasture and crop plots, which practice continues today [31,48]. Forests mitigate degradation processes, in comparison to fragmented forests which ease the sensitivity of areas [73]. Therefore, cultivated and bare soils present a greater vulnerability to erosion and drought, unlike forests that are well protected by their root system and foliage [74]. Walentowski et al. [48], point out that abandoned pastures, degraded areas left for succession, do not guarantee landscape sustainability. By continuing with these negative practices, low quality areas of the VQI may increase in the future. Positive or negative changes will therefore occur depending on forests management.
The results reflect the need for further policy work on conservation, environmental education, training and monitoring programs for agricultural producers locally and nationally. It is important to coordinate the work with public and private organizations. Likewise, restoration actions should be taken with experiences from the country [43,110,111] and elsewhere [15,88,112,113]. We consider that immediate intervention should be given to low and moderate quality from the management point of view, for a sustainable use of the land.

4.2. On the Environmentally Sensitive Areas Index

The spatial analysis of the ESAI reported that the critical classes cover >2% of the territory, the fragile class with more than 45% of extension, while the potential class covers >15% and the unaffected >30%. In fact, the fragile class predominates in the study area and is similarly described as such by Walentowski et al. [48]. The ESAI depends directly on the SQI, CQI, VQI and MQI indices and these in turn depend on the parameters. In that sense, the major triggering indices that determine fragility were the VQI, SQI and MQI and are in agreement with other studies [9,23,75]. The results of the VQI and SQI are greater than 50% in moderate quality in the study area, thus a direct relationship with the low percentage of the critical area is inferred. Although, according to the results of the MQI there is a high-quality management of 53%, however, in comparison with the moderate quality it is close to this value. Therefore, there is still a deficiency in the management of sustainable land management. On the other hand, the high and moderate quality results of the CQI contribute to the fact that the critical areas do not increase due to the absence of the low class and are related to aridity [9,74]. Likewise, the correlation coefficients express in the same way the most triggering indices were VQI, SCI, and MQI, and the least triggering was CQI, in relation to the ESAI. The correlation values of the indices closer to one influence the sensitivity of the degradation [23,83].
n general, prioritization of control and mitigation measures for restoration should be focused on areas with medium to low sensitivity. Critical areas are in an advanced state of degradation, which means costly interventions to revert to a natural state. Regarding MEDALUS model, it demands a large geographic database, anticipating gaps and missing values for the time series. In this study, the model generated from the MOS was low-performing, for further studies, more sampling points should be considered to reduce bias. In addition, due to scarce local meteorological data, the WorldClim global data was used as a free platform. Therefore, the lack of historical data (climatological and socio-economic data on soil characteristics) is one of the limitations for ecosystem monitoring and degradation assessment in developing countries such as Peru. However, it should be noted that these methodological shortcomings are generally present in other European studies with similar analyses of land sensitivity to degradation [9,18,19,47,74]. The results and proposals can be improved by decision-makers when implemented in the field in order to mitigate degradation processes for sustainable land use.

5. Conclusions

This study assessed ESAI using MEDALUS model and GIS based on four indices (SQI, CQI, VQI, and MQI) and 12 parameters in Florida district. Fragile class lands (48.5%) were predominant in most of the study area with degradation process lands, wich may result in the increasing or decreasing of either classes (Crítico, Potencial, No-affected) in future scenarios. VQI, SQI, and MQI were the most triggering indices determining land fragility in Florida district.
The ESAI map proved to be a good source of information to identify degradation problems, and accordingly five ecological restoration proposals were stablished in order to achieve sustainable development towards 2030: (i) production of organic fertilizers, (ii) cultivated and improved pastures and livestock improvement, (iii) native forest restoration, (iv) construction of reservoirs in the communities, and (v) use of new technologies. These proposals are key to work towars management policies locally and nationally.

Author Contributions

Conceptualization, G.M.M. and E.B.; Data curation, G.M.M. and C.T.G.; Formal analysis, G.M.M. and R.S.L.; Funding acquisition, C.T.G.; Investigation, G.M.M., C.T.G., M.O.-C. and E.B.; Methodology, G.M.M., R.S.L. and E.B.; Project administration, C.T.G. and M.O.-C.; Resources, G.M.M., M.O.-C. and R.S.L.; Software, G.M.M.; Visualization, G.M.M., R.S.L., G.M. and E.B.; Writing—original draft, G.M.M. and G.M.; Writing—review & editing, G.M.M., C.T.G., M.O.-C., R.S.L., G.M. and E.B. All authors have read and agreed to the published version of the manuscript.

Funding

This work was executed with the support from the CUI 2261386 “Creation of the Services of a Biodiversity Laboratory and Conservation of Genetic Resources of Wild Species of the Toribio Rodríguez de Mendoza National University, Amazonas”—BIODIVERSITY and executed by the Research Institute for Sustainable Development of Ceja de Selva (INDES-CES).

Institutional Review Board Statement

Not applicable.

Informed Consent Statement

Not applicable.

Data Availability Statement

The data used to support the findings of this study are available from the corresponding author upon request.

Acknowledgments

The authors recognize and appreciate the support of the Research Institute for Sustainable Development of Ceja de Selva (INDES-CES) of the National University Toribio Rodríguez de Mendoza (UNTRM) and Instituto Nacional de Innovación Agraria (INIA).

Conflicts of Interest

The authors declare no conflict of interest.

References

  1. Nortcliff, S.; Hulpke, H.; Bannick, C.G.; Terytze, K.; Knoop, G.; Bredemeier, M.; Schulte-Bisping, H. Soil, 1. Definition, Function, and Utilization of Soil. Ullmann’s Encycl. Ind. Chem. 2011, 33, 399–419. [Google Scholar] [CrossRef]
  2. Alam, A. Soil Degradation: A Challenge to Sustainable Agriculture. Int. J. Sci. Res. Agric. Sci. 2014, 50–55. [Google Scholar] [CrossRef]
  3. Karlen, D.L.; Rice, C.W. Soil degradation: Will humankind ever learn? Sustainability 2015, 7, 12490–12501. [Google Scholar] [CrossRef] [Green Version]
  4. Karamesouti, M.; Detsis, V.; Kounalaki, A.; Vasiliou, P.; Salvati, L.; Kosmas, C. Land-use and land degradation processes affecting soil resources: Evidence from a traditional Mediterranean cropland (Greece). Catena 2015, 132, 45–55. [Google Scholar] [CrossRef]
  5. Bateman, A.M.; Muñoz-Rojas, M. To whom the burden of soil degradation and management concerns. In Advances in Chemical Pollution, Environmental Management and Protection; Elsevier: Amsterdam, The Netherlands, 2019; Volume 4, pp. 1–22. [Google Scholar] [CrossRef]
  6. Stavi, I.; Lal, R. Achieving Zero Net Land Degradation: Challenges and opportunities. J. Arid Environ. 2015, 112, 44–51. [Google Scholar] [CrossRef]
  7. Pacheco, F.A.L.; Sanches Fernandes, L.F.; Valle Junior, R.F.; Valera, C.A.; Pissarra, T.C.T. Land degradation: Multiple environmental consequences and routes to neutrality. Curr. Opin. Environ. Sci. Health 2018, 5, 79–86. [Google Scholar] [CrossRef]
  8. Lal, R. Restoring soil quality to mitigate soil degradation. Sustainability 2015, 7, 5875–5895. [Google Scholar] [CrossRef] [Green Version]
  9. Lamqadem, A.A.; Pradhan, B.; Saber, H.; Rahimi, A. Desertification sensitivity analysis using medalus model and gis: A case study of the oases of middle draa valley, morocco. Sensors 2018, 18, 2230. [Google Scholar] [CrossRef] [Green Version]
  10. Bakhtiari, M.; Darvishi Boloorani, A.; Abdollahi Kakroodi, A.; Rangzan, K.; Mousivand, A. Land degradation modeling of dust storm sources using MODIS and meteorological time series data. J. Arid Environ. 2021, 190, 104507. [Google Scholar] [CrossRef]
  11. Li, H.; Yang, X.; Zhang, K. Understanding global land degradation processes interacted with complex biophysics and socioeconomics from the perspective of the Normalized Difference Vegetation Index (1982–2015). Glob. Planet. Chang. 2021, 198, 103431. [Google Scholar] [CrossRef]
  12. Prokop, P. Remote sensing of severely degraded land: Detection of long-term land-use changes using high-resolution satellite images on the Meghalaya Plateau, northeast India. Remote Sens. Appl. Soc. Environ. 2020, 20, 100432. [Google Scholar] [CrossRef]
  13. Romshoo, S.A.; Amin, M.; Sastry, K.L.N.; Parmar, M. Integration of social, economic and environmental factors in GIS for land degradation vulnerability assessment in the Pir Panjal Himalaya, Kashmir, India. Appl. Geogr. 2020, 125, 102307. [Google Scholar] [CrossRef]
  14. Prăvălie, R.; Patriche, C.; Tişcovschi, A.; Dumitraşcu, M.; Săvulescu, I.; Sîrodoev, I.; Bandoc, G. Recent spatio-temporal changes of land sensitivity to degradation in Romania due to climate change and human activities: An approach based on multiple environmental quality indicators. Ecol. Indic. 2020, 118, 106755. [Google Scholar] [CrossRef]
  15. Wijitkosum, S. Reducing vulnerability to desertification by using the spatial measures in a degraded area in Thailand. Land 2020, 9, 49. [Google Scholar] [CrossRef] [Green Version]
  16. Kosmas, C.; Kirkby, M.J.; Geeson, N. (Eds.) Medalus Project: Mediterranean Desertification and Land Use. Manual on Key Indicators of Desertification and Mapping Environmentally Sensitive Areas. España. 1999. Available online: http://www.comap.ca/kmland/display.php?ID=253&DISPOP=VRCPR (accessed on 20 May 2021).
  17. Basso, F.; Bove, E.; Dumontet, S.; Ferrara, A.; Pisante, M.; Quaranta, G.; Taberner, M. Evaluating environmental sensitivity at the basin scale through the use of geographic information systems and remotely sensed data: An example covering the Agri basin (Southern Italy). Catena 2000, 40, 19–35. [Google Scholar] [CrossRef]
  18. Lavado, J.; Schnabel, S.; Goméz, A.; Pulido, M. Mapping sensitivity to land degradation in Extremadura. SW Spain. Land Degrad. Dev. 2009, 607, 591–607. [Google Scholar] [CrossRef]
  19. Salvati, L.; Bajocco, S. Land sensitivity to desertification across Italy: Past, present, and future. Appl. Geogr. 2011, 31, 223–231. [Google Scholar] [CrossRef]
  20. De Pina, J.; Baptista, I.; Ferreira, A.J.D.; Amiotte-Suchet, P.; Coelho, C.; Gomes, S.; Amoros, R.; Dos Reis, E.A.; Mendes, A.F.; Costa, L.; et al. Assessment and mapping the sensitive areas to desertification in an insular Sahelian mountain region Case study of the Ribeira Seca Watershed, Santiago Island, Cabo Verde. Catena 2015, 128, 214–223. [Google Scholar] [CrossRef]
  21. Vieira, R.M.S.P.; Tomasella, J.; Alvalá, R.C.S.; Sestini, M.F.; Affonso, A.G.; Rodriguez, D.A.; Barbosa, A.A.; Cunha, A.P.M.A.; Valles, G.F.; Crepani, E.; et al. Identifying areas susceptible to desertification in the Brazilian northeast. Solid Earth 2015, 6, 347–360. [Google Scholar] [CrossRef]
  22. Prăvălie, R.; Săvulescu, I.; Patriche, C.; Dumitraşcu, M.; Bandoc, G. Spatial assessment of land degradation sensitive areas in southwestern Romania using modified MEDALUS method. Catena 2017, 153, 114–130. [Google Scholar] [CrossRef]
  23. Momirović, N.; Kadović, R.; Perović, V.; Marjanović, M.; Baumgertel, A. Spatial assessment of the areas sensitive to degradation in the rural area of the municipality Čukarica. Int. Soil Water Conserv. Res. 2019, 7, 71–80. [Google Scholar] [CrossRef]
  24. Sommer, S.; Zucca, C.; Grainger, A.; Cherlet, M.; Zougmore, R.; Sokona, Y.; Hill, J.; Della Peruta, R.; Roehrig, J.; Wang, G. Application of indicator systems for monitoring and assessment of desertification from national to global scales. Land Degrad. Dev. 2011, 22, 184–197. [Google Scholar] [CrossRef]
  25. Shokr, M.S.; Abdellatif, M.A.; El Baroudy, A.A.; Elnashar, A.; Ali, E.F.; Belal, A.A.; Attia, W.; Ahmed, M.; Aldosari, A.A.; Szantoi, Z.; et al. Development of a spatial model for soil quality assessment under arid and semi-arid conditions. sustainability 2021, 13, 2893. [Google Scholar] [CrossRef]
  26. MINAGRI. Politica Nacional Agraria, Lima, Perú. Available online: https://cdn.www.gob.pe/uploads/document/file/2071814/DECRETO%20SUPREMO%2017-2021-MIDAGRI.pdf (accessed on 10 May 2021).
  27. Barrientos Felipa, P. La agricultura peruana y su capacidad de competir en el mercado internacional. Equidad Desarro. 2018, 1, 143–179. [Google Scholar] [CrossRef] [Green Version]
  28. Bedoya Garland, E.; Aramburú, C.E.; Burneo, Z. Una agricultura insostenible y la crisis del barbecho: El caso de los agricultores del valle de los ríos Apurímac y Ene, VRAE. Anthropologica 2017, 35, 211–240. [Google Scholar] [CrossRef] [Green Version]
  29. Oliva, M.; Quintana, J.L.M.; Guzmán, C.T.; Escalante, W.B. Propiedades fisicoquímicas del suelo en diferentes estadios de la agricultura migratoria en el Área de Conservación Privada “Palmeras de Ocol”, distrito de Molinopampa, provincia de Chachapoyas (departamento de Amazonas). Rev. Investig. Agroprod. Sustent. 2017, 1, 9–21. [Google Scholar] [CrossRef]
  30. MINAM. Mapa de Áreas Degradadas para la Conservación. Lima, Perú. Available online: https://geoservidor.minam.gob.pe/monitoreo-y-evaluacion/restauracion-de-areas-degradadas/ (accessed on 10 May 2021).
  31. Salas, R.; Barboza, E.; Oliva, S.M. Dinámica multitemporal de índices de deforestación en el distrito de Florida, departamento de Amazonas, Perú. Rev. Indes. 2016, 2, 1–9. [Google Scholar] [CrossRef]
  32. Rojas, N.B.; Barboza, E.; Maicelo, J.L.; Oliva, S.M.; Salas, R. Deforestación en la Amazonía peruana: Índices de cambios de cobertura y uso del suelo basado en SIG. Bol. Asoc. Geógr. Espa. 2019, 81, 2538. [Google Scholar]
  33. Shanee, N.; Shanee, S. Land Trafficking, Migration, and Conservation in the “No-Man’s Land” of Northeastern Peru. Trop. Conserv. Sci. 2016, 9, 1940082916682957. [Google Scholar] [CrossRef] [Green Version]
  34. Mendoza, M.E.; Salas, R.; Barboza, E. Análisis multitemporal de la deforestación usando la clasificación basada en objetos, distrito de Leymebamba (Perú). Rev. Indes. 2017, 3, 67–76. [Google Scholar] [CrossRef]
  35. Oliva, C.M.; Collazos, S.R.; Goñas, M.M.; Bacalla, E.; Vigo, M.C.; Vásquez, P.H.; Espinosa, L.S.T.; Maicelo, Q.J.L. Efecto de los sistemas de producción sobre las características físico-químicas de los suelos del distrito de Molinopampa, provincia de Chachapoyas, región Amazonas. Rev. Indes. 2016, 2, 44–52. [Google Scholar] [CrossRef]
  36. Finer, M.; Mmani, N. Minería Ilegal baja 78% en la Amazonía Peruana, pero aún Amenaza áreas Clave.MAAP:130. 2020. Available online: https://www.maaproject.org/2020/mineria_ilegal/ (accessed on 12 May 2021).
  37. Castillo, E.B.; Cayo, E.Y.T.; de Almeida, C.M.; López, R.S.; Briceño, N.B.R.; López, J.O.S.; Gurbillón, M.A.B.; Oliva, M.; Espinoza-Villar, R. Monitoring wildfires in the northeastern peruvian amazon using landsat-8 and sentinel-2 imagery in the GEE platform. ISPRS Int. J. Geo-Inf. 2020, 9, 564. [Google Scholar] [CrossRef]
  38. Manríquez, H.M. Especies forestales afectadas en incendios ocurridos en Amazonas: Un análisis de la información fiscal de los casos de Chachapoyas y Luya. Arnaldoa 2019, 26, 965–976. [Google Scholar] [CrossRef]
  39. Nolasco, M.I.M.; León, H. Los Incendios Forestales En El Perú: Grave Problema Por Resolver. Floresta 2004, 34, 179–186. [Google Scholar] [CrossRef] [Green Version]
  40. Sabuco, P. The problem of forest fires and the basis for its teledetection in Perú. Apunt. Cienc. Soc. 2013, 3, 5–8. [Google Scholar]
  41. GEOBOSQUES. Bosque y Pérdida de Bosque. Available online: http://geobosques.minam.gob.pe/geobosque/view/perdida.php (accessed on 30 May 2021).
  42. SERFOR. Lineamientos para la Restauración de Ecosistemas Forestales y Otros Ecosistemas de Vegetación Silvestre; SERFOR: Lima, Peru, 2018. [Google Scholar]
  43. Cerrón, J.; del Castillo, J.D.; Thomas, E.; Mathez-Stiefel, S.-L.; Franco, M.; Mamani, A.; Gonzalez, F.B.I. Experiencias de Restauración en el Perú—Lecciones Aprendidads; Servicio Nacional Forestal y de Fauna Silvestre: Lima, Perú, 2018; Available online: http://repositorio.serfor.gob.pe/handle/SERFOR/493 (accessed on 12 July 2021).
  44. Yalle, S.; McBreen, J. Experiencias de la Restauración del Paisaje Forestal con AplicaCión de ROAM en Perú; Quito, Ecuador, 2018; Available online: https://infoflr.org/sites/default/files/2020-04/flr_peru_experiencias_roam.pdf (accessed on 12 March 2021).
  45. Meza, A.; Sabogal, C.; de Jong, W. Rehabilitacion de areas Degradadas en la Amazonia Peruana: Revision de Experiencias y Lecciones Aprendidas; Bogor, Indonesia, 2006; Available online: https://www.cifor.org/publications/pdf_files/Books/BMeza0601.pdf (accessed on 12 February 2021).
  46. Núñez, E.; De la Cruz, H.; Proaño, R. Buenas Prácticas para la Recuperación de Pastizales de Altura; CONDESAN: Lima, Peru, 2018; Available online: https://condesan.org/wp-content/uploads/2018/10/Buenas-practicas-Pastizales-22-marzo.pdf (accessed on 29 February 2021).
  47. Prăvălie, R.; Patriche, C.; Săvulescu, I.; Sîrodoev, I.; Bandoc, G.; Sfîcă, L. Spatial assessment of land sensitivity to degradation across Romania. A quantitative approach based on the modified MEDALUS methodology. Catena 2020, 187, 104407. [Google Scholar] [CrossRef]
  48. Walentowski, H.; Heinrichs, S.; Hohnwald, S.; Wiegand, A.; Heinen, H.; Thren, M.; Gamarra Torres, O.A.; Sabogal, A.B.; Zerbe, S. Vegetation succession on degraded sites in the Pomacochas Basin (Amazonas, N Peru)-Ecological options for forest restoration. Sustainability 2018, 10, 609. [Google Scholar] [CrossRef] [Green Version]
  49. Leiva-Tafur, D.; Goñas, M.; Culqui, L.; Santa Cruz, C.; Rascón, J.; Oliva-Cruz, M. Spatiotemporal distribution of physicochemical parameters and toxic elements in Lake Pomacochas, Amazonas, Peru. Front. Environ. Sci. 2022, 10, 1822. [Google Scholar] [CrossRef]
  50. Rascón, J.; Corroto, F.; Leiva-Tafur, D.; Gamarra Torres, O.A. Variaciones limnológicas espaciotemporales de un lago altoandino tropical al norte de Perú. Ecol. Austral 2021, 31, 343–356. [Google Scholar] [CrossRef]
  51. Escobedo, R. Fisiografía; Proyecto Zonificación Ecológica y Económica del Departamento de Amazonas, Convenio Entre el IIAP y el Gobierno Regional de Amazonas: Iquitos, Peru, 2010. [Google Scholar]
  52. MINAM. Mapa Nacional de Cobertura Vegetal; MINAM: Lima, Peru, 2015. Available online: https://www.minam.gob.pe/patrimonio-natural/wp-content/uploads/sites/6/2013/10/MAPA-NACIONAL-DE-COBERTURA-VEGETAL-FINAL.compressed.pdf (accessed on 28 April 2022).
  53. Escobedo, R. Suelo y Capacidad de Uso Mayor de la Tierra, Informe Temático; Proyecto Zonificación Ecológica y Económica del Departamento de Amazonas, Convenio Entre el IIAP y el Gobierno Regional de Amazonas: Iquitos, Peru, 2010. [Google Scholar]
  54. INEI. Peru: Crecimiento y Distribucion de la Poblacion Total, 2017. Poblacion Censada Mas Poblacion Omitida; INEI: Lima, Peru, 2018.
  55. Oliva, M.; Oliva, C.; Rojas, D.; Oliva, M.; Morales, A. Botanical identification of native species most important of dairy basins Molinopampa, Pomacochas and Leymebamba, Amazonas, Peru. Sci. Agropecu. 2015, 6, 125–129. [Google Scholar] [CrossRef] [Green Version]
  56. Chávez, H.; Leiva, D.; Rascón, J.; Hoyos, I.; Corroto, F. Estado trófico del lago Pomacochas a través de parámetros fisicoquímicos y bacteriológicos. Indes 2016, 2, 98–107. [Google Scholar] [CrossRef]
  57. Rascón, J.; Corroto, F. Evolución fisicoquímica y de las bacterias del azufre en microcosmos de diferentes sistemas acuáticos de la Región Amazonas. Tayacaja 2020, 3, 25–39. [Google Scholar] [CrossRef]
  58. Farr, T.; Rosen, P.A.; Caro, E.; Crippen, R.; Duren, R.; Hensley, S.; Kobrick, M.; Paller, M.; Rodriguez, E.; Roth, L.; et al. Shuttle Radar Topography Mission: Mission to map the world. Rev. Geophys. 2007, 45, 3–5. [Google Scholar] [CrossRef] [Green Version]
  59. Fick, S.E.; Hijmans, R.J. WorldClim 2: New 1-km spatial resolution climate surfaces for global land areas. Int. J. Climatol. 2017, 37, 4302–4315. [Google Scholar] [CrossRef]
  60. Castro, W.F. Geología; Proyecto Zonificación Ecológica y Económica del Departamento de Amazonas, Convenio Entre el IIAP y el Gobierno Regional de Amazonas: Iquitos, Peru, 2010. [Google Scholar]
  61. Fidel, L.; Villacorta, S.; Zavala, B.; Vilchez, M.; Valderrama, P.; Nuñez, S.; Luque, G.; Rosado, M.; Medina, L.; Vásquez, J. Mapa de susceptibilidad por movimientos en masa del Perú. Rev. Asoc. Geol. Argent. 2010, 3, 308–311. [Google Scholar]
  62. Sisodia, P.S.; Tiwari, V.; Kumar, A. Analysis of Supervised Maximum Likelihood Classification for remote sensing image. In Proceedings of the International Conference on Recent Advances and Innovations in Engineering (ICRAIE 2014), Jaipur, India, 9–11 May 2014; pp. 9–12. [Google Scholar] [CrossRef]
  63. Thakkar, A.K.; Desai, V.R.; Patel, A.; Potdar, M.B. Post-classification corrections in improving the classification of Land Use/Land Cover of arid region using RS and GIS: The case of Arjuni watershed, Gujarat, India. Egypt. J. Remote Sens. Space Sci. 2017, 20, 79–89. [Google Scholar] [CrossRef] [Green Version]
  64. MINAGRI. Aprueban el Reglamento para la Ejecución de Levantamiento de Suelos. Available online: https://www.minagri.gob.pe/portal/download/pdf/marcolegal/normaslegales/decretossupremos/2010/ds13-2010-ag.pdf (accessed on 24 April 2021).
  65. Varouchakis, E.A. Geostatistics: Mathematical and Statistical Basis; Elsevier Inc.: Amsterdam, The Netherlands, 2019; ISBN 9780128116890. [Google Scholar]
  66. Zhang, S.; Huang, Y.; Shen, C.; Ye, H.; Du, Y. Spatial prediction of soil organic matter using terrain indices and categorical variables as auxiliary information. Geoderma 2012, 171–172, 35–43. [Google Scholar] [CrossRef]
  67. Peng, G.; Bing, W.; Guangpo, G.; Guangcan, Z. Spatial distribution of soil organic carbon and total nitrogen based on GIS and geostatistics in a small watershed in a hilly area of northern China. PLoS ONE 2013, 8, e83592. [Google Scholar] [CrossRef]
  68. Yao, X.; Yu, K.; Deng, Y.; Liu, J.; Lai, Z. Spatial variability of soil organic carbon and total nitrogen in the hilly red soil region of Southern China. J. For. Res. 2020, 31, 2385–2394. [Google Scholar] [CrossRef] [Green Version]
  69. Cao, S.; Lu, A.; Wang, J.; Huo, L. Modeling and mapping of cadmium in soils based on qualitative and quantitative auxiliary variables in a cadmium contaminated area. Sci. Total Environ. 2017, 580, 430–439. [Google Scholar] [CrossRef] [PubMed]
  70. Chabala, L.M.; Mulolwa, A.; Lungu, O. Application of Ordinary Kriging in Mapping Soil Organic Carbon in Zambia. Pedosphere 2017, 27, 338–343. [Google Scholar] [CrossRef]
  71. Guerrero, J. Clases Texturales de Suelo Utilizando el Raster Calculator de QGIS. Available online: https://joseguerreroa.wordpress.com/2015/04/06/clases-texturales-de-suelo-utilizando-el-raster-calculator-de-qgis/ (accessed on 6 May 2021).
  72. Hosseini, S.M.; Sadrafshari, S.; Fayzolahpour, M. Desertification hazard zoning in Sistan Region, Iran. J. Geogr. Sci. 2012, 22, 885–894. [Google Scholar] [CrossRef]
  73. Salvati, R.; Salvati, L.; Corona, P.; Barbati, A.; Ferrara, A. Estimating the sensitivity to desertification of Italian forests. IForest 2015, 8, 287–294. [Google Scholar] [CrossRef] [Green Version]
  74. Lahlaoi, H.; Rhinane, H.; Hilali, A.; Lahssini, S.; Moukrim, S. Desertification assessment using MEDALUS model in watershed Oued El Maleh, Morocco. Geosciences 2017, 7, 50. [Google Scholar] [CrossRef] [Green Version]
  75. Kosmas, C.; Kairis, O.; Karavitis, C.; Ritsema, C.; Salvati, L.; Acikalin, S.; Alcalá, M.; Alfama, P.; Atlhopheng, J.; Barrera, J.; et al. Evaluation and Selection of Indicators for Land Degradation and Desertification Monitoring: Methodological Approach. Environ. Manag. 2014, 54, 951–970. [Google Scholar] [CrossRef] [Green Version]
  76. Xu, D.; You, X.; Xia, C. Assessing the spatial-temporal pattern and evolution of areas sensitive to land desertification in North China. Ecol. Indic. 2019, 97, 150–158. [Google Scholar] [CrossRef]
  77. Lee, E.J.; Piao, D.; Song, C.; Kim, J.; Lim, C.H.; Kim, E.; Moon, J.; Kafatos, M.; Lamchin, M.; Jeon, S.W.; et al. Assessing environmentally sensitive land to desertification using MEDALUS method in Mongolia. For. Sci. Technol. 2019, 15, 210–220. [Google Scholar] [CrossRef] [Green Version]
  78. Salvati, L.; Mancino, G.; De Zuliani, E.; Sateriano, A.; Zitti, M.; Ferrara, A. An expert system to evaluate environmental sensitivity: A local-scale approach to desertification risk. Appl. Ecol. Environ. Res. 2013, 11, 611–627. [Google Scholar] [CrossRef]
  79. UNEP. World Atlas of Desertification; The United Nations Environment Programme (UNEP): London, UK, 1993. [Google Scholar]
  80. Arnoldus, H.M.J. An Approximation of the Rainfall Factor in the Universal Soil Loss Equation; Land and Water Development Division, FAO: Rome, Italy, 1980; Available online: https://www.cabdirect.org/cabdirect/abstract/19831974087 (accessed on 13 July 2021).
  81. Li, P.; Li, Z. Soil reinforcement by a root system and its effects on sediment yield in response to concentrated flow in the loess plateau. Agric. Sci. 2011, 2, 86–93. [Google Scholar] [CrossRef] [Green Version]
  82. Gyssels, G.; Poesen, J.; Bochet, E.; Li, Y. Impact of plant roots on the resistance of soils to erosion by water: A review. Prog. Phys. Geogr. 2005, 29, 189–217. [Google Scholar] [CrossRef] [Green Version]
  83. Dai, L.; Wang, L.; Liang, T.; Zhang, Y.; Li, J.; Xiao, J.; Dong, L.; Zhang, H. Geostatistical analyses and co-occurrence correlations of heavy metals distribution with various types of land use within a watershed in eastern QingHai-Tibet Plateau, China. Sci. Total Environ. 2019, 653, 849–859. [Google Scholar] [CrossRef] [PubMed]
  84. Keesstra, S.; Mol, G.; de Leeuw, J.; Okx, J.; Molenaar, C.; de Cleen, M.; Visser, S. Soil-related sustainable development goals: Four concepts to make land degradation neutrality and restoration work. Land 2018, 7, 133. [Google Scholar] [CrossRef] [Green Version]
  85. Keesstra, S.D.; Bouma, J.; Wallinga, J.; Tittonell, P.; Smith, P.; Cerdà, A.; Montanarella, L.; Quinton, J.N.; Pachepsky, Y.; Van Der Putten, W.H.; et al. The significance of soils and soil science towards realization of the United Nations sustainable development goals. Soil 2016, 2, 111–128. [Google Scholar] [CrossRef] [Green Version]
  86. MIDAGRI. Plan Nacional de Desarrollo Ganadero 2017–2027. Lima, Peru. Available online: https://www.midagri.gob.pe/portal/download/pdf/especiales/plan-nacional-ganadero.pdf (accessed on 30 September 2022).
  87. Murga, L.; Vásquez, H.; Bardales, J. Caracterización de los sistemas de producción de ganado bovino en las cuencas ganaderas de Ventilla, Florida y Leyva -región Amazonas. Rev. Cient. Cienc. Nat. Ing. 2019, 1, 28–37. [Google Scholar] [CrossRef]
  88. Cole, R.J.; Holl, K.D.; Zahawi, R.A. Seed rain under tree islands planted to restore degraded lands in a tropical agricultural landscape. Ecol. Appl. 2010, 20, 1255–1269. [Google Scholar] [CrossRef]
  89. Rojas, N.B.; Cotrina, D.A.; Barboza, E.; Barrena, M.A.; Sarmiento, F.O.; Sotomayor, D.A.; Oliva, M.; Salas, R. Current and future distribution of five timber forest species in amazonas, northeast peru: Contributions towards a restoration strategy. Diversity 2020, 12, 305. [Google Scholar] [CrossRef]
  90. Cotrina, D.A.; Barboza, E.; Rojas, N.B.; Oliva, M.; Torres, C.; Amasifuen, C.A.; Bandopadhyay, S. Distribution models of timber species for forest conservation and restoration in the Andean-Amazonian landscape, North of Peru. Sustainability 2020, 12, 7945. [Google Scholar] [CrossRef]
  91. Lamb, D.; Erskine, P.D.; Parrotta, J.A. Restoration of degraded tropical forest landscapes. Science 2005, 310, 1628–1632. [Google Scholar] [CrossRef] [Green Version]
  92. Joseph, N.; Orefice, J.C. Silvopasture—It’s Not a Load of Manure: Differentiating between Silvopasture and Wooded Livestock Paddocks in the Northeastern United States. J. For. 2017, 115, 71–72. [Google Scholar] [CrossRef]
  93. Orefice, J.; Smith, R.G.; Carroll, J.; Asbjornsen, H.; Howard, T. Forage productivity and profitability in newly-established open pasture, silvopasture, and thinned forest production systems. Agrofor. Syst. 2019, 93, 51–65. [Google Scholar] [CrossRef]
  94. Ibrahim, M.; Guerra, L.; Casasola, F.; Neely, C. Importance of silvopastoral systems for mitigation of climate change and harnessing of environmental benefits. Integr. Crop Manag. 2010, 11, 189–196. [Google Scholar]
  95. Mercer, D.E.; Frey, G.E.; Cubbage, F.W. Economics of Agroforestry. In Handbook of Forest Resource Economics; 2014; Available online: https://www.taylorfrancis.com/chapters/edit/10.4324/9780203105290-19/economics-agroforestry-evan-mercer-gregory-frey-frederick-cubbage (accessed on 17 April 2021).
  96. Chizmar, S.; Castillo, M.; Pizarro, D.; Vasquez, H.; Bernal, W.; Rivera, R.; Sills, E.; Abt, R.; Parajuli, R.; Cubbage, F. A discounted cash flow and capital budgeting analysis of silvopastoral systems in the Amazonas region of Peru. Land 2020, 9, 353. [Google Scholar] [CrossRef]
  97. Prasad, R.; Hochmuth, G.; Wilkie, A.C. Anaerobic Digesters for Manure Management at Livestock Operations; University of Florida, Institute of Food and Agricultural Sciences: Gainesville, FL, USA, 2014; Available online: https://edis.ifas.ufl.edu/publication/SS615 (accessed on 23 April 2021).
  98. Galindo-Barboza, A.J.; Domínguez-Araujo, G.; Arteaga-Garibay, R.I.; Salazar-Gutiérrez, G. Mitigation and adaptation to climate change through the implementation of integrated models for the management and use of livestock residues. Rev. Mex. Cienc. Pecu. 2018, 11, 107–125. [Google Scholar] [CrossRef]
  99. Martí-Herrero, J. Biodigestores Familiares: Guía de diseño y manual de instalación. 2008. Available online: https://www.researchgate.net/publication/282156621_Biodigestores_familiares_Guia_de_diseno_y_manual_de_instalacion_2008?channel=doi&linkId=5605833408aeb5718ff1c295&showFulltext=true (accessed on 29 April 2021).
  100. Kögel-Knabner, I.; Amelung, W. Soil organic matter in major pedogenic soil groups. Geoderma 2021, 384, 114785. [Google Scholar] [CrossRef]
  101. Jurgensen, M.F.; Harvey, A.E.; Graham, R.T.; Page-Dumroese, D.S.; Tonn, J.R.; Larsen, M.J.; Jain, T.B. Impacts of timber harvesting on soil organic matter, nitrogen, productivity, and health of Inland Northwest forests. For. Sci. 1997, 43, 234–251. [Google Scholar] [CrossRef]
  102. González-Pérez, J.A.; González-Vila, F.J.; Almendros, G.; Knicker, H. The effect of fire on soil organic matter—A review. Environ. Int. 2004, 30, 855–870. [Google Scholar] [CrossRef]
  103. Fan, M.; Lal, R.; Zhang, H.; Margenot, A.J.; Wu, J.; Wu, P.; Zhang, L.; Yao, J.; Chen, F.; Gao, C. Variability and determinants of soil organic matter under different land uses and soil types in eastern China. Soil Tillage Res. 2020, 198, 104544. [Google Scholar] [CrossRef]
  104. de Andrade Bonetti, J.; Anghinoni, I.; de Moraes, M.T.; Fink, J.R. Resilience of soils with different texture, mineralogy and organic matter under long-term conservation systems. Soil Tillage Res. 2017, 174, 104–112. [Google Scholar] [CrossRef]
  105. Bouabid, R.; Rouchdi, M.; Badraoui, M.; Diab, A.; Louafi, S. Assessment of Land Desertification Based on the MEDALUS Approach and Elaboration of an Action Plan: The Case Study of the Souss River Basin, Morocco. In Land Degradation and Desertification: Assessment, Mitigation and Remediation; 2010; Available online: https://link.springer.com/chapter/10.1007/978-90-481-8657-0_10 (accessed on 3 May 2021).
  106. Young, K.R.; Leon, B. Biodiversity conservation in Peru’s eastern Montane forests. Mt. Res. Dev. 2000, 20, 208–211. [Google Scholar] [CrossRef]
  107. Fletcher, W.D.; Smith, C.B. Reaching Net Zero: What it Takes to Solve the Global Climate Crisis; Elsevier: Amsterdam, The Netherlands, 2020; Available online: https://www.sciencedirect.com/book/9780128233665/reaching-net-zero (accessed on 8 July 2021).
  108. Fernandez, J.P.R.; Franchito, S.H.; Rao, V.B. Future Changes in the Aridity of South America from Regional Climate Model Projections. Pure Appl. Geophys. 2019, 176, 2719–2728. [Google Scholar] [CrossRef]
  109. Cheval, S.; Dumitrescu, A.; Birsan, M.V. Variability of the aridity in the South-Eastern Europe over 1961–2050. Catena 2017, 151, 74–86. [Google Scholar] [CrossRef]
  110. Román, F.; Mamani, A.; Cruz, A.; Sandoval, C.; Cuesta, F. Orientaciones para la Restauración de Ecosistemas Forestales y otros Ecosistemas de Vegetación Silvestre; Servicio Nacional Forestal y de Fauna Silvestre (SERFOR): Lima, Peru, 2018; Available online: http://repositorio.serfor.gob.pe/bitstream/SERFOR/524/1/SERFOR%202018%20Orientaciones-para-larestauraci%C3%B3n-de-ecosistemas-forestales.pdf (accessed on 30 September 2022).
  111. Flores, Y. Especies Forestales Nativas para la Recuperacion de Areas Degradadas; Instituto Nacional de Innovación Agraria: Lima, Peru, 2014; Available online: http://repositorio.inia.gob.pe/handle/20.500.12955/473 (accessed on 30 September 2022).
  112. Schmidt, I.B.; de Urzedo, D.I.; Piña-Rodrigues, F.C.M.; Vieira, D.L.M.; de Rezende, G.M.; Sampaio, A.B.; Junqueira, R.G.P. Community-based native seed production for restoration in Brazil—The role of science and policy. Plant Biol. 2019, 21, 389–397. [Google Scholar] [CrossRef] [PubMed]
  113. Romijn, E.; Coppus, R.; De Sy, V.; Herold, M.; Roman-Cuesta, R.M.; Verchot, L. Land restoration in Latin America and the Caribbean: An overview of recent, ongoing and planned restoration initiatives and their potential for climate change mitigation. Forests 2019, 10, 510. [Google Scholar] [CrossRef]
Figure 1. Localization of Florida district in the department of Amazonas (Peru).
Sustainability 14 14866 g001
Figure 2. Methodological flowchart to evaluate Environmentally Sensitive Areas to degradation in Florida district, department of Amazonas (Peru).
Sustainability 14 14866 g002
Figure 3. Spatial representation of the constituent parameters SQI: (a) Parental material, (b) Slope, (c) Soil organic matter y (d) Texture; CQI: (e) Aridity, (f) Erosivity y (g) Aspect; VQI: (h) Drought resistance, (i) Erosion protection y (j) Vegetation cover; MQI: (k) Agricultural intensity y (l) Landslides.
Sustainability 14 14866 g003
Figure 4. Spatial representation of quality indicators: (a) SQI, (b) CQI, (c) VQI, and (d) MQI.
Sustainability 14 14866 g004
Figure 5. Environmentally sensitive areas to degradation in Florida district.
Sustainability 14 14866 g005
Figure 6. In situ validation of environmentally sensitive areas to degradation in Florida district, fragile areas (ad), and critical areas (em).
Sustainability 14 14866 g006
Figure 7. Restoration proposal flowchart in Florida district.
Sustainability 14 14866 g007
Table 1. Parameters, description, classes, and quality scores used for soil quality parameters.
ParametersDescriptionClassesQuality Scores
Parent materialPucara groupLow1.55
Mitu groupMedium1.60
Sarayaquillo formation, Goyllarisquizga group, and Chulec formation1.65
Chonta formationHigh1.70
Slope<2 Nearly levelLow1
2–6 Gentling slopingLow1.2
6–12 Moderately slopingMedium1.4
12–18 Strongly slopingMedium1.6
18–25 Moderately steepHigh1.7
25–35 SteepHigh1.8
35–60 Very steepHigh1.9
>60 Very steepHigh2
Organic matter content>6.0High1
2.1–6.0Medium1.3
2.0–1.1Low1.6
<1.0Very low2
Soil textureLoam, Sandy slay loam, Sandy loam, Loamy sand, Clay loam goodVery Low1
Sandy clay, Silt loam, Silty clay loam moderateLow1.2
Silt, And clay, Silty clay poorMedium1.6
Sand very poorHigh2
Table 2. Parameters, description, classes, and quality scores used for climate quality parameters.
ParametersDescriptionClassesQuality Scores
Aridity index<0.05 Hyper-arid zoneVery high2
0.05–0.2 AridHigh1.8
0.2–0.5 SemiaridMedium1.60
0.5–0.65 Dry subhumidMedium1.4
0.65–1 SubhumidLow1.2
>1 HumidVery low1
Erosivity0–60 Very lowVery low1
60–90 LowLow1.2
90–120 ModerateMedium1.5
120–160 SevereHigh1.8
>160 Very severeVery high2
AspectNorth, Northwest, Northeast, West, flat areasLow1
South, Southwest, Southeast, EastHigh2
Table 3. Parameters, description, classes and quality scores used for vegetation quality parameters.
ParametersDescriptionClassesQuality Scores
Drought resistanceForestsVery low1
GrasslandsMedium1.4
Pastures and cropsHigh1.7
Rainfed crops; bare floorsVery High2
Erosion protectionForestsVery low1
Pastures and cropsLow1.3
GrasslandsMedium1.6
Rainfed crops; bare floorsHigh2
Vegetation coverForests, GrasslandsLow1
Pastures and cropsMedium1.8
Rainfed crops; bare floorsHigh2
Table 4. Parameters, description, classes, and quality scores used for management quality parameters.
ParametersDescriptionClassesQuality Scores
Agricultural intensityForestsLow1
Grasslands, pastures and cropsModerate1.5
Rainfed crops; bare floorsHigh2
LandslidesStable terrainVery low1
Conditionally stable slopeLow1.4
Fossil landslidesMedium1.5
Dormant landslides1.6
Active landslides with dormant sliding processHigh1.8
Active landslides with present sliding processVery high2
Table 5. Area (km2) and percentages (%) corresponding to the four indicator quality classes in Florida district.
IndicatorQuality DescriptionRange of ScoresTotal Area (km2)%
SQIHigh<1.134.82.16
Moderate1.13–1.45197.0788.61
Low>1.4615.546.99
CQIHigh<1.15115.9752.14
Moderate1.15–1.81101.4445.61
Low>1.81--
VQIHigh<1.13101.0345.43
Moderate1.13–1.38113.1650.88
Low>1.383.221.45
MQIHigh1–1.25118.3753.22
Moderate1.26–1.5097.1743.69
Low>1.511.880.84
Urban area 0.740.33
Lake Pomacochas 4.251.91
Table 6. Environmentally sensitive areas to degradation in km2 and %, in Florida district.
ClassSub ClassRange of ScoresTotal Area (km2)%
Non-affectedN<1.1767.7430.46
PotentialP1.17–1.2234.4315.48
FragileF11.23–1.2641.7218.76
F21.27–1.3248.3821.75
F31.33–1.3718.568.34
CriticalC11.38–1.413.471.56
C21.42–1.532.681.21
C3>1.530.440.20
Urban area 0.740.33
Lake Pomacochas 4.251.91
Table 7. Correlation between quality and ESAI indices.
IndicesSQICQIVQIMQIESAI
SQI1−0.110.530.780.86
CQI−0.111−0.46−0.270.05
VQI0.53−0.4610.850.79
MQI0.78−0.270.8510.93
ESAI0.860.050.790.931
Publisher’s Note: MDPI stays neutral with regard to jurisdictional claims in published maps and institutional affiliations.

