1. Introduction
In recent years, the generation of wastewater with high levels of pollutants has increased due to industrial development and population growth, becoming a severe environmental and health challenge for society [
1]. Of the enormous amount of wastewater produced daily by various sources, 80% is discharged into the natural environment without meeting optimal water quality standards [
2], which causes severe impacts on aquatic ecology and the environment as well as in public health [
3] due to its toxic substances, such as heavy metals, organic compounds, aromatic hydrocarbons, antibiotics, and phenolic compounds [
4].
Considering all of the above, the adequate treatment of wastewater is necessary; however, conventional treatment techniques have limitations due to their high operating costs [
5], their generation of large amounts of waste, and their lack of efficiency, which results in the emission of greenhouse gases and harmful substances [
6]. As if that were not enough, its operation is oriented towards the consumption of electricity [
7], with 3% of electricity used in wastewater treatment processes [
8,
9], which generates another concern, namely the excessive use of fossil fuels for the production of energy, which, due to its limited availability and its adverse environmental effects, has led to the search for other sustainable sources [
10].
In this context, to address both problems, sustainable, low-cost, and efficient technologies are required [
11,
12]. In this regard, it should be said that microbial fuel cells (MFC) are being recognized as a sustainable and promising technology for the future of energy production while efficiently treating wastewater [
13]. These cells combine electrochemical reactions with microbial metabolism [
14] to generate electricity by oxidizing biodegradable organic substances [
15,
16]. Even so, an ideal performance has not been achieved due to the parameters that influence its operation, such as pH, electrode material, substrate dose, evaluation period, and cell configuration, among others [
17].
Due to the above factors, the research problem is as follows: What will the effect of the biomass of the microalga
Chlorella sp. on the removal of cadmium (Cd) and chemical oxygen demand (COD) in municipal wastewater be, as well as in the generation of electricity using MFC? This research was based on a theoretical basis by addressing a knowledge gap about the application of MFCs for the removal of heavy metals in wastewater [
18]. In addition, it allowed the optimization of the operating parameters of the cells, which will be beneficial for future research in this field [
19]. On the other hand, the practical and social justification was evidenced by contributing to the solution of an environmental problem, such as municipal wastewater treatment [
20].
On the other hand, it has been shown that microalgae and cyanobacteria carry out oxygenated photosynthesis even with small amounts of photosynthetic oxygen, help in electrogenesis, wastewater treatment (via anodic oxidation and cathodic reduction), and CO
2 capture (via cathodic reduction) [
21,
22]. Also, it has been shown that even small amounts of photosynthetic oxygen in the anode of microbial fuel cells have been able to benefit the growth of heterotrophic bacteria, which has managed to generate an certain level of electrical current [
23,
24]. A photo-bioreactor has been designed for the production of electricity using the
Chlorella sp. Microalgae as fuel, which used copper and zinc electrodes; managing to generate maximum values of 0.93179 ± 0.0323 V and 23.79 ± 0.9516 mA on 25 and 22 day, respectively [
25]. Likewise, Huarachi et al., 2018, generated electricity using the
Chlorella vulgaris microalgae and bacterial communities through microbial combustion cells with an efficiency of 95% [
26].
Therefore, the general objective of the investigation was to evaluate the effect of the biomass of Chlorella sp. on the removal of Cd and COD in municipal wastewater and on the generation of electrical energy using MFC, while the specific objectives were to evaluate the effect of the dose of Chlorella sp. on the removal of Cd in municipal wastewater using MFC; to evaluate the effect produced by the pH of municipal wastewater on the reduction in Cd using the biomass of Chlorella sp. in MFC; to assess the impact of time on the Cd degradation process at the optimal conditions of pH of the wastewater and dose of Chlorella sp. in MFC, as well as its influence on COD elimination; and finally, to evaluate the production of electrical energy in MFC during the experimental treatments. Taking as a hypothesis that the biomass of Chlorella sp. will significantly affect the removal of Cd and COD from municipal wastewater using MFC.
2. Materials and Methods
2.1. Municipal Wastewater Sample Collection
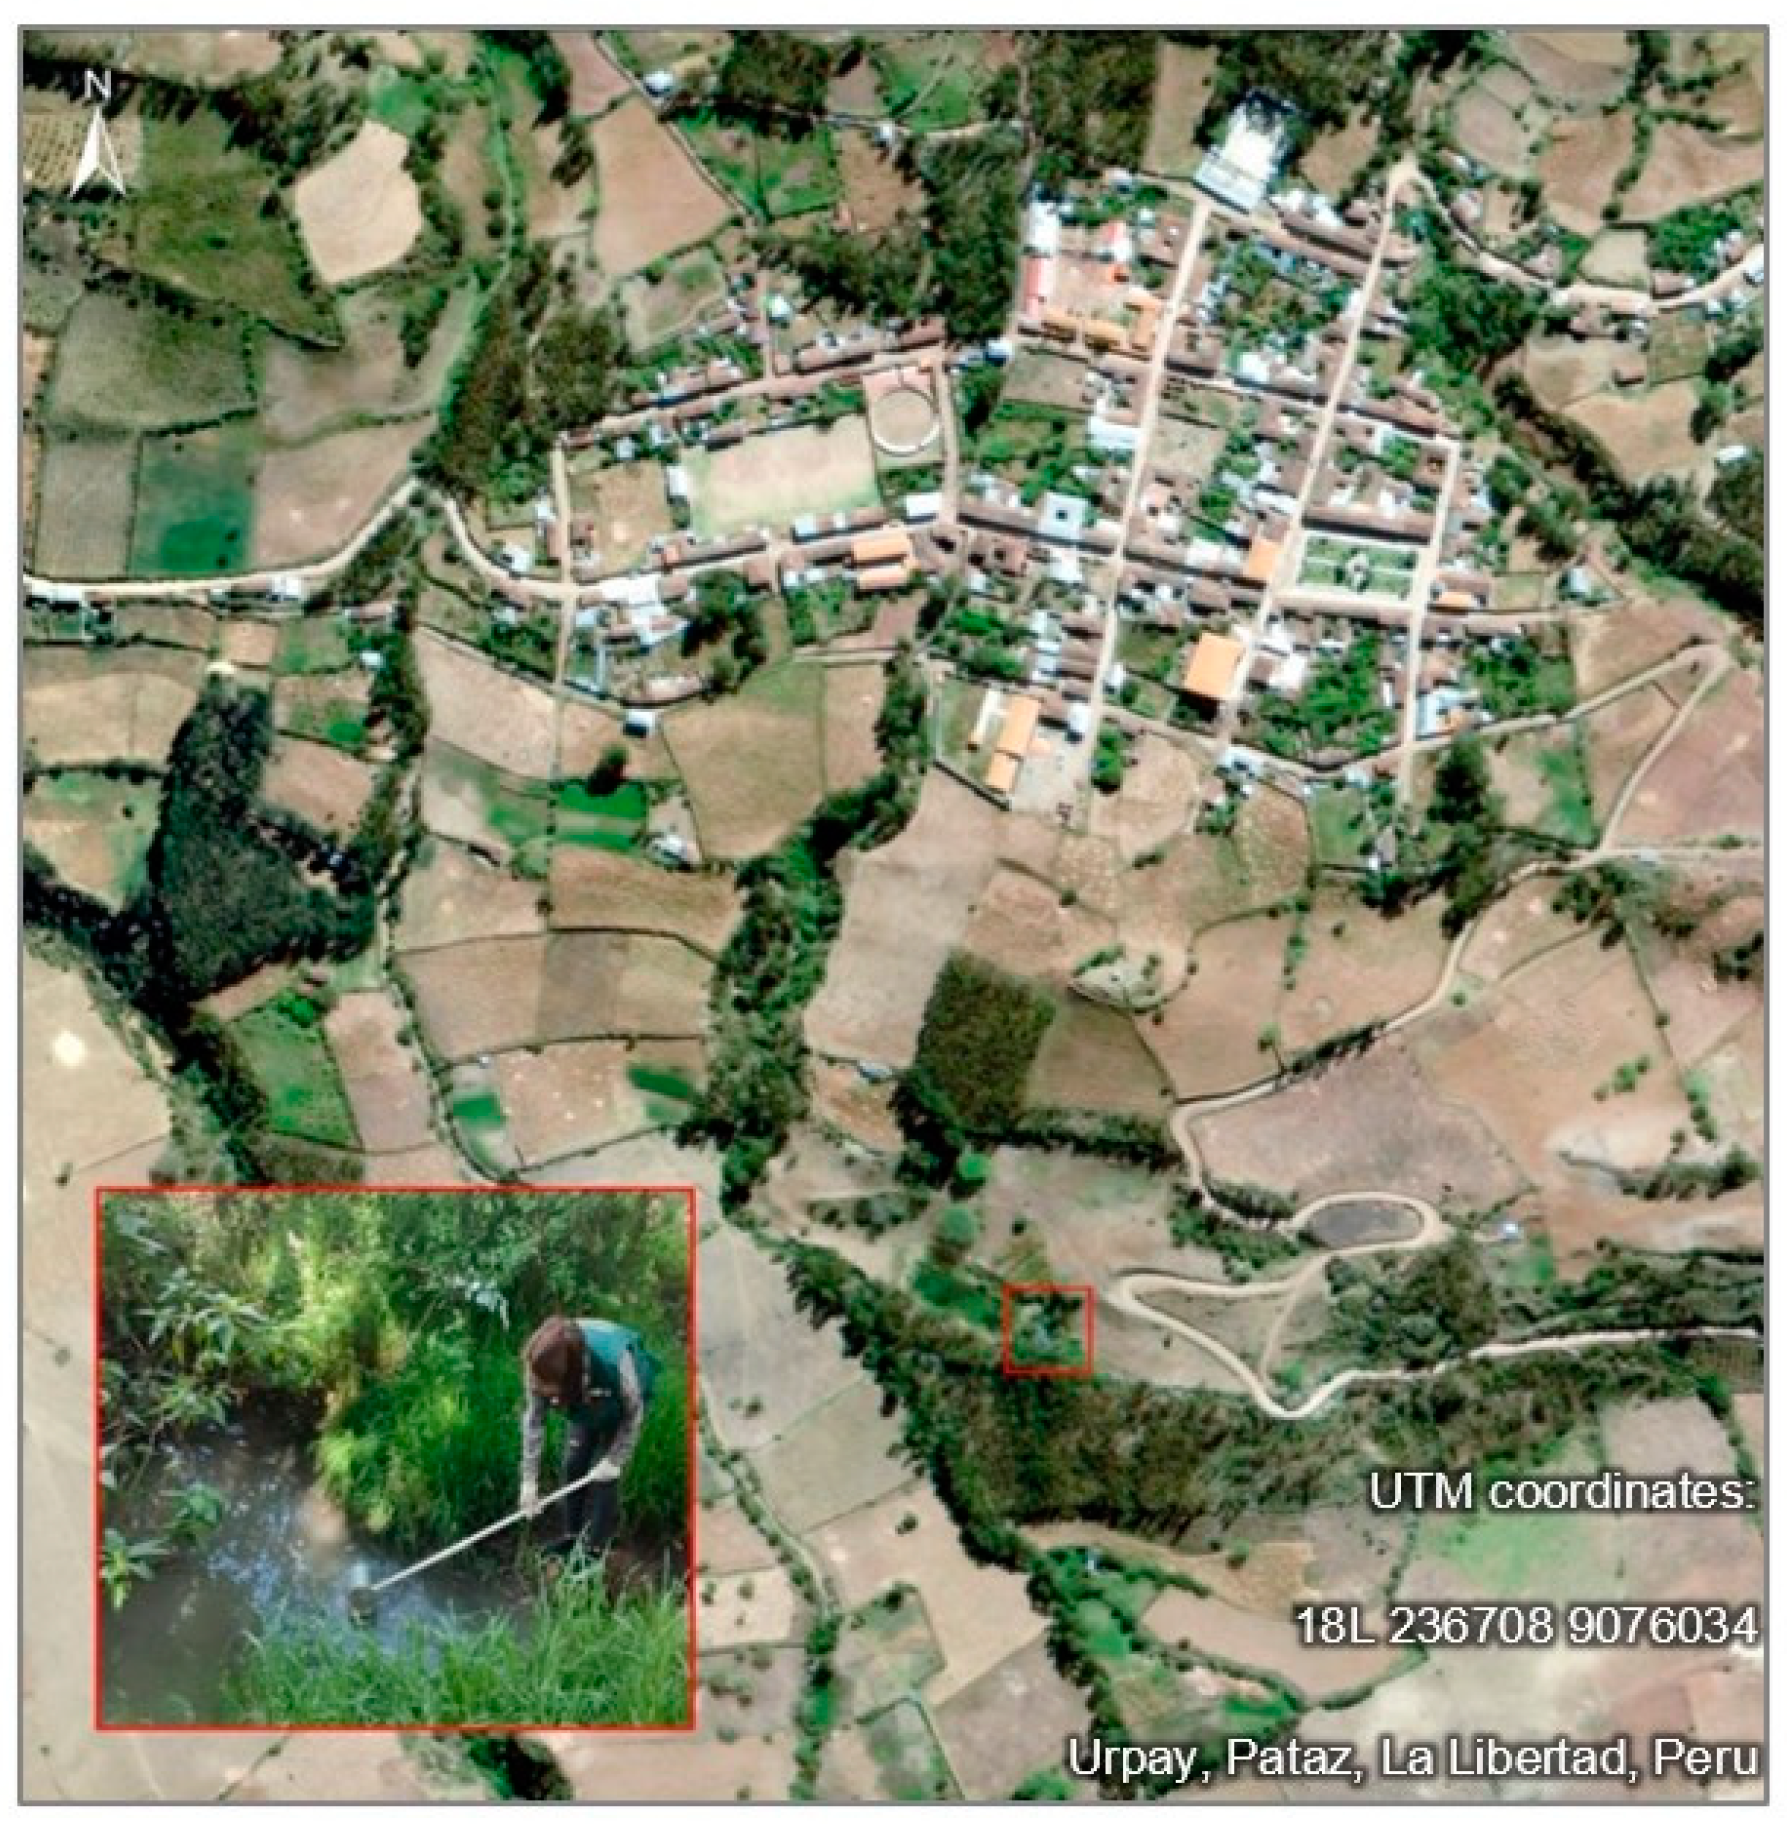
The untreated municipal wastewater sample was taken from the stabilization pond in the Urpay, province of Pataz, department of La Libertad, Peru (see
Figure 1). For the sampling, it was analyzed using the “National Protocol for Monitoring the Quality of Superficial Water Resources. R.J. N° 110-2016-ANA” and compound sampling was carried out, which consisted of taking simple samples at 5 sampling points established within the stabilization pond, with a fixed volume of 2.5 L for each point, which was homogenized in a 15 L high-density polyethylene container. The samples were stored at 4 °C and immediately transported to the laboratory of the Science and Technology Research Institute of the César Vallejo University-Trujillo to characterize the residual water.
2.2. Characterization of Municipal Wastewater
The characterization of wastewater was carried out based on the parameters of pH, temperature (°C), electrical conductivity (μs/cm), dissolved oxygen (mg/L), and total dissolved solids (mg/L), which were measured in triplicate using a HI98194 Multiparameter Meter; turbidity (NTU), which was measured with a Digital Turbidimeter TU-2016; and the COD (mg/L) and Cd (mg/L) were determined in an external laboratory. The COD was measured using the closed reflux colorimetric method according to the NTP 360.502:2016—Water Quality standard [
27], and the Cd was determined via the flame atomic absorption spectrometry of metals, according to the SMEWW-APHA-AWWA-WEF standard. Part 3111 B, 23rd edition [
28]. The results of the characterization are presented in the following table (
Table 1):
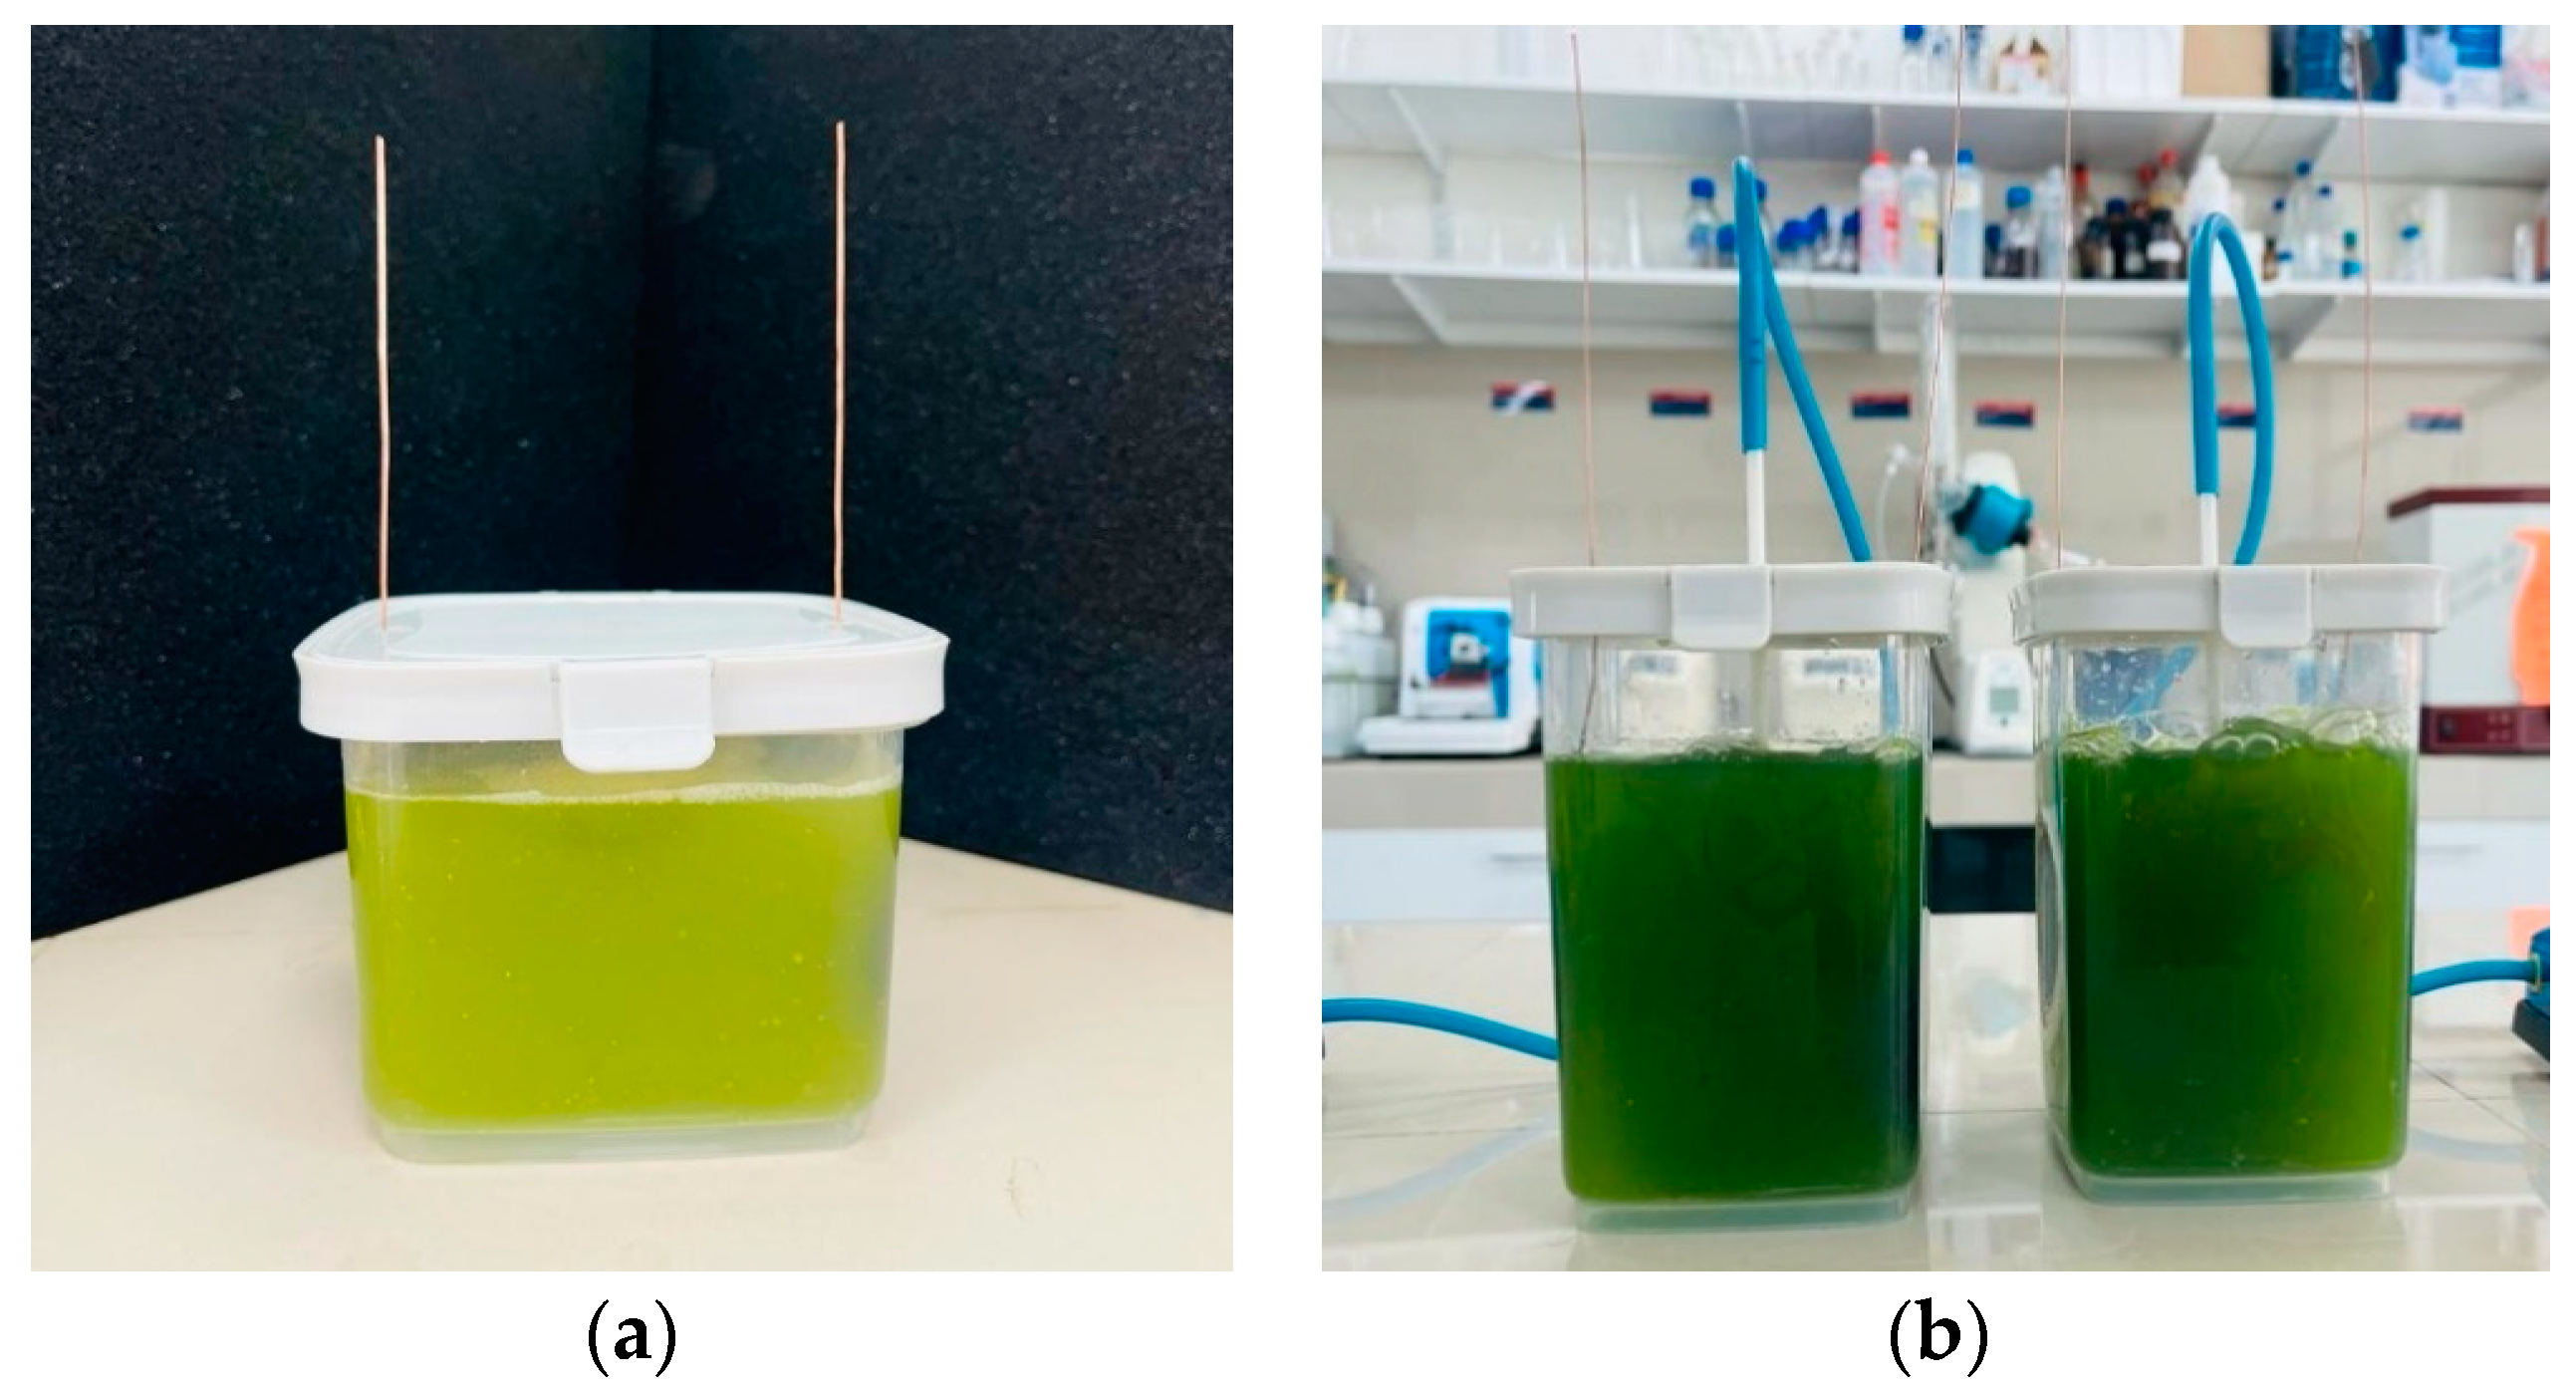
2.3. Preparation of the Culture Medium and Inoculum of Chlorella sp.
A total of 1500 mL of
Chlorella sp. culture medium was prepared, which consisted of a mixture of potassium chloride (0.255 g) and urea (2.55 g) in 1500 mL of previously filtered fish waste broth [
29]. The mixture was shaken and filled into 3 borosilicate flasks of 500 mL and sterilized at 121 °C for 30 min in an autoclave. An 850 mL biomass sample of
Chlorella sp. was added to the sterilized culture medium, and it was homogenized in order to divide it into 4 flasks, which were placed under artificial lighting using a 14 W E27 LED bulb and with mechanical aeration using 4 SB-248A air pumps (3.5 L/min). The flasks were at room temperature (22 ± 1.2 °C) for 7 days until the biomass increased before starting the treatments.
2.4. MFC Experimental Setup
Twenty-two single-chamber MFCs were manufactured using polypropylene (PP-5) containers (see
Figure 2). We worked with two batches of cells for the two operational stages that were carried out: the first batch consisted of 20 MFC with a capacity of 680 mL and the second batch constituted 2 MFC with a volume of 1100 mL. For the cathodic electrodes, aluminum (Al) plates of 5.2 ± 0.5 cm in diameter and 0.7 ± 0.1 cm thick were used. In contrast, the anodic electrodes comprised activated carbon of 25.35 ± 2.70 g in weight, were 5.2 ± 1 cm thick in diameter, and their surface area was 21.6 ± 1.2 cm
2. Electrodes were placed at both ends of the cells and connected to a 1 mm thick copper (Cu) wire towards the outside. The cathodic electrode was attached to an internal wall of the cell, to which a circular cut of 4.5 cm in diameter was made so that the electrode was in contact with the outside, while the anodic electrode floated at the other end without being attached to the inner wall of the cell. The cell covers were also made of PP-5, with a leak-proof rubber sealing ring, and two holes were made at the ends for the exit of the copper wire, and one in the center for the entry of the aeration hose [
25].
2.5. MFC Operation
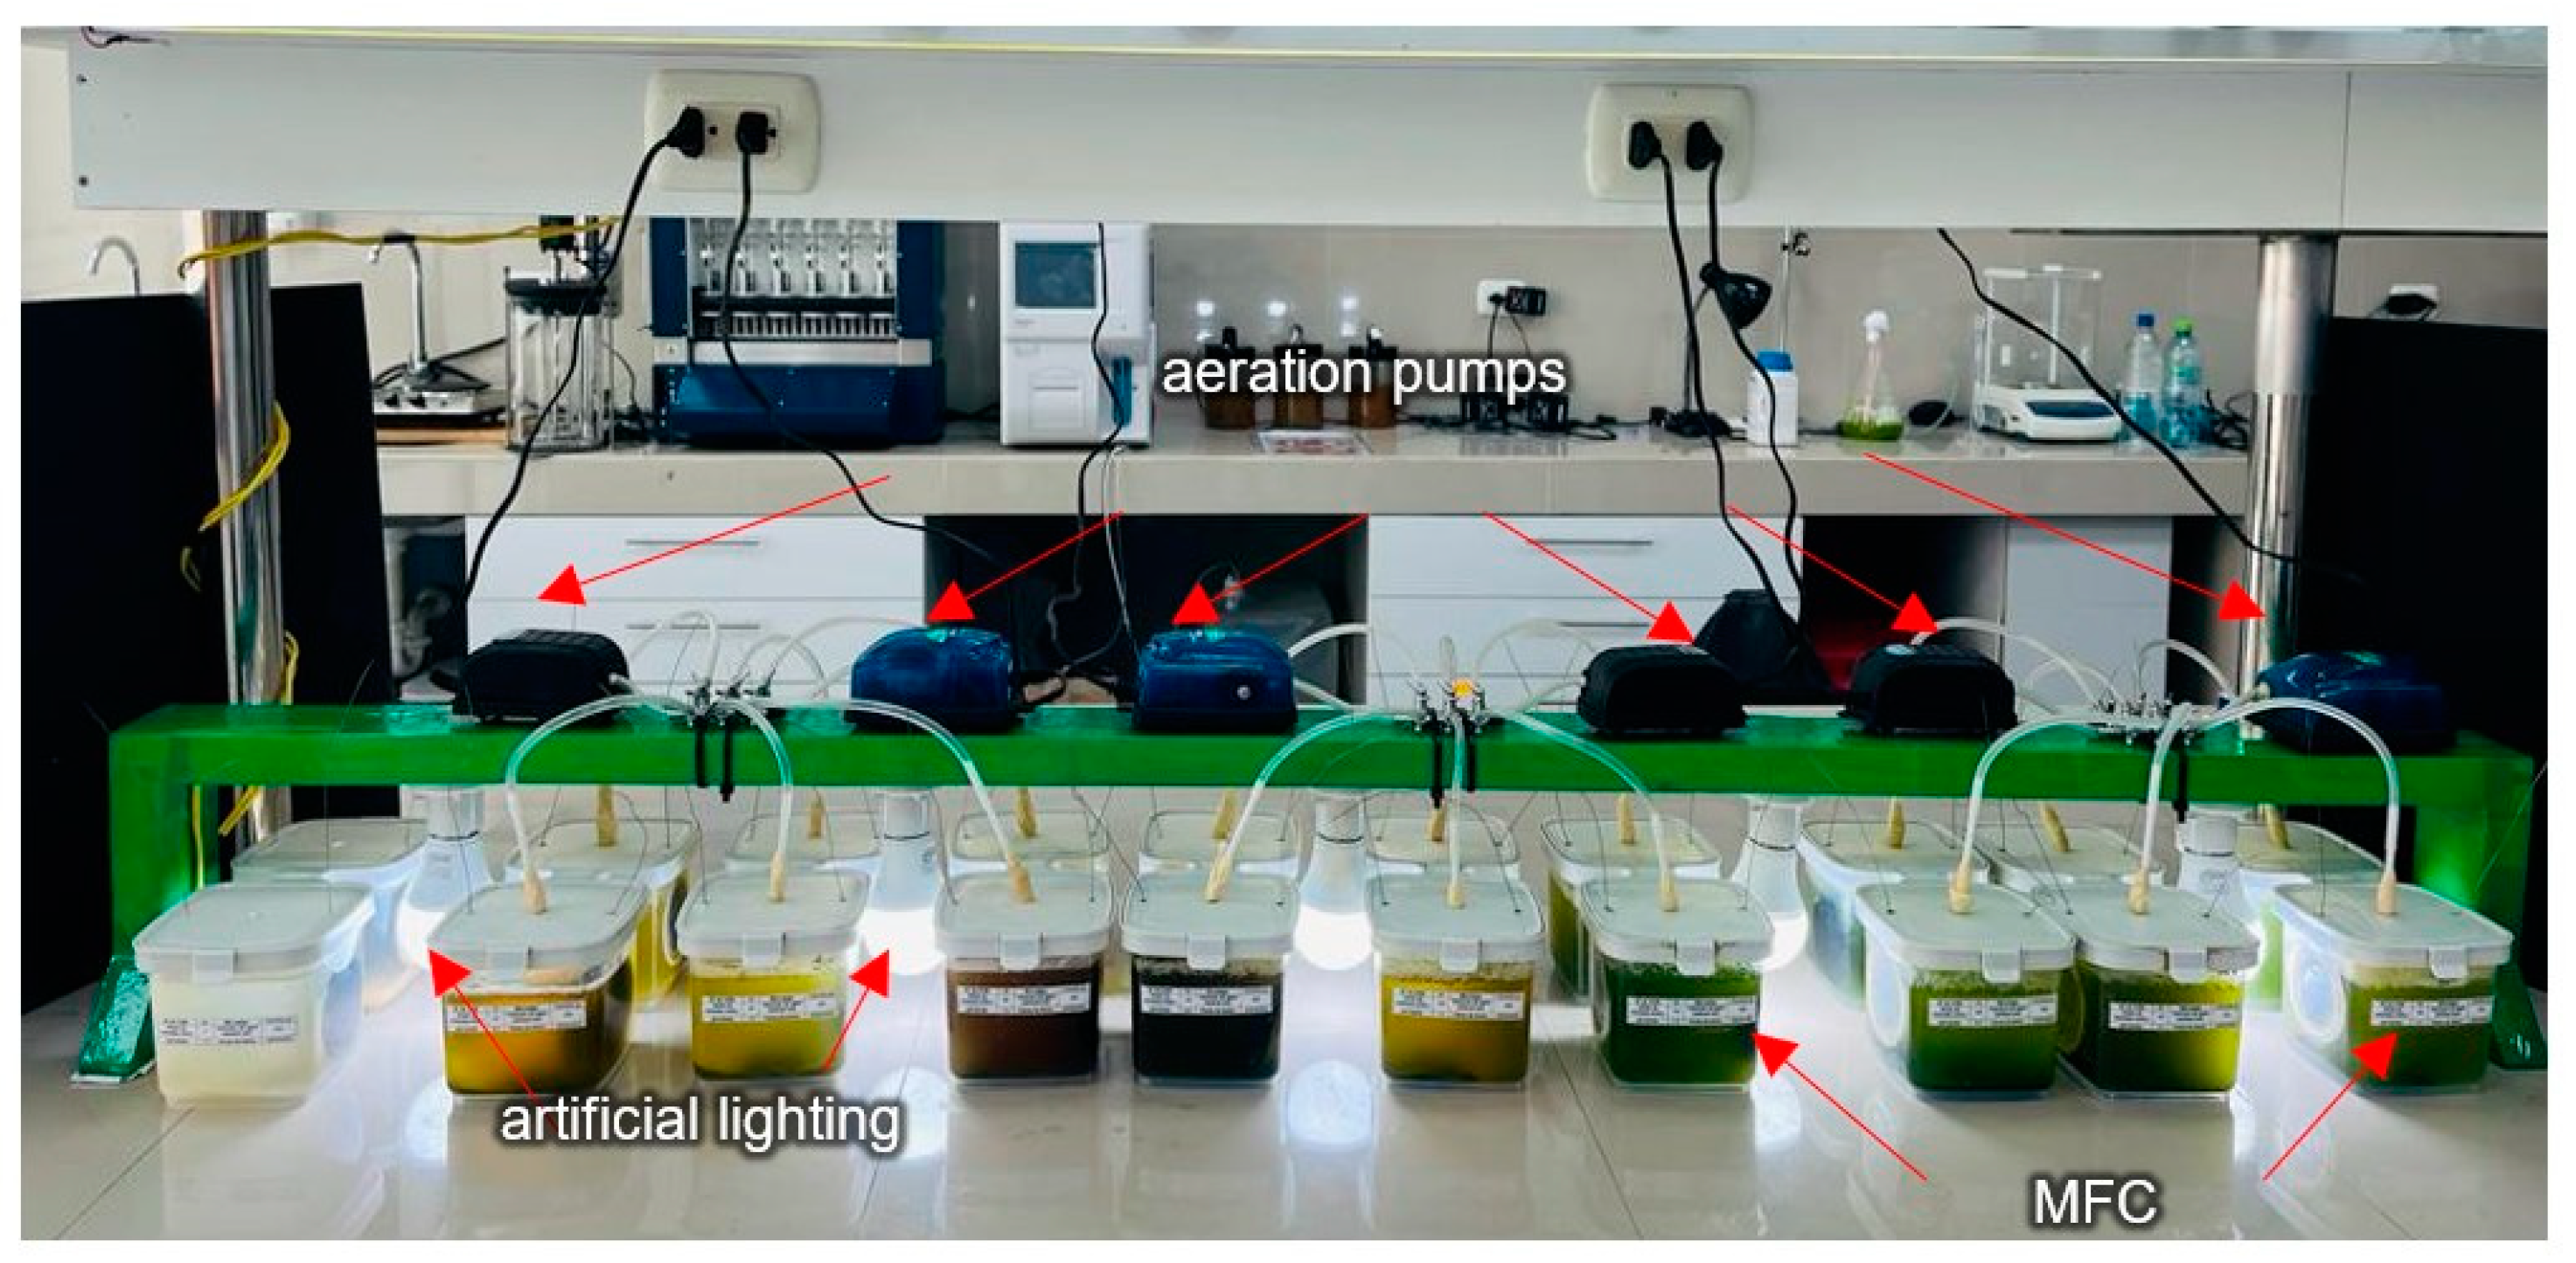
The experimental procedure was divided into two stages. For the first operational stage, the biomass of Chlorella sp. in concentrations of 10%, 20%, and 30% to evaluate the performance in the removal of cadmium from municipal wastewater at different pH 6.5, 7.0, and 7.5, and for the generation of electricity in the MFC. For this, the residual water sample was divided into 2400 mL, and the pH was adjusted with 1N Sodium Hydroxide (NaOH) up to the working values.
There were 9 treatments and a blank or control; work was carried out in duplicate (20 MFC in total). Each cell had a working volume of 500 mL, divided between the biomass dose of 50, 100 and 150 mL (10%, 20% and 30%, respectively) and the volume of municipal wastewater (see
Table 2). In addition, the following operational configurations were established for the first operational stage: the 20 MFC were at room temperature (22 ± 1.2 °C), under artificial lighting using 5 9 W E27 LED spotlights and with mechanical aeration using 6 SB-248A air pumps (5 L/min) during the 25 days of operation. An air pump was used for every 3 cells inoculated with the microalgae, while the control cells were not supplied with aeration.
Figure 3 shows the operational configuration established for the treatments during the first operational stage.
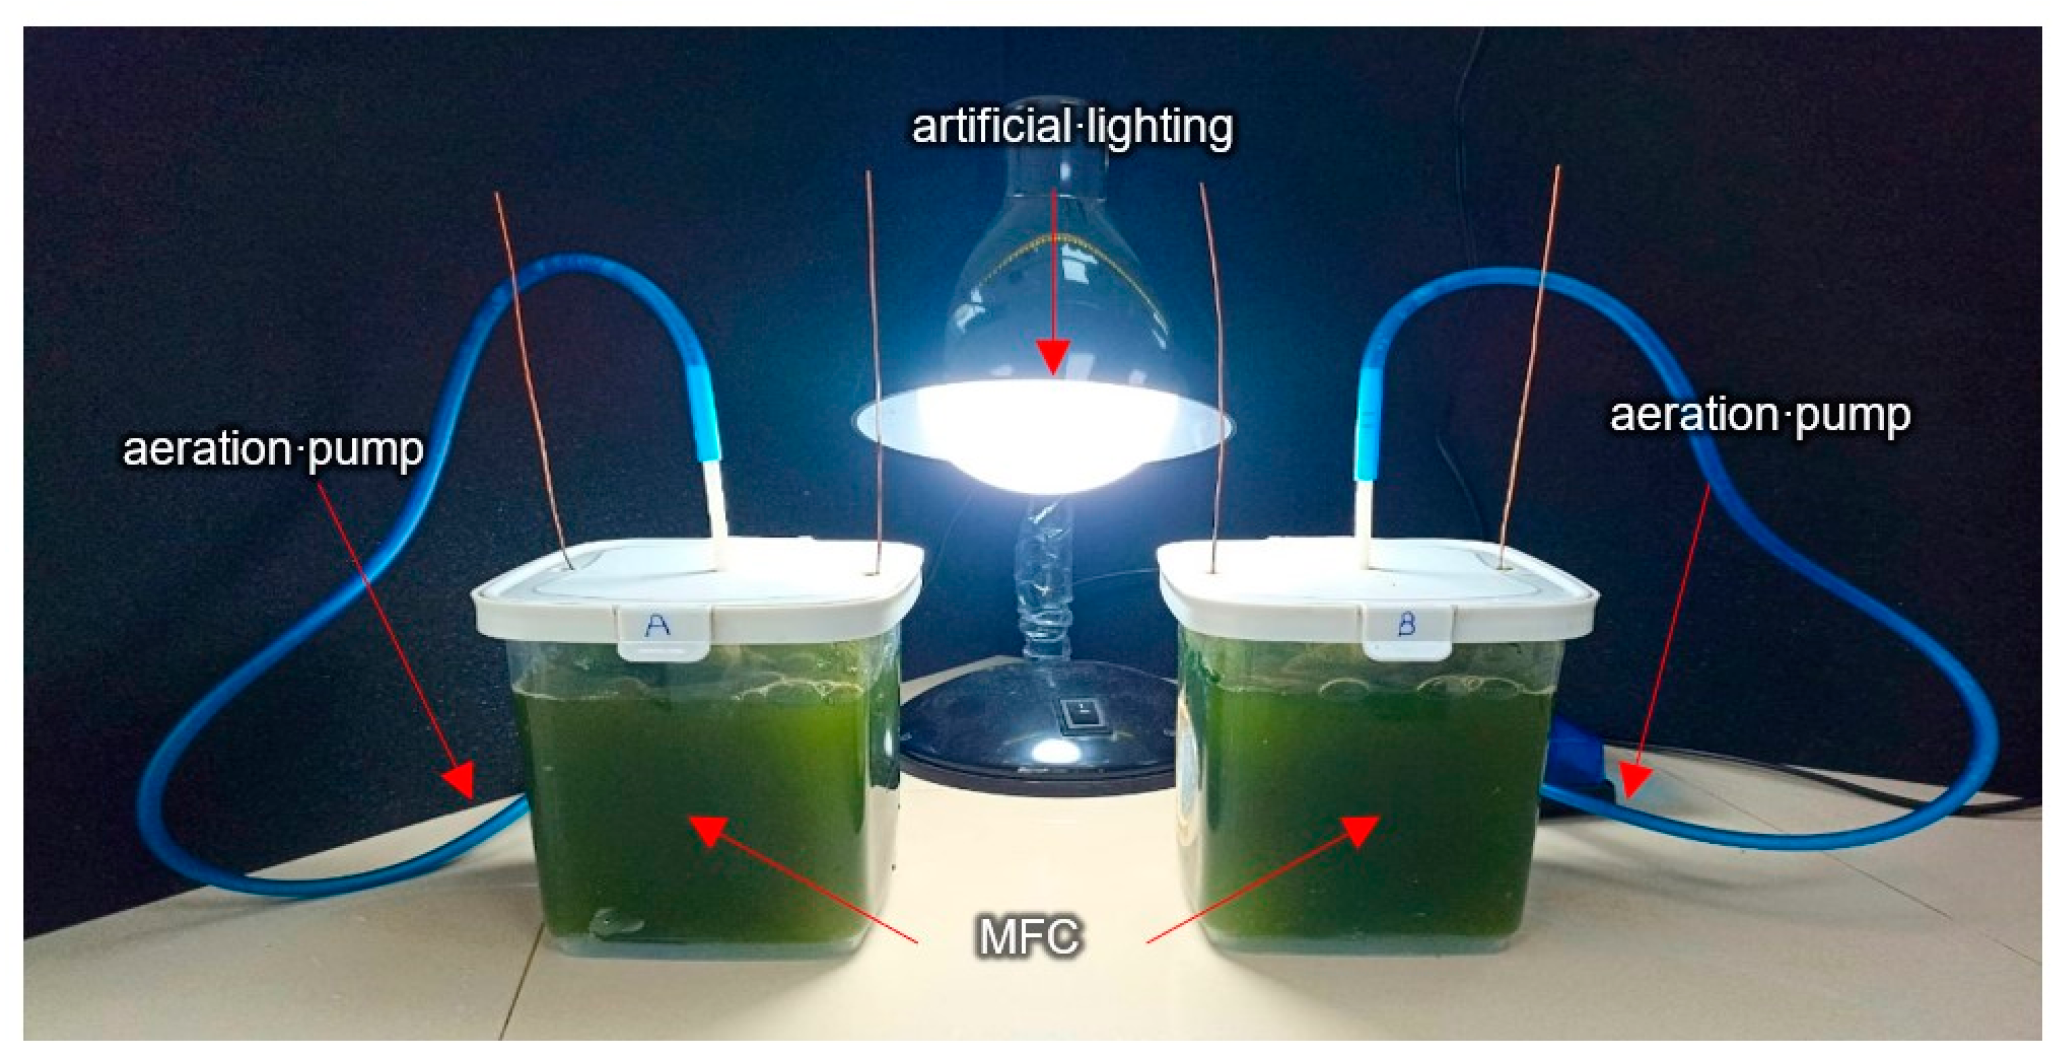
At the end of the first stage, it was determined that in the MFC with a 30% dose and in the municipal wastewater with a pH of 7.5, the best performance was had in the removal of Cd from the wastewater. For this reason, the dose concentration (30%) and pH (7.5) were replicated for the second operational stage with a larger volume of residual water (525 mL) in an evaluation time of 15 days, and its effectiveness was evaluated in terms of performance of the removal of cadmium and COD as well as in the generation of electricity in the MFCs. For the second stage of operation, MFCs A and B had a dose of 30% with a wastewater pH of 7.5, a volume of 525 mL, and within 15 days.
In this phase, the 2 cells were at room temperature (22 ± 1.2 °C), with artificial lighting through 1 14 W E27 LED bulb and with mechanical aeration using 1 SB-248A air pump (3.5 L/min) for each cell during the 15 days of operation, see
Figure 4 [
25].
2.6. Monitoring of Physicochemical Parameters of Wastewater
In the first operational stage, to evaluate the final concentration of Cd (mg/L), a sample of 200 mL of residual water was taken on the 25th day of monitoring, and it was analyzed externally in a laboratory using mass spectrometry (EPA Method 200.8, Revision 5.4, 1994). In addition, the pH and turbidity (NTU) of the wastewater were monitored daily using a PT-380 Portable Meter and a TU-2016 Digital Turbidimeter, respectively. While for the second stage, samples of 50 mL and 10 mL were taken to evaluate the concentration of Cd (mg/L) and COD (mg/L), respectively, on day 3, 6, 9, 12, and 15 of monitoring, and they were preserved in conditions of 22 °C to be analyzed externally at the end of the treatment in a laboratory. The COD was measured by means of the closed reflux colorimetric method (NTP 360.502:2016—Water Quality), and the Cd was determined via mass spectrometry (EPA Method 200.8, Revision 5.4, 1994). pH, electrical conductivity (μS/cm), dissolved oxygen (mg/L), and total dissolved solids (mg/L) were also monitored daily using a HI98194 Multiparameter Meter, and the turbidity (NTU) was measured with a Digital Turbidimeter TU-2016. Measurements were taken at room temperature (22 ± 1.5 °C). To determine the removal percentage, the following equation [
30] was utilized:
2.7. Monitoring of Electrochemical Parameters of MFCs
The electrochemical parameters of voltage (mV) and current intensity (mA) of the MFC were measured with a Truper MUT—830 Digital Multimeter, and the following external resistances were used: 1.92 ± 0.08, 10 ± 1.81, 50 ± 1.2, 100 ± 4.3, 200 ± 9.8, 300 ± 8, 500 ± 15, 750 ± 18, 800 ± 10, and 1000 ± 40 Ω. All measurements were taken daily at room temperature (22 ± 1.5 °C) for 25 days for the first operational stage and for 15 days for the second operational stage.
2.8. Biochemical Identification of Anode Microorganisms
At the end of the second operational stage, samples were taken from the anode electrodes of the MFCs by means of the swabbing technique, and they were preserved in sterile liquid amies for 24 h at 4 °C. Then, cultures were prepared on MacConkey Agar and Sabouraud agar medium with 4% glucose for the isolation of microorganisms. The inoculated samples were seeded in Petri dishes using the streak method and were incubated for 24–48 h at 35 °C [
18]. Pure cultures were obtained, and the strains were coded as MFCA-1 and MFCB-1. Biochemical identification was carried out using the VITEK-2 Compact Microbiological Auto-analyzer, where the suspension of the strains was carried out in two test tubes with sterile saline solution, and then they were homogenized. Afterwards, the optical density was measured using a Densichek Plus VITEK-2 via the McFarland method, until the two strains were in the range of 0.50 to 0.63. Subsequently, the identification cards and the test tubes with the suspension were placed in the cassette of the VITEK-2 Compact Microbiological Autoanalyzer. The optical density was set at a wavelength of 660 nm and within the McFarland pattern (0.50–0.63). The analysis time for the identification of the bacteria was approximately 6 h. Finally, microscopic readings were taken where the morphological and microscopic characteristics of the microorganisms identified via Gram staining were observed.
2.9. Analysis of the Characteristics of Activated Carbon Electrodes
After taking the anode samples from the MFCs in the second operational stage, analyzes were performed using techniques such as scanning electron microscopy (SEM) and energy-dispersive X-ray spectroscopy (EDS). These analyses allowed us to examine the morphology and elemental composition of the surface of the electrodes. In addition, the Fourier-transform spectroscopy (FTIR) technique was used to identify the chemical composition of the biofilm adhered to the electrodes.
2.10. Data Analysis Method
The collected data were analyzed with the InfoStat software (Version-2020), in which the analysis of variance (ANOVA) was performed to determine whether there were significant differences between the different treatments applied for the removal of Cd from wastewater. Subsequently, the LSD Fisher test was carried out to identify the differences between the different treatments and determine the optimal dose of Chlorella sp., the ideal pH of the wastewater and the appropriate time for removing Cd and COD.
3. Results and Discussion
3.1. Effect of the Dose of Chlorella sp. on the Removal of Cd from Municipal Wastewater in MFC
For the effect of the biomass of
Chlorella sp. on the removal of cadmium from municipal wastewater over a 25-day treatment period, see
Figure 5. The concentration of the metal was evaluated at the beginning and the end of the treatment. The following figure shows the removal of cadmium at different doses of microalgae applied to each MFC.
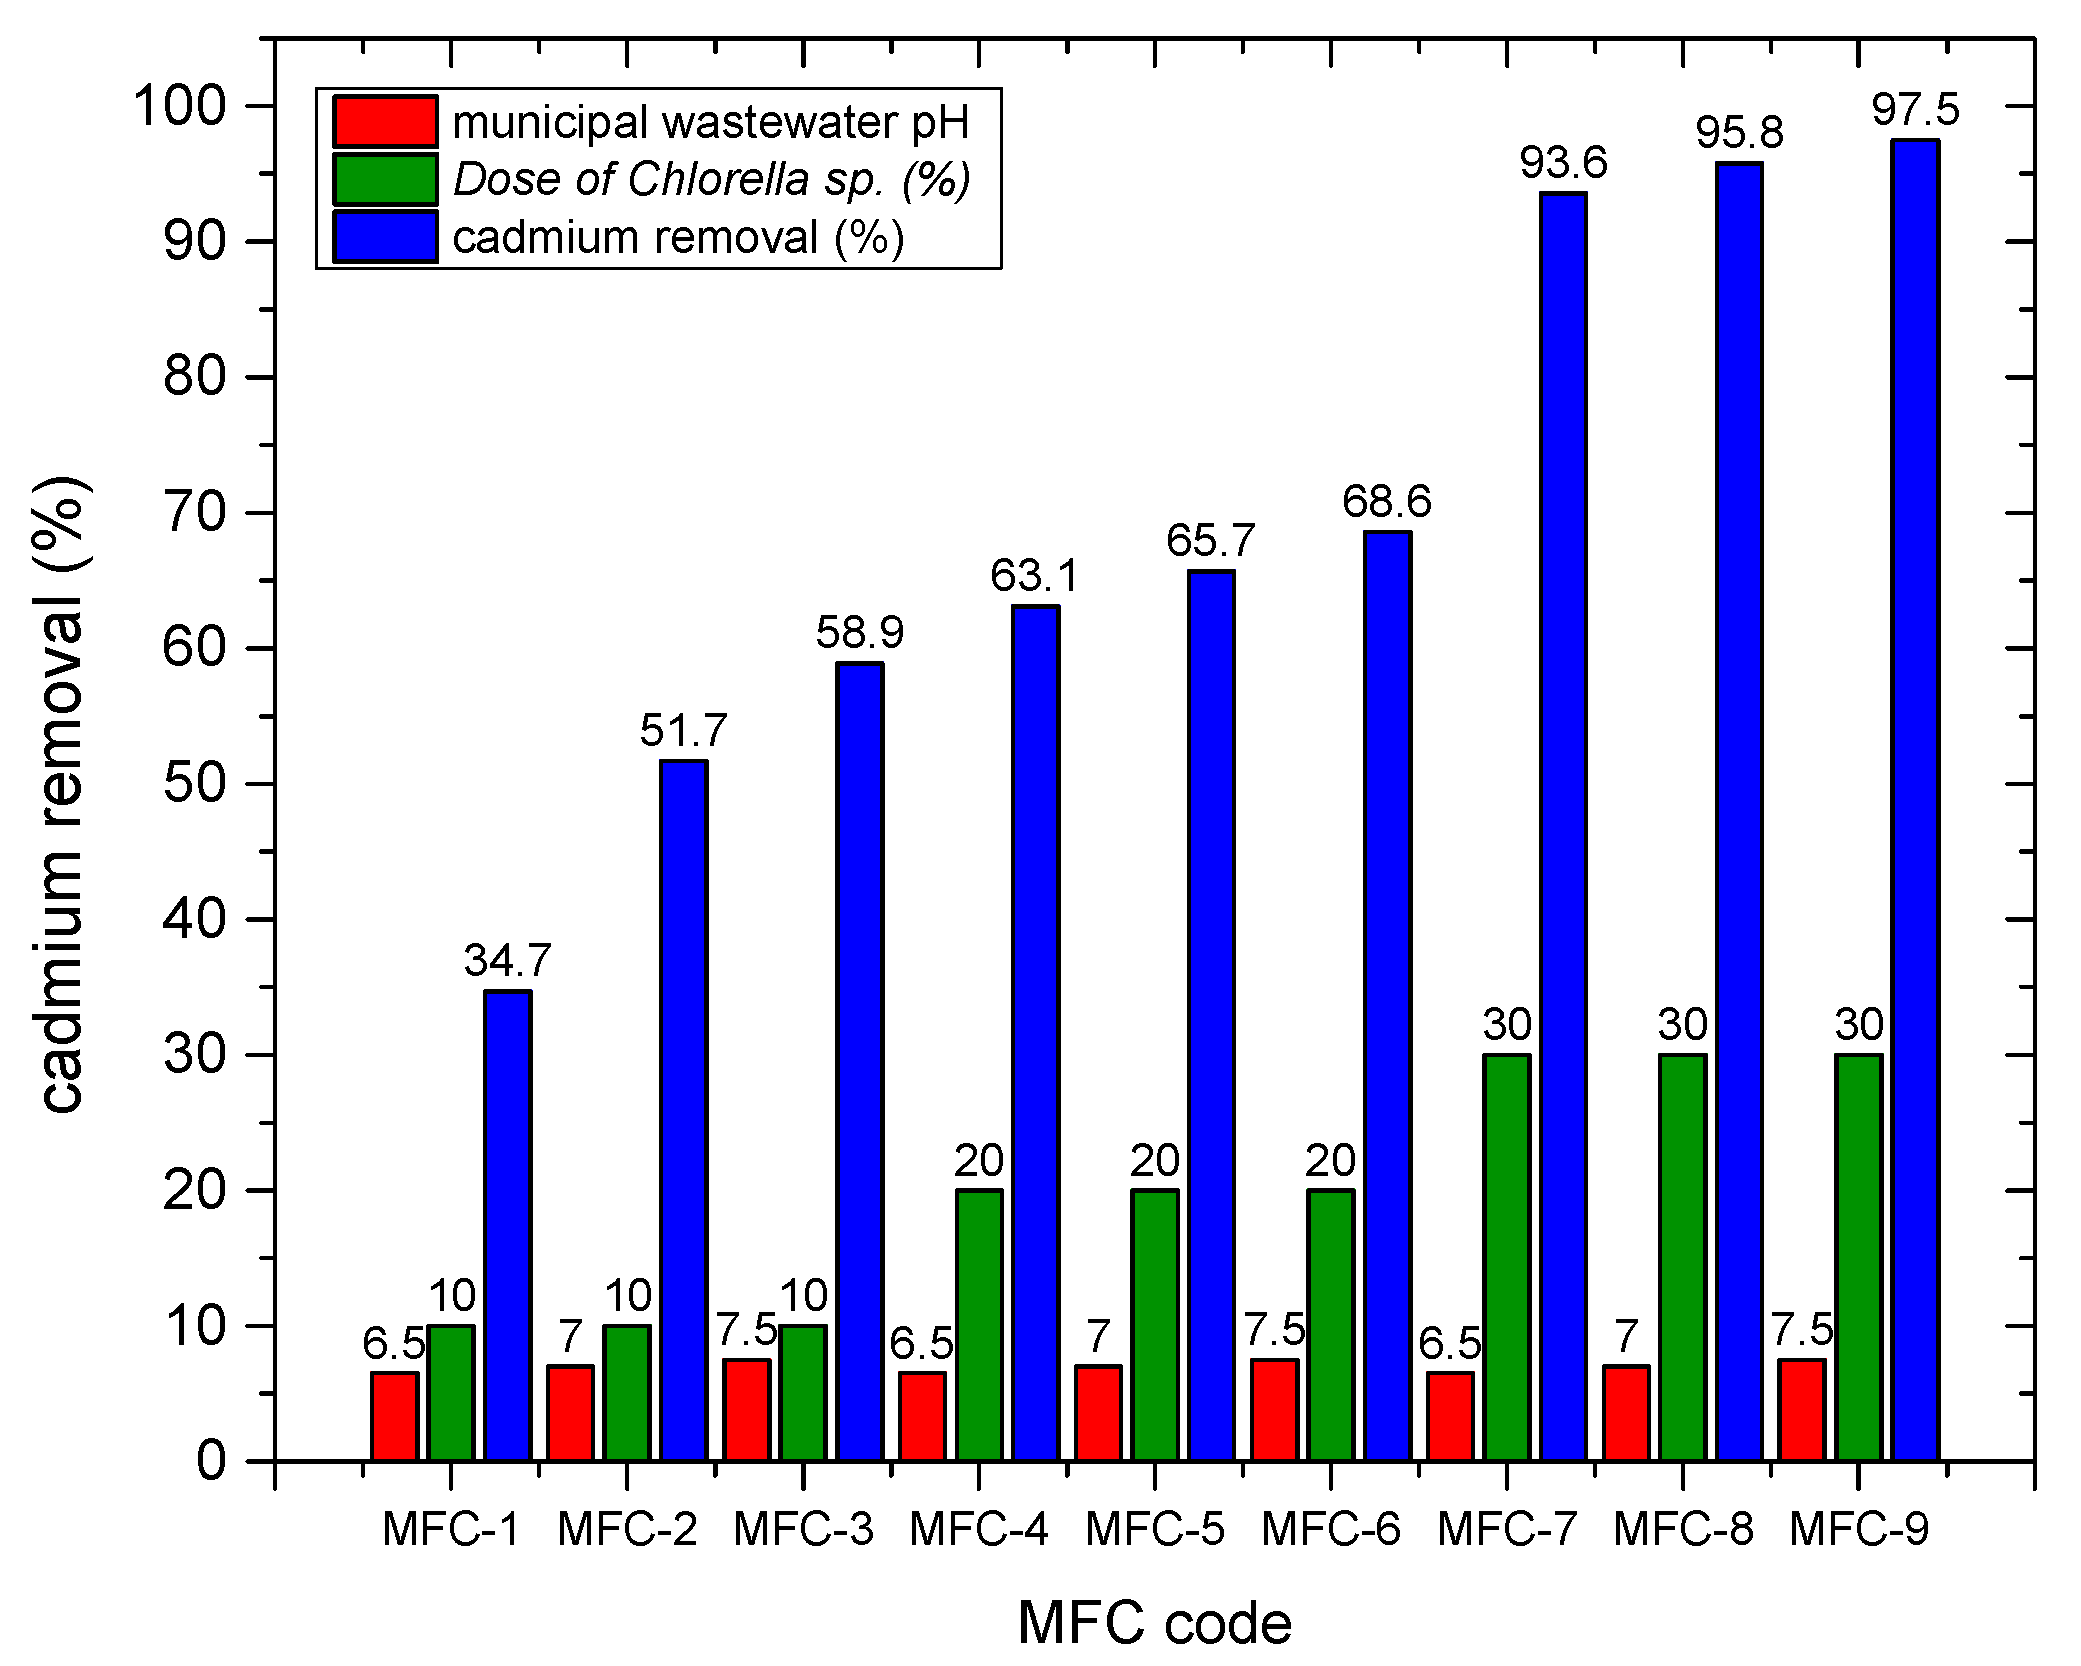
Figure 5 shows the percentages of cadmium removal from municipal wastewater for each applied dose of
Chlorella sp. in MFCs. It is shown that in MFC 7, 8, and 9 with biomass doses of
Chlorella sp. of 150 mL (30%), the most significant metal reduction was achieved, reaching removal percentages of 93.6%, 95.8%, and 97.5%, respectively. While in the cells inoculated with doses of 100 mL (20%), removal levels of 63.1% (MFC4), 65.7% (MFC5), and 68.6% (MFC6) were obtained. Finally, in MFC 1, 2, and 3, the dose supplied was 50 mL (10%) and the elimination percentages were 34.7%, 51.7%, and 58.9%, respectively. The maximum removal values obtained in this research are higher than those described by other researchers, such as Zhang et al. (2018), who achieved a complete Cd removal of 95% using
Chlorella sp. QB-102 in the biocathode of dual chamber MFC [
31], while Singh and Kaushik (2021) removed 87% of the metal in distillery wastewater using double compartment MFC with wetland sediment [
32].
In order to determine the optimal dose of Chlorella sp. for the removal of Cd from wastewater, the LSD Fisher test was used, which allowed us to identify whether there were significant differences between each dose applied in the treatments by comparing the removal means. With all of the above, the following hypotheses were suggested: the removal of Cd from wastewater is the same for each dose of Chlorella sp. applied, or the removal of Cd from the wastewater is not equal for each amount of Chlorella sp. applied. The following tables present the analysis of variance and the LSD Fisher test used to determine the optimal dose of Chlorella sp. for the removal of Cd from municipal wastewater:
Table 3 shows that the value of
p < 0.05, so the alternative hypothesis is accepted: The removal of cadmium from the residual water is not the same for each dose of
Chlorella sp. applied. In addition, there is a highly significant difference (
p < 0.0001) between each applied dose.
Likewise,
Table 4 shows that with the treatments with the 30% dose of
Chlorella sp., the highest level in eliminating cadmium from wastewater was obtained, with an average removal percentage of 96.12%, followed by the 20% dose with an average elimination of 62.47%, and by the 10% dose with an average removal of 48.80%. Using the LSD Fisher test, it is evident that there is a highly significant difference between the levels of cadmium removal from wastewater obtained for each applied dose of
Chlorella sp., and it is shown that the treatments using the highest dose (30%) presented the best efficiency in metal removal. Jaafari and Yaghmaeian (2019) used colonial
Chlorella in doses of 1–3 g/L to remove heavy metals in an aqueous solution (5–15 mg/L) and demonstrated that if the dose of microalgae applied in the treatment is increased, the percentage of elimination of Cd increases (97.05%) [
33]. In the same way, Lui et al. (2023) used
Chlorella sorokiniana for the removal of Cd (II) in an initial concentration of 100 mg/L in a synthetic solution. They concluded that increasing the biomass of algae achieves a greater effect in the removal, eliminating 72.83% of the metal [
34].
3.2. Effect of the pH of Municipal Wastewater on the Removal of Cadmium Using the Biomass of Chlorella sp. in MFC
The effect of the pH of municipal wastewater on the removal of Cd was also evaluated using the biomass of Chlorella sp. for 25 days of treatment. The following figure shows the removal of cadmium via different pH levels evaluated from the residual water in each MFC.
For its part,
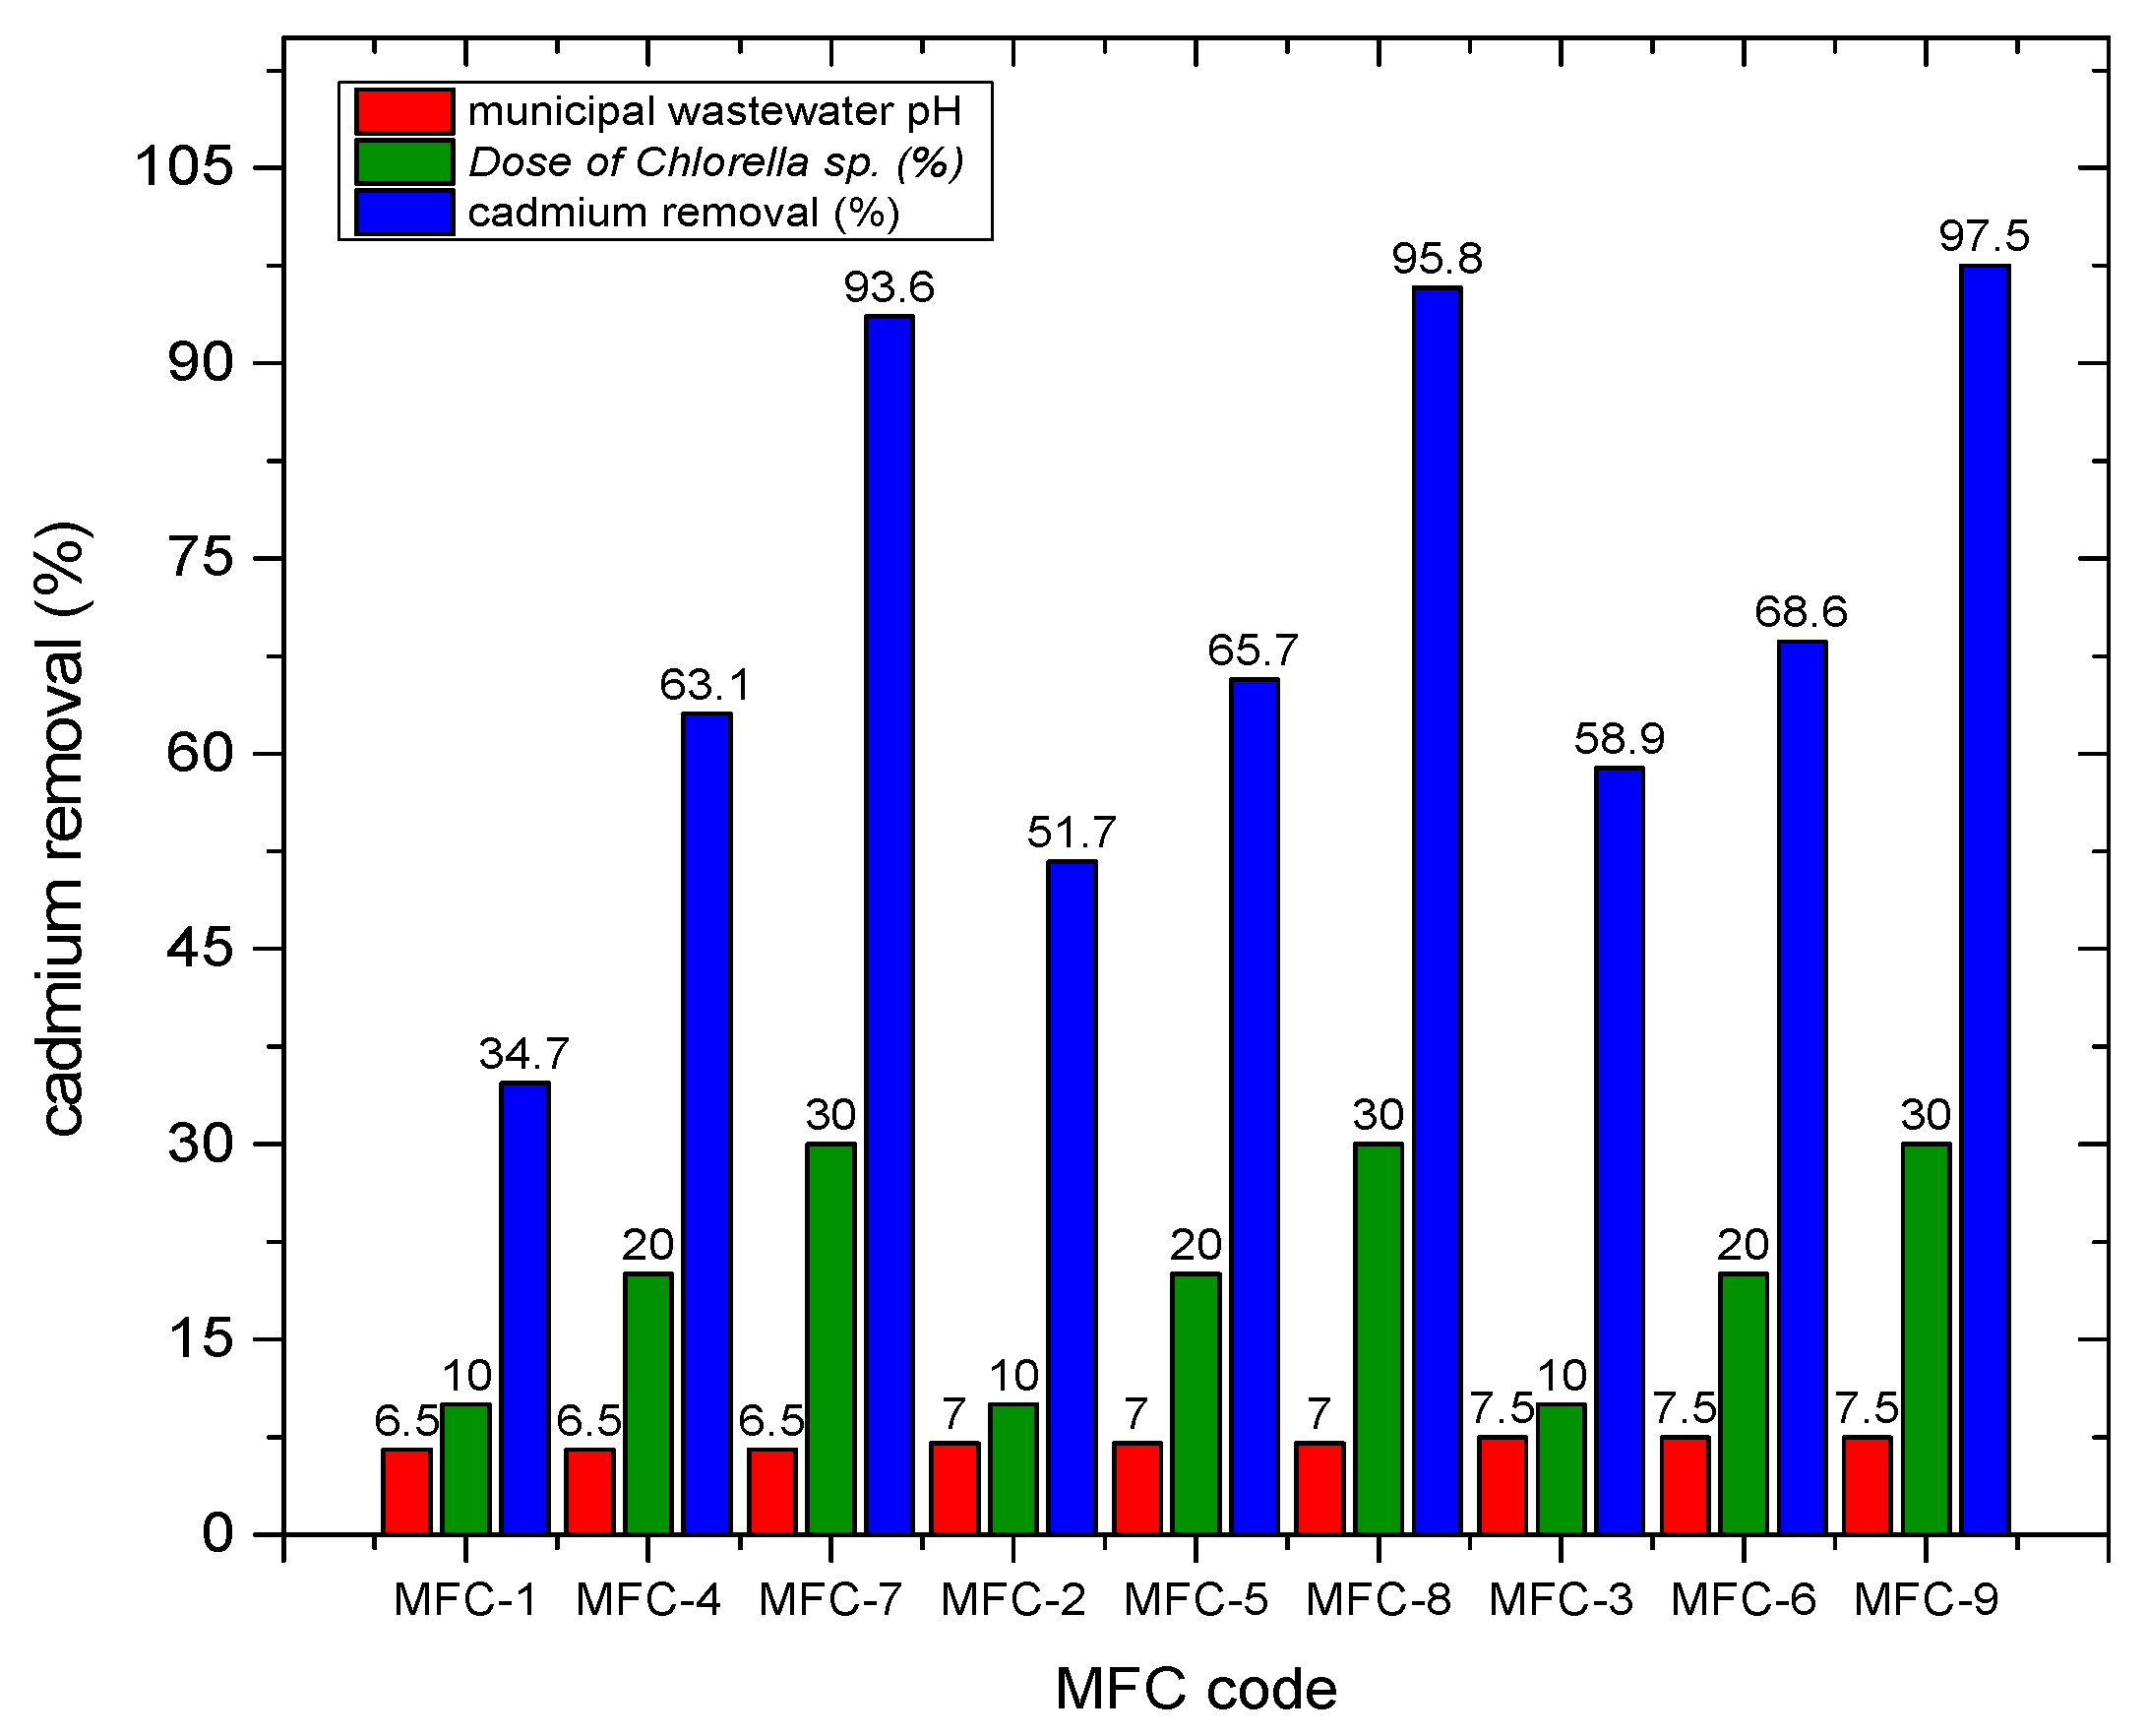
Figure 6 shows the percentages of cadmium removal at the different pH values of the residual water evaluated in each MFC. It can be seen that in the cells where an initial pH of 6.5 was used, removals of 34.7% (MFC1), 63.1% (MFC4), and 93.6% (MFC7) were achieved. In the MFC2, MFC5, and MFC8 cells, the initial pH was 7, and removal levels of 51.7%, 65.7%, and 95.8%, respectively, were achieved. While in cells with a pH of 7.5, Cd was removed by 58.9% (MFC3), 68.6% (MFC6), and 97.5% (MFC9). Likewise, it was observed that the removal results did not vary significantly when doses of
Chlorella sp. were 20% and 30%, but there were significant differences when the dose was 10%. Chiranjeevi and Patil (2020) demonstrated that the metabolic and biochemical processes of microalgae are favored when the wastewater is treated with pH values of 7–8 [
35]. The results are contrasted with those obtained by Abourached, Catal, and Liu (2014), who achieved a cadmium removal of 89% at a pH of 7.1 from the wastewater [
36].
To determine the best pH of the municipal wastewater evaluated for the elimination of Cd, the same LSD Fisher statistical test was used, which allowed the identification of significant differences between the different pH values evaluated in the treatments. Based on the above, the following options were formulated: Cd removal is equal to different evaluated pH of wastewater, or Cd removal is not equal to different evaluated pH of wastewater.
In
Table 5, it can be seen that the
p value > 0.05, so the null hypothesis is accepted: cadmium removal is equal to different pH values of municipal wastewater. In addition, it was found that the removal means are not significantly different (
p > 0. 5569) between each evaluated pH level.
In addition,
Table 6 shows that the treatments at different pH levels of the evaluated municipal wastewater did not present significant differences, since it was observed that the treatments at an initial pH of 7.5 achieved an average elimination of 75.14%. In comparison, at an initial pH of 7.0, there was an average removal percentage of 71.05%, and at an initial pH of 6.5, the average removal was 61.30%. From the results of the LSD Fisher test, it was observed that there are no significant differences between the cadmium removal levels obtained at different pH values of the wastewater evaluated. Even so, it was found that the treatments with an initial pH of 7.5 achieved the best performance in eliminating Cd with an average of 75.14%. Ribeiro et al. (2022) observed a similar trend in their research, since they did not present significant differences in the pH evaluated in the MFC for the removal of phosphorus, nitrogen, and total organic carbon from the wastewater (
p > 0.05) [
37]. Likewise, pH is crucial in removing contaminants through a microalgae-assisted MFC. This is because the pH regulates the balance of micro-algae growth to generate active biofilms on the cathode, which facilitates the removal of contaminants (Christhwardana et al., 2020) [
38]. Most studies have revealed that the wastewater pH range of 6–8 is optimal for the outstanding performance of MFCs in power generation (Elshobary et al., 2021) [
39] and for the metabolic activity of microorganisms in the removal of contaminants present in the substrate (Saran et al., 2023) [
40]. In addition, Varanasi et al. (2020) demonstrated that
Chlorella sp. thrives in a pH of 7.5–8.0, and its metabolic process is impaired outside that range [
41].
3.3. Effect of Time on the Removal of Cd and COD at the Optimal Conditions of pH of the Wastewater and Dose of Chlorella sp. in MFC
The effect of time on the cadmium degradation process was evaluated at the optimal pH conditions of the residual water (7.5), and biomass dose of
Chlorella sp. (30%) in MFC; its influence on COD elimination was also evaluated. For this, the concentration of Cd and COD was evaluated at 3-day intervals over 15 days of treatment.
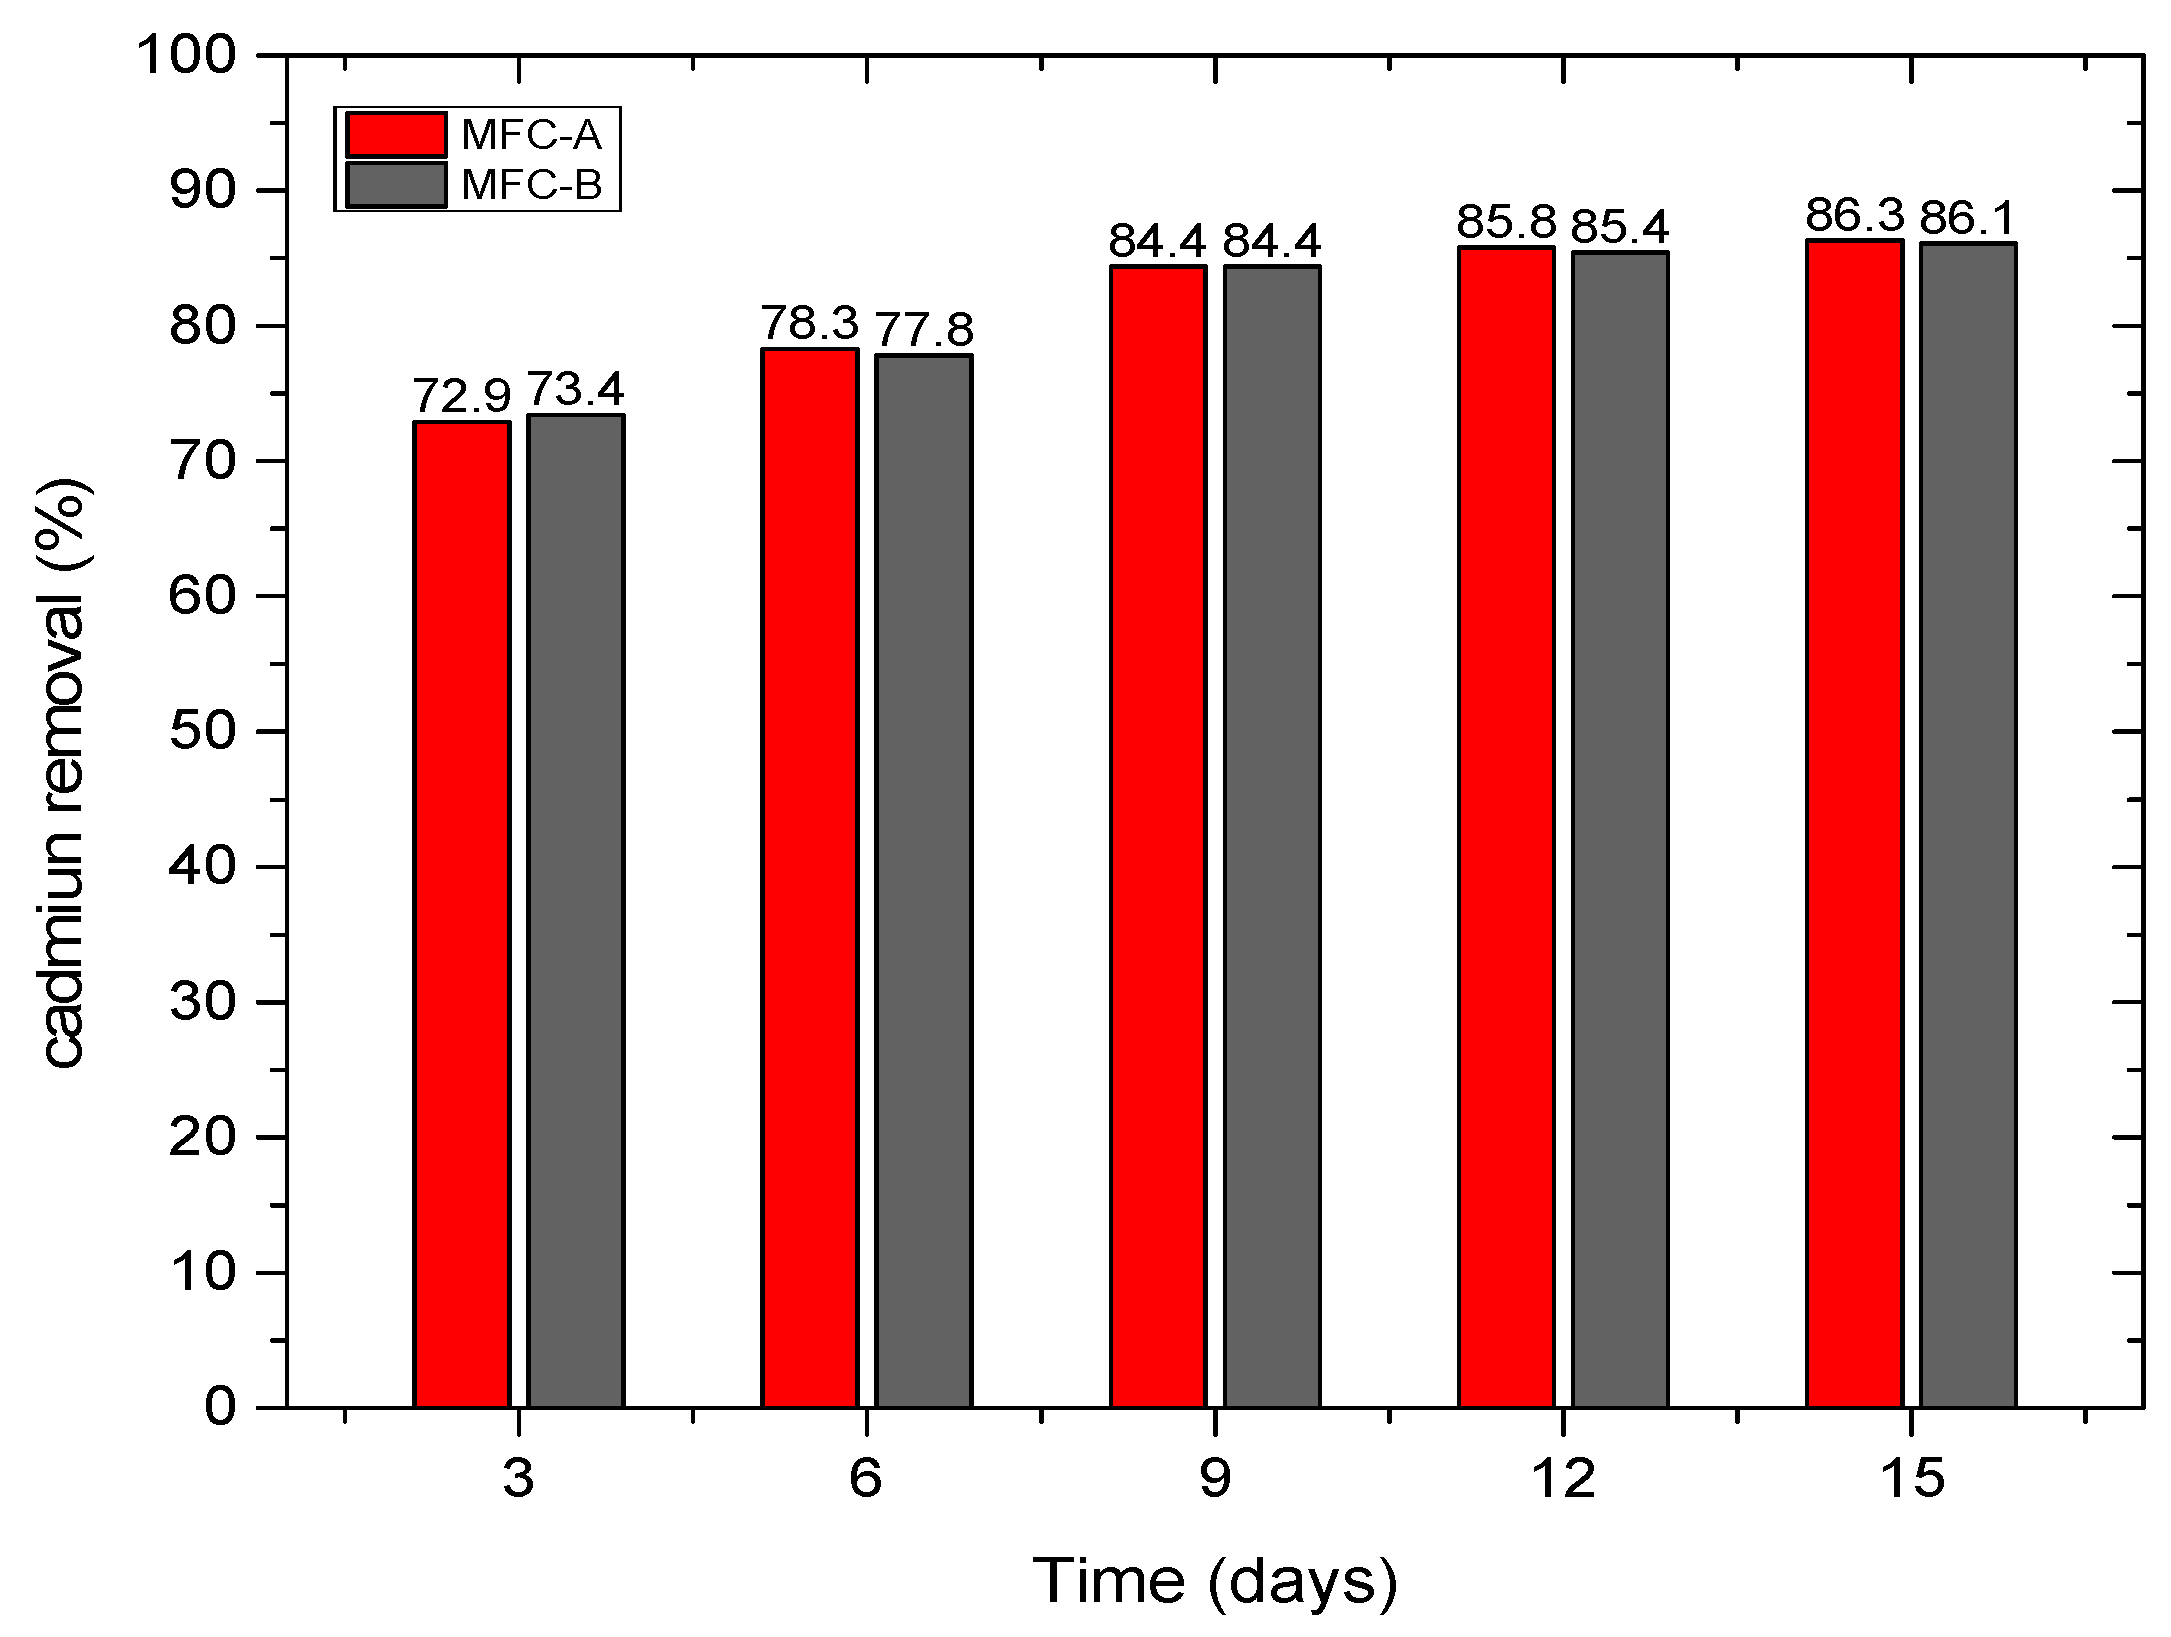
Figure 7 shows the removal of Cd over time for each MFC inoculated with
Chlorella sp. at 30% and in municipal wastewater with an initial pH of 7.5.
According to
Figure 7, the removal of cadmium in municipal wastewater increased progressively as the days passed. On the third day of treatment, it was possible to remove approximately 72.9% of the metal in MFC A and 73.4% in MFC B, and by day 15, the removal reached 86.27% in MFC A and 86.10% in MFC B. These results indicate that a greater removal of Cd is achieved when the treatment time is prolonged, exceeding 86.10% after 15 days and reaching 97.67% metal removal in 25 days. This is supported by the findings of Jaafari and Yaghmaeian (2019), who demonstrated that the percentage of Cd removal in colonial Chlorella-assisted MFCs increased as the reaction time increased, reaching a maximum of approximately 92.2% after 100 h, then gradually and steadily decreased [
33].
To determine the effect of time on the degradation of cadmium, the LSD Fisher test was used, which made it possible to identify significant differences between the different days evaluated by comparing the removal means. Based on the above, it was examined as to whether the Cd removal of municipal wastewater is the same on any evaluated day of treatment or whether the Cd removal of municipal wastewater is different on any evaluated day of treatment.
Table 7 shows that the value of
p < 0.05; therefore, the alternative hypothesis is accepted: The removal of cadmium from municipal wastewater is the same on any evaluated day of treatment. In addition, there is a highly significant difference (
p < 0.0001) between each day evaluated.
On the other hand,
Table 8 shows that on day 15 of treatment the greatest removal of Cd from municipal wastewater was achieved, with an average removal percentage of 86.19%, followed by days 12, 9, 6, and 3, with means of cadmium removal of 85.36%, 84.36%, 78.11%, and 73.14%, respectively. However, from the LSD Fisher test detailed in
Table 8 and
Table 9, it can be seen that there are very significant differences between the levels of cadmium removal obtained on the different days of treatment evaluated, and a greater removal of Cd is achieved when the treatment period is longer. As determined by Zhao et al. (2023) in their study, the adsorption of Cd by
Chlorella increases as the adsorption time elapses, which translates into an effective removal of the metal when the treatment period is prolonged, managing to remove more than 95% [
42].
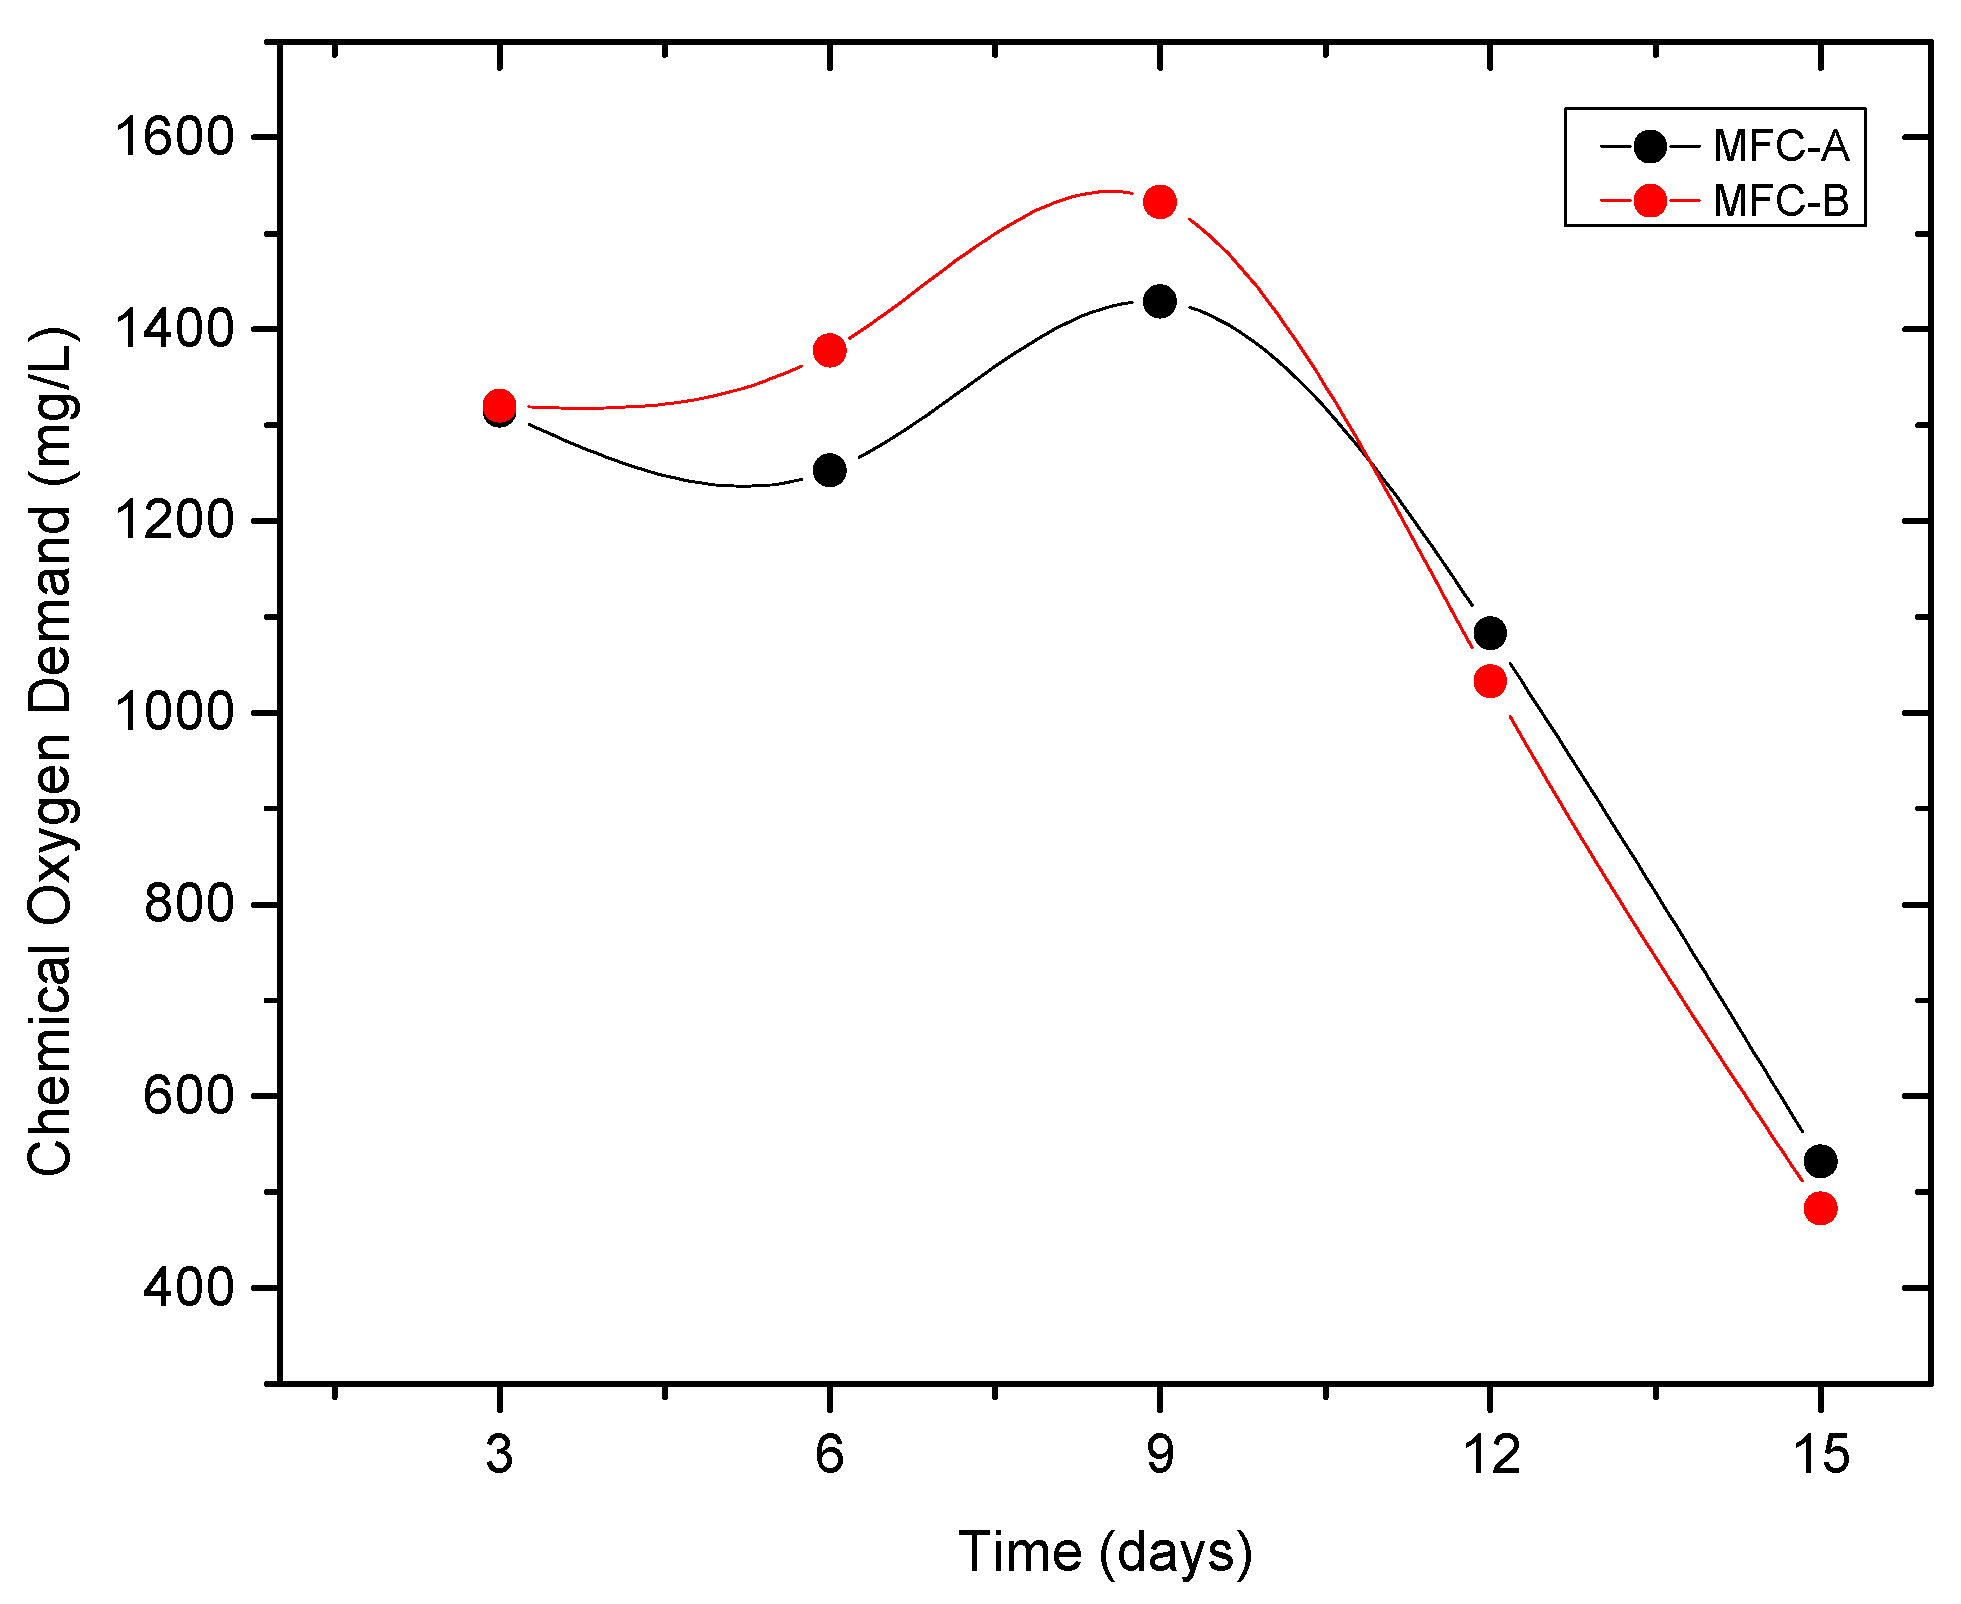
Regarding the chemical oxygen demand (COD), measurements were taken on days 3, 6, 9, 12, and 15 to evaluate its variation during the treatment period due to the application of
Chlorella sp. biomass at 30% in residual water with an initial pH of 7.5 (see
Figure 8). It can be seen that during the first 9 days of treatment, the COD increased to values of 1429 mg/L and 1533 mg/L in MFC A and MFC B, respectively. However, in the days after, a considerable decrease was observed over time, reaching day 15 with values of 532 mg/L (MFCA) and 483 mg/L (MFCB). The results show similarity with those found by Nayak and Ghosh (2019), who reported that COD removal in MFC inoculated with
Scenedesmus abundant increased progressively between days 10 and 15 of the 21-day treatment, achieving maximum removal, namely 77% [
43]. The COD increase in wastewater depends on several factors. The COD is a measure that indicates the amount of oxygen necessary to oxidize the organic compounds present in the wastewater through chemical processes [
44]. When microalgae are added to wastewater, they can consume part of the organic compounds through photosynthesis, which could result in a decrease in COD [
45]. However, if the concentration of microalgae is high and there is an abundant presence of organic matter, the oxygen demand for decomposition via the microalgae may exceed the COD-reducing effect, which could result in an increased net COD [
46].
3.4. Production of Electrical Energy in MFC during the Experimental Treatments
The production of electrical energy in the cells was evaluated as a complementary process to the removal of Cd and COD from municipal wastewater. For this, the voltage and electric current parameters were monitored every day during the treatment period of the first and second operative stages. The following figures show the recorded data of the voltage and electrical current generated by the cells in the first experimental stage.
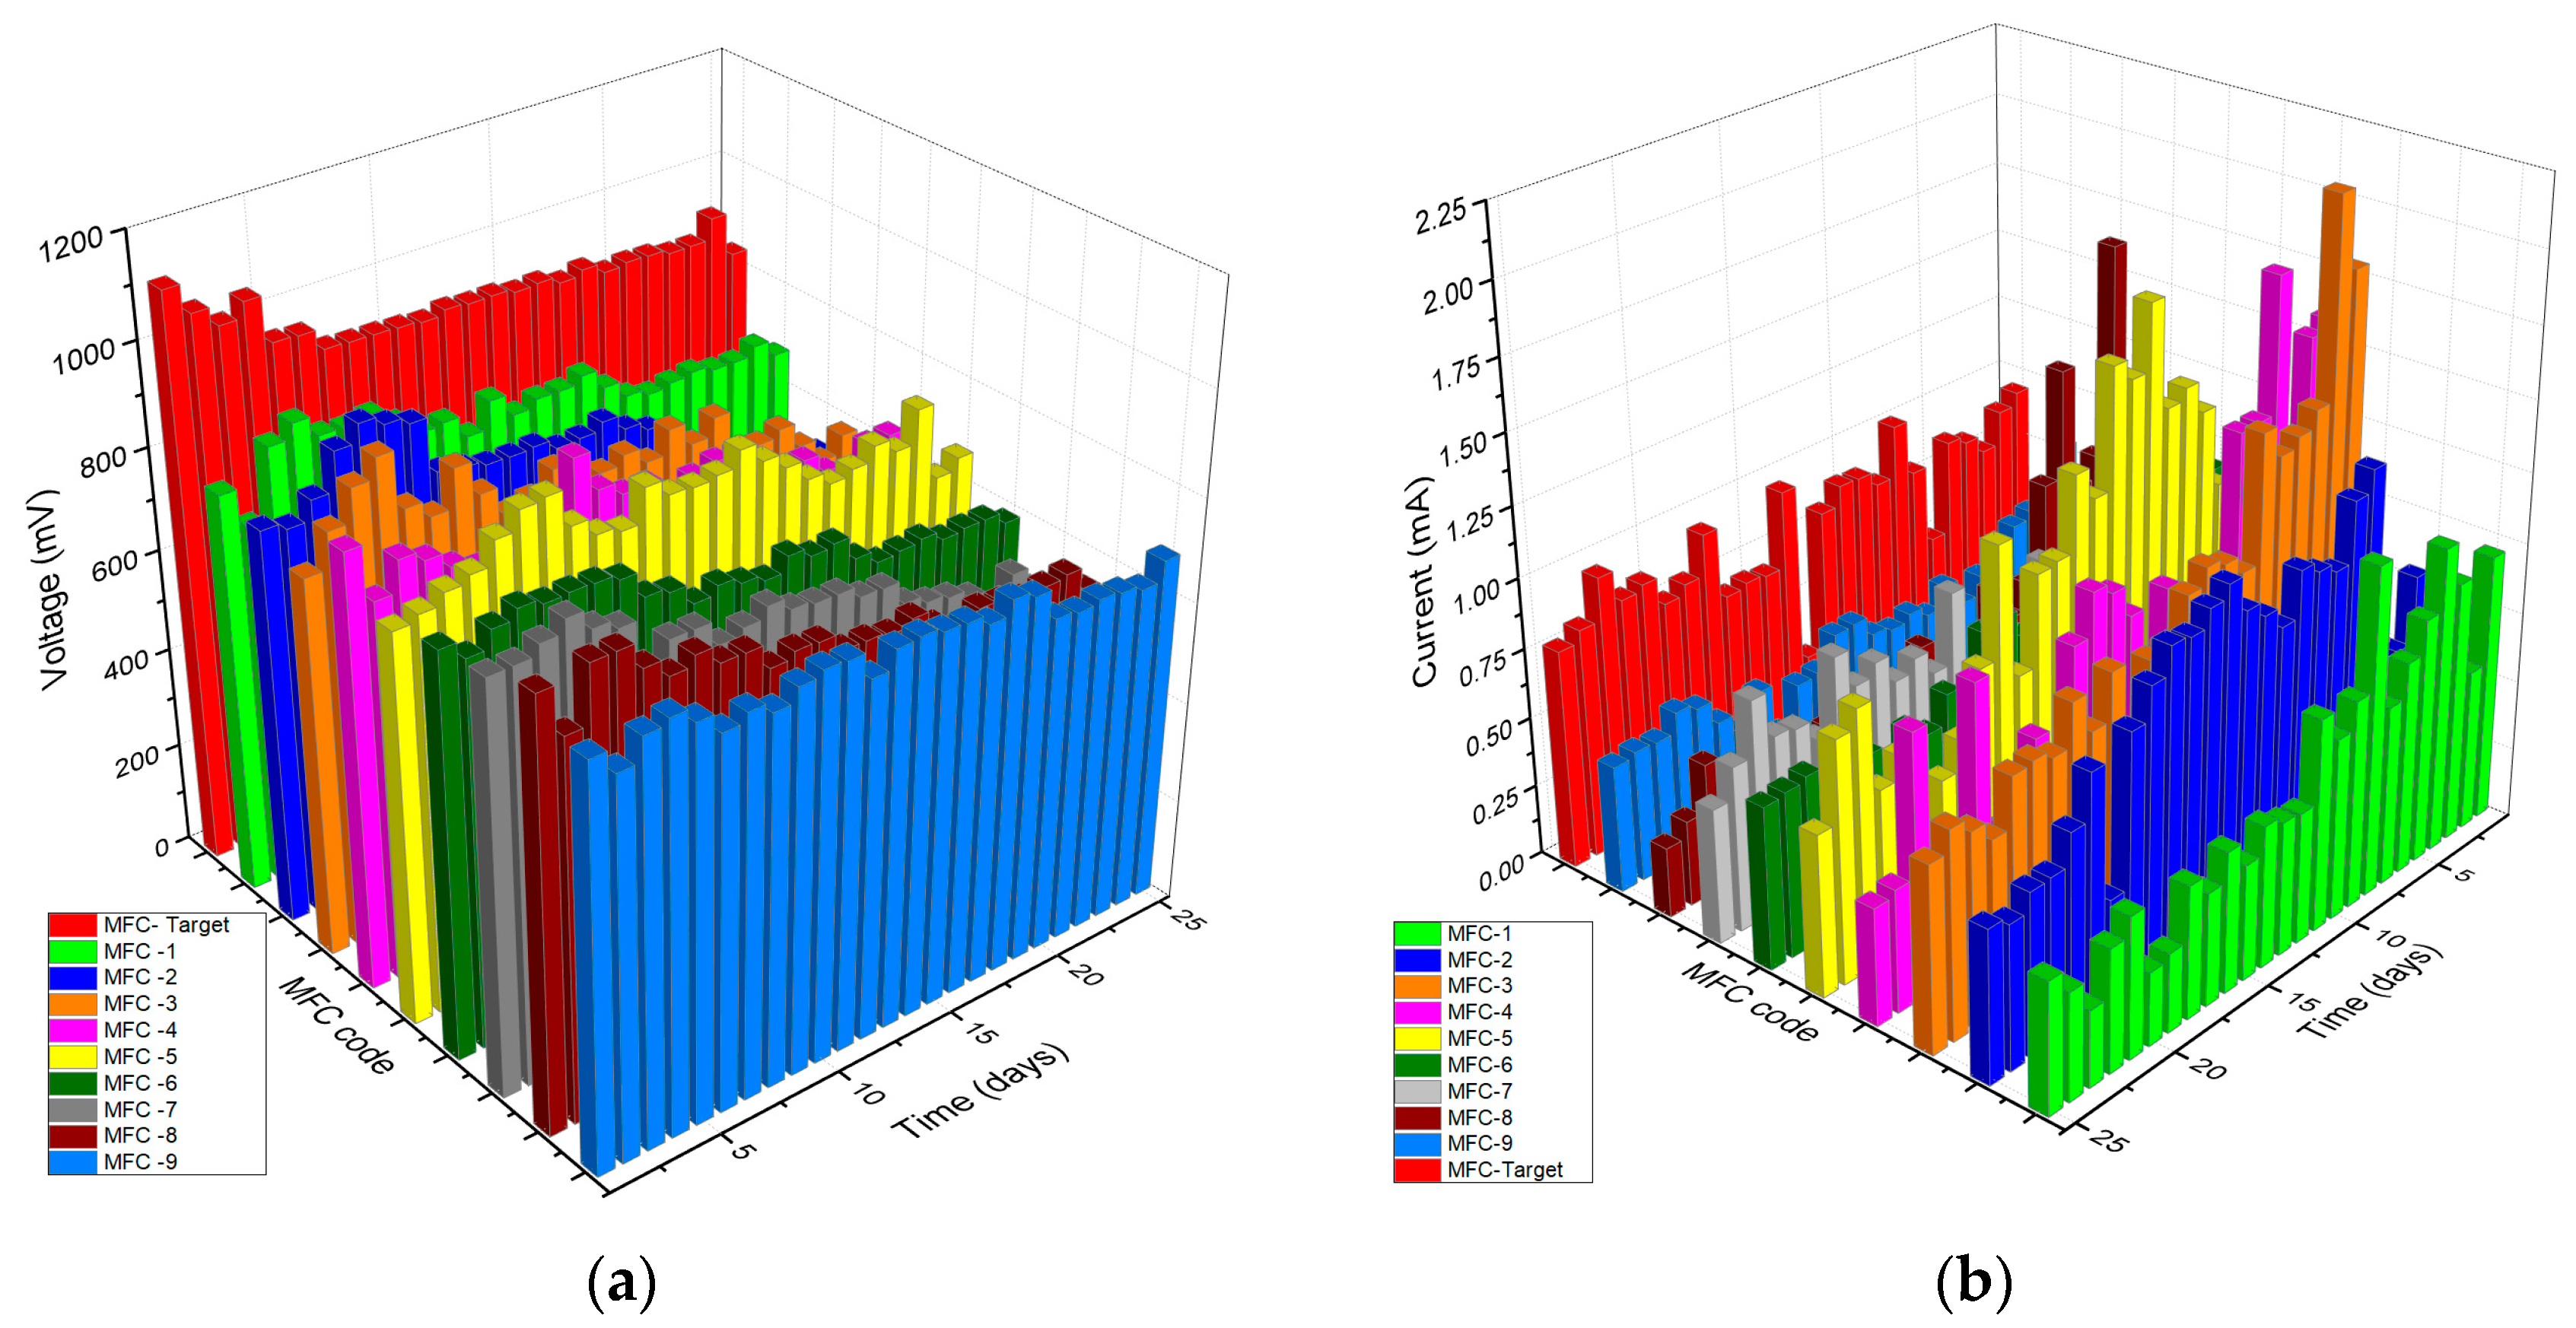
Regarding the generation of electrical energy in the MFCs, the values of voltage and current were monitored during the treatment period.
Figure 9a shows the registered values of the voltage produced by the cells during the 25 days of operation of the first stage. It can be seen that the white MFC cell presented the best performance in terms of voltage generation throughout the 25 days, reaching its maximum value on the first day with 1118.5 mV, and subsequently experienced a tendency to decrease as the days passed. At the end of the monitoring period, the cell generated a voltage of 833 mV. The maximum voltage values obtained in this research were higher than those described by other authors, such as Hou et al. (2016), who generated 260 mV in MFC with
Chlorella vulgaris inoculum [
47]. For their part, Huarachi-Olivera et al. (2018) produced 954 mV in MFC assisted by
Chlorella vulgaris [
48]. At the same time, the maximum voltage was generated by the other cells inoculated with
Chlorella sp., and outstanding records were observed on different days. For example, the MFC3 cell reached its maximum voltage of 918 mV on day 4, while the MFC2 cell generated 911 mV on day 5, and the MFC5 cell registered 900 mV on day 7. At the same time, the minimum values were recorded on day 25 by cells MFC7, MFC8, and MFC5, which generated 463.5 mV, 507 mV, and 572 mV, respectively.
The results show that all the cells presented an optimal performance in voltage generation during the first days of operation. However, a gradual decrease in its production was observed as the days passed. It has been found in the literature that the values of voltage and electric current increase in the first days of monitoring, but after a certain time these values decrease, due to the decrease in the organic charge present in the substrate [
49]. Likewise, this is also related to the decrease in organic matter because the same matter is consumed by microorganisms in their metabolic process (Rojas-Flores et al., 2023) [
50]. Furthermore,
Figure 9b shows that the MFC3 and MFC5 cells stood out for their excellent performances in the current generation during the first stage, reaching maximum values of 2.15 mA and 1.79 mA on days 4 and 8, respectively. However, as time progressed, a decrease in its electrical production was observed. On the other hand, the other cells generated currents in the range of 0.5–1.5 mA during the first days of operation but also experienced a decrease in their production as the days passed. On day 25, minimum current values were recorded in cells MFC8 (0.25 mA) and MFC4 (0.42 mA), respectively. Other investigations also showed a decrease in current in the last few days; for example, Commault et al. (2017) reported a reduction in current due to a decrease in microbial activity or a decrease in the efficiency of electron transfer in the biofilm [
51]. Likewise, Rojas-Flores et al. (2023) mention that as the organic matter in the medium decreases, there will be a decrease in electrons, which brings a decrease in the generation of electric current [
52].
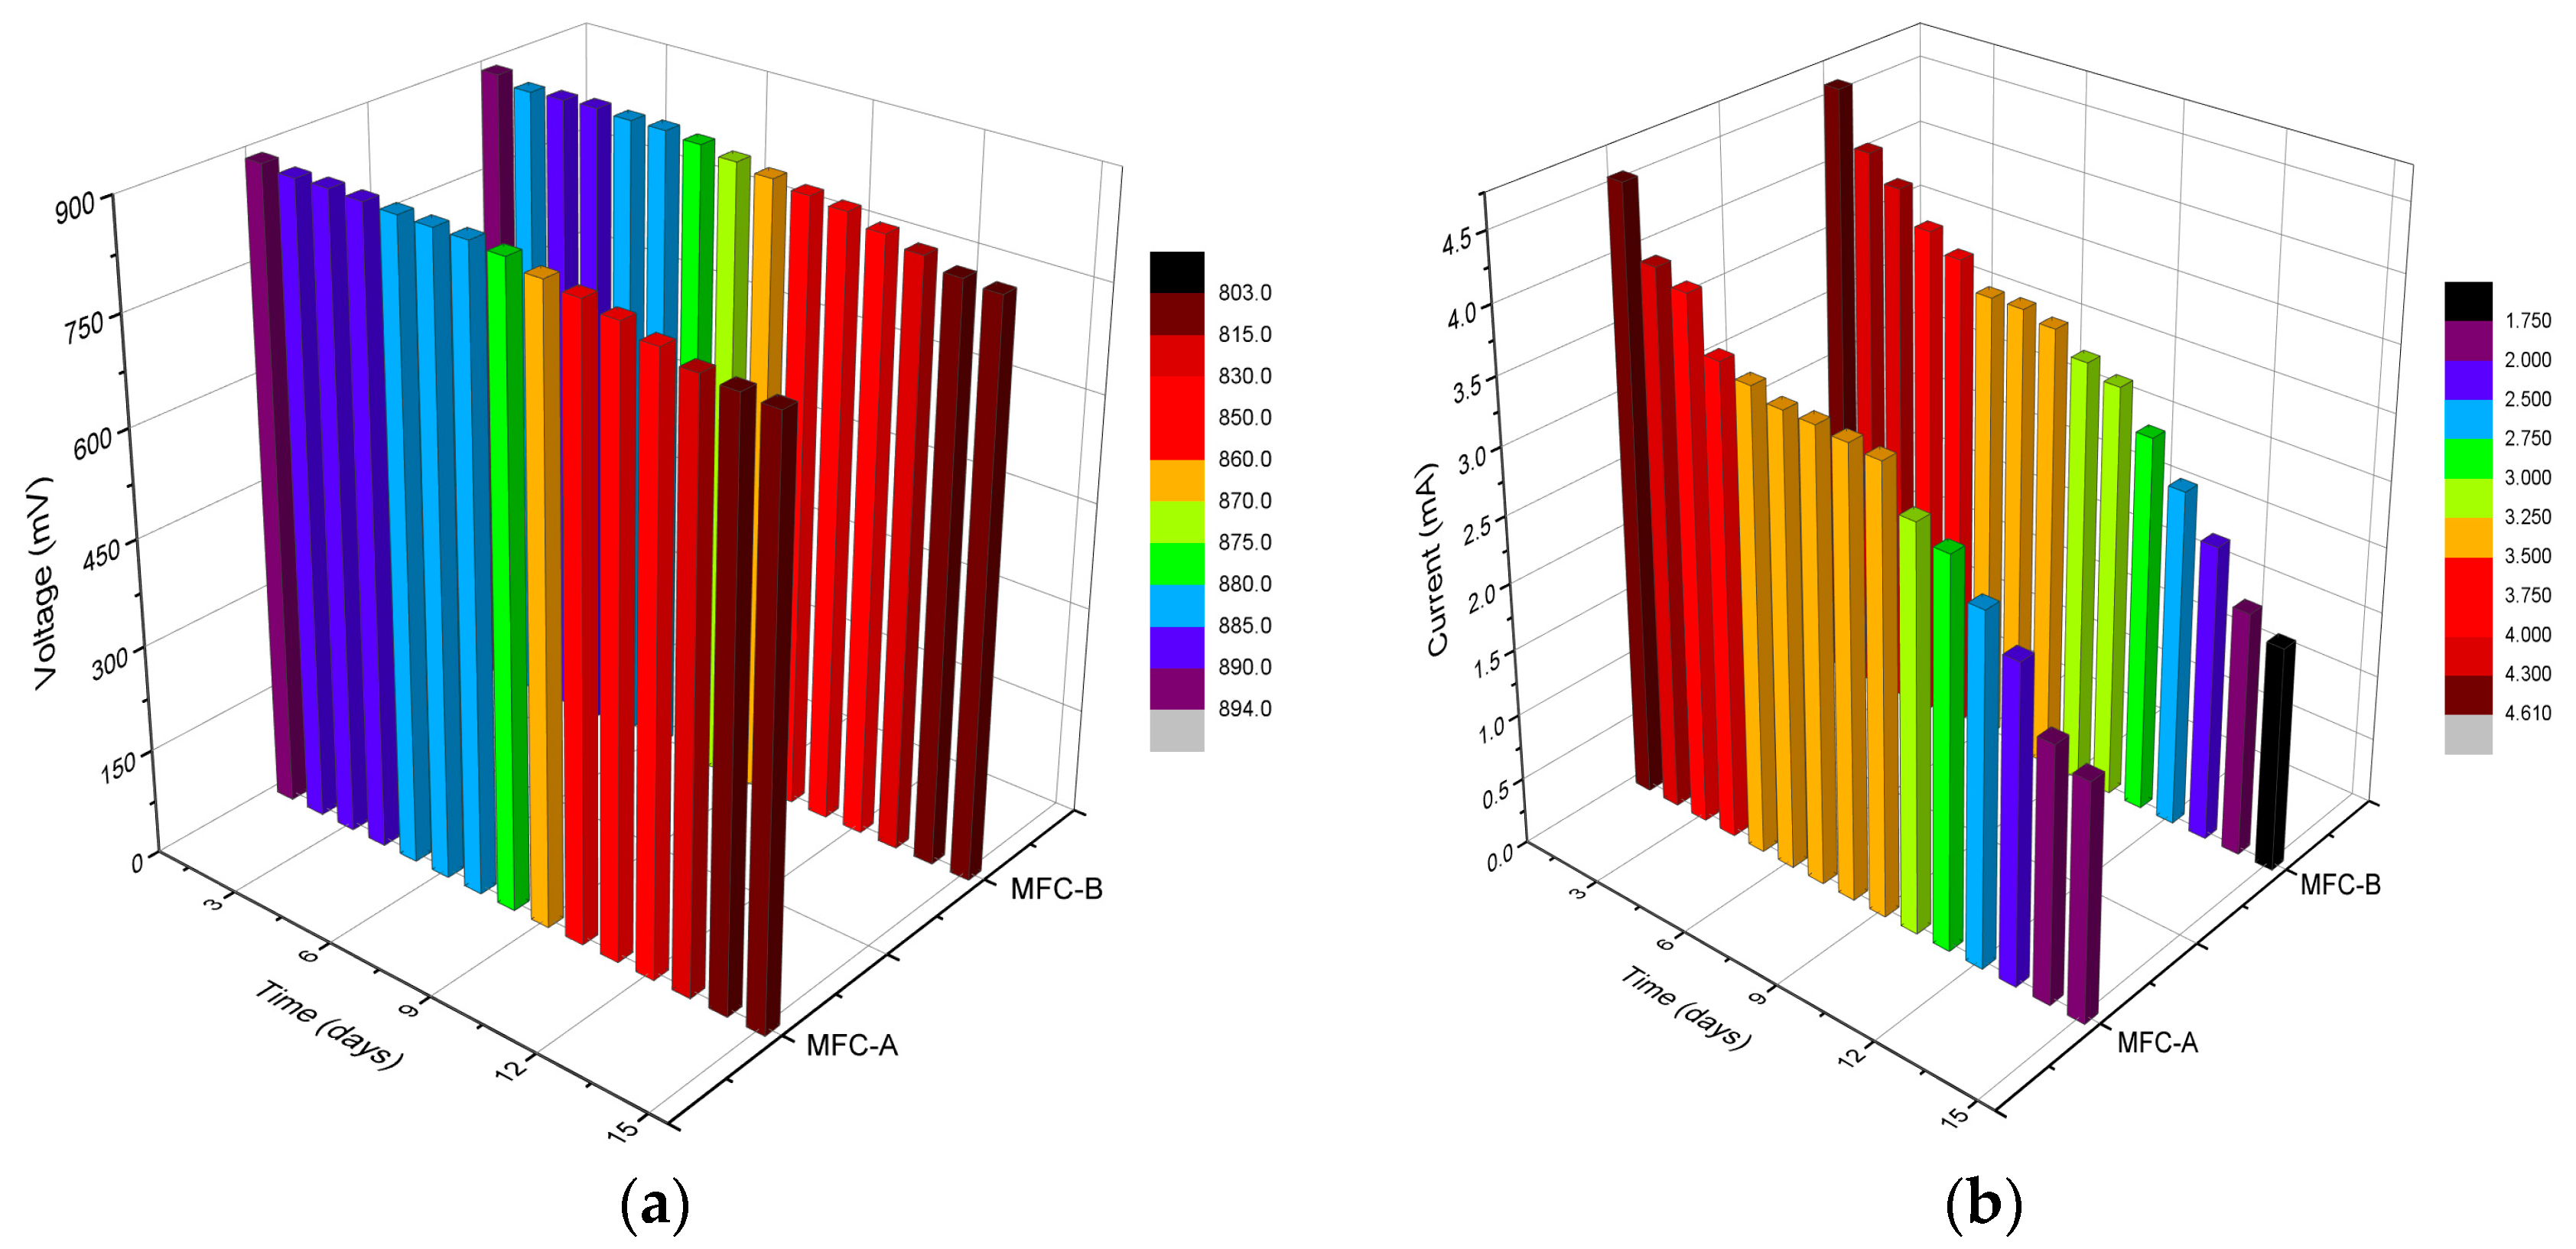
The recorded data of the voltage and electrical current produced by the cells in the second operational stage are shown in
Figure 10, where it can be seen that the highest values are seen in the first days of operation, while the lowest values seen in the last days. For example, on day 1, MFC A and MFC B managed to produce 892 mV and 894 mV, respectively, these being the maximum values recorded in this part of the investigation. At the same time, the minimum values were recorded on day 15 with 807 mV and 803 mV via MFC A and MFCB, respectively. As indicated by Raja et al. (2022), voltage losses are unavoidable in bacterial metabolism due to the way bacteria obtain energy through the oxidation of substrates [
45]. Similarly, the generation of electrical current in the second stage is shown in
Figure 10b, and it can be seen that it was higher during the first days of operation and decreased as time passed. Peak values were recorded on day 1, with 4.57 mA and 4.61 mA for MFC A and MFCB, respectively. It was also observed that the lowest values of electrical current were obtained on the fifteenth day, being 1.77 and 1.71 mA for the MFCA and MFCB, respectively. In addition, a noticeable increase in the production of current by cells A and B can be observed in comparison with the MFC9 because the three cells were utilized at the same initial pH conditions of the residual water and dose supplied of
Chlorella sp., and the only factor that changed was that the MFCA and MFCB the volume of work was greater. The results obtained are higher than those of other authors, such as Agüero-Quiñones et al. (2022), who produced 0.08 mA in single-chamber MFC with municipal wastewater [
53] and are lower than those reported by De la Cruz-Noriega et al. (2022), who obtained a current generation of 7.59 mA in MFC using mango residue and
Spirulina sp. [
54].
3.5. Monitoring of Physicochemical Parameters of Municipal Wastewater during Experimental Treatments
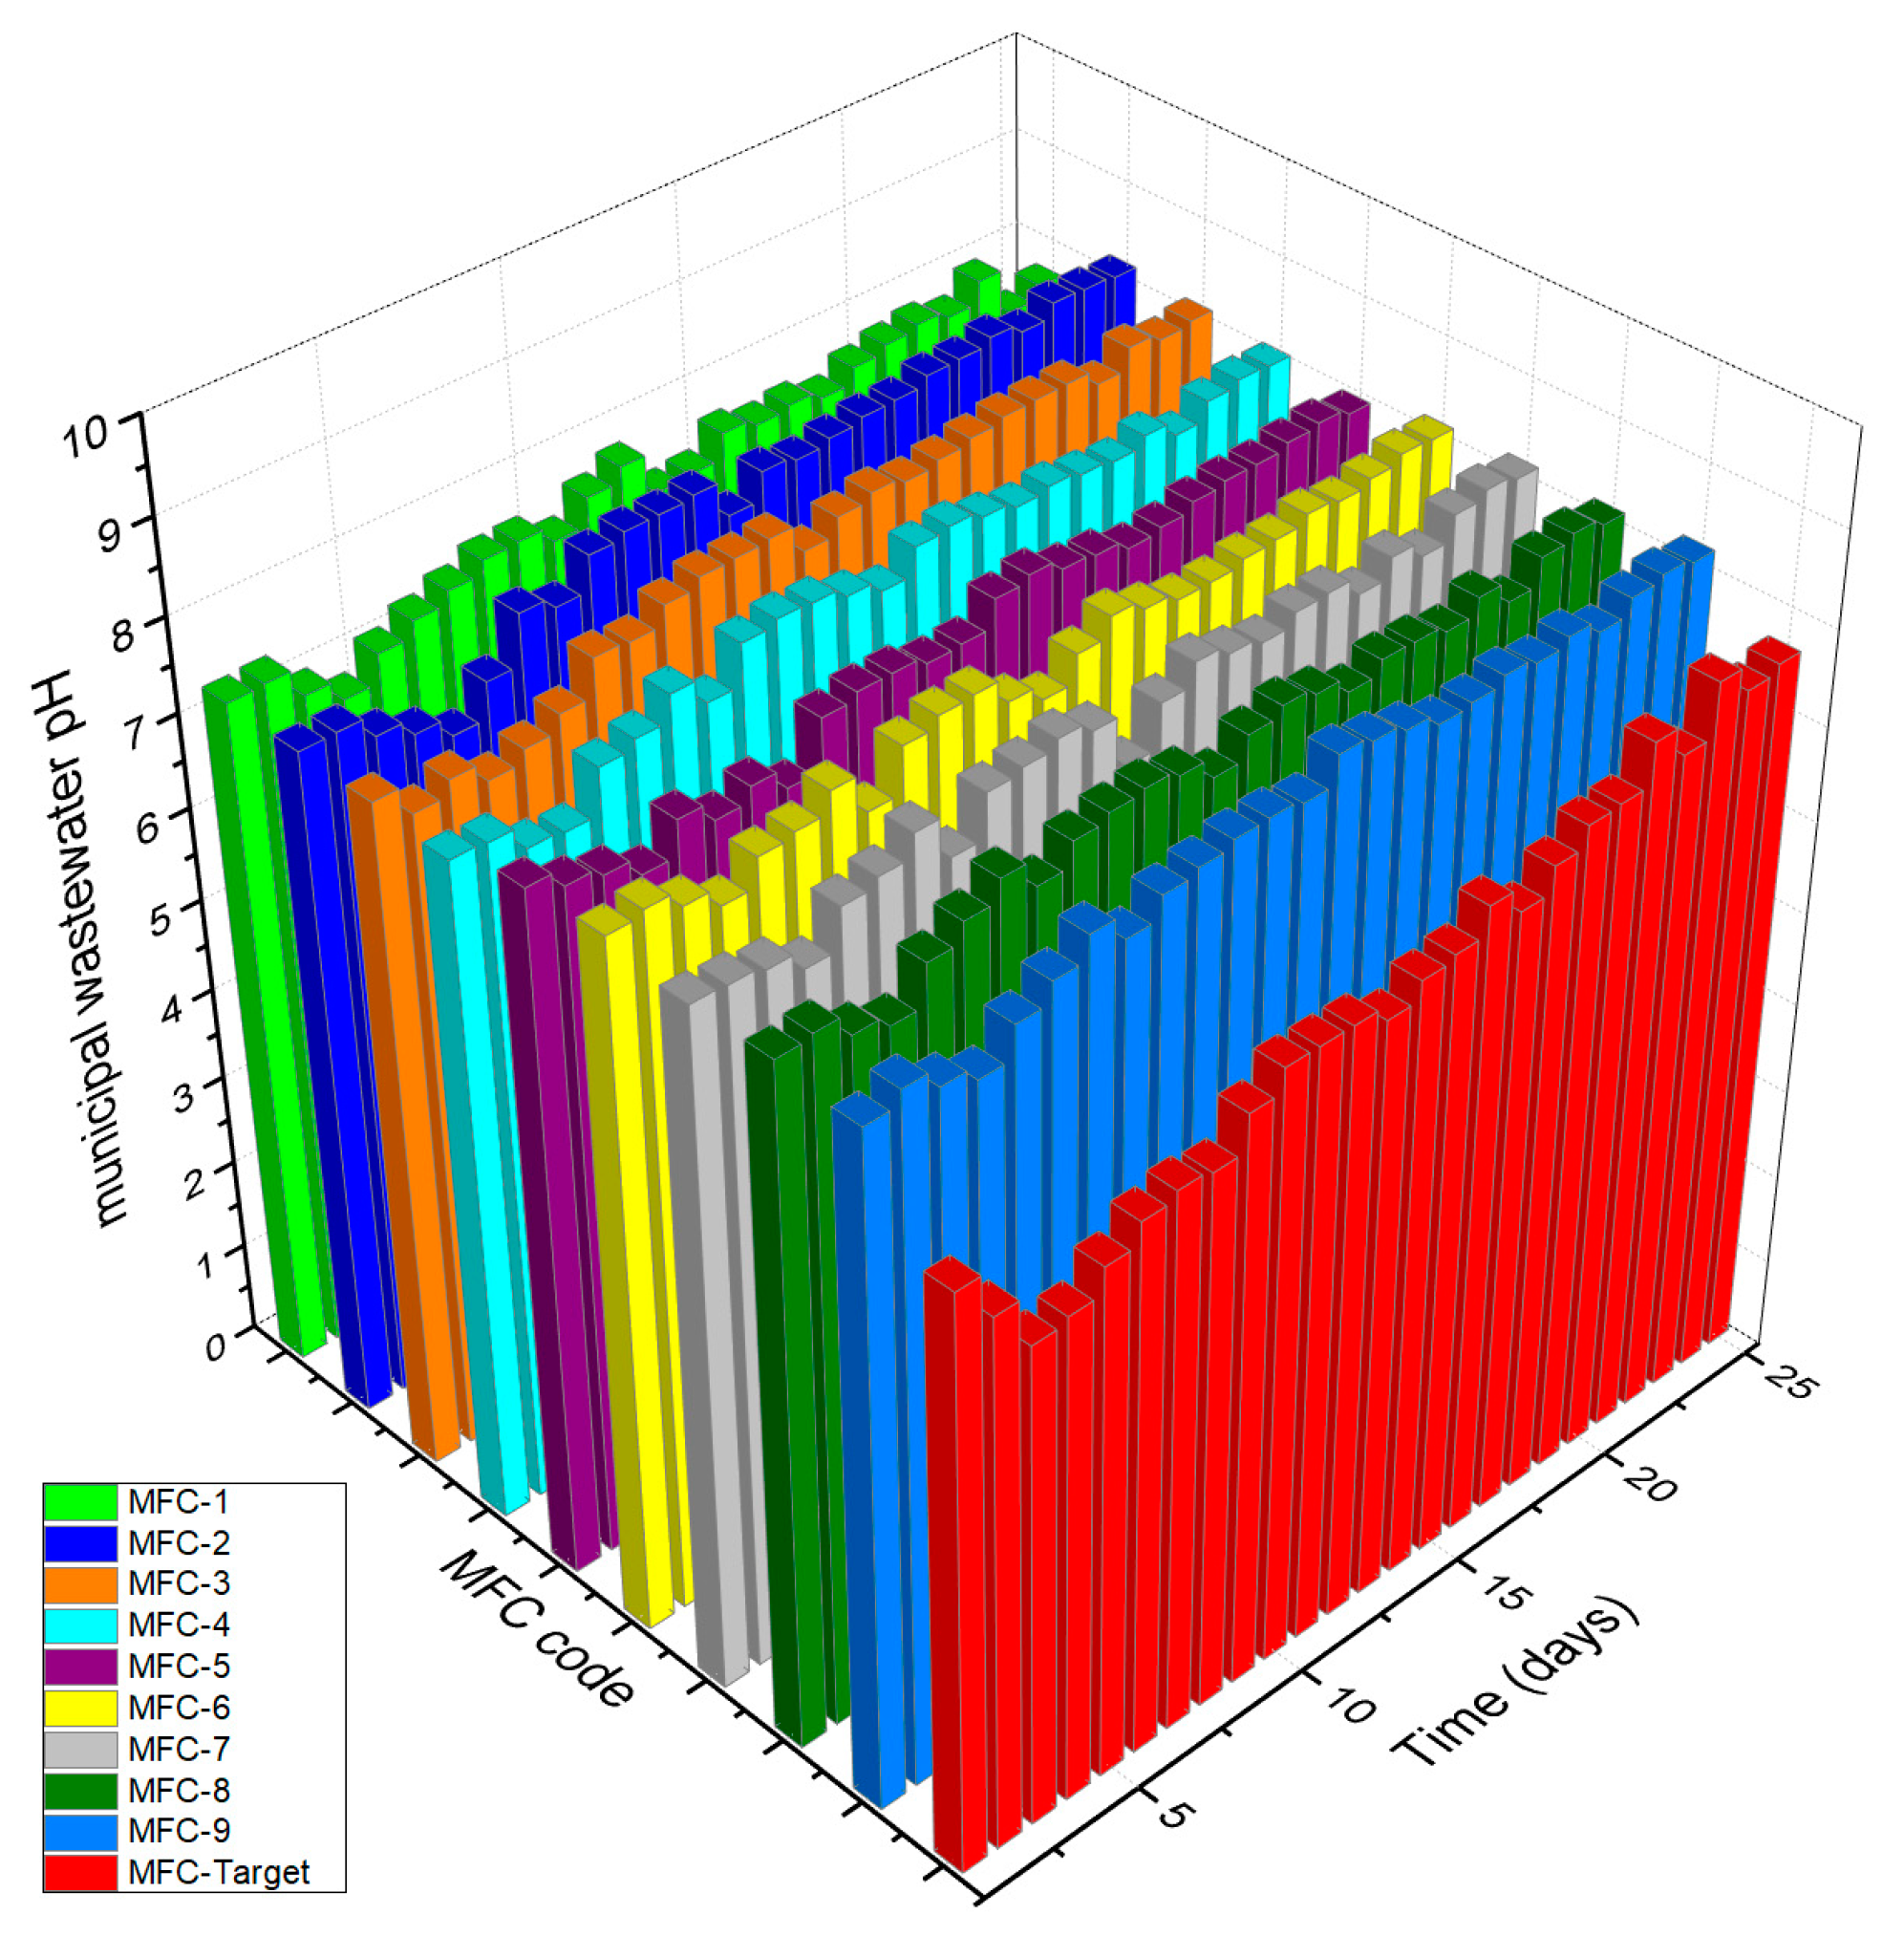
A monitoring of the pH and turbidity of the municipal wastewater was carried out throughout the 25 days (see
Figure 11).
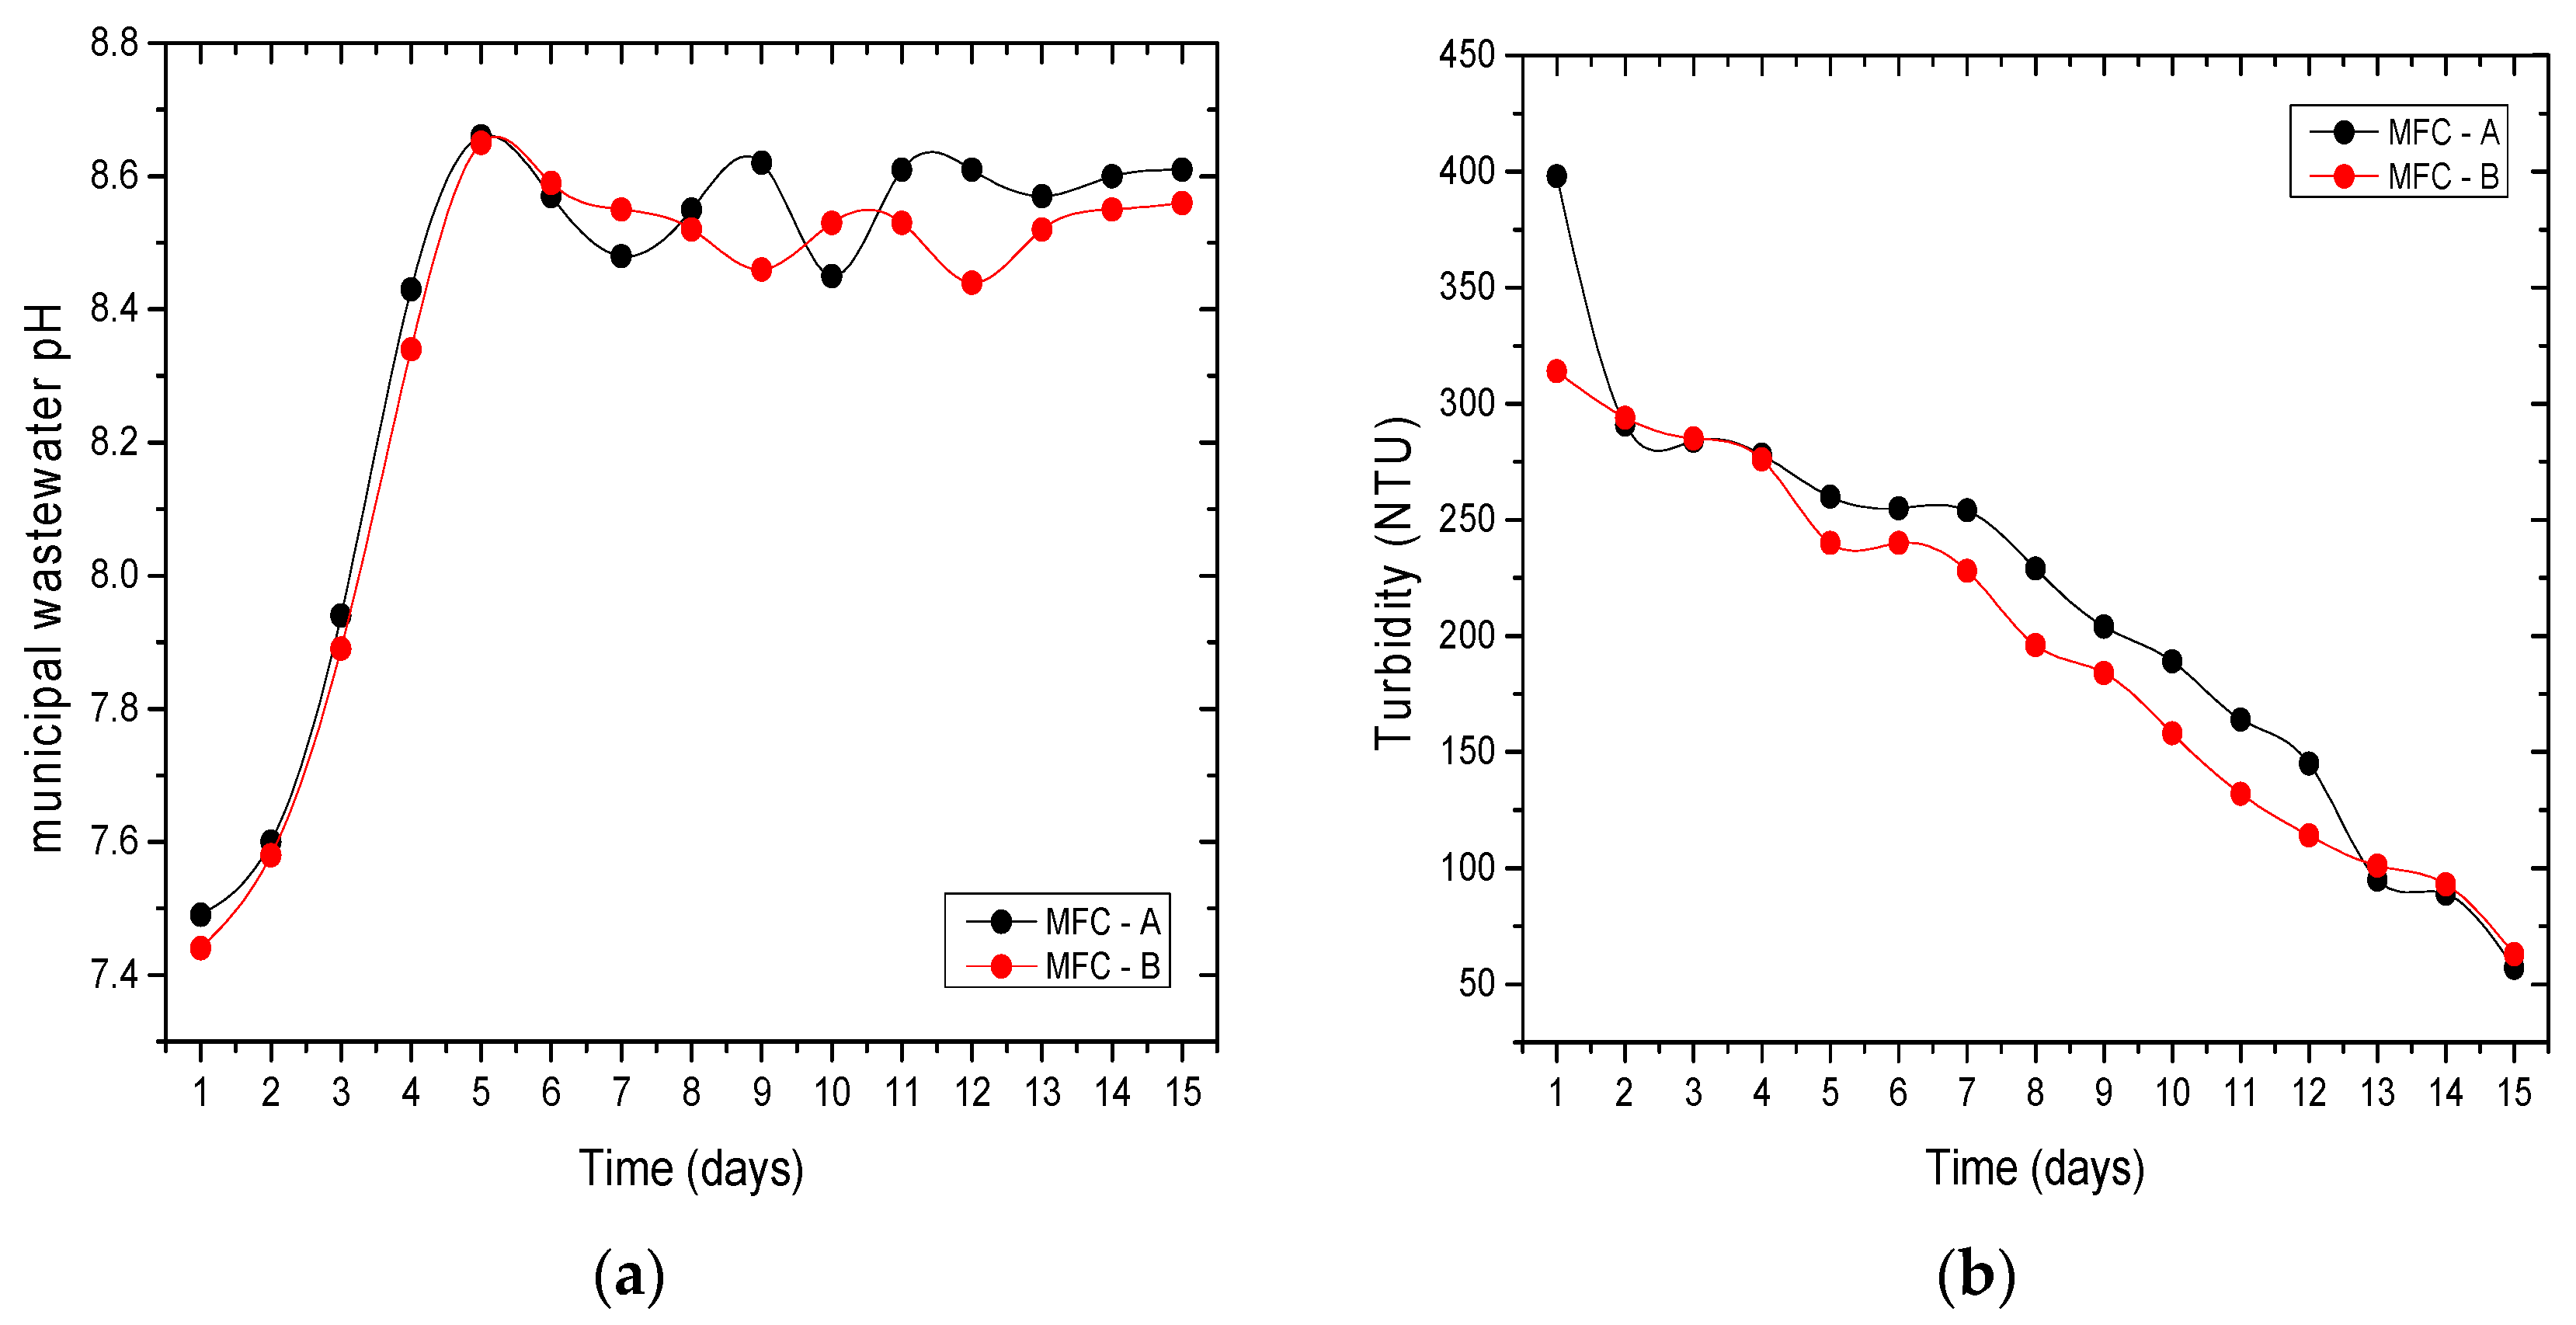
In
Figure 11, it was observed that as the days passed, the pH of the residual water changed, showing a clear tendency to increase in all the cells; however, on day 25 of treatment, did it remain within the range allowed by the ECA-Water (7.5–8.5). In cells inoculated with
Chlorella sp., the trend of pH variation was similar, while in the white MFC, it remained below the other values. As Sharma et al. (2022) pointed out, if the initial pH of the wastewater is < 7.5, after a few days of MFC operation, the pH will increase because the proton exchange within the MFC is slower than that of the MFC production rate that originated during the oxidation of organic matter carried out by microorganisms (Gupta et al., 2021). In other investigations, a gradual increase in pH was demonstrated over the treatment time [
55]. Varanasi et al. (2020) observed an increase in the pH of the residual water from 7–9 over several days in MFC assisted by
Chlorella sorokiniana [
45].
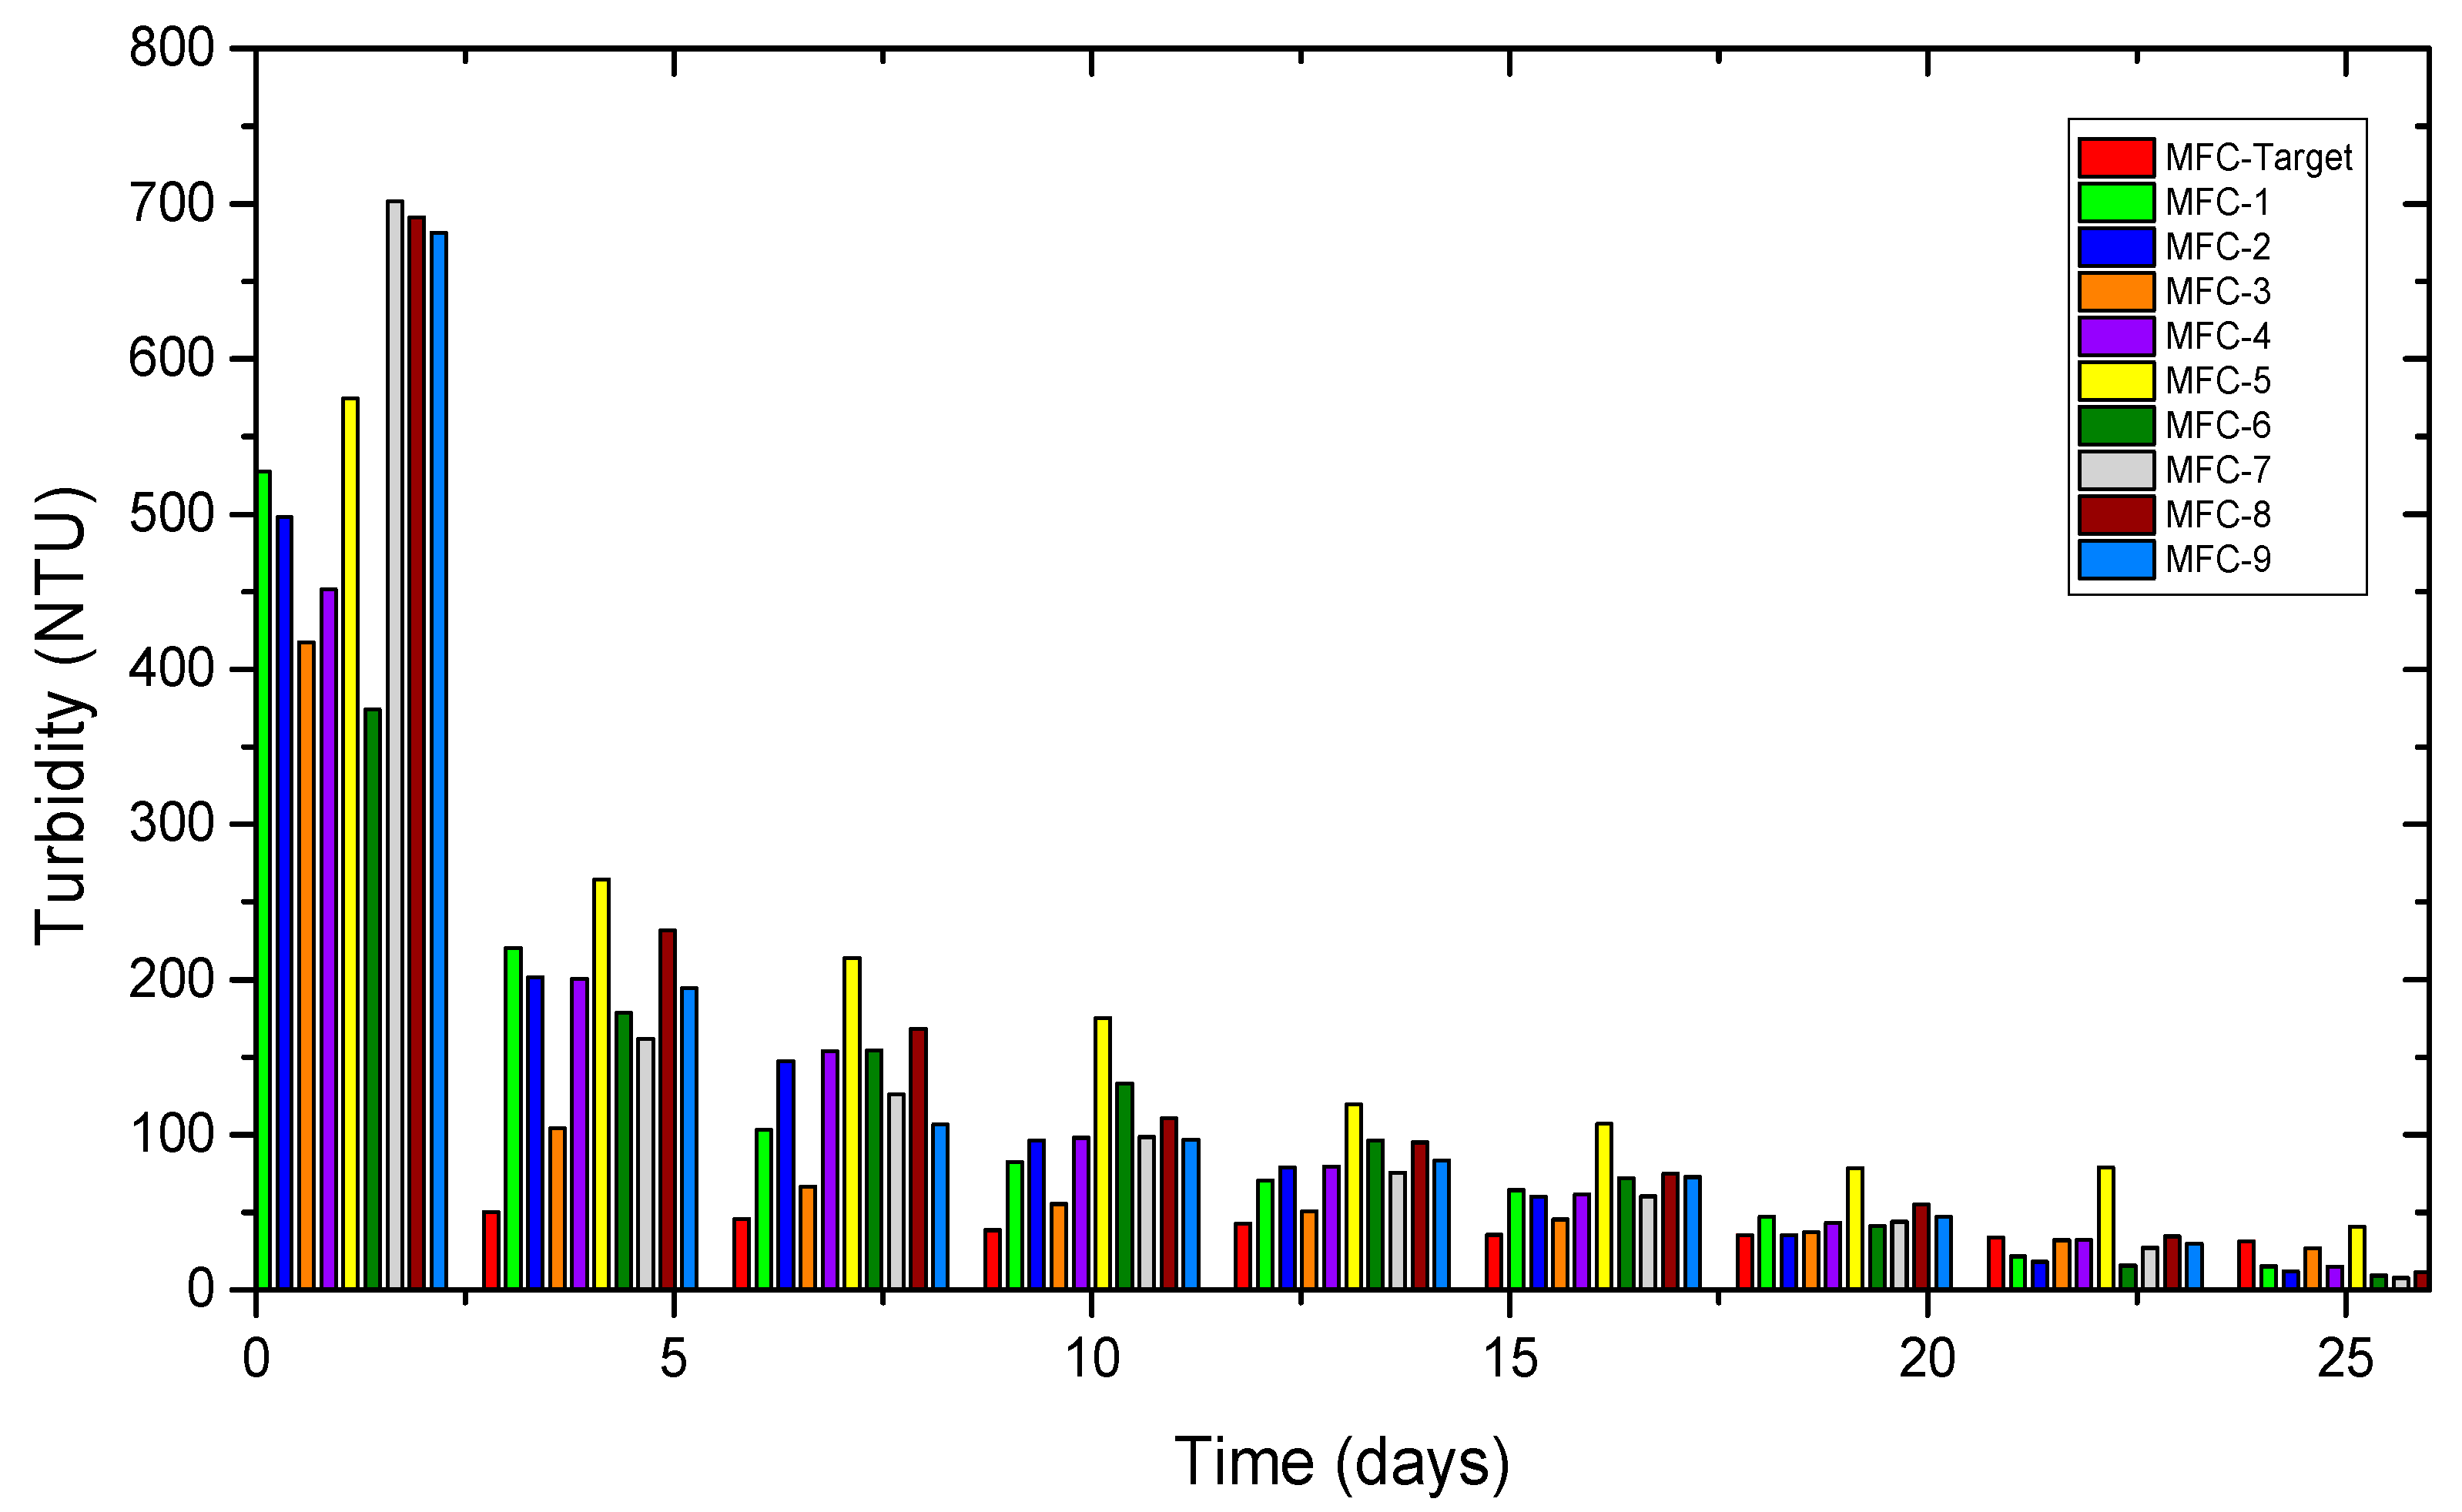
On the other hand,
Figure 12 shows that all the cells inoculated with
Chlorella sp. showed quite considerable removal percentages of turbidity. For example, MFC 7, 8, and 9 managed to remove 98.9%, 98.34%, and 98.88%, respectively; the highest values reached in removing this parameter. At the same time, the other MFC presented removal levels between 92.52–97.62%. As for the white MFC, it achieved a removal of 44.78%. With all of the above, it can be seen that turbidity was reduced to the levels allowed by the ECA-Water Environmental Quality Standard for Water (<100 NTU) in all cells. The results are similar to those obtained by Lutterbeck et al. (2022), who eliminated 99.9% of the turbidity of wastewater generated in a hospital laundry using MFC, attributing the removal of turbidity to the cause of the elimination of organic matter and material in suspension over several days [
55]. The monitoring of the pH of the wastewater from the cells in the second stage is shown in
Figure 13a. A noticeable increase in pH is observed until day 5 in both cells and then a variation between values of 8.4–8.7. Gupta et al. (2021) also observed an increase in pH from 6.68–8.21 in the effluent from the cathode chamber of their MFCs, which was due to the oxygen reduction reaction facilitated by protons and the CO
2 buffer [
48].
Figure 13b shows the turbidity values recorded during the 15 days of treatment of the second operational stage. A progressive decrease is observed over the time period, changing from 398 NTU (MFCA) and 314 NTU (MFCB) on the first day to 57 NTU (MFCA) and 63 NTU (MFCB) on day 15. Sallam et al. (2021) also reported a reduction in turbidity over time [
56].
Likewise,
Table 9 shows the percentages of removal (cadmium, COD, turbidity, total dissolved solids, and conductivity) and increase (dissolved oxygen) obtained in the second operational stage for each MFC. Considerable levels of the removal of cadmium is observed in the MFCA (86.27%) and MFCB (86.10%), which were lower than those reported by Zhang et al. (2018), who removed 95% of the Cd using
Chlorella sp. QB-102 in dual chamber MFC [
37], in addition to the turbidity that it removed by 85.68% and 79.94% in cells A and B, respectively. In the other parameters the removal was not so outstanding. For example, COD was removed by 59.54% (MFCA) and 63.26% (MFCB), which was similar to those values obtained by Raja et al. (2022), removing 69.44% of COD in dairy wastewater using CFM assisted with
Coelastrella sp. [
45]; total dissolved solids were removed by 53.05% (MFCA) and 58.14% (MFCB), which were much lower than the results obtained by Chauhan et al. (2022), who managed to remove them by 94% in wastewater. Tannery used a dual-chamber MFC [
57], and electrical conductivity was removed by 59.59% (MFCA) and 64.56% (MFCB); results that were surpassed by those described in the research by Sharma et al. (2022), who eliminated 99.83% using
Chlorella vulgaris in MFC [
58]. For its part, dissolved oxygen increased very noticeably, with an 82.05% and 90.48% rise in MFCA and MFCB, respectively. Raju et al. (2021) increased dissolved oxygen from 3.7 mg/L to 8 mg/L in 30 days of treatment using MFC with baker’s yeast wastewater [
59].
3.6. Biochemical Identification of Microorganisms on the Anode of MFCs
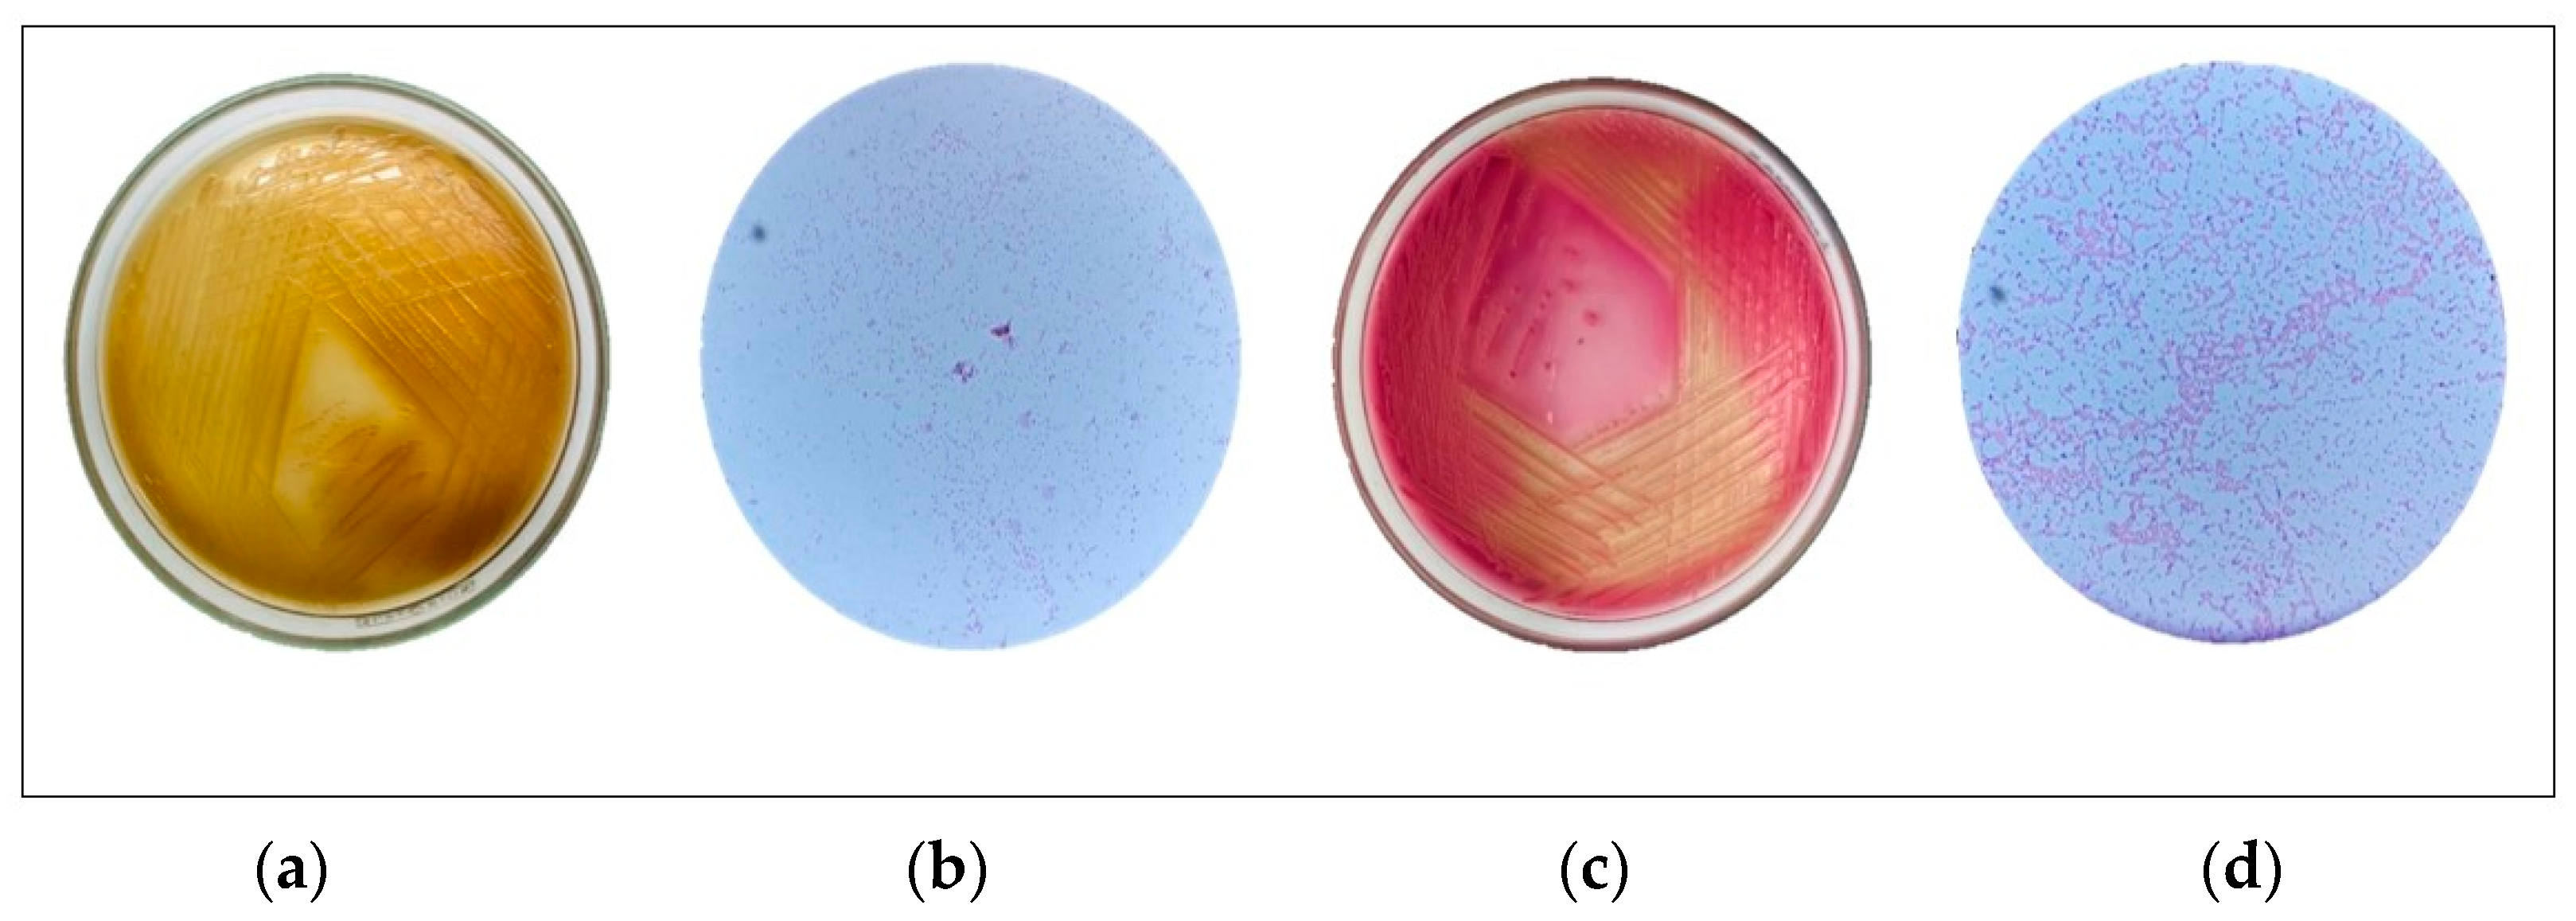
The results of the biochemical identification of the microorganisms present in the MFCA-1 and MFCB-1 strains of the second operational stage are shown in
Table 10. The identified microorganisms were
Pseudomonas putida and
Klebsiella oxytoca, respectively, with a similarity of 99%. Bacteria of the genus
Pseudomonas are known for their versatile metabolic capabilities in degrading a wide range of organic compounds in wastewater due to their ability to utilize diverse carbon sources and their tolerance to harsh environmental conditions [
60]. At the same time, Klebsiella oxytocin has a good capacity for degrading organic compounds from polluted water, such as hydrocarbons, phenolic compounds, and other toxic organic compounds [
57].
In addition to the above,
Figure 14 shows the microscopic characteristics of the microorganisms. It can be seen that
Pseudomonas putida occurs in the form of short or elongated rods with a cylindrical or slightly curved shape, while
Klebsiella oxytoca is bacillus-shaped with an elongated and cylindrical shape and is grouped in chains or in pairs.
3.7. SEM, EDS, and FTIR Analysis of the Activated Carbon Electrodes of the MFCs
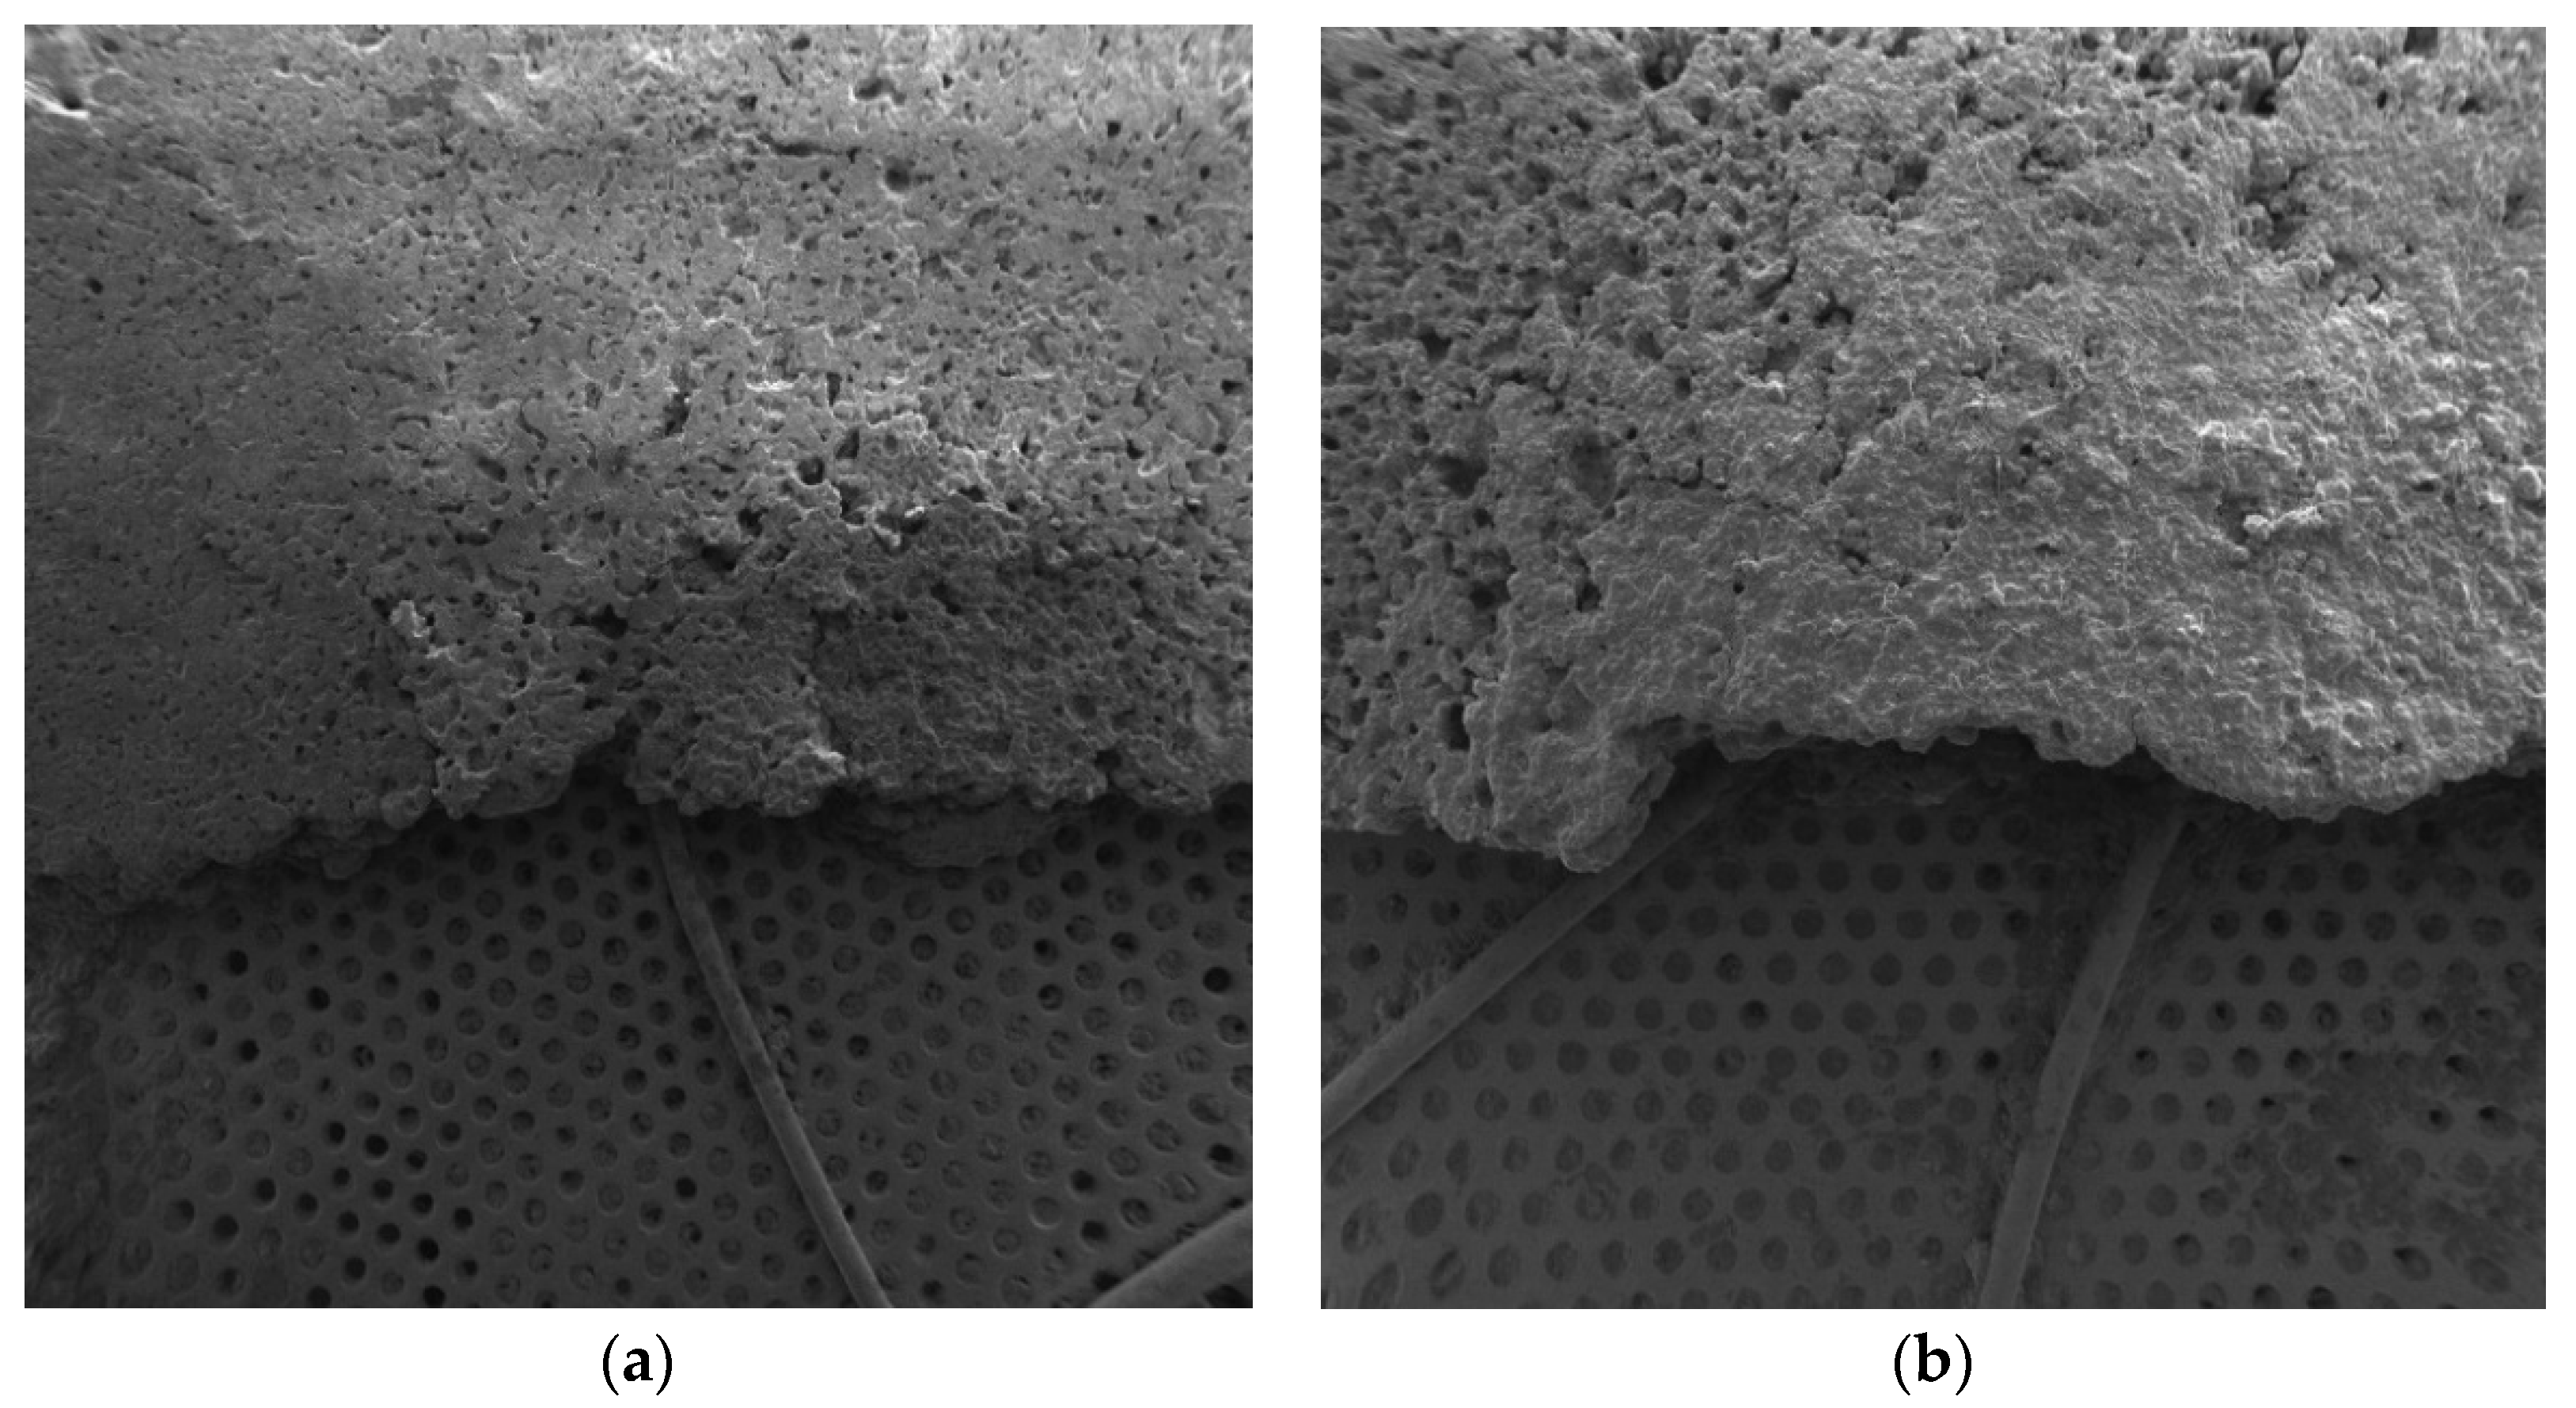
Figure 15 presents the images obtained via scanning electron microscopy (SEM) of the activated carbon electrodes used in the second stage. These images reveal that the surfaces of the electrodes were relatively smooth and the presence of solid particles of activated carbon dispersed on the surface was observed, and remnants of the biofilm of the microalgae also adhered during the treatment. You can also see the aluminum mesh structure and the copper wire impregnated in the electrode’s center. Other findings have been reported, such as those of Song et al. (2020) who, in the SEM analysis of their carbon felt electrode, showed a smooth surface with large spaces between the fibers that made the enrichment of microorganisms difficult [
61].
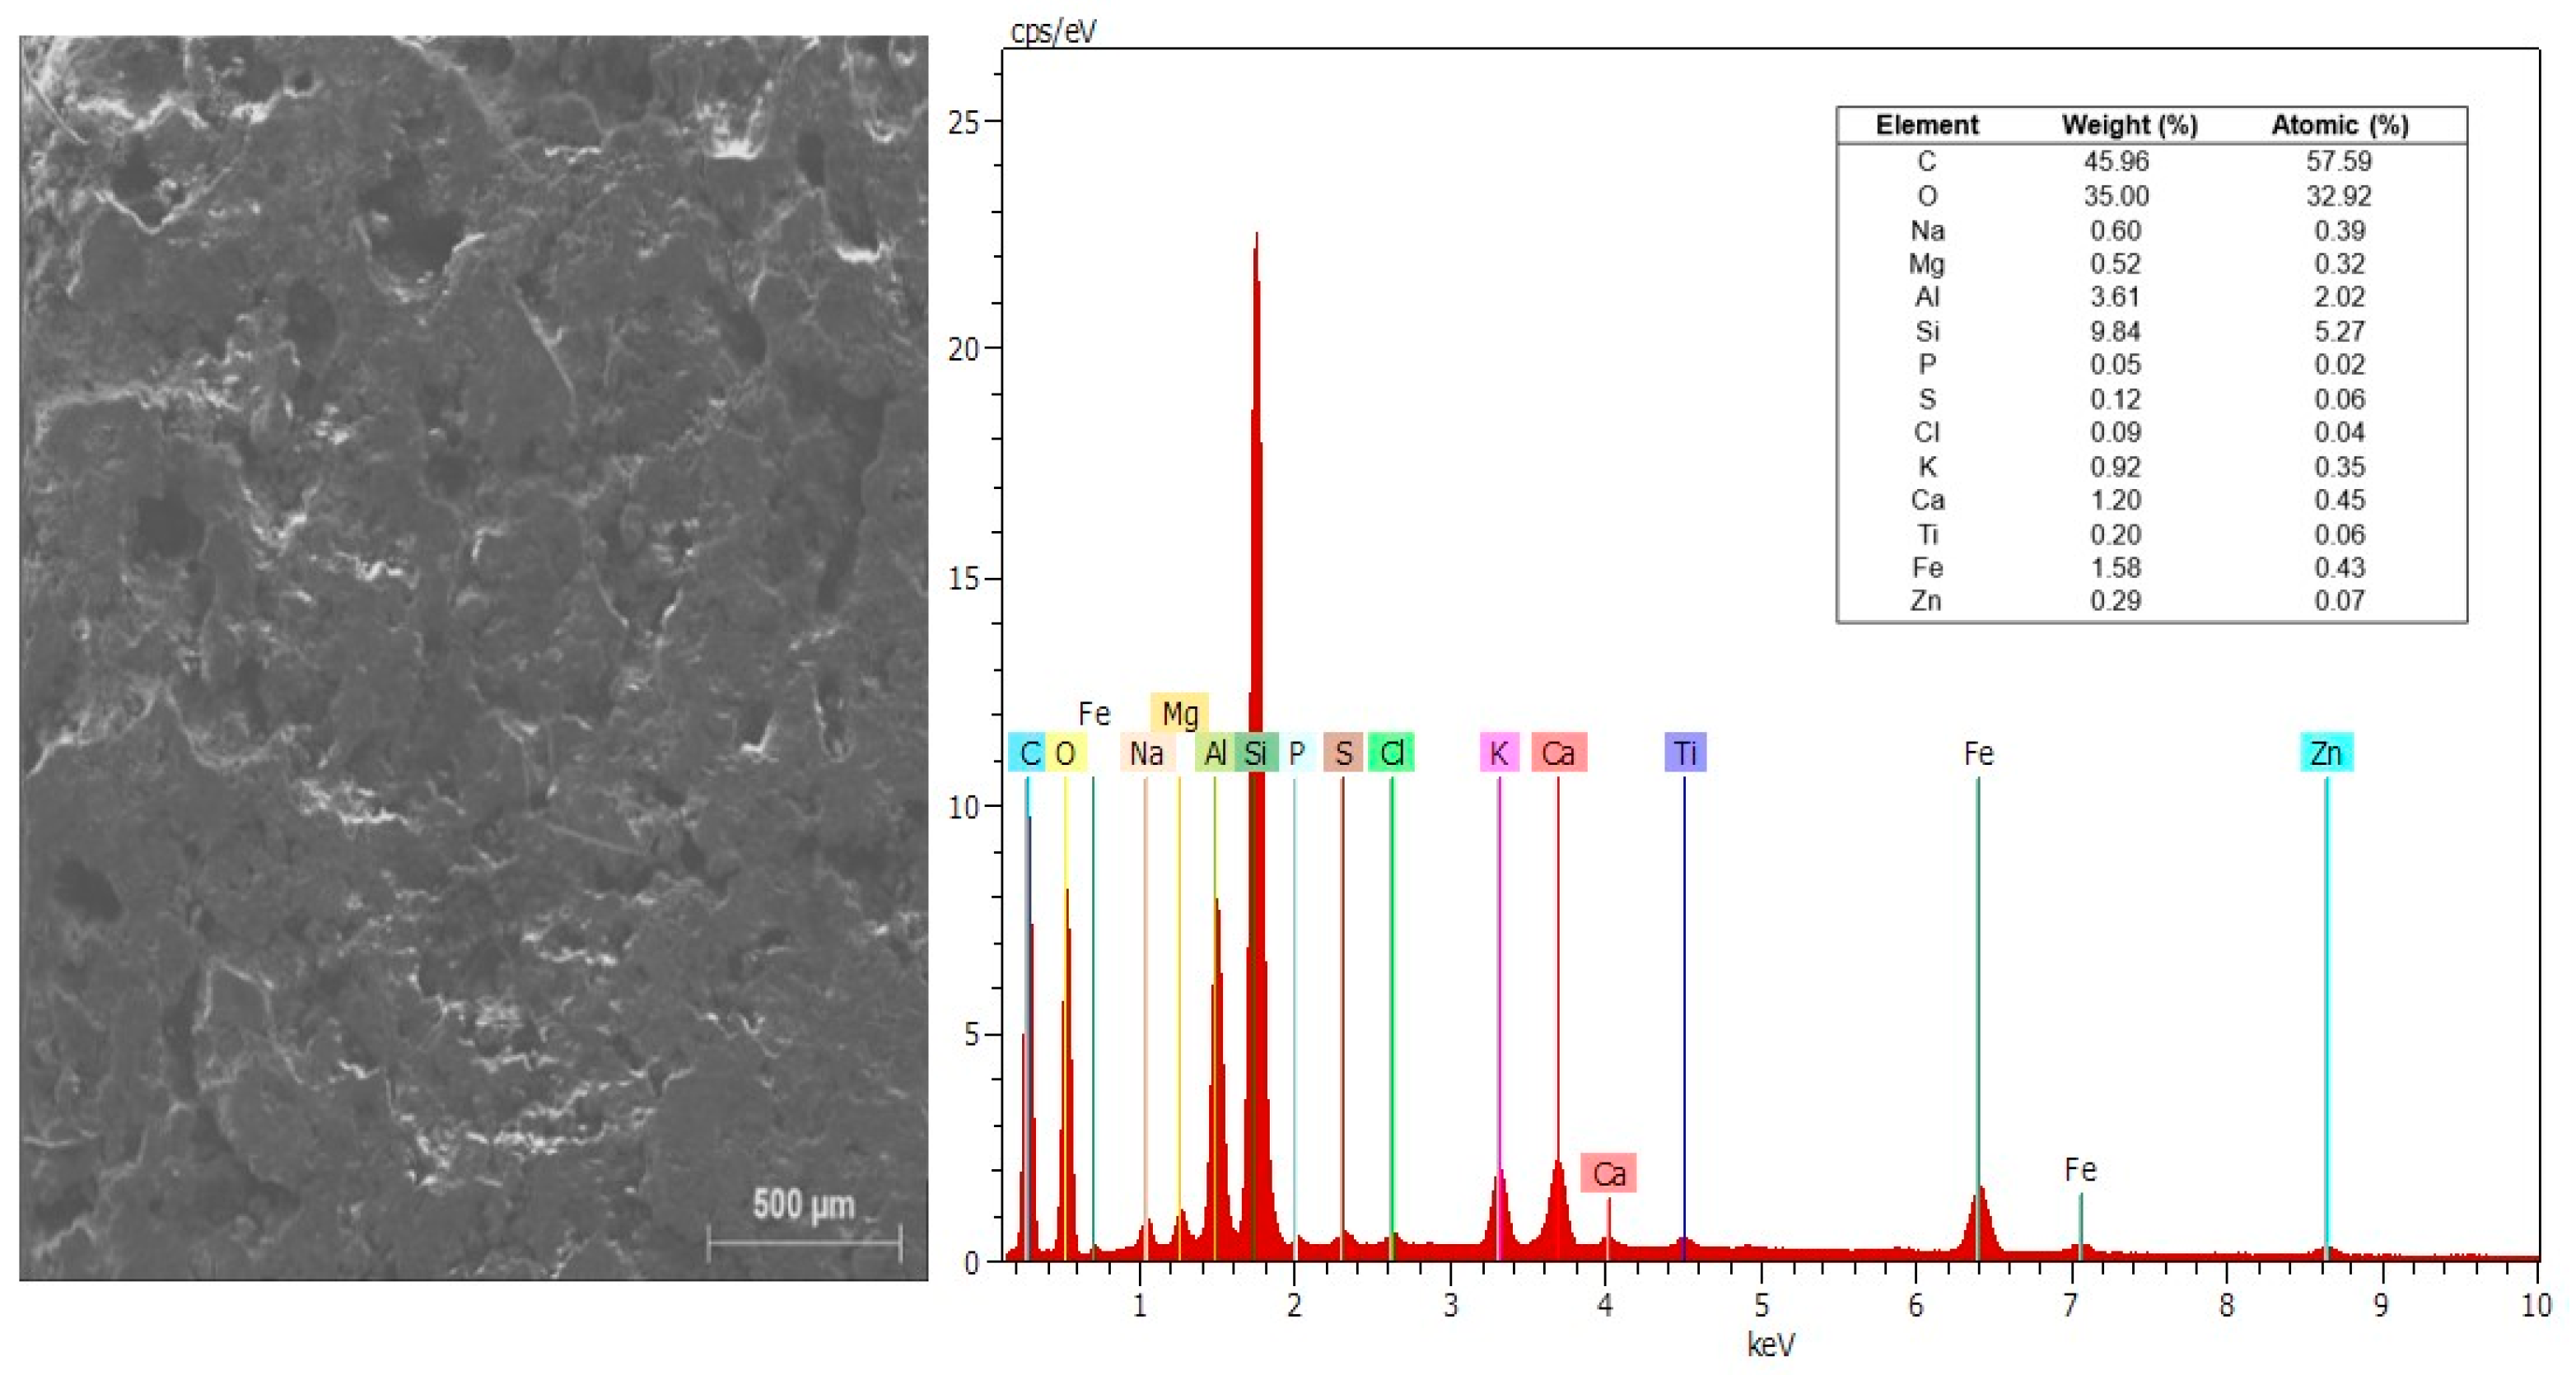
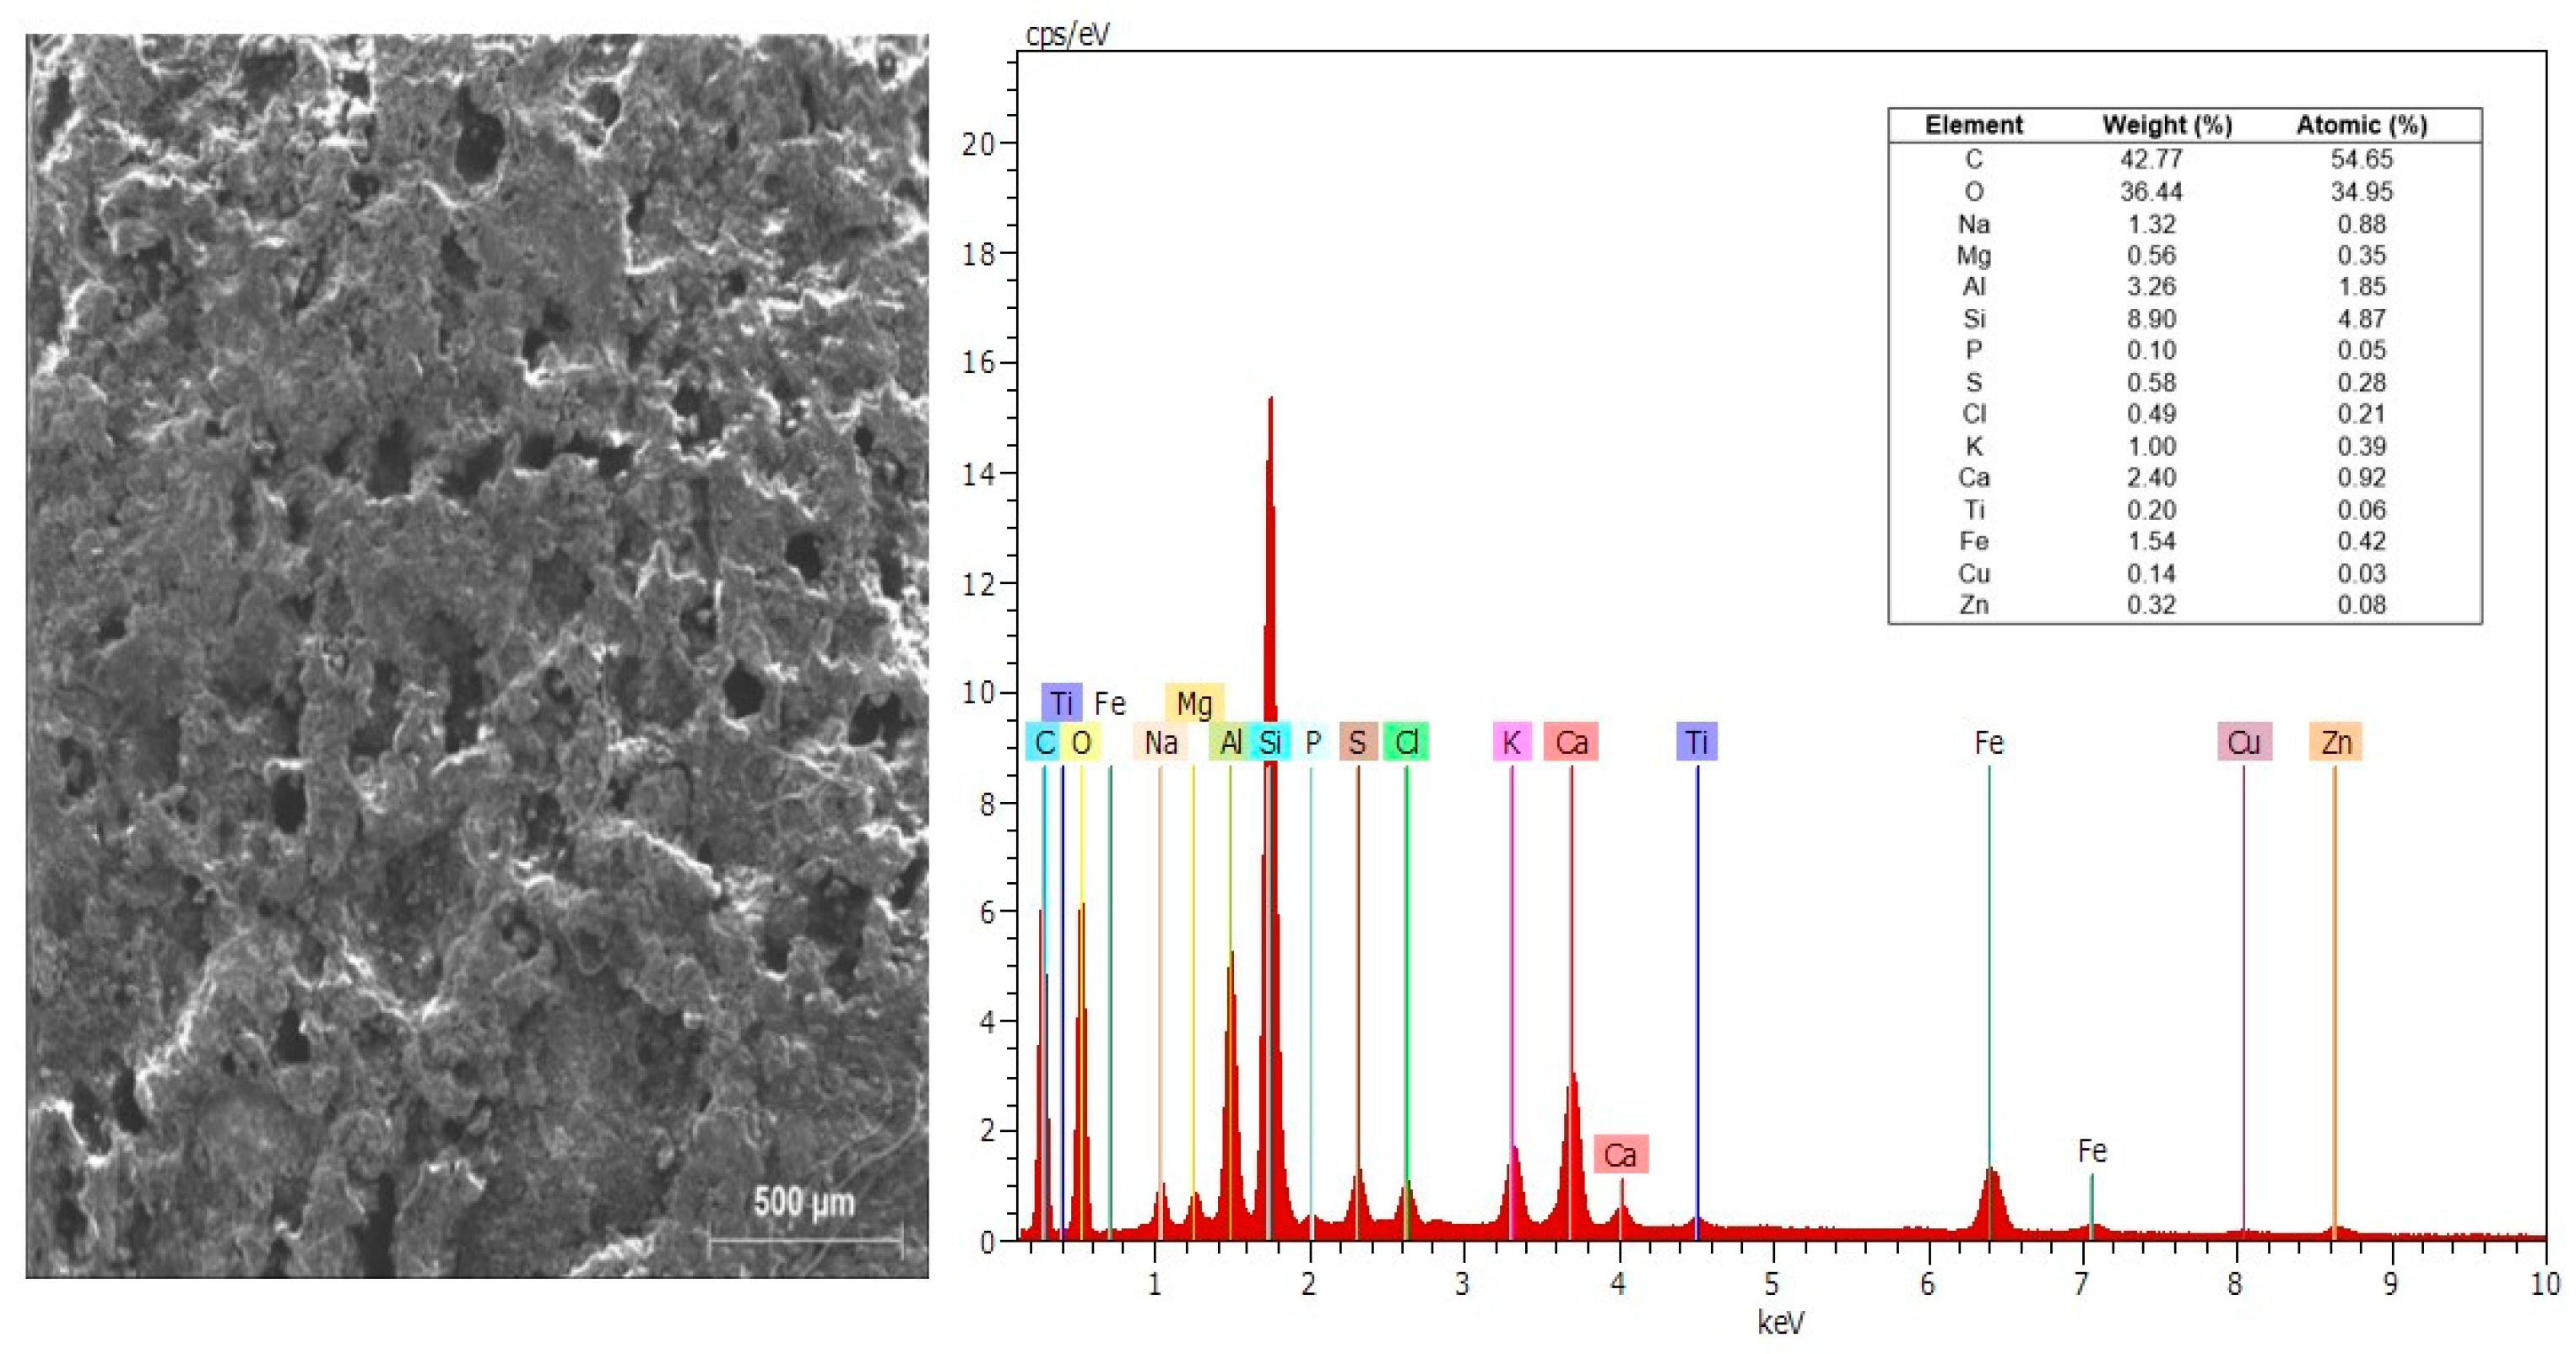
In addition, in
Figure 16 and
Figure 17, the microscopic images and the analysis of X-ray energy dispersion spectroscopy (EDS) are presented and the composition spectra of the elements present in the activated carbon electrodes of the MFCA and MFCB are shown, respectively. In the micrograph of the electrodes, pores and irregular granules of activated carbon are observed as distributed over the entire surface of the electrode. The EDS analysis revealed that the elemental composition was similar in both electrodes, and there was a greater presence of elements such as carbon, oxygen, silicon, aluminum, calcium, and iron. Likewise, it should be noted that the presence of cadmium was not found. Lui, Lu, and Zhang (2022) also obtained similar results in the EDS analyses of their graphite felt anode electrode, evidencing the majority presence of carbon, oxygen, platinum, silicon, aluminum, and iron [
62]. While Silveira, De Aquino-Neto and Schneedorf (2020) reported a higher incidence of carbon, oxygen, and iron in their carbon fiber electrodes [
63].
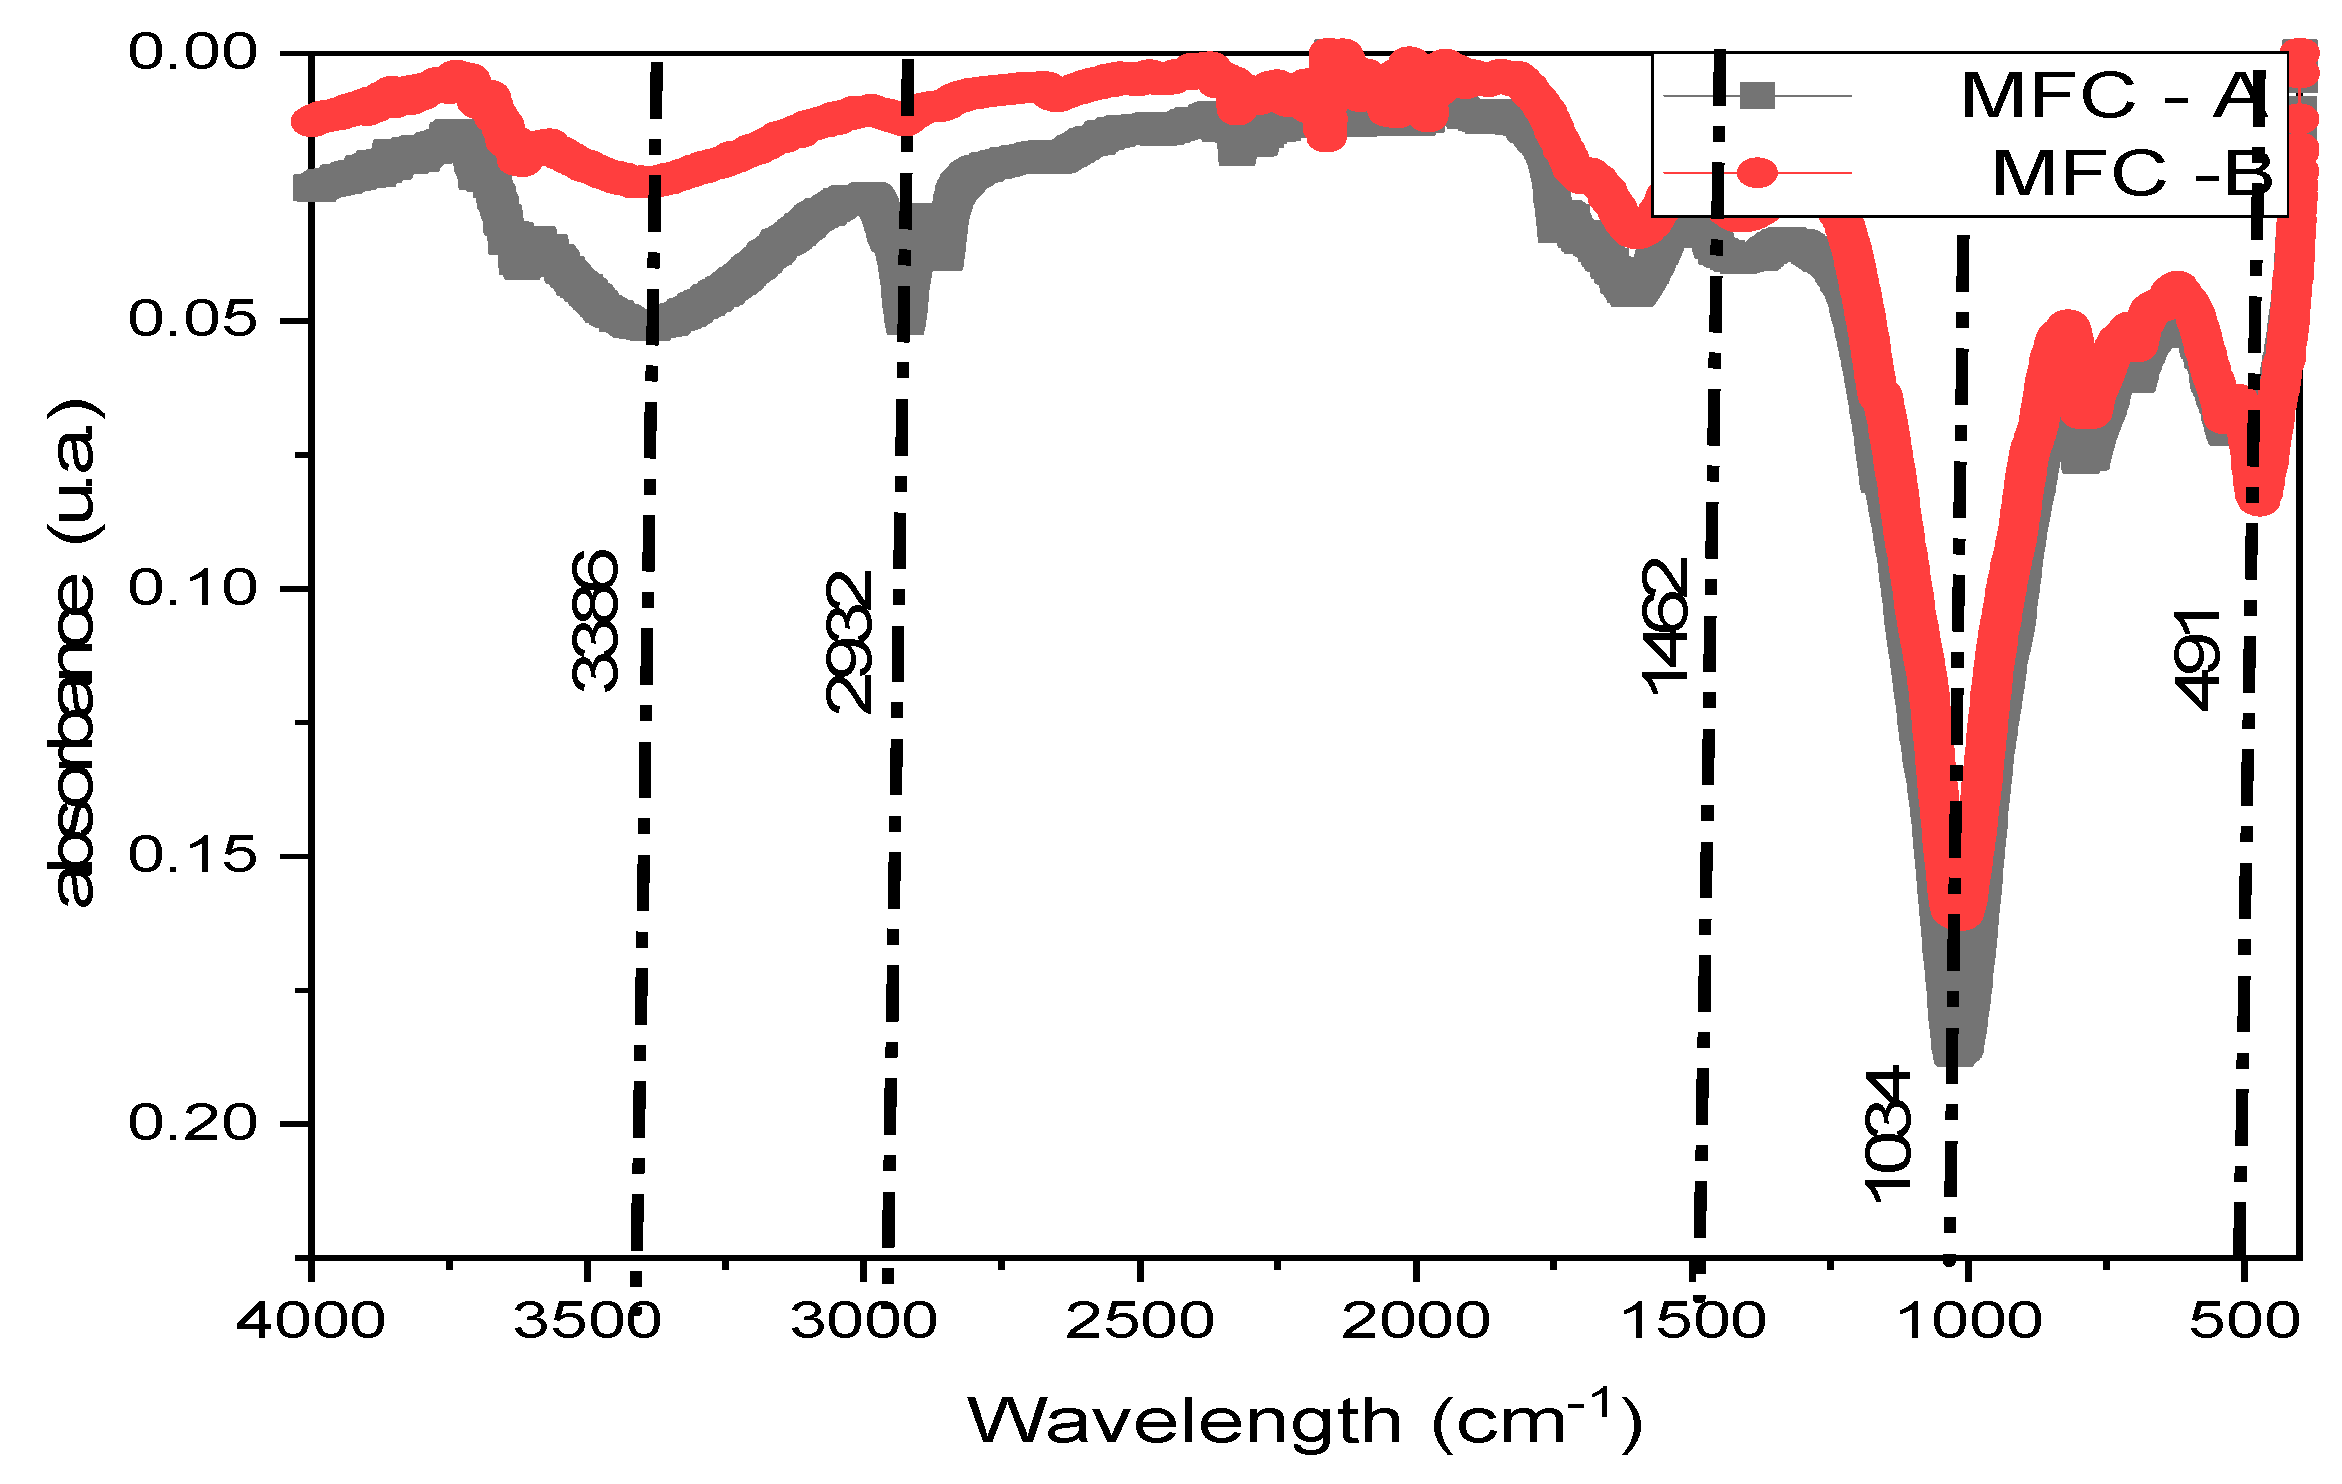
Finally,
Figure 18 shows the absorbance spectra of
Chlorella sp. in MFCA and MFCB via FTIR of the second operational stage. It is observed that the most intense peak at 3367 cm
−1 can be attributed to the O–H bonds of the phenolic compounds and 3386 and 2932 cm
−1 can be attributed to the strong C–H bonds of alkanes, while in the range of 1462 and 1034 cm
−1, the alkene compound (C=C bond) was identified, attributable to the NO
2 and C–H bonds, respectively. The peaks that are more noticeable in the spectrum are diminished in terms of the final spectrum; Idris et al. (2022) maintain that this is due to the degradation of the substrate in the process of generating electrical energy during its operation, since the microorganisms use many of these compounds as food for their functioning [
64]. Other authors, such as Putra-Hidayat et al. (2022), reported that, as seen through the FTIR spectrum, the adsorbent (MOF type HKUST-1, UiO-66, and ZIF-8) was able to eliminate Cr (VI) in an MFC as well as identify the presence of bond Zn–N atomic structures within the ligand 2-methylimidazole, the carboxylic acid group (C–OH), carboxylate (O–H), aromatic bonds derived from the benzene structure (C=C), and carbonyl bonds (C=O) [
65].
4. Conclusions
A favorable effect was observed when using different doses of Chlorella sp. biomass. in removing Cd and COD in municipal wastewater through MFC. A high cadmium removal efficiency and a significant COD reduction were achieved. In addition, high voltage and current values were recorded, indicating outstanding electric power generation. Treatments with doses of 30% biomass of Chlorella sp. showed more significant effects when removing Cd from wastewater, with an average removal of 96.12% in 25 days, compared to the treatments with doses of 10% and 20%, which had less efficacy in metal removal. This suggests that increasing the amount of dose applied results in a more effective removal of cadmium present in the wastewater. Likewise, the evaluated treatments at different pH levels in wastewater did not result in significant differences when removing cadmium from wastewater with doses of Chlorella sp. of 20% and 30%. However, there were noticeable differences with doses of 10%. Even so, the treatments at a pH of 7.5 achieved a greater removal of Cd than the other pH values evaluated, with an average removal of 75.14%. There was a greater level of cadmium removal when the treatment period was prolonged, which was evident upon reaching the 15th day of treatment, where it was observed that under the optimal pH conditions of the residual water (7.5) and the dose of Chlorella sp. (30%) in MFC, it was possible to remove 86.19% of cadmium and 63.26% of COD. The white MFC cell showed the highest performance in generating voltage (1118.5 mV) and current (1.78 mA) throughout the operation of the first stage but did not affect Cd removal. At the same time, the cells inoculated with Chlorella sp. achieved maximum voltage values of 918 mV and current values of 2.15 mA in the first operating stage and 894 mV and 4.61 mA in the second stage.
For future research, it is recommended that the optimal dose of Chlorella sp., the ideal pH of the wastewater, and the appropriate time described in this research to remove contaminants is further studied. Monitoring more wastewater parameters, such as biochemical oxygen demand (BOD), nutrients, polycyclic aromatic hydrocarbons, pesticides, antibiotics, and other heavy metals, is also recommended. The use of the activated carbon electrodes developed in this work is recommended since they have proven to be compatible with microorganisms, allowing the uniform adherence of the bacterial biofilm on the surface, presenting good conductivity for generating electrical energy in the cells and MFC, and being low cost.

 ,
, 


