Article

Intrauterine and Extrauterine Environmental PM2.5 Exposure Is Associated with Overweight/Obesity (O/O) in Children Aged 6 to 59 Months from Lima, Peru: A Case-Control Study

by
Valeria M. Paz-Aparicio
1,
Vilma Tapia
1,
Bertha Vanessa Vasquez-Apestegui
1,
Kyle Steenland
2 and
Gustavo F. Gonzales
1,3,*
1
Laboratorio de Endocrinología y Reproducción, Laboratorios de Investigación y Desarrollo (LID), Departamento de Ciencias Biológicas y Fisiológicas, Facultad de Ciencias y Filosofía, Universidad Peruana Cayetano Heredia, Lima 15102, Peru
2
Department of Environmental Health, Rollins School of Public Health, Emory University, Atlanta, GA 30322, USA
3
Instituto de Investigaciones de la Altura, Universidad Peruana Cayetano Heredia, Lima 15102, Peru
*
Author to whom correspondence should be addressed.
Toxics 2022, 10(8), 487; https://doi.org/10.3390/toxics10080487
Submission received: 29 July 2022 / Revised: 15 August 2022 / Accepted: 18 August 2022 / Published: 22 August 2022

Abstract

:
There is evidence that PM2.5 could be obesogenic. Lima is one of the most polluted cities in South America, with an increasing prevalence of childhood obesity. This study aimed to determine the association between PM2.5 exposure of children aged 6 to 59 months and being overweight or obese (O/O) in a significant dataset survey. Cases were defined when weight for height Z-score (WHZ) was >2 standard deviations (SD) from the mean, for each sex. A control was defined when WHZ was between ±2 SD. We used a conditional logistic regression model to calculate the odds ratio (OR) between extrauterine and intrauterine PM2.5 exposure and O/O. Extrauterine PM2.5 exposure was evaluated as a 6-month PM2.5 mean prior to the survey. We found a significant association between O/O and extrauterine (OR: 1.57, 1.51–1.63) and intrauterine (OR: 1.99, 1.88–2.12) PM2.5 exposure for an increment of 10 μg/m3. The ORs increased as the quartile increased in both exposures. We observed a higher association in children aged 6–11 months (OR: 3.07, 2.84–3.31). In conclusion, higher levels of PM2.5 in Lima and Callao were associated with cases of O/O in children from 6 to 59 months, with the association higher for prenatal exposure.

1. Introduction

Environmental pollution is a public health concern affecting the population worldwide. The World Health Organization (WHO) estimated that 4.2 million premature deaths worldwide are associated with atmospheric air pollution. In addition, 91% of the global population resides in areas where pollution levels exceed WHO guidelines of ten μg/m3 [1].
Ambient PM2.5, defined as particulate material less than 2.5 microns, is one of the main atmospheric contaminants and is of anthropogenic origin in urban areas. The size of PM2.5 is small enough to penetrate deeply to reach the lungs, consequently impairing their functions. Moreover, high levels of PM2.5 in ambient air have been associated with cardiovascular, reproductive, and neurologic morbidities [2] and have also been associated with higher susceptibility to infection with SARS-CoV-2 (COVID-19) [3].
Another emerging public health problem reported globally is being overweight (Body mass index, BMI > 25, ≤30) or obese (BMI > 30) (O/O) [4]. Childhood obesity is one of the most serious public health challenges of the 21st century, and it is considered also a pandemic [5].
The evidence regarding the association between PM2.5 and obesity is mixed and sparse. A recent systematic review found seven studies on PM2.5 and obesity (three cohorts and four cross-sectional). Only two studies showed positive associations between PM2.5 and obesity [6]. Since that review, a prospective cohort study that analyzed polygenic risk scores for BMI found a significant positive association between particulate matter (PM10 and PM2.5) and obesity [7].
A recent cross-sectional study in children and adolescents in China concluded that for an increment of 10 μg/m3 of PM2.5, the odds ratio for obesity was 1.10 (1.03, 1.16), and the relationship was stronger in males and low economic level regions [8]. Finally, another recent study on Chinese older adults found that prolonged exposure to air pollution (PM2.5 and PM10) was positively associated with an increased risk of general obesity and abdominal obesity [9].
Air pollutants, such as PM2.5, can potentially act as “obesogenic” agents, as they alter the methylation of receptors and expression of genes that regulate adipogenesis [10]. Similarly, PM2.5 like other air pollutants acts as an endocrine disruptor, encouraging alterations in metabolism [11]. It has also been shown that prenatal exposure to PM2.5 is associated with an accumulation of fat in adult male mice related to an increase in food intake and an increase of neuropeptide Y (NPY), an appetite-stimulating orexigenic neuropeptide [12].
A common pathway between air pollution and overweight/obesity (O/O) is that air pollution produces an inflammatory state in the organism [13] and O/O is also associated with an inflammatory state [14]. Furthermore, this obesogenic effect may be associated with other endocrine problems. In a Chinese adult population, investigators observed a higher prevalence of cardiovascular risk factors like hypertension, type 2 diabetes, dyslipidemia, and overweight/obesity associated with long-term exposure to air pollution [15].
Lima, the capital of Peru, is a mega-city with about eleven million inhabitants and is considered one of the more polluted cities in Latin America. By 2021, Peru was ranked 26st in the world with the highest concentrations of PM2.5, with an average value of 29.6 μg/m3 [16].
According to the Demographic and Family Health Survey (DHS) in Peru, the prevalence of overweight/obesity among children aged 0–5 years old was 4.5% [17]. In Lima, Peru the co-occurrence of overweight and anemia in children is commonly found [18]. Similarly, in Lima, increased outdoor PM2.5 levels were significantly associated with decreased hemoglobin values and an increase in prevalence of moderate/severe anemia in children under 5 years old [19].
For these reasons, intrauterine and extrauterine exposure to increased values of PM2.5 may be associated with overweight/obesity in children from Lima, Peru. The present study was conducted to determine this association in children aged 6–59 months using a case-control design.

2. Materials and Methods
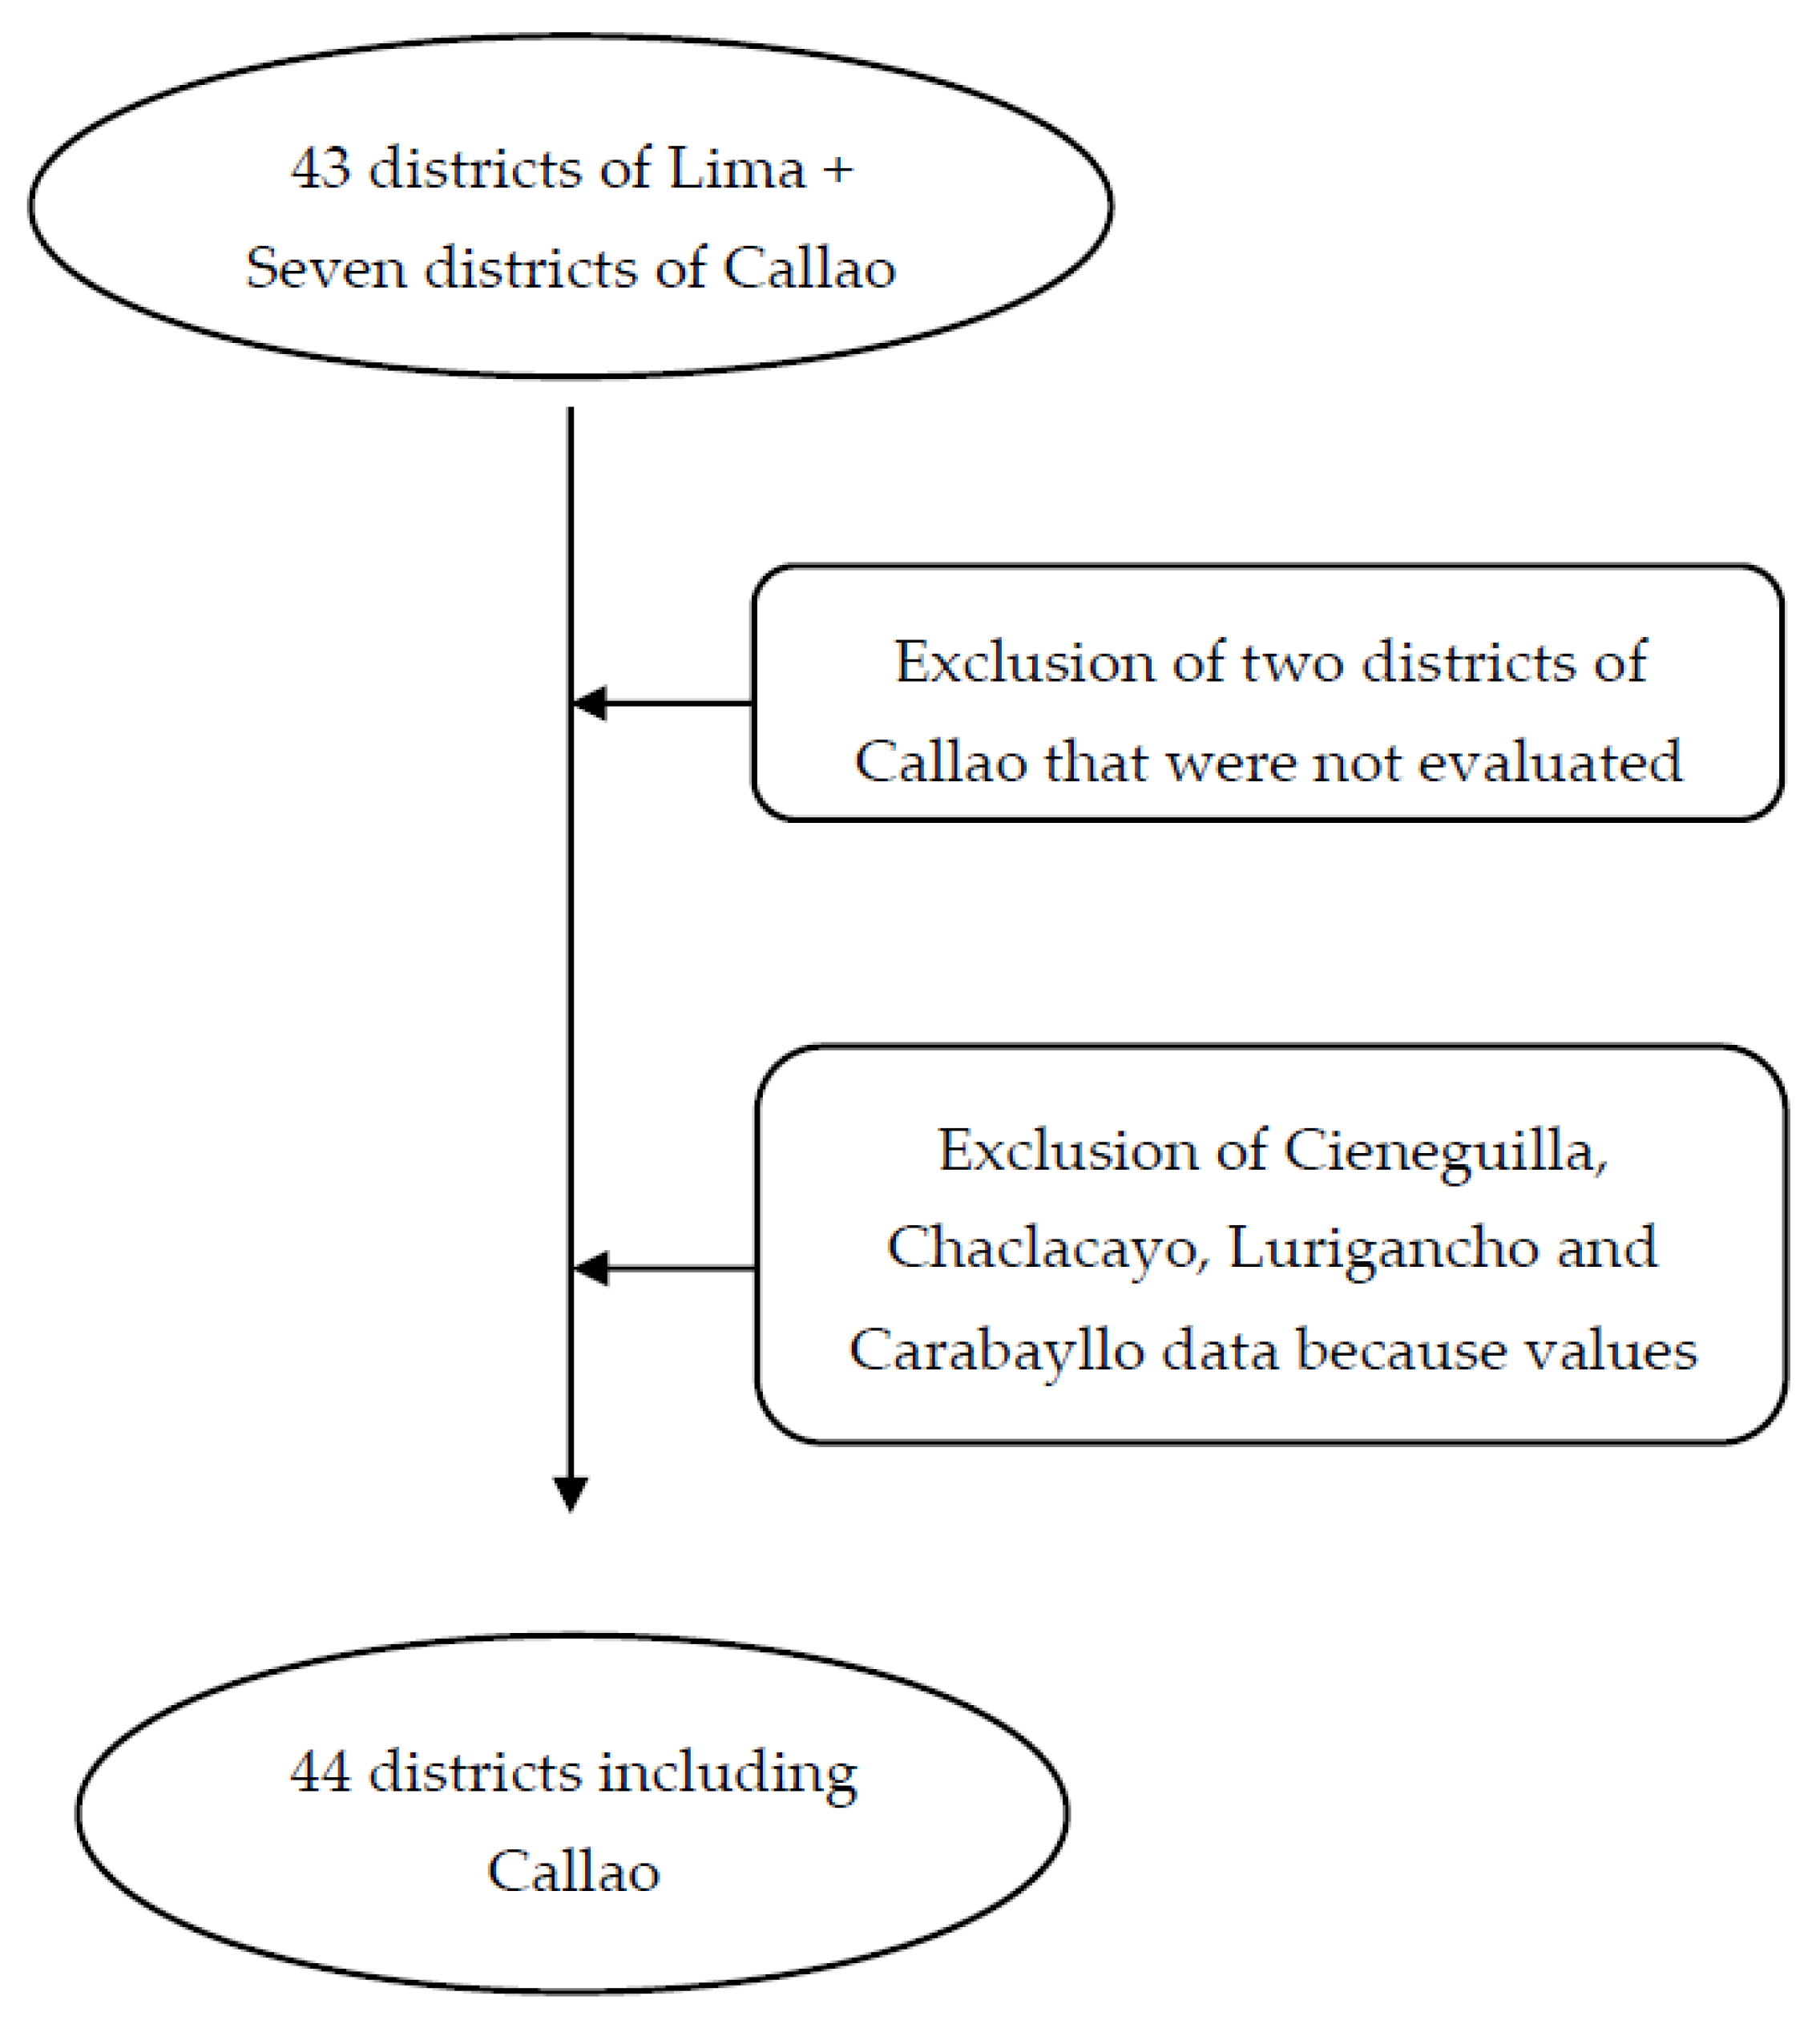
2.1. Study Area

Lima city is the capital of Peru on the central coast of the country near the Pacific Ocean. It comprises forty-three districts with almost ten million inhabitants, and the metropolitan area includes the neighboring constitutional province of “Callao”, with almost one million inhabitants in seven districts. For this research, we included only five districts in this province.

2.2. PM2.5 Exposure

PM2.5 was estimated daily by city district in Lima during 2010–2016 using a model that combined ground monitor data, satellite data, and a chemical-transport model [20]. The model was at a 1 km2 resolution. We calculated a population-weighted average across the 1-km grid for each district (n = 40). The model was shown to have good accuracy in relation to the ground monitors (mean difference between ground and predicted measurements = −0.09 μg/m3) [21]. The overall cross-validation R2 (and root mean square prediction error) was 0.70 (5.97 μg/m3) comparing predicted with observed ground-level data. The Vu et al. model [20] excluded the high-altitude districts of Cieneguilla, Chaclacayo, Lurigancho, and Carabayllo (east of Lima) because the estimates of PM2.5 in these districts were viewed as unreliable [20]. These districts represent just 4% of the total population. As a result, our study analyzed forty-four districts, including those from Callao (Figure 1).

2.3. Study Population

We conducted a case-control study using a dataset that included 441,903 children between 6 to 59 months living in Lima and Callao and attending different public health centers whose data were registered in the Nutritional Status Information System (SIEN in Spanish) by the National Center of Feeding and Nutrition (CENAN in Spanish) of the National Institute of Health (NIH) from Peru between 2012 and 2016. For this study, we studied the incidence of obesity, i.e., data from the first visit of each child under 5 years when they were found to be obese. This dataset includes information on sex, age (months), weight (kg), height (cm), district of residence, and day of the visit to the facility care center.

2.4. Definition of Cases and Controls

O/O in children is measured differently than in adults as children are growing and body mass index (BMI) changes by age (https://www.cdc.gov/obesity/childhood/defining.html; accessed on 22 June 2022) and gender. We defined children as O/O when weight for height Z-score (WHZ) was higher than 2 standard deviations (SD) from the mean, for each sex. A control was defined when WHZ was between minus 2 to plus 2 standard deviations [22]. O/O cases were matched on age, sex, and day of visit to the health center. WHZ is defined as below [22].
WHZ = ( observed   weight   -   WHO   reference   average   value   for   height   and   sex ) WHO   reference   standard   deviation   for   height   and   sex   specific   values
Cases and controls were not matched on the health center because that would in most cases be matching on residential PM2.5 level, which was assigned based on the Lima district of residence (n = 39) or Callao (n = 5). After restricting to the first instance of O/O, the final case-control database included a total of 32,616 O/O cases and 32,616 matched controls (1:1).

2.5. Variable Definitions

We obtained data for daily temperature (°C) and relative humidity (%) from the National Service of Meteorology and Hydrology (SENAMHI). An average daily temperature, relative humidity and PM2.5 level were calculated for each district (n = 44, including those from Callao). Then, for each case and control, an average for temperature, humidity, and PM2.5 was calculated during the 6 months before the survey visit based on their district of residence at the time of their visits. Finally, we calculated quartiles for the three environmental variables. We used data during part of 2011 to calculate exposure windows for the first health visits in 2012.
Age expressed in months was used for matching cases to controls and for the analysis. We analyzed the population as a whole and stratified analyses into age groups: 6 to 11 months, 12 to 35 months, and 36 to 59 months.
We used the poverty rate for each district in Lima and Callao, generated by the National Institute of Statistics and Informatics (INEI in Spanish) [23]. This rate considers household characteristics, household members, education, health, employment and income, pension system, ethnicity, financial inclusion, displacement, household expenses, citizen participation, and social programs per district. Data are presented as the percent of people living in poverty in a determined district. For our regression, we categorized poverty into quartiles with the first quartile being the least poor.
Finally, to calculate intrauterine exposure, we estimated the date of birth by subtracting the age (in months and days) from the date on which the child was evaluated. Subsequently, we averaged the exposure for 9 months before the birth of each child for the different districts. The Spearman correlation between intra and extra-uterine PM2.5 exposure was Rho = 0.90.

2.6. Statistical Analysis

The statistical package used for the analyses was Stata version 15 (College Station, TX, USA: Stata Press). Differences between mean values were tested with the T-student test or with the Mann–Whitney U test for normally and non-normally distributed variables, respectively.
Conditional logistic regression was used to analyze the association of PM2.5 with case status due to the matching of age and sex. Log ORs were estimated as a linear function of PM2.5 levels using as a contrast a 10 μg/m3 increase. Furthermore, we evaluated PM2.5 levels in quartiles for extra- and intrauterine exposure. The logistic model was adjusted for the quartiles of the moving average of relative humidity (%), temperature (°C) and poverty. We used the Akaike criterion (AIC) to assess model fit. Statistical significance was defined as a p-value < 0.05. The research was approved by the Institutional Review Board at the Universidad Peruana Cayetano Heredia.

3. Results

The present study included 65,232 children between 6 to 59 months, of whom 52.91% were boys. The largest population was aged 12–35 months (44.67%) at time of visit and the smallest was aged 36–59 months (21.73%). The quartiles for PM2.5, temperature, relative humidity, and poverty were the essentially the same in all age groups (Table 1).
Environmental PM2.5 6 months prior to the diagnosis was higher for the cases than for the controls across all age groups. Temperature and relative humidity (both in the 6 months before the visit), and poverty were not different between groups (p > 0.05) (Table 2).
Subsequently, we evaluated intrauterine and extrauterine exposure exposition with O/O cases (n = 40,866; 20,433 cases and 20,433 controls) in a logistic model with controlling for temperature, humidity, and poverty (Table 3).
Table 3 reports the odds ratio for a 10 μg/m3 increment of PM2.5 as well as reporting odds ratios by quartile of exposure (separate models) with O/O for intra- and extra-uterine exposures (Table 3).
We found positive associations between both exposures and childhood overweight/obesity (p < 0.001). This association was stronger for intrauterine than that observed for extrauterine exposure when the ORs were compared for the highest quartile.
Increased relative humidity, temperature, and poverty were all protective against obesity.
We also analyzed the data separately by sex for extrauterine exposure (Table 4). The results did not differ by sex.
Age-specific analyses showed that the highest association of increased PM2.5 with O/O was observed at 6–11 months; it was moderate at 12–35 months and not apparent at 36–59 months (Table 5).
Figure 2A,B presents high ORs for O/O for intra- and extrauterine exposure with the highest quartile of PM2.5. In addition, higher ORs for O/O were observed at 31 to 39 weeks of age for intra-uterine exposure (Figure 2A) than with extra-uterine exposure (Figure 2B).

4. Discussion

Our study found that high exposure to PM2.5 was associated with O/O. These results suggest a potential increase in childhood obesity risk in children prenatally and postnatally exposed to environmental pollutants. Our results suggest that exposure to higher concentrations of PM2.5 in the prior 6 months including prenatally is associated with O/O cases in the child population aged between 6 to 59 months, with the strongest associations at earlier ages.
In addition, our results showed a stronger association with intrauterine exposure vs. extrauterine exposure. It has been shown previously that prenatal exposure to vehicular traffic pollution is related to accelerated weight gain in childhood [24], and it has also been associated with energy imbalance and glucose tolerance in male offspring [25]. We did not observe in our data differences between males and females.
In southern California, prenatal ambient air pollutant exposure was associated with increased weight gain and anthropometric measures from 1 to 6 months of life among Hispanic infants [26]. Our result agrees with those in that we found stronger effects at earlier ages of exposure.
The Colorado-based Healthy Start study found limited evidence of associations of prenatal exposure to ambient PM2.5 and O3 with indicators of adiposity at age 4–6 years (27). Our study results are again concordant with those, as they showed that the strongest association occurred in the youngest children, between 6 and 11 months of age, and no difference was observed in the group aged 36–59 months as reported in the study by Bloemsma et al. [27].
In another study, in Boston, USA, Fleisch et al. found no evidence for a persistent effect of prenatal exposure to traffic pollution (PM2.5 in the third trimester was 11.4 (1.7) μg/m3 on BMI trajectory from birth through mid-childhood in a population exposed to modest levels of air pollution [28]. In our study, the mean for PM2.5 was more than double that observed by Fleisch et al. [28], and the associations we found were driven by the higher quartile of exposure.
Regarding postnatal exposure to PM2.5, one study found that PM2.5 significantly modified the association between age and weight in males, with a positive association in children younger than 3 years and a negative association afterwards [29]. Again, the same pattern was observed in our study, with a stronger direct association at 6–11 months but no association at 36–59 months.
The evolution of adiposity with age shows that during the first year of life, fat mass increases and then decreases as age increases. Subsequently, a new ascent called “adiposity rebound” (AR) is observed [30,31]. This is a biological pattern that is displayed in different populations independent of geographic region, socioeconomic status, or sex [32]. The onset of this stage is an indicator of the future development of obesity. That is, the earlier the adiposity rebound in the child, the greater the risk of increasing fat tissue in adult life [31,33].
Normally, the average BMI rebound indicating AR was found before the age of 5 years (54–59 months) [34]. Our data suggest that high PM2.5 values as observed in Lima, Peru, may be a factor associated with early adiposity. Early adiposity is predictive of adult obesity [35].
We found a strong negative association of the poverty indicator on cases of O/O, where the greater the poverty, the lower the probability of overweight or obesity. The literature on this point is inconclusive. One study found that higher economic development was associated with less obese and more underweight children [36]. However, Gamboa-Gamboa et al. found a bigger prevalence of childhood obesity and overweight in children of higher socioeconomic status [37].
We also found a significant inverse association between environmental temperature and obesity when there was extrauterine exposure. These results suggest that the higher the ambient temperature, the less energy the body requires to maintain body temperature. However, Wallwork et al. demonstrated that living in warmer temperature areas increases the risk of metabolic dysfunctions like elevated fasting blood glucose, which is associated with insulin resistance [38].
It is known that obesity in the first years of life increases the probability of adult obesity, and of diseases linked to obesity such as diabetes mellitus, cancer, and cardiovascular diseases in adult life [39]. Consequently, this means a significant health risk, suggesting that Peruvian air quality environmental regulations should be revised.
The prevalence of abdominal obesity among Peruvian adults was 73.8%, being higher among women than men (85.1% and 61.1% respectively, p < 0.001) [40]. It is possible that exposure to air pollution prenatally and postnatally during the first years of life may contribute to this high prevalence of obesity during adulthood.
Daily physical activity has been recommended for children and adolescents to prevent overweight and obesity [41], since it has been shown that regardless of the type of exercise, physical activity maintains cellular and cardiovascular homeostasis by improving the lipid and inflammatory profiles in obese children [42]. Moreover, the probability of being obese as an adult when born to an obese father is three times higher than that born of non-obese parents [43]. Therefore, it would be best to consider parental obesity when analyzing child obesity. Not having information on child’s physical activity, parent’s obesity, and nutrition are important limitations of our study.
Another limitation of the study was that we could not evaluate other sociodemographic and health indicators that may cause childhood overweightness and obesity or that affect the association, such as type of feeding (breastfeeding, mixed feeding, solid food), diversity and composition of the diet, daily caloric intake, physical activity, sanitation, supplementation, use of medications, weight, diet and education of the mother, other diseases (metabolic, infectious and inflammatory) of the child, etc. This is because we did not have information on these variables in the dataset. However, many environmental factors affecting childhood obesity (activity levels, diet, etc.) are unlikely to be associated with air pollution and hence cannot function as confounders. Also, given the strong associations observed, we do not think they are likely to be due entirely to uncontrolled confounding.
A third limitation is that we assumed that all children were born at the end of the mother’s pregnancy. Since the exact date of birth was not recorded in the database, the calculation of intrauterine exposure was not accurate for preterm children. Furthermore, because the unit of analysis of this study is the child, another limitation is not having data on the mother’s activity during pregnancy.
We did not have data on pregnancy outcomes, which could be a limitation. PM2.5 is associated with lower birthweight (LBW), and therefore, we might expect that with more PM2.5 and more LBW babies, there would be less obesity in childhood. However, there are two reasons why these were less of a concern. First, studies linking LBW with later risk of obesity have had mixed results [44]. Second, if in fact LBW is associated with lower risk of childhood obesity, then LBW would be a mediator or intermediate variable on the pathway between PM2.5 and childhood obesity; one would typically not want to control for an intermediate variable in estimating the total effect of PM2.5 on childhood obesity.
Finally, overweight/obesity may result from catch-up growth in infants with LBW from air pollution exposure [45].
The strength of our investigation is the analysis of data obtained in a population with high environmental pollution since Lima is considered one of the most contaminated cities in Latin America [46], and we analyzed the probability of O/O attributable to PM2.5 exposition in a large data set as different life stages. This research is the first study that associates PM2.5 and overweight/obesity in Lima and Callao and shows the association of a new investigated obesogenic factor, PM2.5, which is a modifiable risk factor.

5. Conclusions

In conclusion, there are associations between elevated levels of intrauterine and extrauterine PM2.5 exposure with cases of O/O in children from 6 to 59 months in Lima and Callao, with the association being stronger for prenatal exposure. Furthermore, the association was stronger for children between 6 to 11 months. Potential interventions in the development of overweight and obesity at an early age is extremely important since obesity is a risk factor for developing diseases attributed to inflammation and other pathologies related to hormonal and metabolic imbalance in the future. Likewise, good control of air pollutants—with special emphasis on PM2.5—is important to avoid other future chronic adverse health effects in adulthood and youth ages. This information could be useful for improving public policies and strategies to control diseases.

Author Contributions

Conceptualization, G.F.G.; methodology, V.M.P.-A., K.S., B.V.V.-A. and G.F.G.; formal analysis, V.M.P.-A. and V.T.; visualization, V.M.P.-A.; writing—original draft preparation, V.M.P.-A. and G.F.G.; validation and data analysis, V.M.P.-A. and V.T.; writing—review and editing, V.M.P.-A., K.S. and G.F.G. All authors have read and agreed to the published version of the manuscript.

Funding

The National Institutes of Health (Fogarty Program) (grant number U01TW010107) funded this study, 1/2 Regional GEOHealth Hub, centered in Peru.

Institutional Review Board Statement

All procedures performed in this study were following the Declaration of Helsinki and were approved by the Institutional Review Board of the University Peruana Cayetano Heredia (Code SIDISI 201324; 3 February 2020).

Informed Consent Statement

Not applicable.

Data Availability Statement

Data can be available at request.

Conflicts of Interest

The authors declare no conflict of interest.

References

  1. WHO. Air Pollution [Internet]. WHO. 2020. Available online: https://www.who.int/health-topics/air-pollution#tab=tab_1 (accessed on 6 November 2021).
  2. Feng, S.; Gao, D.; Liao, F.; Zhou, F.; Wang, X. The health effects of ambient PM2.5 and potential mechanisms. Ecotoxicol. Environ. Saf. 2016, 128, 67–74. [Google Scholar] [CrossRef] [PubMed]
  3. Vasquez-Apestegui, B.V.; Parras-Garrido, E.; Tapia, V.; Paz-Aparicio, V.M.; Rojas, J.P.; Sanchez-Ccoyllo, O.R.; Gonzales, G.F. Association between air pollution in Lima and the high incidence of COVID-19: Findings from a post hoc analysis. BMC Public Health 2021, 21, 1161. [Google Scholar] [CrossRef] [PubMed]
  4. Gurnani, M.; Birken, C.; Hamilton, J. Childhood Obesity. Pediatr. Clin. N. Am. 2015, 62, 821–840. [Google Scholar] [CrossRef] [PubMed]
  5. Malecka-Tendera, E.; Mazur, A. Childhood obesity: A pandemic of the twenty-first century. Int. J. Obes. 2006, 30, S1–S3. [Google Scholar] [CrossRef] [Green Version]
  6. An, R.; Ji, M.; Yan, H.; Guan, C. Impact of ambient air pollution on obesity: A systematic review. Int. J. Obes. 2018, 42, 1112–1126. [Google Scholar] [CrossRef]
  7. Furlong, M.A.; Klimentidis, Y.C. Associations of air pollution with obesity and body fat percentage, and modification by polygenic risk score for BMI in the UK Biobank. Environ. Res. 2020, 185, 109364. [Google Scholar] [CrossRef]
  8. Zheng, H.; Xu, Z.; Wang, Q.; Ding, Z.; Zhou, L.; Xu, Y.; Su, H.; Li, X.; Zhang, L.; Cheng, J. Long-term exposure to ambient air pollution and obesity in school-aged children and adolescents in Jiangsu province of China. Environ. Res. 2021, 195, 110804. [Google Scholar] [CrossRef]
  9. Zhang, N.; Wang, L.; Zhang, M.; Nazroo, J. Air quality and obesity at older ages in China: The role of duration, severity and pollutants. PLoS ONE 2019, 14, e0226279. [Google Scholar] [CrossRef] [Green Version]
  10. Barrea, L.; Savastano, S.; Di Somma, C.; Savanelli, M.C.; Nappi, F.; Albanese, L.; Orio, F.; Colao, A. Low serum vitamin D-status, air pollution and obesity: A dangerous liaison. Rev. Endocr. Metab. Disord. 2017, 18, 207–214. [Google Scholar] [CrossRef] [Green Version]
  11. Darbre, P.D. Overview of air pollution and endocrine disorders. Int. J. Gen. Med. 2018, 11, 191–207. [Google Scholar]
  12. Chen, M.; Wang, X.; Hu, Z.; Zhou, H.; Xu, Y.; Qiu, L.; Qin, X.; Zhang, Y.; Ying, Z. Programming of mouse obesity by maternal exposure to concentrated ambient fine particles. Part. Fibre Toxicol. 2017, 14, 20. [Google Scholar] [CrossRef] [PubMed]
  13. Xu, M.-X.; Ge, C.-X.; Qin, Y.-T.; Gu, T.-T.; Lou, D.-S.; Li, Q.; Hu, F.-H.; Feng, J.; Huang, P.; Tan, J. Prolonged PM2.5 exposure elevates risk of oxidative stress-driven nonalcoholic fatty liver disease by triggering increase of dyslipidemia. Free Radic. Biol. Med. 2019, 130, 542–556. [Google Scholar] [CrossRef]
  14. Izaola, O.; de Luis, D.; Sajoux, I.; Domingo, J.C.; Vidal, M. Inflammation, and obesity (lipoinflammation). Nutr. Hosp. 2015, 31, 2352–2358. [Google Scholar] [PubMed] [Green Version]
  15. Yang, B.-Y.; Guo, Y.; Markevych, I.; Qian, Z.M.; Bloom, M.S.; Heinrich, J.; Dharmage, S.C.; Rolling, C.A.; Jordan, S.S.; Komppula, M.; et al. Association of Long-term Exposure to Ambient Air Pollutants With Risk Factors for Cardiovascular Disease in China. JAMA Netw. Open 2019, 2, e190318. [Google Scholar] [CrossRef] [PubMed] [Green Version]
  16. IQAir. World Air Quality Report [Internet]. 2021. Available online: https://www.iqair.com/world-air-quality-report (accessed on 14 June 2022).
  17. Echevarría-Castro, N.; Matayoshi-Pérez, A.; Alvarado, G. Association between Maternal Depressive Symptoms with Overweight/Obesity among Children Aged 0–5 Years According to the 2016 Demographic and Family Health Survey. Child. Obes. 2020, 16, 307–315. [Google Scholar] [CrossRef]
  18. Dorsey, A.F.; Penny, M.E.; Thompson, A.L. Adiposity, and pathogen exposure: An investigation of response to iron supplementation and hypothesized predictors in anemic pre-school-aged children living in a dual burden environment. Am. J. Phys. Anthropol. 2021, 176, 54–65. [Google Scholar] [CrossRef] [PubMed]
  19. Morales-Ancajima, V.C.; Tapia, V.; Vu, B.N.; Liu, Y.; Alarcón-Yaquetto, D.E.; Gonzales, G.F. Increased Outdoor PM2.5 Concentration Is Associated with Moderate/Severe Anemia in Children Aged 6–59 Months in Lima, Peru. J. Environ. Public Health 2019, 2019, 6127845. [Google Scholar] [CrossRef] [PubMed] [Green Version]
  20. Vu, B.; Sánchez, O.; Bi, J.; Xiao, Q.; Hansel, N.; Checkley, W.; Gonzales, G.F.; Steenland, K.; Liu, Y. Developing an advanced PM2.5 exposure model in Lima, Peru. Remote Sens. 2019, 11, 641. [Google Scholar] [CrossRef] [Green Version]
  21. Tapia, V.; Steenland, K.; Sarnat, S.E.; Vu, B.; Liu, Y.; Sánchez-Ccoyllo, O.; Vásquez, V.; Gonzales, G.F. Time-series analysis of ambient PM2.5 and cardiorespiratory emergency room visits in Lima, Peru during 2010–2016. J. Expo. Sci. Environ. Epidemiol. 2020, 30, 680–688. [Google Scholar] [CrossRef]
  22. WHO. Child Growth Standards. 2014. Available online: https://www.who.int/tools/child-growth-standards/standards/weight-for-length-height (accessed on 9 May 2020).
  23. Instituto de Estadística e Informática. Mapa de Pobreza Monetaria Provincial y Distrital, Lima. 2018. Available online: https://www.inei.gob.pe/media/MenuRecursivo/publicaciones_digitales/Est/Lib1718/Libro.pdf (accessed on 15 May 2020).
  24. Fleisch, A.F.; Rifas-Shiman, S.L.; Koutrakis, P.; Schwartz, J.D.; Kloog, I.; Melly, S.; Coull, B.A.; Zanobetti, A.; Gillman, M.W.; Gold, D.R.; et al. Prenatal Exposure to Traffic Pollution: Associations with Reduced Fetal Growth and Rapid Infant Weight Gain. Epidemiology 2015, 26, 43–50. [Google Scholar] [CrossRef]
  25. Zordão, O.P.; Claro, L.W.; Saldiva, P.; Donato, J.; Veras, M.; Prada, P.O. Air Pollution Exposure during Pregnancy and Lactation Induces Obesity and Glucose Intolerance in the Offspring. Diabetes 2018, 67 (Suppl. 1), 223-OR. [Google Scholar] [CrossRef]
  26. Patterson, W.B.; Glasson, J.; Naik, N.; Jones, R.B.; Berger, P.K.; Plows, J.F.; Minor, H.A.; Lurmann, F.; Gornan, M.I.; Alderete, T.L. Prenatal exposure to ambient air pollutants and early infant growth and adiposity in the Southern California Mother’s Milk Study. Environ. Health 2021, 20, 67. [Google Scholar] [CrossRef] [PubMed]
  27. Bloemsma, L.D.; Dabelea, D.; Thomas, D.S.K.; Peel, J.L.; Adgate, J.L.; Allshouse, W.B.; Martenies, S.E.; Magzamen, S.; Starling, A.P. Prenatal exposure to ambient air pollution and traffic and indicators of adiposity in early childhood: The Healthy Start study. Int. J. Obes. 2022, 46, 494–501. [Google Scholar] [CrossRef]
  28. Fleisch, A.F.; Aris, I.M.; Rifas-Shiman, S.L.; Coull, B.A.; Luttmann-Gibson, H.; Koutrakis, P.; Schwartz, J.D.; Kloog, I.; Gold, D.R.; Oken, E. Prenatal Exposure to Traffic Pollution and Childhood Body Mass Index Trajectory. Front. Endocrinol. 2019, 9, 771. [Google Scholar] [CrossRef] [PubMed] [Green Version]
  29. Vanoli, J.; Coull, B.A.; de Cuba, S.E.; Fabian, P.M.; Carnes, F.; Massaro, M.A.; Poblacion, A.; Bellocco, R.; Kloog, I.; Schwartz, J.; et al. Postnatal exposure to PM2.5 and weight trajectories in early childhood. Environ. Epidemiol. 2021, 6, E181. [Google Scholar] [CrossRef] [PubMed]
  30. Rolland-Cachera, M.F.; Deheeger, M.; Bellisle, F.; Sempé, M.; Guilloud-Bataille, M.; Patois, E. Adiposity rebound in children: A simple indicator for predicting obesity. Am. J. Clin. Nutr. 1984, 39, 129–135. [Google Scholar] [CrossRef] [PubMed]
  31. Rolland-Cachera, M.F.; Deheeger, M.; Guilloud-Bataille, M.; Avons, P.; Patois, E.; Sempé, M. Tracking the development of adiposity from one month of age to adulthood. Ann. Hum. Biol. 1987, 14, 219–229. [Google Scholar] [CrossRef]
  32. Vrijkotte, T.G.M.; Oostvogels, A.J.J.M.; Stronks, K.; Roseboom, T.J.; Hof, M.H.P. Growth patterns from birth to overweight at age 5–6 years of children with various backgrounds in socioeconomic status and country of origin: The ABCD study. Pediatr. Obes. 2020, 15, 12635. [Google Scholar] [CrossRef] [Green Version]
  33. Cole, T.J. Children grow and horses race: Is the adiposity rebound a critical period for later obesity? BMC Pediatr. 2004, 4, 6. [Google Scholar] [CrossRef] [Green Version]
  34. Goh, E.K.; Kim, O.Y.; Yoon, S.R.; Jeon, H.J. Timing of Adiposity Rebound and Determinants of Early Adiposity Rebound in Korean Infants and Children Based on Data from the National Health Insurance Service. Nutrients 2022, 14, 929. [Google Scholar] [CrossRef]
  35. Ip, E.H.; Marshall, S.A.; Saldana, S.; Skelton, J.A.; Suerken, C.K.; Arcury, T.A.; Quandt, S.A. Determinants of Adiposity Rebound Timing in Children. J. Pediatr. 2017, 184, 151–156.e2. [Google Scholar] [CrossRef] [PubMed] [Green Version]
  36. Banjari, I.; Martinović, M.; Belojević, G.; Ašanin, B.; Kovačević, N.D.; Kenjerić, D.; Miskulin, M.; Patovic, S.; Sokolic, D.; Buljan, V.; et al. Poverty and other correlates of obesity and underweight among 7-year-olds from Croatia and Montenegro. Public Health 2020, 182, 64–69. [Google Scholar] [CrossRef] [PubMed]
  37. Gamboa-Gamboa, T.; Fantin, R.; Cordoba, J.; Caravaca, I.; Gómez-Duarte, I. Relationship between childhood obesity and socio-economic status among primary school children in Costa Rica. Public Health Nutr. 2021, 24, 3825–3833. [Google Scholar] [CrossRef] [PubMed]
  38. Wallwork, R.S.; Colicino, E.; Zhong, J.; Kloog, I.; Coull, B.A.; Vokonas, P.; Schwartz, J.D.; Baccarelli, A.A. Ambient Fine Particulate Matter, Outdoor Temperature, and Risk of Metabolic Syndrome. Am. J. Epidemiol. 2017, 185, 30–39. [Google Scholar] [CrossRef]
  39. Eriksson, J.G.; Forsén, T.; Tuomilehto, J.; Osmond, C.; Barker, D.J.P. Early adiposity rebound in childhood and risk of Type 2 diabetes in adult life. Diabetologia 2003, 46, 190–194. [Google Scholar] [CrossRef]
  40. Farro-Maldonado, M.Y.; Gutierrez-Perez, G.; Hernandez-Vásquez, A.; Barrenechea-Pulache, A.; Santero, M.; Rojas-Roque, C.; Azanedo, D. Socioeconomic inequalities in abdominal obesity among Peruvian adults. PLoS ONE 2021, 16, e0254365. [Google Scholar] [CrossRef]
  41. Styne, D.M.; Arslanian, S.A.; Connor, E.L.; Farooqi, I.S.; Murad, M.H.; Silverstein, J.H.; Yanovski, J.A. Pediatric Obesity-Assessment, Treatment, and Prevention: An Endocrine Society Clinical Practice Guideline. J. Clin. Endocrinol. Metab. 2017, 102, 709–757. [Google Scholar] [CrossRef] [Green Version]
  42. Paes, S.T.; Marins, J.C.B.; Andreazzi, A.E. Metabolic effects of exercise on childhood obesity: A current vision. Rev. Paul. Pediatr. 2015, 33, 122–129. [Google Scholar] [CrossRef] [Green Version]
  43. Huang, J.Y.; Qi, S.J. Childhood obesity and food intake. World J. Pediatrics 2015, 11, 101–107. [Google Scholar] [CrossRef]
  44. Andriani, H. Birth weight and childhood obesity: Effect modification by residence and household wealth. Emerg. Themes Epidemiol. 2022, 18, 6. [Google Scholar] [CrossRef]
  45. Reilly, J.J.; Armstrong, J.; Dorosty, A.R.; Emmett, P.M.; Ness, A.; Rogers, I.; Steer, C.; Sherriff, A. Avon Longitudinal Study of Parents and Children Study Team. Early life risk factors for obesity in childhood: Cohort study. BMJ 2005, 11, 1357. [Google Scholar] [CrossRef] [PubMed] [Green Version]
  46. Gonzales, G.F.; Steenland, K. Environmental Health in Peru: Outdoor and Indoor Air Contamination. Rev. Panam. Salud. Pub. 2014, 36, 141. [Google Scholar]
Figure 1. Environmental data exclusion flowchart.
Toxics 10 00487 g001
Figure 2. Maternal exposure in different quartiles of PM2.5 on O/O rate. (A): intrauterine exposure; (B): extrauterine exposure.
Toxics 10 00487 g002
Table 1. Quartiles of poverty and environmental variables for a 6-month exposure window per age group.
O/O Aged 6 to 11O/O Aged 12 to 35O/O Aged 36 to 59
PM2.5 (μg/m3) QuartilesPM2.5 QuartilesPM2.5 Quartiles
Q1 (14.36–18.63)Q1 (14.38–18.77)Q1 (14.91–18.35)
Q2 (18.64–20.40)Q2 (18.78–20.76)Q2 (18.36–20.19)
Q3 (20.41–26.85)Q3 (20.77–27.64)Q3 (20.20–27.53)
Q4 (26.86–46.05)Q4 (27.65–46.07)Q4 (27.54–46.05)
Relative Humidity (%)
Q1 (54.37–66.90)Q1 (54.20–66.44)Q1 (54.46–66.79)
Q2 (66.91–73.16)Q2 (66.45–71.88)Q2 (66.80–73.37)
Q3 (73.17–80.67)Q3 (71.89–79.61)Q3 (73.38–80.04)
Q4 (80.68–89.90)Q4 (79.62–89.70)Q4 (80.05–89.69)
Temperature (°C)
Q1 (17.09–21.55)Q1 (17.10–21.57)Q1 (17.11–21.63)
Q2 (21.56–23.29)Q2 (21.58–23.16)Q2 (21.64–23.41)
Q3 (23.30–25.56)Q3 (23.17–25.41)Q3 (23.42–25.52)
Q4 (25.57–30.35)Q4 (25.42–30.35)Q4 (25.53–30.36)
Poverty (%)
Q1 (0.17–10.48)Q1 (0.17–10.48)Q1 (0.17–10.04)
Q2 (10.49–16.84)Q2 (10.49–16.84)Q2 (10.05–15.99)
Q3 (16.85–22.80)Q3 (16.85–22.04)Q3 (16.00–22.04)
Q4 (22.81–29.09)Q4 (22.05–29.09)Q4 (22.05–29.09)
Table 2. Population characteristics.
ExposureExtrauterineIntrauterine
VariablesCases
n = 32,616
Control
n = 32,616
Cases
n = 20,433
Control
n = 20,433
(Mean ± SD)(Mean ± SD)(Mean ± SD)(Mean ± SD)
Weight (kg)14.23 ± 4.36 a11.45 ± 3.2312.29 ± 2.7110.04 ± 2.09 a
Height (cm)82.52 ± 12.98 a81.59 ± 12.3776.62 ± 8.8675.89 ± 8.33 a
WHZ *2.67 ± 0.66 a0.51 ± 0.892.62 ± 0.610.54 ± 0.87 a
PM2.5 (μg/m3)23.67 ± 6.05 b22.68 ± 5.2723.24 ± 5.4021.80 ± 4.61 b
Temperature (°C)23.53 ± 2.4923.43 ± 2.5223.80 ± 2.1323.46 ± 1.88
Relative Humidity (%)73.10 ± 8.0873.18 ± 8.0772.89 ± 4.6072.97 ± 4.65
Poverty (%)16.10 ± 7.0616.20 ± 6.8316.50 ± 6.9616.35 ± 6.67
* WHZ is the weight for height z-score value. a T-student: p < 0.001, cases vs. controls. b Mann-Whitney U test: p < 0.001, cases vs. control.
Table 3. Conditional regression analysis between a ten μg/m3 increase in intrauterine and extrauterine exposure PM2.5 and O/O cases in Lima and Callao.
ExposureOverweight/Obesity
n = 65,232 or (95% CI)
ExposureOverweight/Obesity
n = 40,866 or (95% CI)
Extrauterine PM2.51.57 (1.51–1.63)Intrauterine PM2.51.99 (1.88–2.12)
Relative Humidity (%) Relative Humidity (%)
Q1 (54.20–66.67)1.0Q1 (61.18–69.54)1.0
Q2 (66.68–72.63)0.89 (0.83–0.95)Q2 (69.55–73.13)0.967 (0.89–1.05)
Q3 (72.64–80.06)0.79 (0.71–0.89)Q3 (73.14–75.71)0.90 (0.81–0.99)
Q4 (80.07–89.90)0.82 (0.70–0.96)Q4 (75.72–86.38)0.86 (0.77–0.97)
Temperature (°C) Temperature (°C)
Q1 (17.09–21.58)1.0Q1 (18.53–22.35)1.0
Q2 (21.59–23.26)0.95 (0.90–1.00)Q2 (22.36–23.59)0.79 (0.75–0.85)
Q3 (23.27–25.49)0.85 (0.79–0.91)Q3 (23.60–24.80)0.83 (0.77–0.89)
Q4 (25.50–30.36)0.77 (0.71–0.84)Q4 (24.81–29.41)0.93 (0.85–1.01)
Poverty (%) Poverty (%)
Q1 (0.17–10.48)1.0Q1 (0.17–10.48)1.0
Q2 (10.49–16.84)0.80 (0.77–0.84)Q2 (10.49–16.84)0.81 (0.76–0.86)
Q3 (16.85–22.04)0.74 (0.70–0.77)Q3 (16.85–22.80)0.68 (0.64–0.72)
Q4 (22.05–29.09)0.75 (0.71–0.79)Q4 (22.81–29.09)0.73 (0.69–0.78)
PM2.5 Quartiles PM2.5 Quartiles
Q1 (14.36–18.63)1.0Q1 (15.73–18.61)1.0
Q2 (18.64–20.49)0.83 (0.79–0.87)Q2 (18.62–19.82)0.86 (0.81–0.92)
Q3 (20.50–27.37)0.97 (0.92–1.03)Q3 (19.83–26.88)1.24 (1.15–1.33)
Q4 (27.38–46.07)1.52 (1.43–1.62)Q4 (26.89–40.44)1.99 (1.84–2.16)
CI: Confidence Interval. PM2.5 quartiles models are separately different from the linear PM2.5 exposure model reported in the first row.
Table 4. Conditional regression analysis for a 10 μg/m3 increase in extrauterine PM2.5 using a 6-month exposure window and O/O cases in Lima and Callao by sex.
ExposureMale
n = 34,514 or (95% CI)
ExposureFemale
n = 30,718 or (95% CI)
PM2.51.58 (1.50–1.67)PM2.51.56 (1.47–1.64)
Relative Humidity (%) Relative Humidity (%)
Q1 (54.37–66.67)1.0Q1 (54.20–66.66)1.0
Q2 (66.68–72.64)0.86 (0.78–0.94)Q2 (66.67–72.60)0.92 (0.84–1.02)
Q3 (72.65–80.07)0.79 (0.68–0.92)Q3 (72.61–80.06)0.79 (0.67–0.93)
Q4 (80.08–89.70)0.84 (0.68–1.04)Q4 (80.07–89.90)0.79 (0.63–0.99)
Temperature (°C) Temperature (°C)
Q1 (17.10–21.58)1.0Q1 (17.09–21.59)1.0
Q2 (21.59–23.26)0.94 (0.87–1.01)Q2 (21.60–23.25)0.96 (0.88–1.04)
Q3 (23.27–25.49)0.83 (0.753–0.92)Q3 (23.26–25.47)0.87 (0.79–0.97)
Q4 (25.50–30.35)0.76 (0.67–0.86)Q4 (25.48–30.36)0.79 (0.69–0.90)
Poverty (%) Poverty (%)
Q1 (0.17–10.48)1.0Q1 (0.17–10.48)1.0
Q2 (10.49–16.84)0.83 (0.78–0.88)Q2 (10.49–16.84)0.78 (0.72–0.83)
Q3 (16.85–22.04)0.76 (0.71–0.82)Q3 (16.85–22.04)0.71 (0.66–0.76)
Q4 (22.05–29.09)0.77 (0.72–0.83)Q4 (22.05–29.09)0.72 (0.67–0.78)
CI indicates, confidence interval at 95%.
Table 5. Odds ratios for O/O for a 10 μg/m3 increase in PM2.5 for extrauterine exposure using a 6-month exposure window by age group.
ExposureO/O Aged 6 to 11O/O Aged 12 to 35O/O Aged 36 to 59
n = 21,918 or (95% CI)n = 29,146 or (95% CI)n = 14,174 or (95% CI)
Extrauterine PM2.53.07 (2.84–3.31)1.31 (1.24–1.38)0.98 (0.91–1.01)
Relative Humidity (%)
Q11.01.01.0
Q20.87 (0.77–0.99)0.81 (0.73–0.89)1.07 (0.91–1.25)
Q30.72 (0.59–0.89)0.71 (0.60–0.84)1.00 (0.79–1.27)
Q40.75 (0.56–1.00)0.79 (0.63–1.00)0.89 (0.65–1.23)
Temperature (°C)
Q11.01.01.0
Q20.97 (0.88–1.07)0.94 (0.87–1.02)0.94 (0.84–1.07)
Q30.83 (0.73–0.94)0.81 (0.73–0.90)0.94 (0.81–1.09)
Q40.71 (0.60–0.83)0.72 (0.63–0.82)0.94 (0.78–1.14)
Poverty (%)
Q11.01.01.0
Q20.72 (0.66–0.78)0.84 (0.79–0.91)0.88 (0.80–0.98)
Q30.58 (0.53–0.64)0.76 (0.70–0.81)0.96 (0.86–1.07)
Q40.70 (0.64–0.77)0.74 (0.69–0.80)0.95 (0.85 -1.06)
PM2.5 Quartiles
Q11.01.01.0
Q20.79 (0.72–0.86)0.78 (0.73–0.84)1.03 (0.92–1.14)
Q31.27 (1.16–1.40)0.78 (0.72–0.85)0.98 (0.87–1.11)
Q43.33 (2.98–3.72)1.11 (1.01–1.21)0.99 (0.87–1.12)
Each age group is a model adjusted by temperature, relative humidity, and poverty. PM2.5 quartiles models are different from the linear PM2.5 exposure models. Age group expressed in months.
Publisher’s Note: MDPI stays neutral with regard to jurisdictional claims in published maps and institutional affiliations.

