
Fibrinogen-to-Albumin Ratio and Blood Urea Nitrogen-to-Albumin Ratio in COVID-19 Patients: A Systematic Review and Meta-Analysis

 , , ,
, , ,  , , and
Abstract
:1. Introduction
2. Methods
2.1. Search Strategy and Databases
2.2. Eligibility Criteria
2.3. Study Selection Process and Data Extraction
2.4. Quality Assessment
2.5. Assessment of Publication Bias
2.6. Statistical Analyses
3. Results
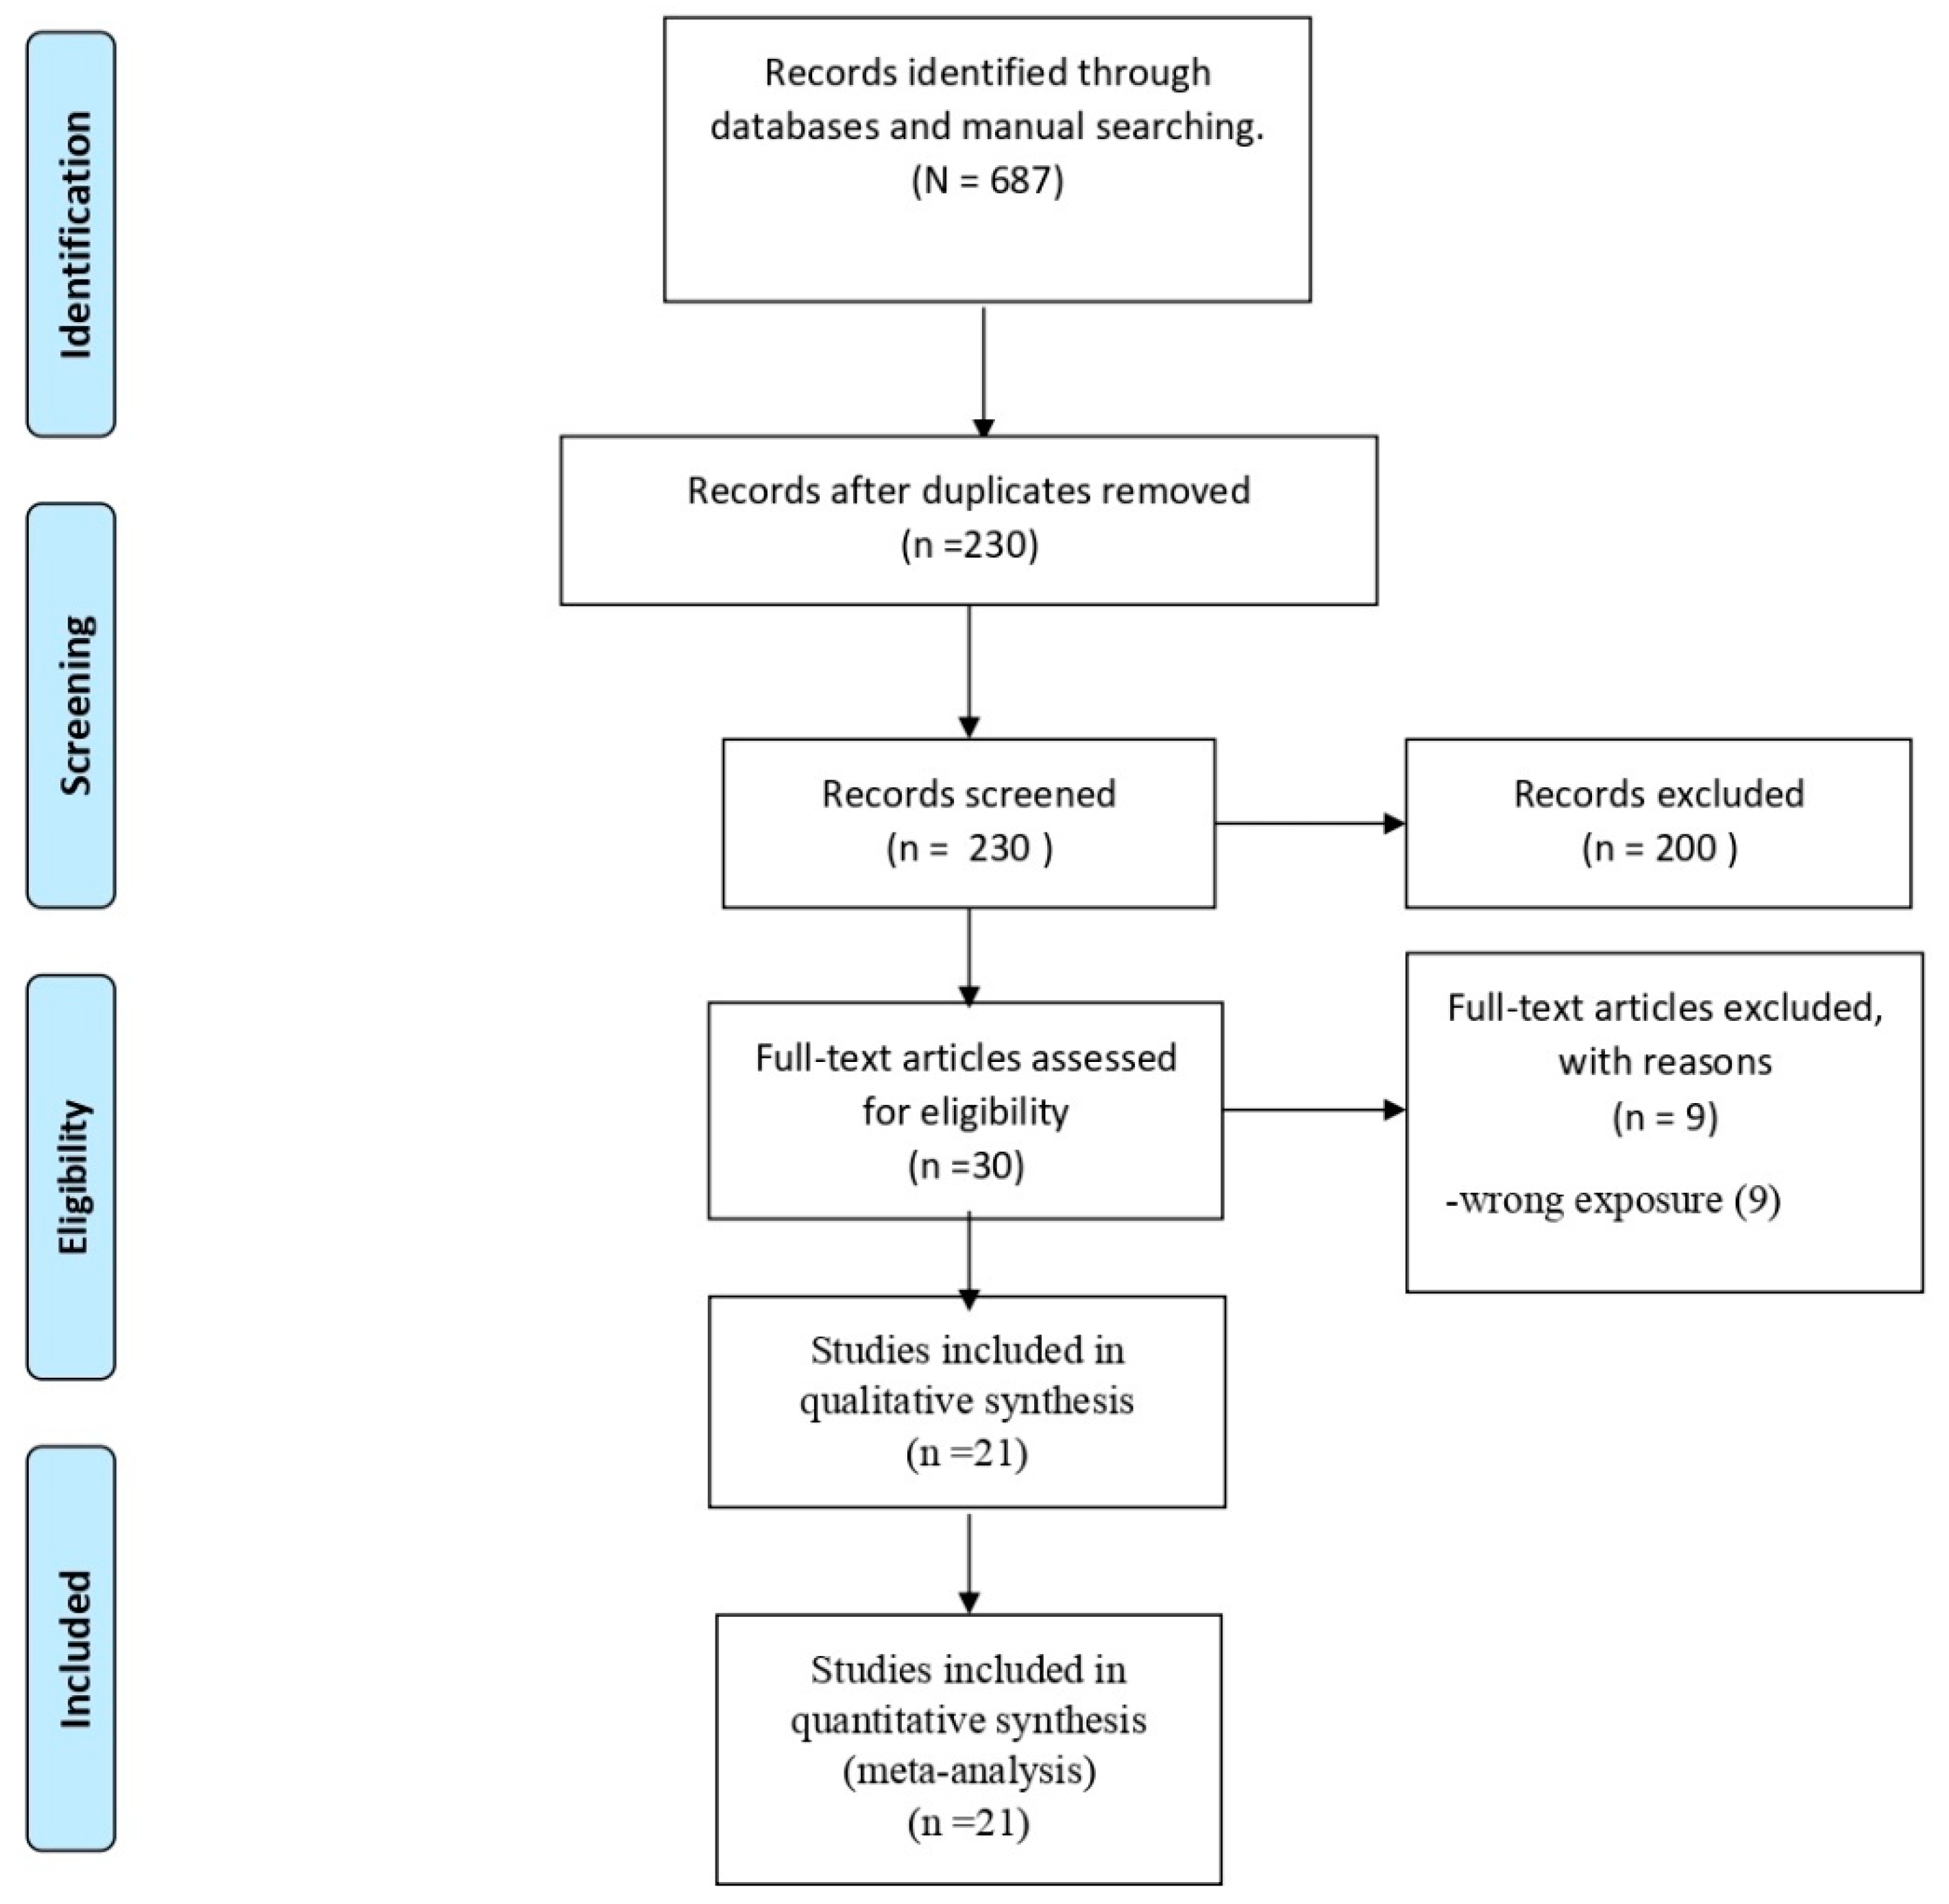
3.1. Search Results
3.2. Study Characteristics
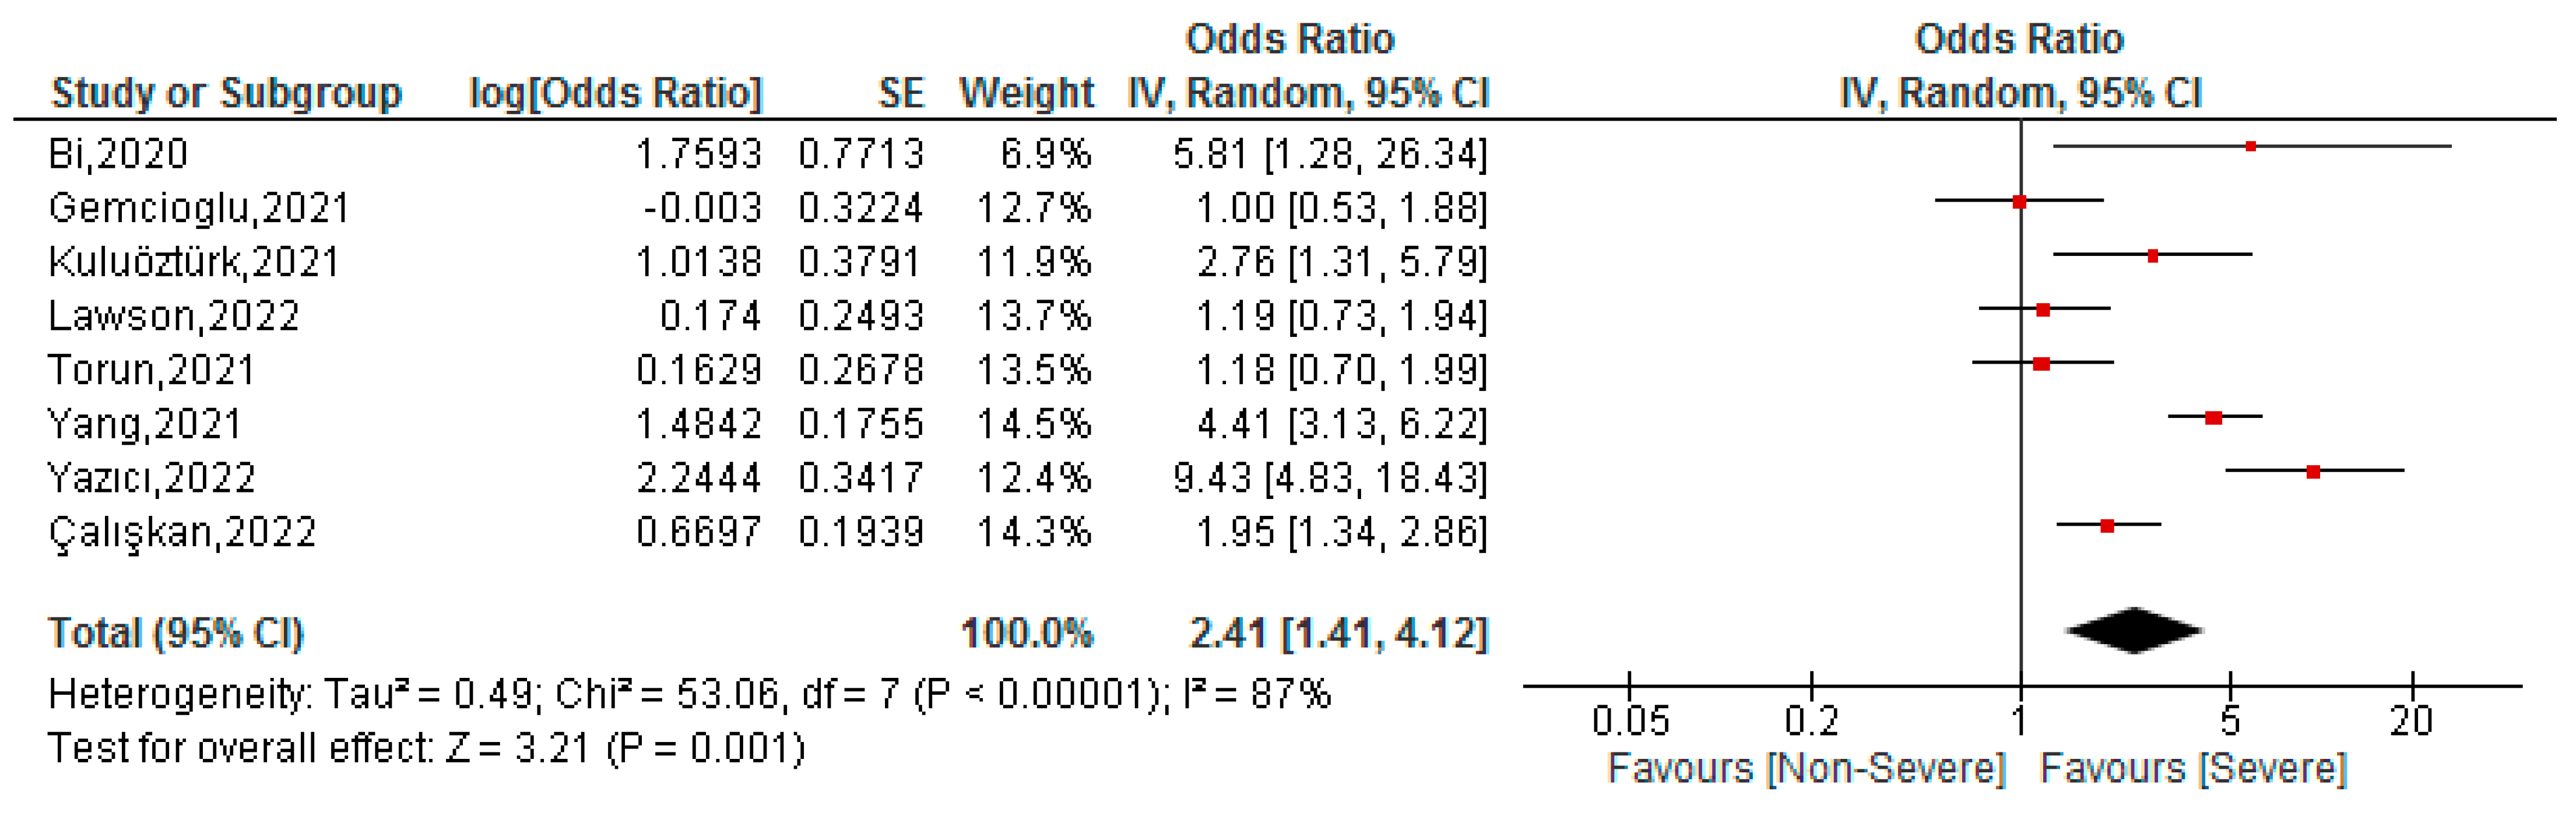
3.3. Association between FAR Values and Severity of COVID-19 Patients
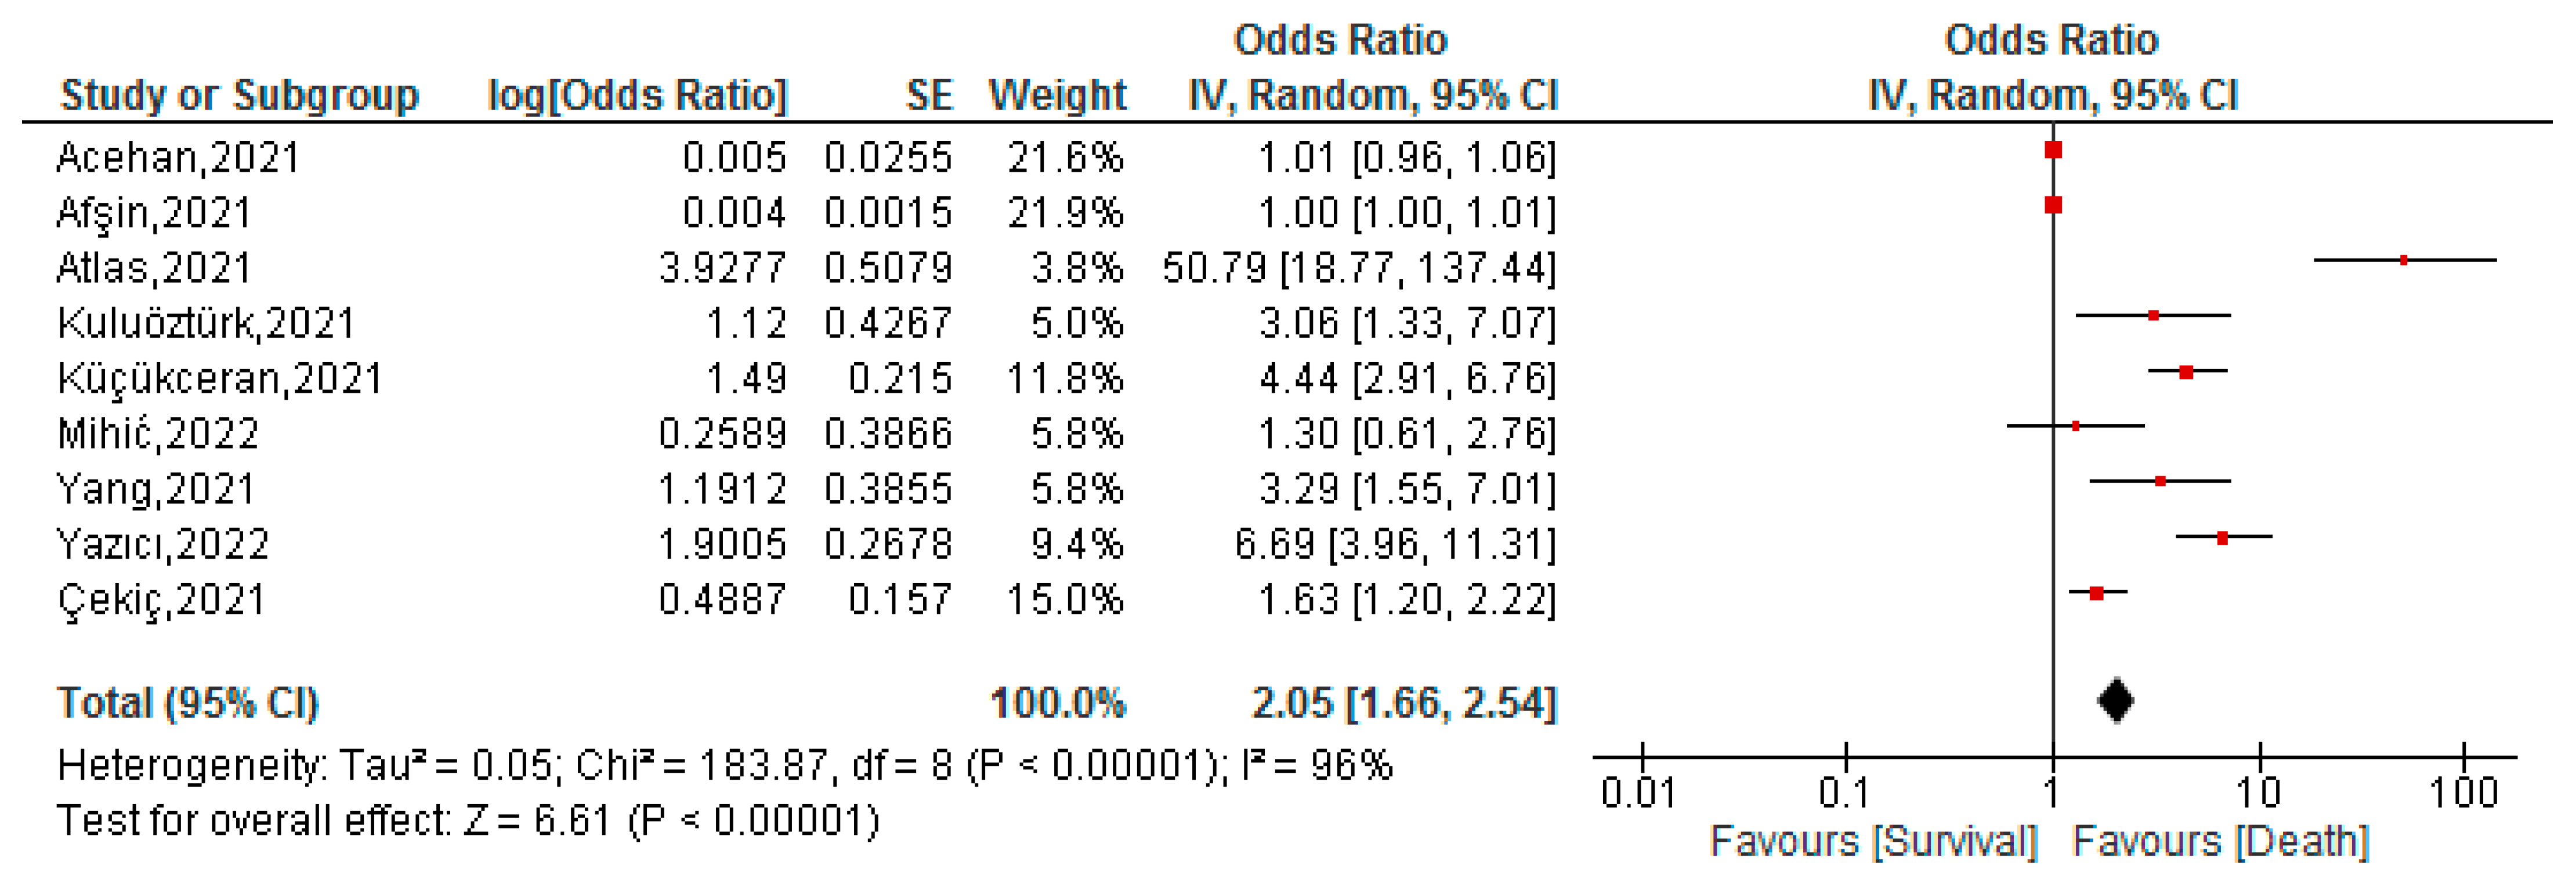
3.4. Association between FAR Values and Mortality of COVID-19 Patients
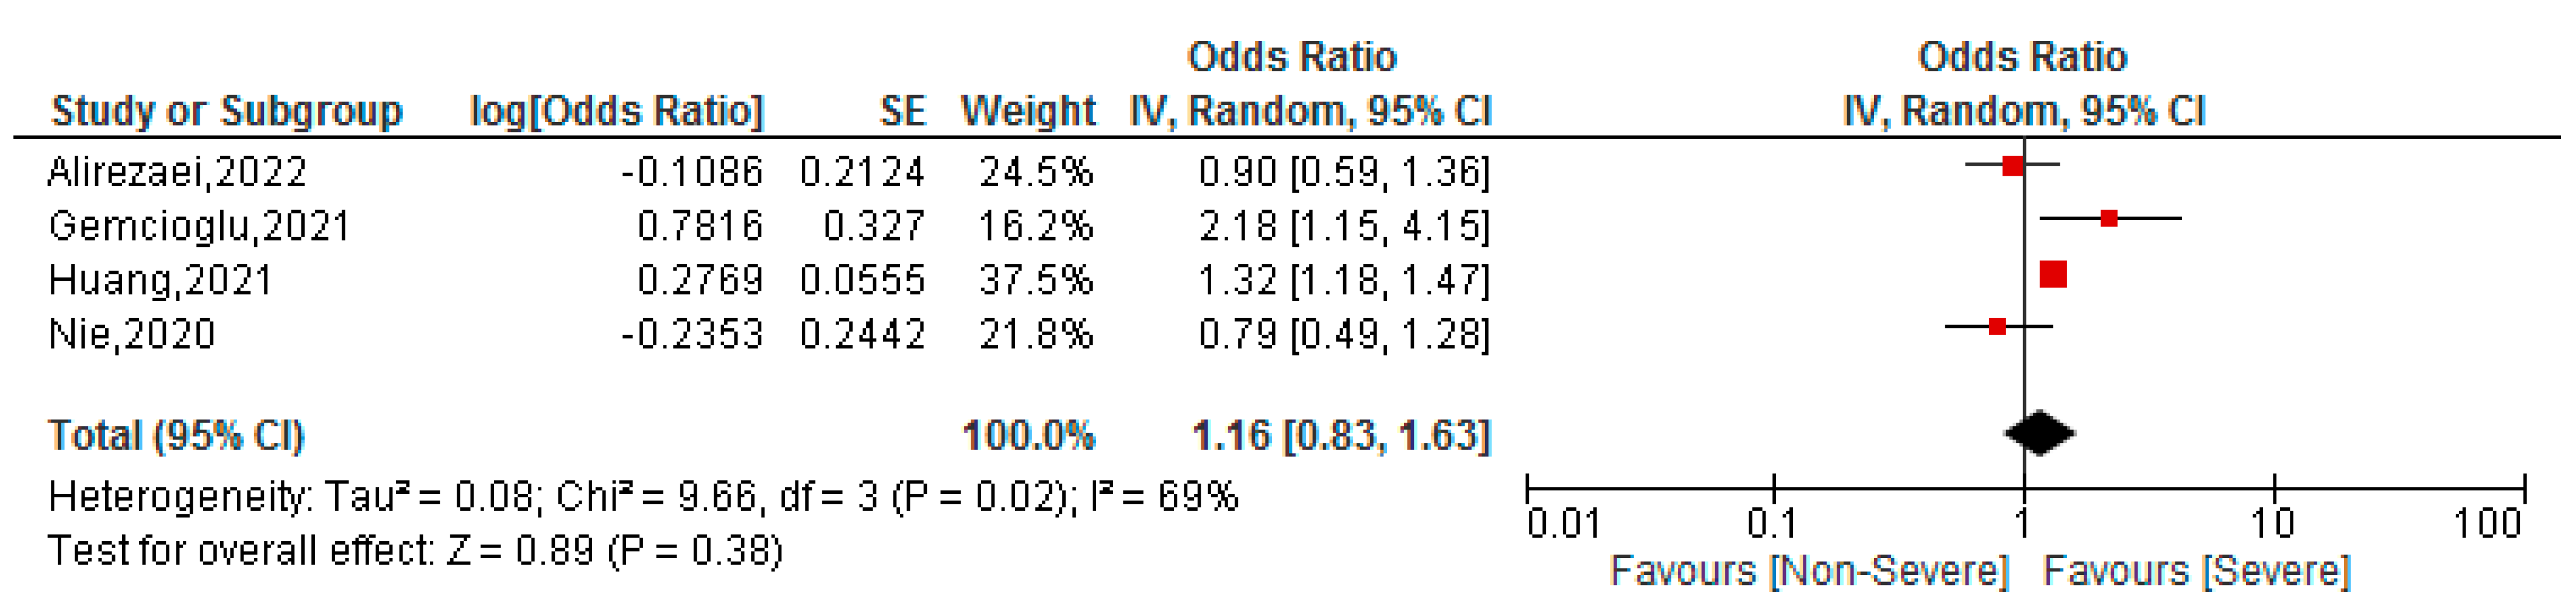
3.5. Association between BAR Values and Severity of COVID-19 Patients
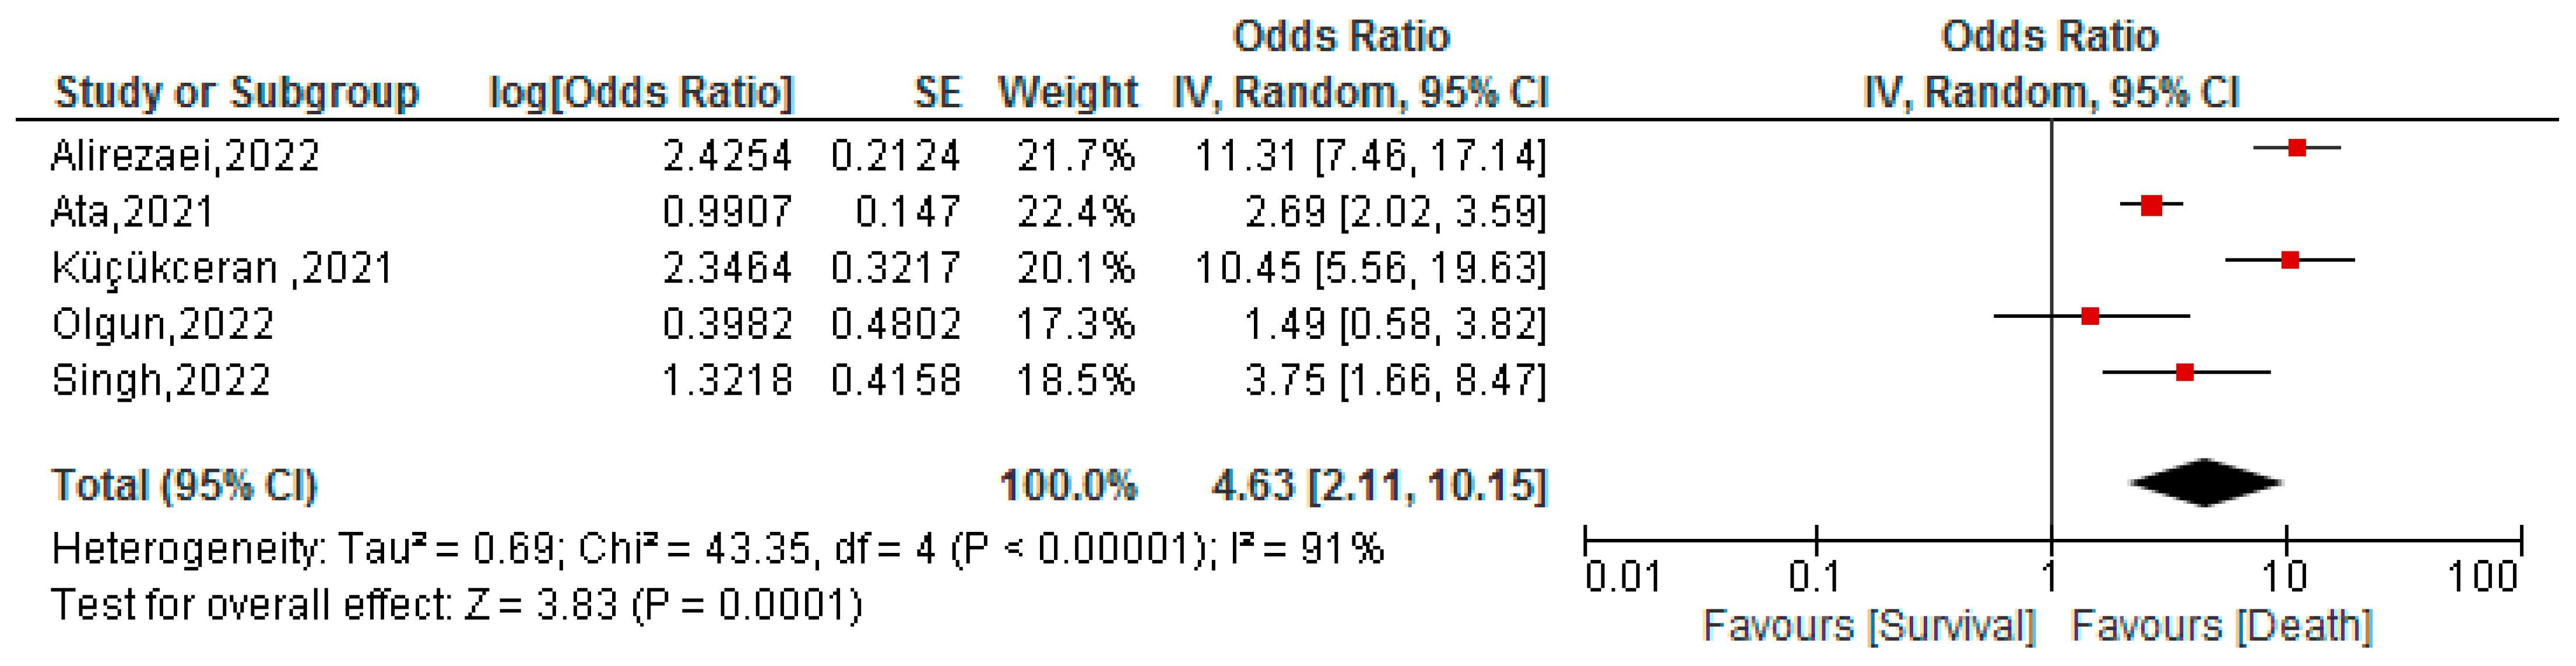
3.6. Association between BAR Values and Mortality of COVID-19 Patients
3.7. Publication Bias
4. Discussion
Limitations
5. Conclusions
Supplementary Materials
Author Contributions
Funding
Institutional Review Board Statement
Informed Consent Statement
Data Availability Statement
Conflicts of Interest
References
- World Health Organization. WHO Coronavirus (COVID-19) Dashboard WHO Coronavirus (COVID-19) Dashboard with Vaccination Data. Available online: https://covid19.who.int/ (accessed on 18 May 2022).
- Wang, H.; Paulson, K.R.; Pease, S.A.; Watson, S.; Comfort, H.; Zheng, P.; Aravkin, A.Y.; Bisignano, C.; Barber, R.M.; Alam, T.; et al. Estimating excess mortality due to the COVID-19 pandemic: A systematic analysis of COVID-19-related mortality, 2020–2021. Lancet 2022, 399, 1513–1536. [Google Scholar] [CrossRef]
- Kolahchi, Z.; De Domenico, M.; Uddin, L.Q.; Cauda, V.; Grossmann, I.; Lacasa, L.; Grancini, G.; Mahmoudi, M.; Rezaei, N. COVID-19 and Its Global Economic Impact. Adv. Exp. Med. Biol. 2021, 1318, 825–837. [Google Scholar] [CrossRef]
- Abumalloh, R.A.; Asadi, S.; Nilashi, M.; Minaei-Bidgoli, B.; Nayer, F.K.; Samad, S.; Mohd, S.; Ibrahim, O. The impact of coronavirus pandemic (COVID-19) on education: The role of virtual and remote laboratories in education. Technol. Soc. 2021, 67, 101728. [Google Scholar] [CrossRef] [PubMed]
- Malik, P.; Patel, U.; Mehta, D.; Patel, N.; Kelkar, R.; Akrmah, M.; Gabrilove, J.L.; Sacks, H. Biomarkers and outcomes of COVID-19 hospitalisations: Systematic review and meta-analysis. BMJ Evid.-Based Med. 2021, 26, 107–108. [Google Scholar] [CrossRef] [PubMed]
- Ulloque-Badaracco, J.R.; Salas-Tello, W.I.; Al-kassab-Córdova, A.; Alarcón-Braga, E.A.; Benites-Zapata, V.A.; Maguiña, J.L.; Hernandez, A.V. Prognostic value of neutrophil-to-lymphocyte ratio in COVID-19 patients: A systematic review and meta-analysis. Int. J. Clin. Pract. 2021, 75, e14596. [Google Scholar] [CrossRef] [PubMed]
- Coomes, E.A.; Haghbayan, H. Interleukin-6 in COVID-19: A systematic review and meta-analysis. Rev. Med. Virol. 2020, 30, 1–9. [Google Scholar] [CrossRef]
- Heidari-Beni, F.; Vahedian-Azimi, A.; Shojaei, S.; Rahimi-Bashar, F.; Shahriary, A.; Johnston, T.P.; Sahebkar, A. The Level of Procalcitonin in Severe COVID-19 Patients: A Systematic Review and Meta-Analysis. Adv. Exp. Med. Biol. 2021, 1321, 277–286. [Google Scholar] [CrossRef]
- Cheng, L.; Li, H.; Li, L.; Liu, C.; Yan, S.; Chen, H.; Li, Y. Ferritin in the coronavirus disease 2019 (COVID-19): A systematic review and meta-analysis. J. Clin. Lab. Anal. 2020, 34, e23618. [Google Scholar] [CrossRef]
- Ulloque-Badaracco, J.R.; Hernandez-Bustamante, E.A.; Herrera-Añazco, P.; Benites-Zapata, V.A. Prognostic value of apolipoproteins in COVID-19 patients: A systematic review and meta-analysis. Travel Med. Infect. Dis. 2021, 44, 102200. [Google Scholar] [CrossRef]
- Mayeux, R. Biomarkers: Potential Uses and Limitations. NeuroRx 2004, 1, 182–188. [Google Scholar] [CrossRef]
- Sui, J.; Noubouossie, D.F.; Gandotra, S.; Cao, L. Elevated Plasma Fibrinogen Is Associated with Excessive Inflammation and Disease Severity in COVID-19 Patients. Front. Cell. Infect. Microbiol. 2021, 11, 712. [Google Scholar] [CrossRef] [PubMed]
- Turcato, G.; Zaboli, A.; Kostic, I.; Melchioretto, B.; Ciccariello, L.; Zaccaria, E.; Olivato, A.; Maccagnani, A.; Pfeifer, N.; Bonora, A. Severity of SARS-CoV-2 infection and albumin levels recorded at the first emergency department evaluation: A multicentre retrospective observational study. Emerg. Med. J. 2022, 39, 63–69. [Google Scholar] [CrossRef]
- Çetin, M.; Erdoğan, T.; Kırış, T.; Özer, S.; Yılmaz, A.S.; Durak, H.; Aykan, A.; Şatıroğlu, Ö. Predictive value of fibrinogen-to-albumin ratio in acute coronary syndrome. Herz 2020, 45, 145–151. [Google Scholar] [CrossRef]
- Liu, G.; Fan, C.-M.; Guo, H.; Fan, W.-N.; Li, M.-L.; Cui, G.-X. Fibrinogen-to-albumin ratio predicts long-term outcomes for patients with ST-elevation myocardial infarction and multivessel disease: A prospective observational cohort study. Exp. Ther. Med. 2021, 21, 465. [Google Scholar] [CrossRef]
- Ying, H.-Q.; Chen, W.; Xiong, C.-F.; Wang, Y.; Li, X.-J.; Cheng, X.-X. Quantification of fibrinogen-to-pre-albumin ratio provides an integrating parameter for differential diagnosis and risk stratification of early-stage colorectal cancer. Cancer Cell Int. 2022, 22, 137. [Google Scholar] [CrossRef] [PubMed]
- Çiçekli, E.; Sayan, S.; Kotan, D. Availability of Fibrinogen/Albumin ratio in MS attack. Mult. Scler. Relat. Disord. 2022, 60, 103674. [Google Scholar] [CrossRef] [PubMed]
- Milas, G.P.; Issaris, V.; Papavasileiou, V. Blood urea nitrogen to albumin ratio as a predictive factor for pneumonia: A meta-analysis. Respir. Med. Res. 2022, 81, 100886. [Google Scholar] [CrossRef] [PubMed]
- Zhao, D.; Chen, S.; Liu, Y.; Xu, Z.; Shen, H.; Zhang, S.; Li, Y.; Zhang, H.; Zou, C.; Ma, X. Blood Urea Nitrogen-to-Albumin Ratio in Predicting Long-Term Mortality in Patients Following Coronary Artery Bypass Grafting: An Analysis of the MIMIC-III Database. Front. Surg. 2022, 9, 801708. [Google Scholar] [CrossRef] [PubMed]
- Lin, Z.; Zhao, Y.; Xiao, L.; Qi, C.; Chen, Q.; Li, Y. Blood urea nitrogen to serum albumin ratio as a new prognostic indicator in critical patients with chronic heart failure. ESC Heart Fail. 2022, 9, 1360–1369. [Google Scholar] [CrossRef]
- Bae, S.J.; Kim, K.; Yun, S.J.; Lee, S.H. Predictive performance of blood urea nitrogen to serum albumin ratio in elderly patients with gastrointestinal bleeding. Am. J. Emerg. Med. 2021, 41, 152–157. [Google Scholar] [CrossRef]
- Werion, A.; Belkhir, L.; Perrot, M.; Schmit, G.; Aydin, S.; Chen, Z.; Penaloza, A.; De Greef, J.; Yildiz, H.; Pothen, L.; et al. SARS-CoV-2 causes a specific dysfunction of the kidney proximal tubule. Kidney Int. 2020, 98, 1296–1307. [Google Scholar] [CrossRef]
- Harder, T.; Koch, J.; Vygen-Bonnet, S.; Külper-Schiek, W.; Pilic, A.; Reda, S.; Scholz, S.; Wichmann, O. Efficacy and effectiveness of COVID-19 vaccines against SARS-CoV-2 infection: Interim results of a living systematic review, 1 January to 14 May 2021. Eurosurveillance 2021, 26, 2100563. [Google Scholar] [CrossRef] [PubMed]
- Gómez, C.E.; Perdiguero, B.; Esteban, M. Emerging SARS-CoV-2 Variants and Impact in Global Vaccination Programs against SARS-CoV-2/COVID-19. Vaccines 2021, 9, 243. [Google Scholar] [CrossRef] [PubMed]
- Liberati, A.; Altman, D.G.; Tetzlaff, J.; Mulrow, C.; Gøtzsche, P.C.; Ioannidis, J.P.A.; Clarke, M.; Devereaux, P.J.; Kleijnen, J.; Moher, D. The PRISMA statement for reporting systematic reviews and meta-analyses of studies that evaluate healthcare interventions: Explanation and elaboration. BMJ 2009, 339, b2700. [Google Scholar] [CrossRef] [Green Version]
- McGowan, J.; Sampson, M.; Salzwedel, D.M.; Cogo, E.; Foerster, V.; Lefebvre, C. PRESS Peer Review of Electronic Search Strategies: 2015 Guideline Statement. J. Clin. Epidemiol. 2016, 75, 40–46. [Google Scholar] [CrossRef] [Green Version]
- Ouzzani, M.; Hammady, H.; Fedorowicz, Z.; Elmagarmid, A. Rayyan—A web and mobile app for systematic reviews. Syst. Rev. 2016, 5, 210. [Google Scholar] [CrossRef] [PubMed] [Green Version]
- Wells, G.A.; Shea, B.; O’Connell, D.; Peterson, J.; Welch, V.; Losos, M.; Tugwell, P. The Newcastle-Ottawa Scale (NOS) for Assessing the Quality of Nonrandomised Studies in Meta-Analyses. Available online: https://www.ohri.ca//programs/clinical_epidemiology/oxford.Asp (accessed on 7 July 2022).
- Begg, C.B.; Mazumdar, M. Operating characteristics of a rank correlation test for publication bias. Biometrics 1994, 50, 1088–1101. [Google Scholar] [CrossRef]
- Hozo, S.P.; Djulbegovic, B.; Hozo, I. Estimating the mean and variance from the median, range, and the size of a sample. BMC Med. Res. Methodol. 2005, 5, 13. [Google Scholar] [CrossRef] [Green Version]
- Chinn, S. A simple method for converting an odds ratio to effect size for use in meta-analysis. Stat. Med. 2000, 19, 3127–3131. [Google Scholar] [CrossRef]
- Shor, E.; Roelfs, D.; Vang, Z.M. The “Hispanic mortality paradox” revisited: Meta-analysis and meta-regression of life-course differentials in Latin American and Caribbean immigrants’ mortality. Soc. Sci. Med. 2017, 186, 20–33. [Google Scholar] [CrossRef] [PubMed]
- Gemcioglu, E.; Davutoglu, M.; Catalbas, R.; Karabuga, B.; Kaptan, E.; Aypak, A.; Kalem, A.K.; Özdemir, M.; Yeşilova, N.Y.; Kalkan, E.A.; et al. Predictive values of biochemical markers as early indicators for severe COVID-19 cases in admission. Future Virol. 2021, 16, 353–367. [Google Scholar] [CrossRef]
- Kuluöztürk, M.; Deveci, F.; Turgut, T.; Öner, Ö. The Glasgow Prognostic Score and fibrinogen to albumin ratio as prognostic factors in hospitalized patients with COVID-19. Expert Rev. Respir. Med. 2021, 15, 1061–1068. [Google Scholar] [CrossRef] [PubMed]
- Afşin, A.; Tibilli, H.; Hoşoğlu, Y.; Asoğlu, R.; Süsenbük, A.; Markirt, S.; Tuna, V.D. Fibrinogen-to-albumin ratio predicts mortality in COVID-19 patients admitted to the intensive care unit. Adv. Respir. Med. 2021, 89, 557–564. [Google Scholar] [CrossRef] [PubMed]
- Bi, X.; Su, Z.; Yan, H.; Du, J.; Wang, J.; Chen, L.; Peng, M.; Chen, S.; Shen, B.; Li, J. Prediction of severe illness due to COVID-19 based on an analysis of initial Fibrinogen to Albumin Ratio and Platelet count. Platelets 2020, 31, 674–679. [Google Scholar] [CrossRef] [PubMed]
- Atlas, A.; Altay, N.; Karahan, M.A.; Pehlivan, V.F.; Pehlivan, B.; Duran, E.; Erol, M.K. Neutrophil-to-lymphocyte and fibrinogen-to-albumin ratios may be indicators of worse outcomes in ICU patients with COVID-19. J. Surg. Med. 2021, 5, 623–627. [Google Scholar] [CrossRef]
- Küçükceran, K.; Ayranci, M.K.; Girişgin, A.S.; Koçak, S. Predictive value of D-dimer/albumin ratio and fibrinogen/albumin ratio for in-hospital mortality in patients with COVID-19. Int. J. Clin. Pract. 2021, 75, e14263. [Google Scholar] [CrossRef]
- Torun, A.; Çakirca, T.D.; Çakirca, G.; Portakal, R.D. The value of C-reactive protein/albumin, fibrinogen/albumin, and neutrophil/lymphocyte ratios in predicting the severity of COVID-19. Rev. Assoc. Médica Bras. 2021, 67, 431–436. [Google Scholar] [CrossRef] [PubMed]
- Çekiç, D.; Emir Arman, M.; Cihad Genç, A.; İşsever, K.; Yıldırım, İ.; Bilal Genç, A.; Dheir, H.; Yaylacı, S. Predictive role of FAR ratio in COVID-19 patients. Int. J. Clin. Pract. 2021, 75, e14931. [Google Scholar] [CrossRef]
- Yang, R.; Gui, X.; Ke, H.; Gao, S.; Luo, M.; Xiong, Y. The indicative role of markers for liver injury on the severity and prognosis of coronavirus disease 2019 patients. Eur. J. Gastroenterol. Hepatol. 2021, 33, e176–e182. [Google Scholar] [CrossRef]
- Acehan, S.; Gülen, M.; Işıkber, C.; Kaya, A.; Unlu, N.; İnce, Ç.; Toptaş Fırat, B.; Köksaldı Şahin, G.; Erdem Sümbül, H.; Satar, S. C-reactive protein to albumin ratio is associated with increased risk of mortality in COVID-19 pneumonia patients. Cukurova Med. J. 2021, 46, 1449–1458. [Google Scholar] [CrossRef]
- Mihic, D.; Maricic, L.; Loinjak, D. Prognostic significance inflammatory scoring systems in critically ill patients with COVID-19 infection. Med. Jadertina 2022, 52, 5–12. [Google Scholar]
- Huang, D.; Yang, H.; Yu, H.; Wang, T.; Chen, Z.; Liang, Z.; Yao, R. Blood Urea Nitrogen to Serum Albumin Ratio (BAR) Predicts Critical Illness in Patients with Coronavirus Disease 2019 (COVID-19). Int. J. Gen. Med. 2021, 14, 4711–4721. [Google Scholar] [CrossRef] [PubMed]
- Nie, S.; Zhao, X.; Zhao, K.; Zhang, Z.; Zhang, Z.; Zhang, Z. Metabolic disturbances and inflammatory dysfunction predict severity of coronavirus disease 2019 (COVID-19): A retrospective study. MedRxiv 2020. [Google Scholar] [CrossRef] [Green Version]
- Küçükceran, K.; Ayrancı, M.K.; Girişgin, A.S.; Koçak, S.; Dündar, Z.D. The role of the BUN/albumin ratio in predicting mortality in COVID-19 patients in the emergency department. Am. J. Emerg. Med. 2021, 48, 33–37. [Google Scholar] [CrossRef] [PubMed]
- Ata, F.; As, A.K.; Engin, M.; Kat, N.K.; Ata, Y.; Turk, T. Can blood urea Nitrogen-to-Albumin ratio predict mortality in patients with moderate-to-severe COVID-19 pneumonia hospitalized in the intensive care unit? Rev. Assoc. Médica Bras. 2021, 67, 1421–1426. [Google Scholar] [CrossRef] [PubMed]
- Singh, S.; Singh, K. Blood Urea Nitrogen/Albumin Ratio and Mortality Risk in Patients with COVID-19. Indian J. Crit. Care Med. 2022, 26, 626. [Google Scholar] [CrossRef]
- Alirezaei, T.; Hooshmand, S.; Irilouzadian, R.; Hajimoradi, B.; Montazeri, S.; Shayegh, A. The role of blood urea nitrogen to serum albumin ratio in the prediction of severity and 30-day mortality in patients with COVID-19. Health Sci. Rep. 2022, 5, e606. [Google Scholar] [CrossRef]
- Lawson, S.; Amadi, C. Potentials of Varied Inflammatory Indices in the Prediction of COVID-19 Severity among Nigerians. Adv. Biochem. 2022, 10, 18–24. [Google Scholar] [CrossRef]
- Çelik, Ç.O.; Çiftci, O.; Özer, N.; Müderrsioğlu, İ.H. Comparison of Inflammation-Based Parameters and MELD-XI Score with 4C Mortality Score in Predicting in-Hospital Mortality in COVID-19. Cukurova Med. J. 2022, 47, 629–637. [Google Scholar] [CrossRef]
- Yazıcı, M.M.; Altuntaş, G.; Aygün, A.; Nalbant, E. The Value of the C-Reactive Protein/Albumin and Fibrinogen/Albumin Ratios in Predicting Disease Severity and Mortality in Elderly COVID-19 Patients. Med. Sci. Discov. 2022, 9, 362–367. [Google Scholar] [CrossRef]
- Caliskan, Z.; Bozdag, E.; Sonmez, S.; Dagistanli, S.; Bulut, N.; Dincer, Y. Assessment of 7 Inflammatory Indexes as an Early Predictor of COVID-19 Severity. Cerrahpasa Med. J. 2022, XX, 1–8. [Google Scholar] [CrossRef]
- Wen, Y.; Yang, J.; Han, X. Fibrinogen-to-Albumin Ratio is Associated with All-Cause Mortality in Cancer Patients. Int. J. Gen. Med. 2021, 14, 4867–4875. [Google Scholar] [CrossRef] [PubMed]
- Wang, K.; Xu, W.; Zha, B.; Shi, J.; Wu, G.; Ding, H. Fibrinogen to Albumin Ratio as an Independent Risk Factor for Type 2 Diabetic Kidney Disease. Diabetes Metab. Syndr. Obes. Targets Ther. 2021, 14, 4557–4567. [Google Scholar] [CrossRef] [PubMed]
- Lee, L.E.; Pyo, J.Y.; Ahn, S.S.; Song, J.J.; Park, Y.B.; Lee, S.W. Fibrinogen to albumin ratio reflects the activity of antineutrophil cytoplasmic antibody-associated vasculitis. J. Clin. Lab. Anal. 2021, 35, e23731. [Google Scholar] [CrossRef]
- Amaro, E.; Moore-Lotridge, S.N.; Wessinger, B.; Benvenuti, M.A.; An, T.J.; Oelsner, W.K.; Polkowski, G.G.; Schoenecker, J.G. Albumin and the fibrinogen-to-albumin ratio: Biomarkers for the acute phase response following total knee arthroplasty. PLoS ONE 2021, 16, e0247070. [Google Scholar] [CrossRef]
- Zhao, D.; Liu, Y.; Chen, S.; Xu, Z.; Yang, X.; Shen, H.; Zhang, S.; Li, Y.; Zhang, H.; Zou, C.; et al. Predictive Value of Blood Urea Nitrogen to Albumin Ratio in Long-Term Mortality in Intensive Care Unit Patients with Acute Myocardial Infarction: A Propensity Score Matching Analysis. Int. J. Gen. Med. 2022, 15, 2247–2259. [Google Scholar] [CrossRef]
- Dundar, Z.D.; Kucukceran, K.; Ayranci, M.K. Blood urea nitrogen to albumin ratio is a predictor of in-hospital mortality in older emergency department patients. Am. J. Emerg. Med. 2021, 46, 349–354. [Google Scholar] [CrossRef]
- Fang, J.; Xu, B. Blood Urea Nitrogen to Serum Albumin Ratio Independently Predicts Mortality in Critically Ill Patients with Acute Pulmonary Embolism. Clin. Appl. Thromb./Hemost. 2021, 27. [Google Scholar] [CrossRef]
- Zou, X.L.; Feng, D.Y.; Wu, W.B.; Yang, H.L.; Zhang, T.T. Blood urea nitrogen to serum albumin ratio independently predicts 30-day mortality and severity in patients with Escherichia coli bacteraemia. Med. Clin. 2021, 157, 219–225. [Google Scholar] [CrossRef]
- Luo, B.; Sun, M.; Huo, X.; Wang, Y. Two new inflammatory markers related to the CURB-65 score for disease severity in patients with community-acquired pneumonia: The hypersensitive C-reactive protein to albumin ratio and fibrinogen to albumin ratio. Open Life Sci. 2021, 16, 84–91. [Google Scholar] [CrossRef]
- Choudhary, S.; Sharma, K.; Silakari, O. The interplay between inflammatory pathways and COVID-19: A critical review on pathogenesis and therapeutic options. Microb. Pathog. 2021, 150, 104673. [Google Scholar] [CrossRef]
- Alzaid, F.; Julla, J.; Diedisheim, M.; Potier, C.; Potier, L.; Velho, G.; Gaborit, B.; Manivet, P.; Germain, S.; Vidal-Trecan, T.; et al. Monocytopenia, Monocyte Morphological Anomalies and Hyperinflammation Characterise Severe COVID-19 in Type 2 Diabetes. EMBO Mol. Med. 2020, 12, e13038. [Google Scholar] [CrossRef]
- Zaid, Y.; Puhm, F.; Allaeys, I.; Naya, A.; Oudghiri, M.; Khalki, L.; Limami, Y.; Zaid, N.; Sadki, K.; ben El Haj, R.; et al. Platelets Can Associate with SARS-Cov-2 RNA and Are Hyperactivated in COVID-19. Circ. Res. 2020, 127, 1404–1418. [Google Scholar] [CrossRef]
- Tan, L.; Wang, Q.; Zhang, D.; Ding, J.; Huang, Q.; Tang, Y.Q.; Wang, Q.; Miao, H. Lymphopenia Predicts Disease Severity of COVID-19: A Descriptive and Predictive Study. Signal Transduct. Target Ther. 2020, 5, 33. [Google Scholar] [CrossRef]
- Bomhof, G.; Mutsaers, P.G.N.J.; Leebeek, F.W.G.; te Boekhorst, P.A.W.; Hofland, J.; Croles, F.N.; Jansen, A.J.G. COVID-19-Associated Immune Thrombocytopenia. Br. J. Haematol. 2020, 190, e61–e64. [Google Scholar] [CrossRef]
- Lucijanić, M.; Stojić, J.; Atić, A.; Čikara, T.; Osmani, B.; Barišić-Jaman, M.; Andrilović, A.; Bistrović, P.; Zrilić Vrkljan, A.; Lagančić, M.; et al. Clinical and prognostic significance of C-reactive protein to albumin ratio in hospitalized coronavirus disease 2019 (COVID-19) patients. Wien. Klin. Wochenschr. 2022, 134, 377–384. [Google Scholar] [CrossRef]
- Koval, D.; Pertseva, T.; Konopkina, L.; Bielosludtseva, K.; Krykhtina, M. Lymphocyte-to-monocyte ratio (LMR) as a predictor of COVID-19 pneumonia progression. Eur. Respir. J. 2021, 58, PA651. [Google Scholar] [CrossRef]
- Ulloque-Badaracco, J.R.; Mosquera-Rojas, M.D.; Hernandez-Bustamante, E.A.; Alarcón-Braga, E.A.; Herrera-Añazco, P.; Benites-Zapata, V.A. Prognostic value of albumin-to-globulin ratio in COVID-19 patients: A systematic review and meta-analysis. Heliyon 2022, 8, e09457. [Google Scholar] [CrossRef]
- Hayıroğlu, M.İ.; Çınar, T.; Tekkeşin, A.İ. Fibrinogen and D-dimer variances and anticoagulation recommendations in COVID-19: Current literature review. Rev. Assoc. Médica Bras. 2020, 66, 842–848. [Google Scholar] [CrossRef]
- Levi, M.; Toh, C.H.; Thachil, J.; Watson, H.G. Guidelines for the diagnosis and management of disseminated intravascular coagulation. Br. J. Haematol. 2009, 145, 24–33. [Google Scholar] [CrossRef]
- Han, H.; Yang, L.; Liu, R.; Liu, F.; Wu, K.-L.; Li, J.; Liu, X.-H.; Zhu, C.-L. Prominent changes in blood coagulation of patients with SARS-CoV-2 infection. Clin. Chem. Lab. Med. 2020, 58, 1116–1120. [Google Scholar] [CrossRef] [Green Version]
- Di Micco, P.; Russo, V.; Carannante, N.; Imparato, M.; Cardillo, G.; Lodigiani, C. Prognostic Value of Fibrinogen among COVID-19 Patients Admitted to an Emergency Department: An Italian Cohort Study. J. Clin. Med. 2020, 9, 4134. [Google Scholar] [CrossRef] [PubMed]
- Long, W.; Yang, J.; Li, Z.; Li, J.; Chen, S.; Chen, D.; Wang, S.; Li, Q.; Hu, D.; Huang, J.; et al. Abnormal Fibrinogen Level as a Prognostic Indicator in Coronavirus Disease Patients: A Retrospective Cohort Study. Front. Med. 2021, 8, 892. [Google Scholar] [CrossRef] [PubMed]
- Rabbani, G.; Ahn, S.N. Review: Roles of human serum albumin in prediction, diagnoses and treatment of COVID-19. Int. J. Biol. Macromol. 2021, 193, 948–955. [Google Scholar] [CrossRef] [PubMed]
- Paliogiannis, P.; Mangoni, A.A.; Cangemi, M.; Fois, A.G.; Carru, C.; Zinellu, A. Serum albumin concentrations are associated with disease severity and outcomes in coronavirus 19 disease (COVID-19): A systematic review and meta-analysis. Clin. Exp. Med. 2021, 21, 343–354. [Google Scholar] [CrossRef] [PubMed]
- Raina, R.; Mahajan, Z.A.; Vasistha, P.; Chakraborty, R.; Mukunda, K.; Tibrewal, A.; Neyra, J.A. Incidence and Outcomes of Acute Kidney Injury in COVID-19: A Systematic Review. Blood Purif. 2022, 51, 199–212. [Google Scholar] [CrossRef]
- Prowle, J.R.; Echeverri, J.E.; Ligabo, E.V.; Ronco, C.; Bellomo, R. Fluid balance and acute kidney injury. Nat. Rev. Nephrol. 2010, 6, 107–115. [Google Scholar] [CrossRef]
- Ronco, C.; Reis, T.; Husain-Syed, F. Management of acute kidney injury in patients with COVID-19. Lancet Respir. Med. 2020, 8, 738–742. [Google Scholar] [CrossRef]
- Abdallah, E.; Helal, B.A.; Asad, R.; Hemida, M.; Nawar, E.; Kamal, M.; Reda, M.; Baharia, A.; Galal, A.; Hassan, A.; et al. Incidence and outcomes of acute kidney injury in critically ill patients with coronavirus disease 2019. Saudi J. Kidney Dis. Transplant. 2021, 32, 84–91. [Google Scholar] [CrossRef]
- Van Der Slikke, E.C.; Star, B.S.; De Jager, V.D.; Leferink, M.B.M.; Klein, L.M.; Quinten, V.M.; Olgers, T.J.; Ter Maaten, J.C.; Bouma, H.R. A high urea-to-creatinine ratio predicts long-term mortality independent of acute kidney injury among patients hospitalized with an infection. Sci. Rep. 2020, 10, 15649. [Google Scholar] [CrossRef]
- Khatua, C.R.; Sahu, S.K.; Meher, D.; Nath, G.; Mohapatra, A.; Thakur, B.; Singh, S.P. Admission Serum Urea is a Better Predictor of Mortality than Creatinine in Patients with Acute-On-Chronic Liver Failure and Acute Kidney Injury. J. Clin. Exp. Hepatol. 2021, 11, 565–572. [Google Scholar] [CrossRef]
- Herrera-Añazco, P.; Taype-Rondan, A.; Pacheco-Mendoza, J.; Miranda, J.J. Factors associated with mortality in a population with acute kidney injury undergoing hemodialysis in Peru. J. Bras. Nefrol. 2017, 39, 119–125. [Google Scholar] [CrossRef]
- Macedo, E.; Bouchard, J.; Soroko, S.H.; Chertow, G.M.; Himmelfarb, J.; Ikizker, T.A.; Paganini, E.P.; Mehta, R.L. Fluid accumulation, recognition and staging of acute kidney injury in critically-ill patients. Crit. Care 2010, 14, R82. [Google Scholar] [CrossRef] [PubMed] [Green Version]
- Besen, B.A.M.P. Fluid and electrolyte overload in critically ill patients: An overview. World J. Crit. Care Med. 2015, 4, 116. [Google Scholar] [CrossRef] [PubMed]
- Kumar, S.; Thambiraja, T.S.; Karuppanan, K.; Subramaniam, G. Omicron and Delta variant of SARS-CoV-2: A comparative computational study of spike protein. J. Med. Virol. 2022, 94, 1641–1649. [Google Scholar] [CrossRef]
- Zhang, X.; Song, Y.; Tang, S.; Xue, H.; Chen, W.; Qin, L.; Jia, S.; Shen, Y.; Zhao, S.; Zhu, H.; et al. Models to assess imported cases on the rebound of COVID-19 and design a long-term border control strategy in Heilongjiang Province, China. Math. Biosci. Eng. 2022, 19, 1–33. [Google Scholar] [CrossRef] [PubMed]
- Smilowitz, N.R.; Nguy, V.; Aphinyanaphongs, Y.; Newman, J.D.; Xia, Y.; Reynolds, H.R.; Hochman, J.S.; Fishman, G.I.; Berger, J.S. Multiple Biomarker Approach to Risk Stratification in COVID-19. Circulation 2021, 143, 1338–1340. [Google Scholar] [CrossRef]
- Bivona, G.; Agnello, L.; Ciaccio, M. Biomarkers for Prognosis and Treatment Response in COVID-19 Patients. Ann. Lab. Med. 2021, 41, 540. [Google Scholar] [CrossRef]


| Author | Year | Country | Participants (Male) | Median/Mean Age (IQR/SD) | Marker Analyzed | Marker Mean (SD) in Severe Patients | Marker Mean (SD) in Non-Severe Patients | Odds Ratio [95% CI] | Cut-Off | Area under the Curve | Sensivity (%) | Specificity (%) |
|---|---|---|---|---|---|---|---|---|---|---|---|---|
| Gemcioglu et al. | 2021 | Turkey | 301 (161) | 49 (26.5) | FAR | NR | NR | 1 [0.53–1.88] | 0.102 | 0.766 | 65.31% | 77.91% |
| BAR | NR | NR | 2.18 [1.15–4.15] | 4.78 | 0.795 | 63.37% | 84.89% | |||||
| Kuluöztürk et al. | 2021 | Turkey | 400 (235) | 55.51 (18.88) | FAR | NR | NR | 2.76 [1.31–5.79] | 0.144 | 0.654 | 72% | 53% |
| Bi et al. | 2020 | China | 113 (64) | 46 (37–55) | FAR | NR | NR | 5.81 [1.28–26.34] | 0.088 | 0.73 | NR | NR |
| Torun et al. | 2021 | Turkey | 188 (95) | 62.3 (12.7) | FAR | 0.14 (0.17) | 0.12 (0.18) | 1.18 [0.70–1.99] | 0.113 | 0.737 | 69.6% | 65.8% |
| Yang et al. | 2021 | China | 495 (235) | 55 (40–67) | FAR | 0.134 (0.04) | 0.104 (0.034) | 4.41 [3.13–6.22] | 0.12 | 0.838 | 80.8% | 64% |
| Lawson et al. | 2022 | Nigeria | 600 (374) | 42.2 (6.71) | FAR | NR | NR | 1.19 [0.73–1.94] | NR | NR | NR | NR |
| Huang et al. | 2021 | China | 1370 (328) | 55 (40–66) | BAR | NR | NR | 1.32 [1.18–1.47] | 3.788 | 0.821 | 68% | 78.6% |
| Nie et al. | 2020 | China | 97 (34) | 39 (30–60) | BAR | 1 (0.44) | 1.02 (0.22) | 0.79 [0.49–1.28] | NR | NR | NR | NR |
| Alirezaei et al. | 2022 | Iran | 433 (263) | 60.38 (18.26) | BAR | 4.15 (2.81) | 4.32 (2.74) | 0.90 [0.59–1.36] | 3.954 | 0.475 | 47.5% | 40.6% |
| Yazıcı et al. | 2022 | Turkey | 252 (107) | 77 (70–83) | FAR | 0.185 (0.04) | 0.131 (0.04) | 9.43 [4.83–18.43] | 0.15 | 0.789 | 84.2% | 69.6% |
| Çalışkan et al. | 2022 | Turkey | 548 (286) | 64 (21) | FAR | 13.65 (7.88) | 11.7 (4.39) | 1.95 [1.34–2.86] | 0.147 | 0.629 | 83.23% | 45.31% |
| Author | Year | Country | Participants (Male) | Median/Mean Age (IQR/SD) | Marker Analyzed | Marker Mean (SD) in Non-Survivors | Marker Mean (SD) in Survivors | Odds Ratio [95% CI] | Cut-Off | Area under the Curve | Sensivity (%) | Specificity (%) |
|---|---|---|---|---|---|---|---|---|---|---|---|---|
| Kuluöztürk et al. | 2021 | Turkey | 400 (235) | 55.51 (18.88) | FAR | NR | NR | 3.06 [1.33–7.07] | 0.144 | 0.654 | 72% | 53% |
| Afşin et al. | 2021 | Turkey | 386 (209) | 71.28 (12.9) | FAR | NR | NR | 1 [1–1.01] | NR | NR | NR | NR |
| Atlas et al. | 2021 | Turkey | 102 (74) | 69.1 (14.3) | FAR | 0.202 (0.037) | 0.13 (0.014) | 50.79 [18.77–137.44] | 0.15 | 0.989 | NR | NR |
| Küçükceran et al. [38] | 2021 | Turkey | 717 (371) | 64 (50–74) | FAR | NR | NR | 4.44 [2.91–6.76] | 0.1123 | 0.703 | 71.4% | 64% |
| Küçükceran et al. [46] | 2021 | Turkey | 602 (312) | 63 (49–73) | BAR | NR | NR | 10.45 [5.56–19.63] | 3.9 | 0.809 | 87.5% | 59.9% |
| Çekiç et al. | 2021 | Turkey | 590 (358) | 65.63 (14.9) | FAR | 0.14 (0.17) | 0.12 (0.18) | 1.63 [1.20–2.22] | 0.13 | 0.808 | 74.9% | 74.6% |
| Yang et al. | 2021 | China | 495 (235) | 55 (40–67) | FAR | NR | NR | 3.29 [1.55–7.01] | 0.12 | 0.838 | 80.8% | 64% |
| Acehan et al. | 2021 | Turkey | 613 (358) | 59.04 (19.5) | FAR | NR | NR | 1.01 [0.96–1.06] | 0.111 | 0.668 | 62.3% | 57.5% |
| Ata et al. | 2021 | Turkey | 358 (148) | 66 (50.5–77) | BAR | NR | NR | 2.69 [2.02–3.59] | 3.4 | 0.823 | 74.5% | 75.6% |
| Singh et al. | 2022 | India | 131 (98) | 54 (14) | BAR | NR | NR | 3.75 [1.66–8.47] | 6.23 | 0.695 | 79% | 54% |
| Mihić et al. | 2022 | Croatia | 138 (NR) | 68 (38–88) | FAR | NR | NR | 1.30 [0.61–2.76] | NR | NR | NR | NR |
| Alirezaei et al. | 2022 | Iran | 433 (263) | 60.38 (18.26) | BAR | 9.27 (7.03) | 3.8 (2.07) | 11.31 [7.46–17.14] | 4.944 | 0.758 | 75.8% | 70.8% |
| Yazıcı et al. | 2022 | Turkey | 252 (107) | 77 (70–83) | FAR | 0.173 (0.05) | 0.128 (0.03) | 6.69 [3.96–11.31] | 0.144 | 0.731 | 75% | 69% |
| Olgun et al. | 2022 | Turkey | 117 (74) | 62.65 (15.89) | BAR | 12.76 (35.45) | 4.76 (35.59) | 1.49 [0.58–3.82] | NR | NR | NR | NR |
Publisher’s Note: MDPI stays neutral with regard to jurisdictional claims in published maps and institutional affiliations. |
© 2022 by the authors. Licensee MDPI, Basel, Switzerland. This article is an open access article distributed under the terms and conditions of the Creative Commons Attribution (CC BY) license (https://creativecommons.org/licenses/by/4.0/).
Share and Cite
Ulloque-Badaracco, J.R.; Alarcon-Braga, E.A.; Hernandez-Bustamante, E.A.; Al-kassab-Córdova, A.; Mosquera-Rojas, M.D.; Ulloque-Badaracco, R.R.; Huayta-Cortez, M.A.; Maita-Arauco, S.H.; Herrera-Añazco, P.; Benites-Zapata, V.A. Fibrinogen-to-Albumin Ratio and Blood Urea Nitrogen-to-Albumin Ratio in COVID-19 Patients: A Systematic Review and Meta-Analysis. Trop. Med. Infect. Dis. 2022, 7, 150. https://doi.org/10.3390/tropicalmed7080150
Ulloque-Badaracco JR, Alarcon-Braga EA, Hernandez-Bustamante EA, Al-kassab-Córdova A, Mosquera-Rojas MD, Ulloque-Badaracco RR, Huayta-Cortez MA, Maita-Arauco SH, Herrera-Añazco P, Benites-Zapata VA. Fibrinogen-to-Albumin Ratio and Blood Urea Nitrogen-to-Albumin Ratio in COVID-19 Patients: A Systematic Review and Meta-Analysis. Tropical Medicine and Infectious Disease. 2022; 7(8):150. https://doi.org/10.3390/tropicalmed7080150
Chicago/Turabian StyleUlloque-Badaracco, Juan R., Esteban A. Alarcon-Braga, Enrique A. Hernandez-Bustamante, Ali Al-kassab-Córdova, Melany D. Mosquera-Rojas, Ricardo R. Ulloque-Badaracco, Miguel A. Huayta-Cortez, Sherelym H. Maita-Arauco, Percy Herrera-Añazco, and Vicente A. Benites-Zapata. 2022. "Fibrinogen-to-Albumin Ratio and Blood Urea Nitrogen-to-Albumin Ratio in COVID-19 Patients: A Systematic Review and Meta-Analysis" Tropical Medicine and Infectious Disease 7, no. 8: 150. https://doi.org/10.3390/tropicalmed7080150