Article

Urban Stormwater Quality in Arequipa, Southern Peru: An Initial Assessment

by
Gisella Martínez
1,
Pablo A. García-Chevesich
2,3,*,
Madeleine Guillen
1,
Teresa Tejada-Purizcana
4,
Kattia Martinez
5,
Sergio Ticona
1,
Héctor M. Novoa
6,
Jorge Crespo
7,8,
Elizabeth A. Holley
7 and
John E. McCray
9
1
Facultad de Geología, Geofísica y Minas, Universidad Nacional de San Agustín de Arequipa, Arequipa 04001, Peru
2
Department of Civil and Environmental Engineering, Colorado School of Mines, Golden, CO 80401, USA
3
Intergubernamental Hydrological Programme, United Nations Educational, Scientific, and Cultural Organization (UNESCO), Montevideo 11200, Uruguay
4
Facultad de Ingeniería de Procesos, Universidad Nacional de San Agustín de Arequipa, Arequipa 04001, Peru
5
Facultad de Ciencias Naturales y Formales, Universidad Nacional de San Agustín de Arequipa, Arequipa 04001, Peru
6
Facultad de Ingeniería Civil, Universidad Nacional de San Agustín de Arequipa, Arequipa 04001, Peru
7
Department of Mining Engineering, Colorado School of Mines, Golden, CO 80401, USA
8
Nevada Bureau of Mining and Geology, University of Nevada Reno, Reno, NV 89509, USA
9
Department of Civil and Environmental Engineering, Hydrologic Science and Engineering Program, Colorado School of Mines, Golden, CO 80401, USA
*
Author to whom correspondence should be addressed.
Water 2024, 16(1), 108; https://doi.org/10.3390/w16010108
Submission received: 20 November 2023 / Revised: 12 December 2023 / Accepted: 20 December 2023 / Published: 27 December 2023

Abstract

:
Urban stormwater quality has been sampled and chemically analyzed in the city of Arequipa, southern Peru. Stormwater samples generated from a 0.04 km2 drainage area in a downtown location were collected during two rainy seasons (2022 and 2023), including both first flush and peak flow for each storm event, analyzing physical and chemical (metals) variables. Results were compared with Peruvian agricultural irrigation standards, identifying also temporal changes and statistical correlations. Several metals (B, Cu, Fe, Mn, and Zn) were detected at concentrations above Peruvian MPLs, with B being the analyte that violated the norm more often. Most pollution occurred at the beginning of each rainy season and during the first flush stages. All vehicle-related contaminants were well correlated except for Pb and Se, which were assumed to have a different source of origin. We recommend that further investigations should focus on the effects of urban stormwater on downstream ecosystems in Peru. Similarly, we strongly recommend the creation of new regulations that ensure proper stormwater quality released from urban areas of this country, as well as preventive/treatment practices to minimize the pollution of downstream aquatic ecosystems and ensure healthy water to irrigate crops located downstream from cities.

1. Introduction

Most of the world’s population lives in cities [1] and despite its advantages, there are a number of adverse environmental effects generated from urban areas such as extreme heat [2], noise [3], and air or water pollution (e.g., [4]). This paper focuses on stormwater pollution, a growing global concern (e.g., [5]).
Countless authors around the world have reported the presence of dangerous contaminants in urban stormwater [6,7,8,9]. While treatment technologies are currently being developed in some areas of the world (e.g., [10,11,12]), many countries have not significantly advanced in this important ecological topic. Even in more technologically advanced countries, treating stormwater by means other than detention ponds or swales is rare.
The Clean Water Act in the United States serves as an example to be followed by other nations in terms of how to regulate and control urban stormwater pollution [13]. However, urban stormwater-related environmental laws in Peru are currently weak and not focused on pollutants but rather on flood control; the Peruvian Urban Stormwater Drainage Technical Norm CE.040 (the only legal instrument related to this topic in the country) ensures the stability of stormwater flows, ignoring any aspect related to water quality. In fact, urban stormwater-related research in this Latin American country had mostly covered topics related to hydraulics and evacuation systems (e.g., [14,15,16,17,18]). Moreover, though some authors in Peru have focused their research on rainwater quality [19,20,21,22] or simply the design of rainwater-harvesting systems for different uses (e.g., [23,24,25]), not a single study has evaluated the quality of urban stormwater; only Guerra [26] studied heavy-metal contents in stormwater generated in rice crop fields in the Department of San Martin, northern Peru. Past environmental quality studies developed in Arequipa had focused mostly on the measurement of air pollution variables such as carbon monoxide, sulfur dioxide, ozone, and nitrogen dioxide, which are all below the MPLs (maximum permissible limits), while particulate matter has exceeded Peruvian environmental quality standards [27].
In this investigation, we sampled and characterized urban stormwater in Arequipa (southern Peru), in what is to the best of our knowledge the first scientific publication of data on Peruvian urban stormwater geochemistry. The data provide an evaluation of the occurrence of metal pollutants, and a scientific assessment to justify the clear need for treatment and stronger environmental regulations in the country. Such regulation is needed to minimize pollutants being released to the environment through rivers located downstream from cities. Metal pollutants were chosen as the study focus because they represent a wide range of urban contaminant sources, including traffic, construction, and industry.

2. Material and Methods
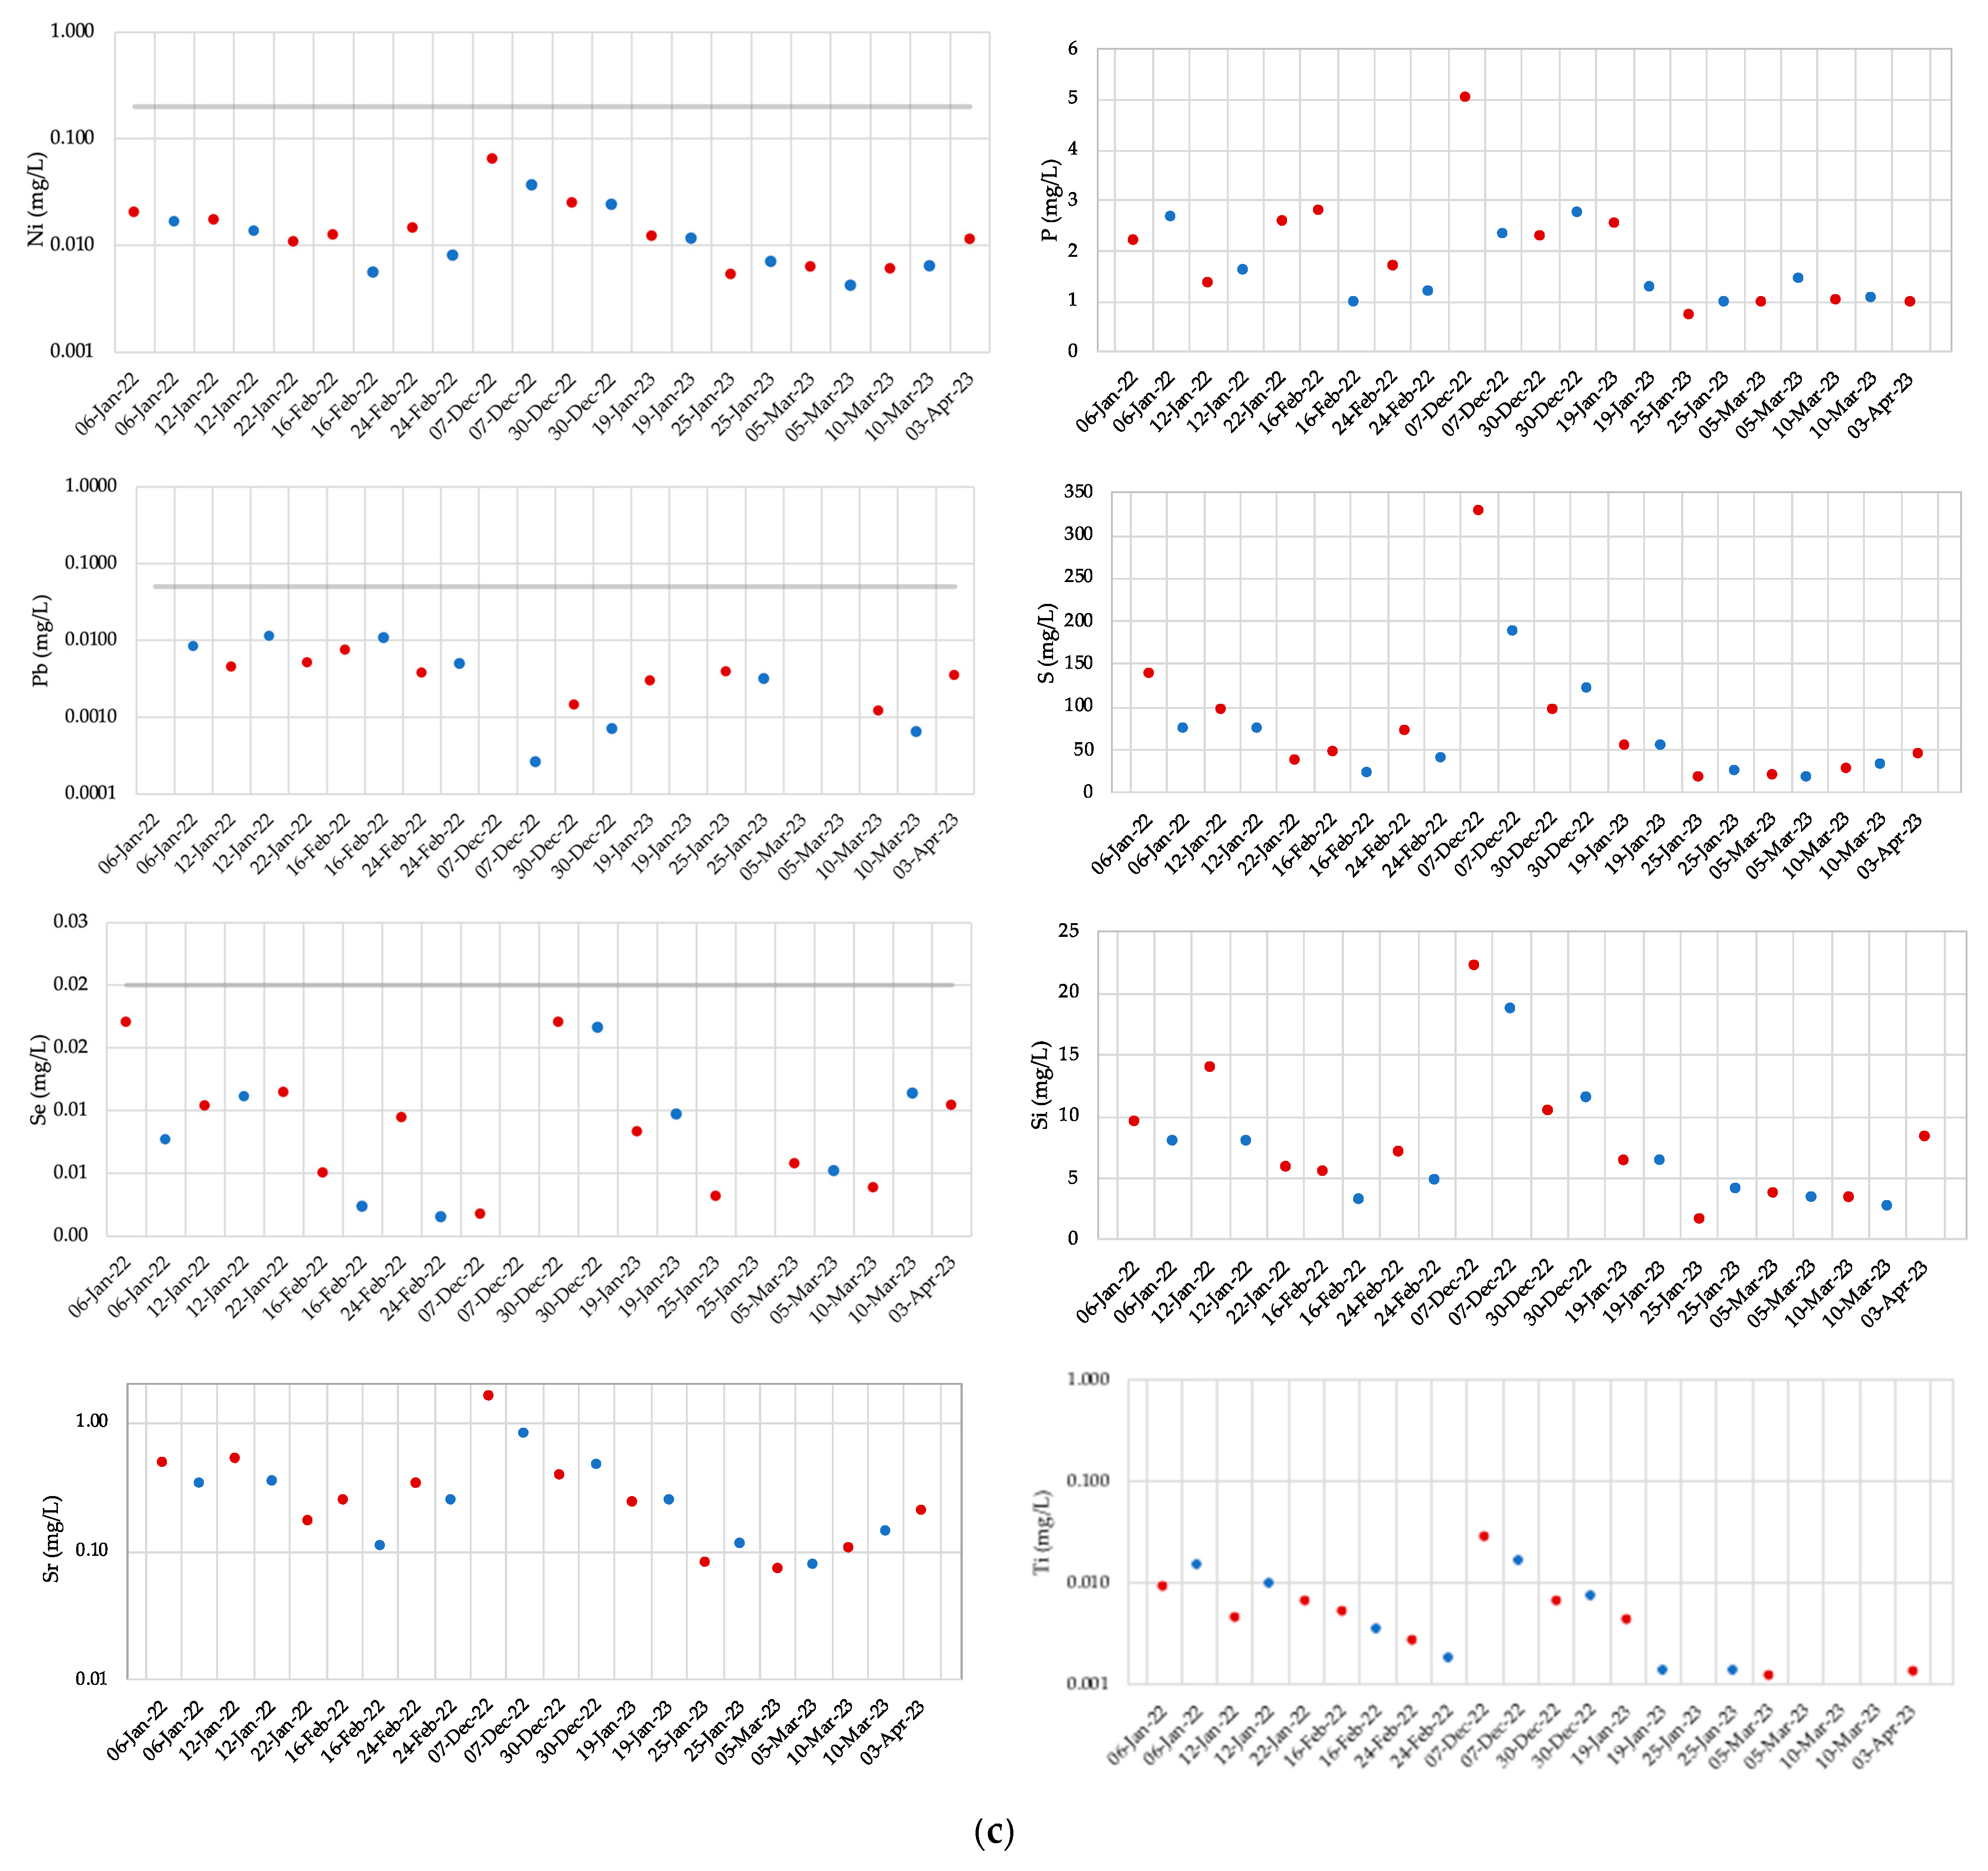
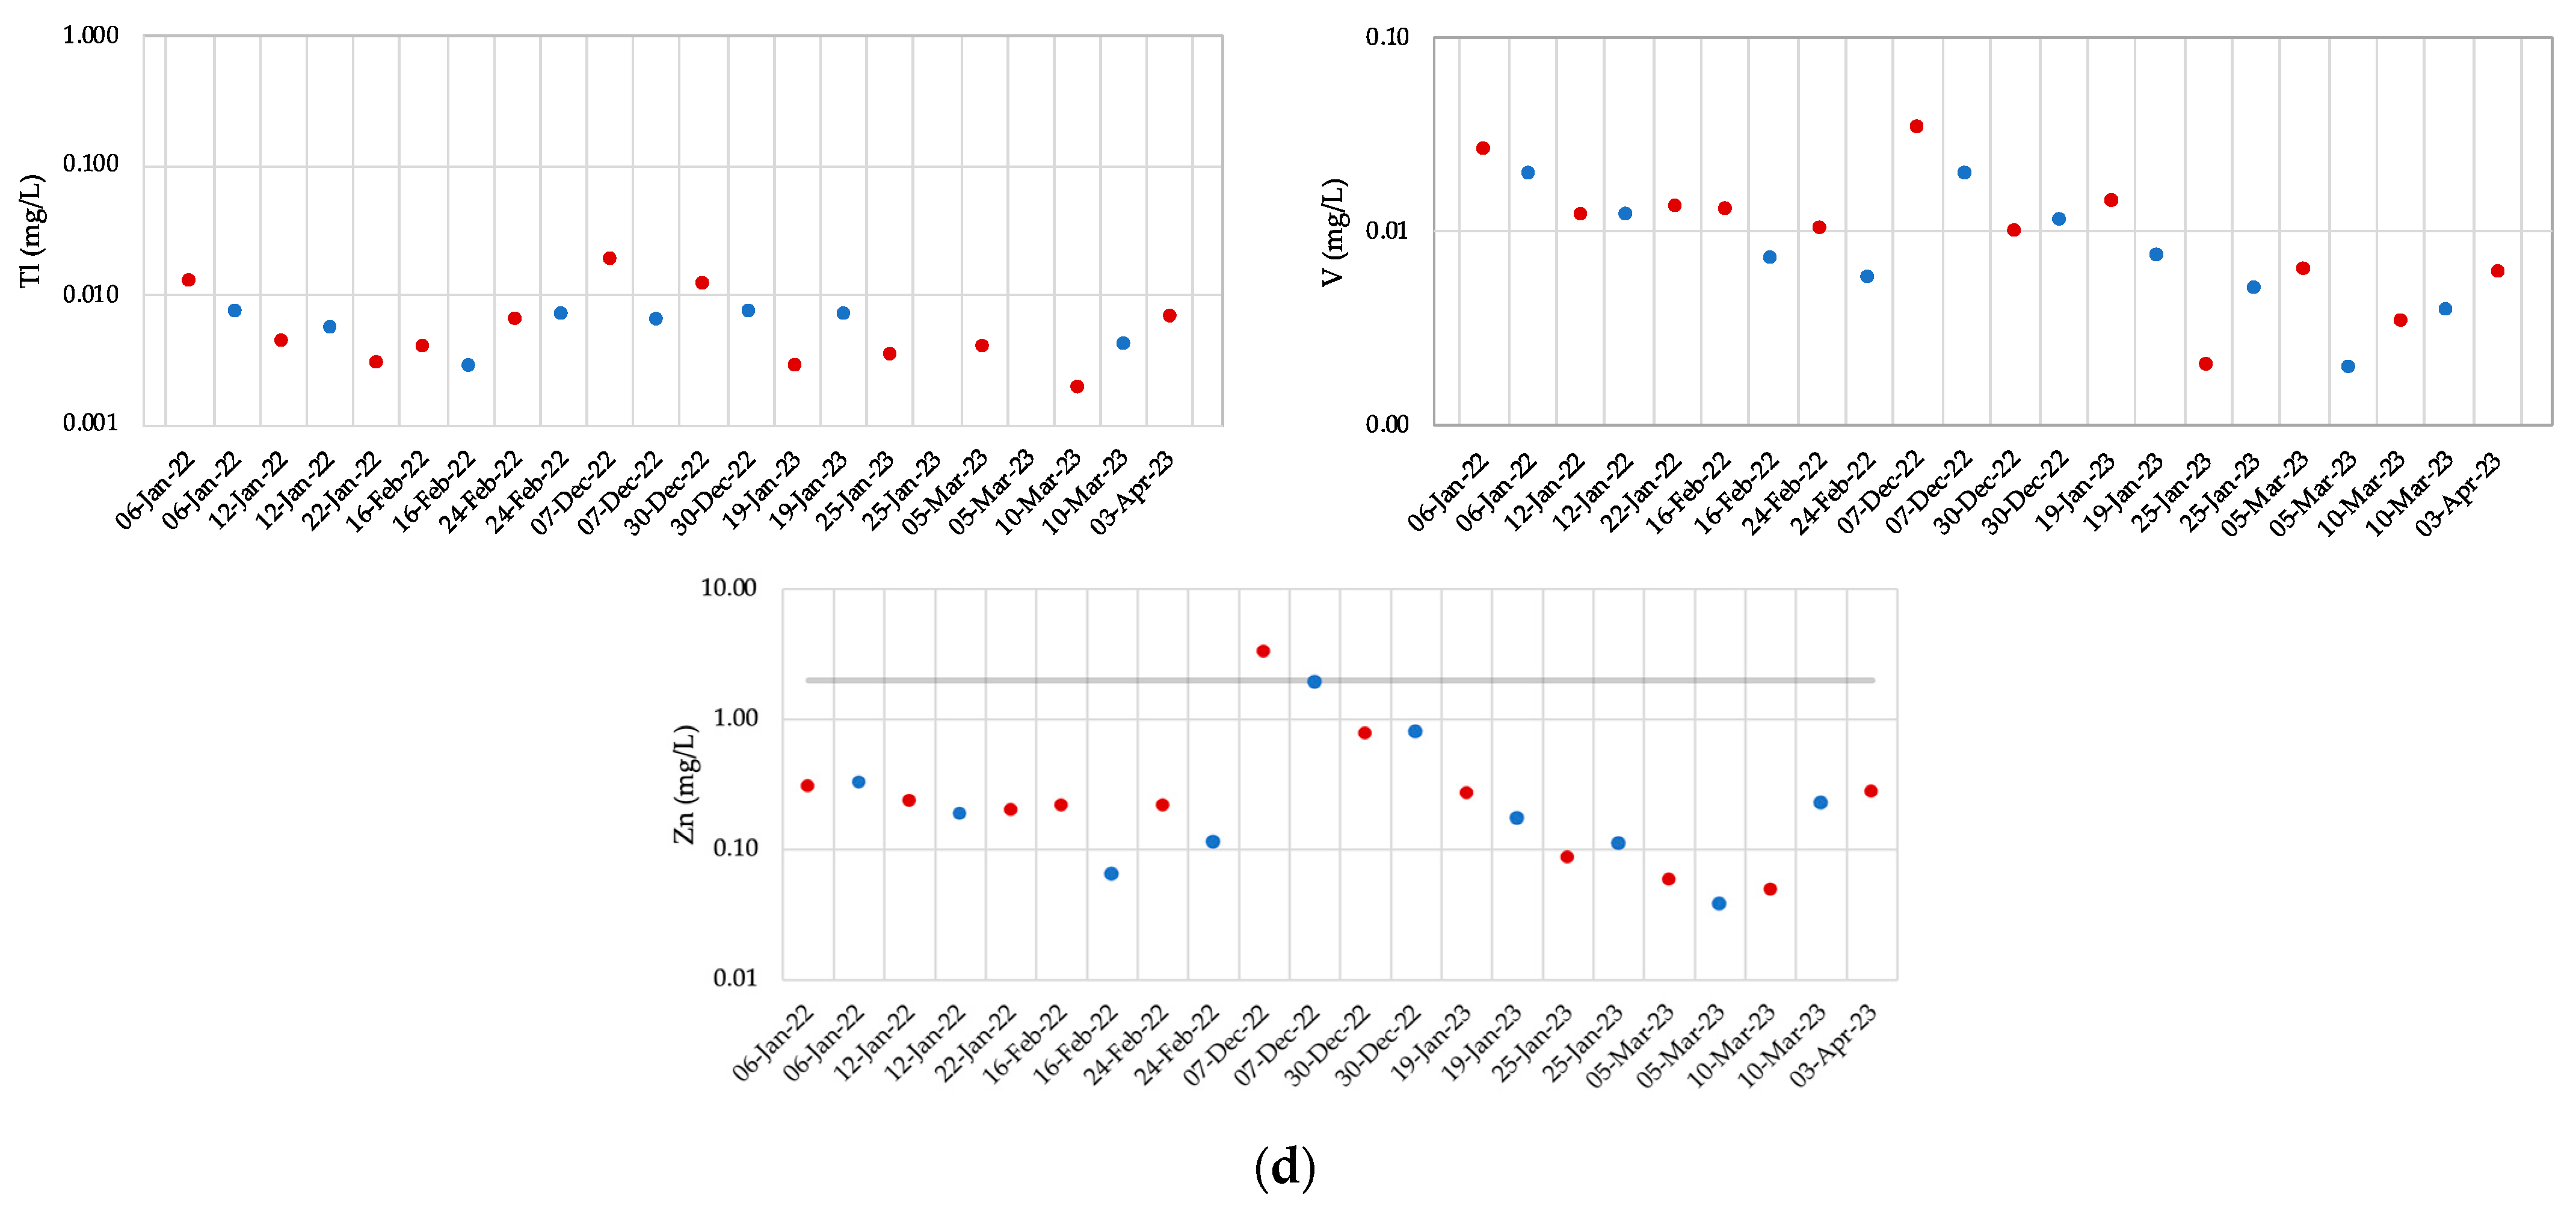
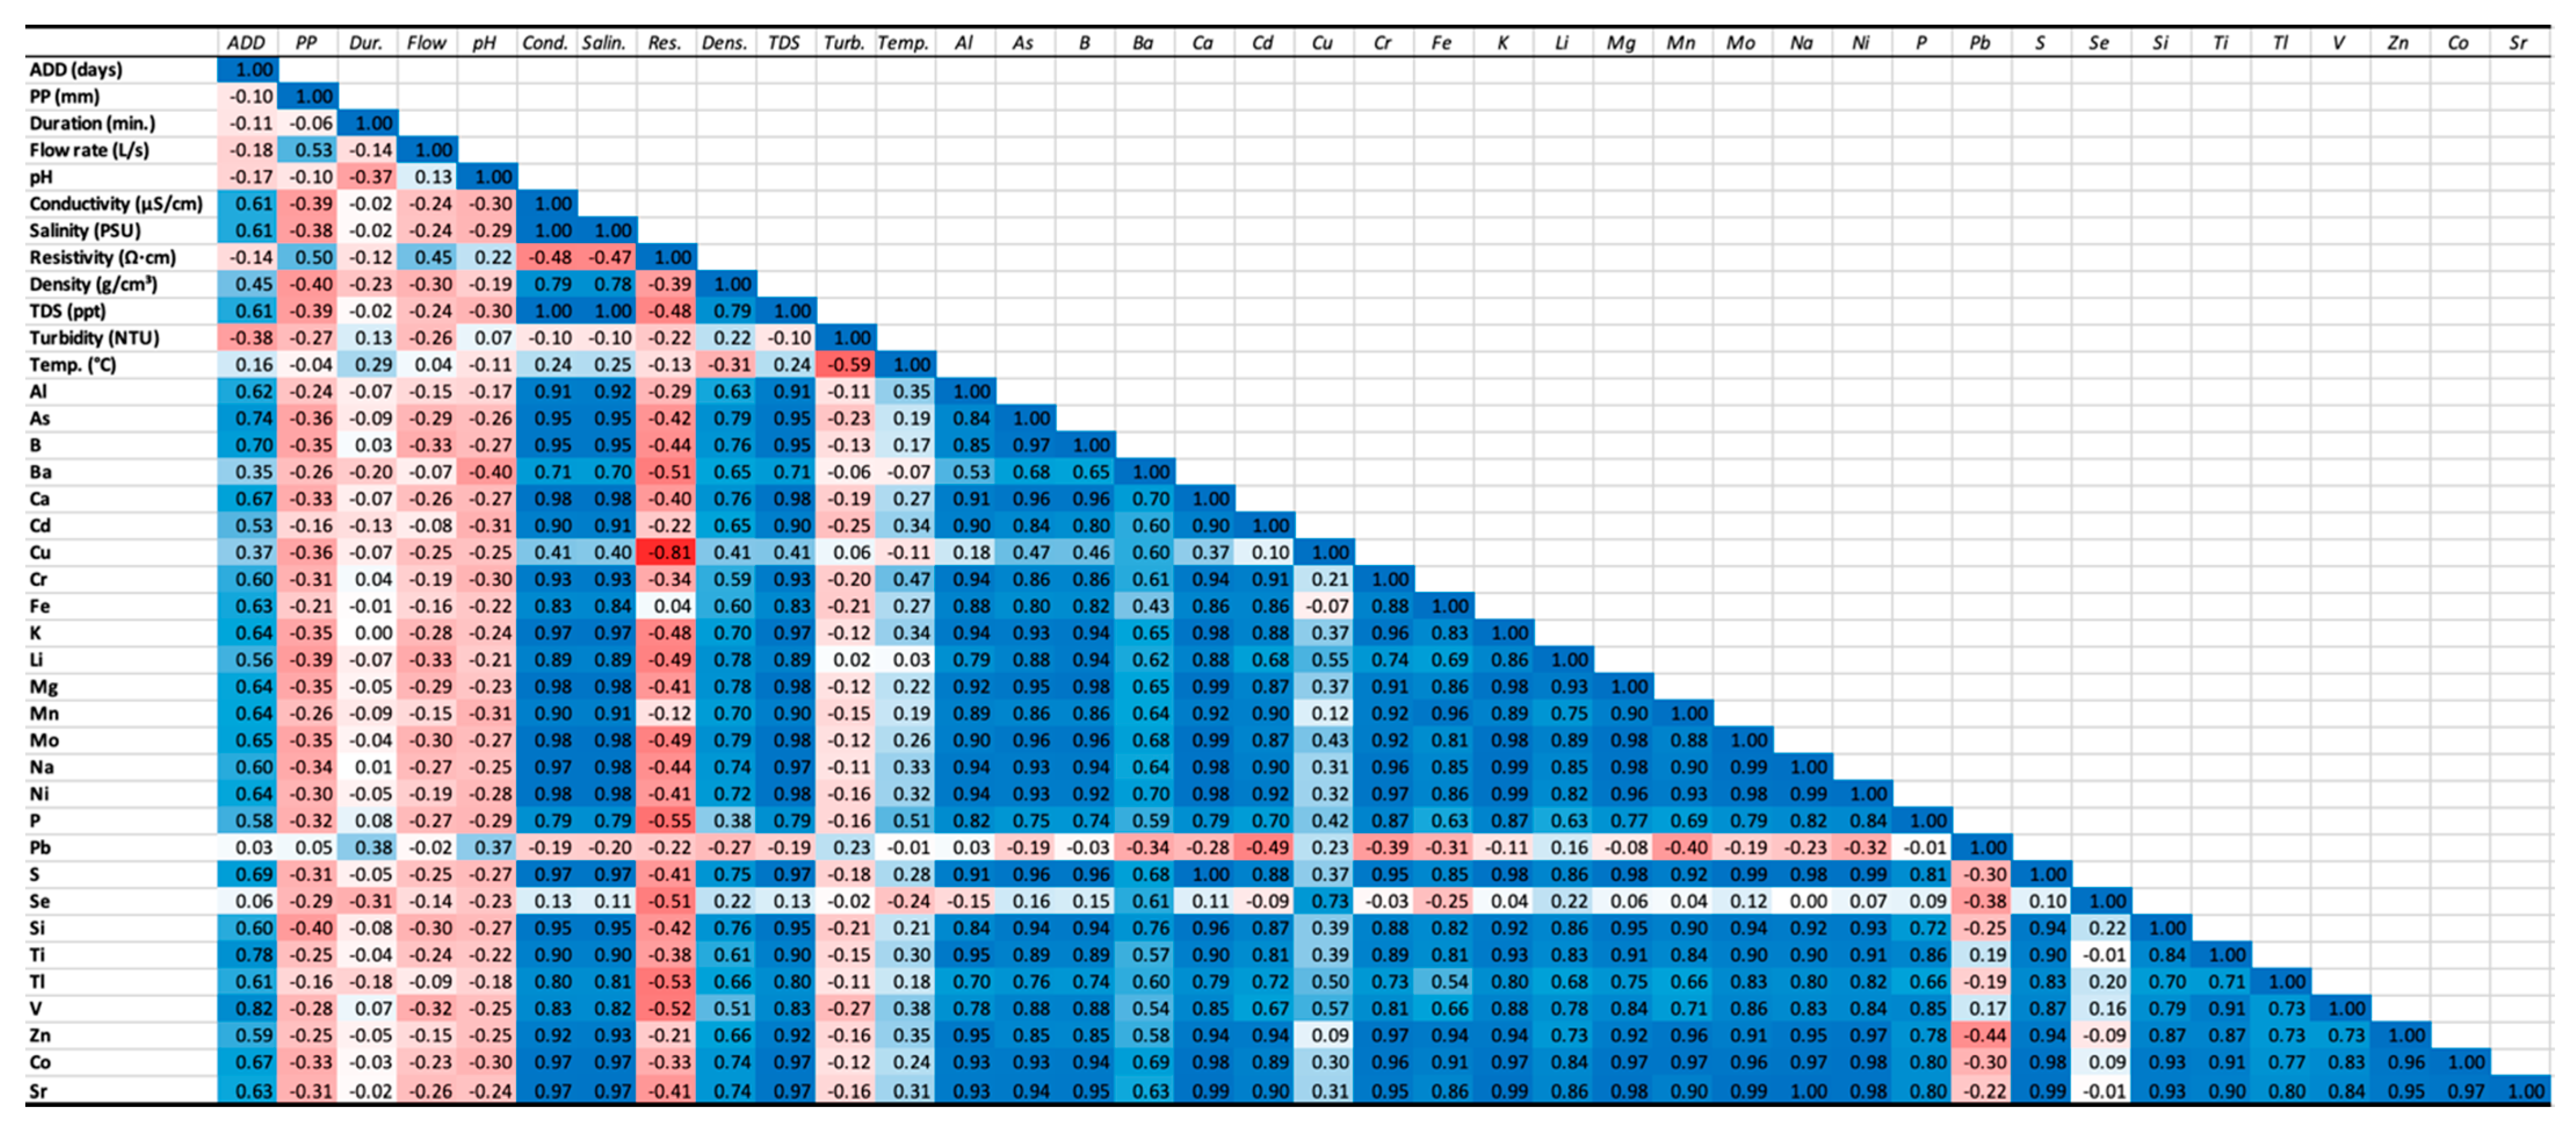
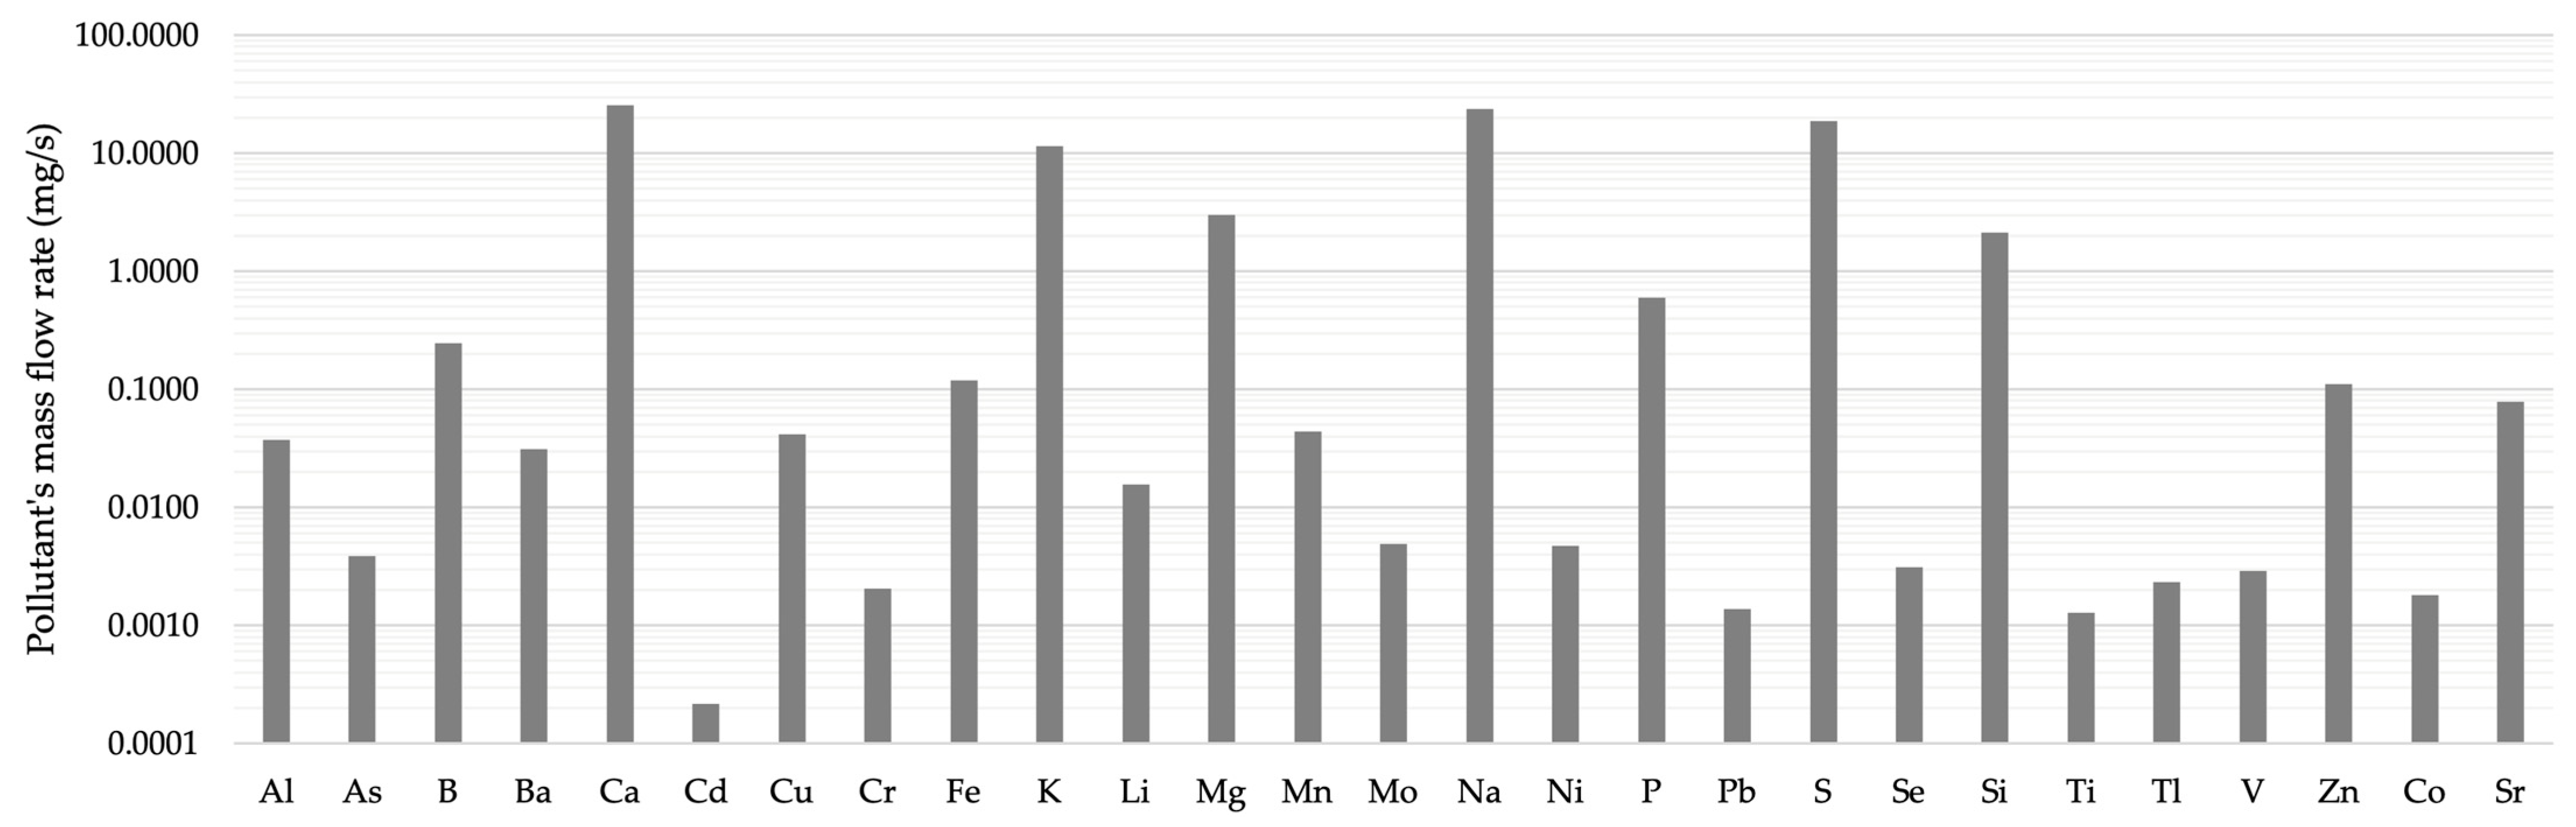
Stormwater samples were collected near the San Lazaro bridge in downtown Arequipa (Figure 1), in a surface stormwater outlet with an estimated drainage area of 40,680 m2 (0.04 km2) at one of the busiest traffic streets within the city, which drains directly into the San Lorenzo stormwater evacuation canal, a tributary of the Chili River.
Stormwater samples were collected during the 2022 and 2023 rainy seasons (i.e., summer months December, January, February, March, and April). Following US EPA recommendations, samples were collected only after a minimum antecedent dry period of three days. Samples were collected during each storm, capturing first flush and peak flow independently, documenting also the surface-water flow rate on each occasion using standard hydraulic methods. Samples were then filtered, and concentrated nitric acid (65%) was added for preservation. Samples were then kept cold (around 4 °C) until being brought to the laboratory for further analyses.
All analyses were performed in the laboratory at Colorado School of Mines (Golden, CO, USA) using standard methods. Water and control samples were analyzed for total concentrations of metals (mg/L) and major inorganic cations (Al, As, B, Ba, Ca, Cd, Cu, Cr, Fe, K, Li, Mg, Mn, Mo, Na, Ni, P, Pb, S, Se, Si, Ti, Tl, V, Zn, Co and Sr) using an Optima 8300 ICP-OES inductively coupled plasma optical emission spectrophotometer (PerkinElmer, Waltham, MA, USA), applying the Waters Method. In all ICP-OES analytical runs, a Sc internal-calibration standard was continuously introduced into the plasma along with each sample, and samples were analyzed in triplicate. Quality assurance/control (QA/QC) samples included deionized water blanks (Barnstead Nanopure system, Thermo Fisher Scientific, Waltham, MA, USA) that contained trace-metal-grade HNO3 (Thermo Fisher Scientific), and certified continuing calibration verification (CCV) standards. The QA samples were analyzed immediately after instrument calibration, after every 15 samples, and at the end of each set of samples. Additionally, NIST-certified standard reference material 1643f was analyzed for trace elements before and at the end of each set of samples. All samples were reanalyzed in any analytical run in which acceptable QA/QC results were not obtained; those unacceptable results could include deviations of the internal Sc standard greater than 20% from the known concentration; deviations of the CCV samples greater than 10% from the known concentrations; or relative standard deviations (RSDs) of triplicate analyses of a sample greater than 10%.
Additionally, other standard physicochemical variables were considered in the analyses and were measured with high-precision equipment (Aqua TROLL 600 Multiparameter Sonde); those additional variables included pH, conductivity (µS/cm), salinity (PSU), resistivity (Ω⋅cm), density (g/cm3), total dissolved solids (TDS), turbidity (NTU), and temperature (°C). Water quality parameters were then compared to Peruvian crop irrigation standards (Norm DS004-2017-MINAM, Category 3, Irrigation of Vegetables), while other international irrigation standards were referred to the analytes not regulated in Peru.
Finally, climate data (total rainfall amount and storm duration) were obtained from the Peruvian National Hydrology and Meteorology Service‘s (SENAMHI) database, available to the public at https://www.gob.pe/senamhi (accessed on 13 September 2023). Graphical interpretations and correlation matrixes were carried out to identify correlations and temporal changes among all analyzed variables.

3. Results

A total of 12 storm events were captured over two seasons. Ten (10) storm events (four for the 2022 rainy season and six for 2023) were sampled for both first flush and peak flow, while only peak flow was possible to sample for two additional storms (one during each season), due to the rapid occurrence of those events that prevented the team from collecting first flush on time (see Table S1 in the Supplemental Information). In terms of climate, both rainy seasons can be considered as “normal”, according to climate data documented in Arequipa since 1964 (SENAMHI, 2023). Antecedent dry days were highly variable (Table S1). The antecedent dry period for each season was 301 and 265 days for the 2022 and 2023 rainy seasons considered in this study, respectively. Similarly, precipitation amounts were heterogeneous, with a mean depth of 4.2 mm per storm and a mean duration of 74 min. Finally, documented flow rates generated within the studied drainage area were highly variable, between 0.001 and 3.275 L/s, with an average of 0.135 L/s.
Results from the physicochemical analyses are shown in Table S1 and Figure 2. Those results indicate a notable seasonal effect (i.e., higher concentrations at the beginning of the rainy season) for conductivity, salinity, density, and TDS, most likely a result from a long dry period of material being accumulated on streets since the 2022 rainy season ended (265 days without any storm event). Additionally, the majority of the samples collected during first flush showed higher conductivity, salinity, TDS, and density than those collected during peak flows, an indication that most salts and dissolved materials are being transported at the beginning of each storm, with the majority of them being evacuated out of the study area early in the season. In turn, this suggests that these pollutants are primarily sourced from build-up on impervious surfaces during antecedent dry days. Moreover, MPLs were violated for pH and conductivity, suggesting that the quality of water generated during storms from this part of the city is not suitable for crop irrigation (the rest of the physicochemical variables are not regulated under Peruvian standards). No defined pattern was found for turbidity and resistivity.
The temporal variability of metal concentrations within and between storms is detailed in Tables S2 and S3, and illustrated in Figure 3a–d, evidencing once again a clear seasonal effect for some analytes (Al, As, B, Ba, Ca, Co, Cu, Cr, Fe, K, Mg, Mn, Na, Ni, P, S, Se, Si, Sr, Ti, and Zn), most likely because of the contaminants’ buildup during long dry periods that occurred between rainy seasons. Similar to some physicochemical variables (see Figure 2), most samples collected during first flush contained more contaminants than those corresponding to peak flow. The contaminant that exceeded Peruvian crop irrigation MPLs the most was boron (B), while documented values for Cu, Fe, Mn, and Zn were above legal limits only at the beginning of the 2023 rainy season (with the exception of Cu, which violated MPLs at the early stages of both rainy seasons). The rest of the analytes remained below MPLs during the entire period under study, except for Ca, K, Mg, Mo, Na, P, S, Si, Sr, Ti, Tl, and V, which are not regulated under Peruvian standards. However, based on other international irrigation standards (Table 1), most pollutants overpassed MPLs at the beginning of the 2023 season (see Tables S2 and S3), coinciding with Peruvian regulated contaminants.
The correlation among all considered analytes is shown in Figure 4, while Figures S1 and S2 illustrate correlations for first flush and peak flow, respectively. These figures suggest a clear negative correlation between metal concentrations and rainfall amount, storm duration, and flow rate. These results suggest that the pollutants are not sediment-associated, but are largely on surfaces or in shallow soils, so concentrations are diluted by higher flows, agreeing with the findings of other studies conducted elsewhere (e.g., [32]). Similarly, the solubility of metals tends to increase at low pH values [33,34], i.e., less metals are expected to be found in stormwater, which tends to lead to basic pH (i.e., >7.0).
TDS, on the other hand, is a measure of the combined content of metals contained in water. However, the relationship between TDS and metal concentration in water (in this case, stormwater) is known to be complex and it can vary as a function of the specific composition of stormwater and the sources of pollution. According to Figure 4, there is a direct correlation between TDS and metal concentrations (i.e., the more TDS, the more metals in stormwater), a behavior common to having similar sources of pollution [35]; in this case, vehicular pollutants, most likely. However, Pb and Se concentrations show a negative correlation with TDS and the rest of the metals (Figure 4), which can occur if those two contaminants have different sources such as industry or others [36,37]. Moreover, more research is needed to determine what the exact sources of pollution for those and other metals are in Arequipa stormwater.
Moreover, density of water (a variable measured with high precision that showed slight but detectable temporal changes) is known to be strictly correlated to temperature [38], while stormwater conductivity (and resistivity) is also a function of the same variable [39,40]; salinity (which directly affects resistivity) is generally well correlated with most variables and analytes considered in this study, except for Pb and Se (see further down for discussion). However, resistivity-wise, correlations with most variables were much stronger during first flush compared to peak flow (see Figures S1 and S2), most likely because salinity was generally higher at the beginning of each event (see Figure 2). Furthermore, physicochemical parameters conductivity, salinity, density, and TDS showed high values at the beginning of the rainy season, gradually decreasing towards the end of summer, most likely because of the buildup of salts during the long dry period (265 days for the 2023 rainy season), as previously mentioned, surpassing Peruvian MPLs for conductivity (2000 µS/cm) in the first storm event on both first flush and peak flow. However, the 2022 rainy season had an even longer antecedent dry period (301 days) but no TDS increase at its beginning was observed, which could not be explained from our data.

4. Discussion

4.1. Stormwater Pollution in Arequipa

This investigation, pioneer in Peru, suggests that dangerous contaminants are being released to the environment through stormwater generated from a small portion of the city of Arequipa. It is important to note that B, Cu, Fe, Mn, and Zn are all vehicle-related pollutants [41,42,43], with concentrations above MPLs that can affect aquatic ecosystems [44]. Ca, K, Na are not considered pollutants, except for their contribution to TDS and salinity (also in drinking water for “hardness”, which falls out of the scope of this study). Mo, P, S, Si, Sr, Ti, Tl, and V are not regulated under Peruvian standards, but some are considered pollutants. For example, Tl is considered a heavy metal and a known contaminant that can cause health effects in people [45,46] and the environment [47]. Similarly, Ti is one of the most abundant elements on Earth, being present in igneous rocks and riverbed sediments, both commonly found in the Peruvian Andes [48]. However, Tl sources are mainly byproducts of Cu, Zn, and Pb refining [49], which explains the positive correlation among those metals (see Figure 4). The remaining unregulated metals (Mo, P, S, Si, and V) are common plant nutrients but even though they do not represent a risk for crops, they could be a risk to downstream aquatic ecosystems [50]. For example, it is well known that excessive Mo concentrations can affect the reproductive capacity of flora and fauna in river systems [51]. Furthermore, Mo, Na, and P (not regulated in Peru) could be a potential problem; even though they are considered nutrients for crop plants, excessive amounts of those metals can significantly damage downstream aquatic ecosystems (e.g., [51,52]), so further investigations should focus on potential environmental effects of urban stormwater discharges on downstream native species such as fish, as excessive Na concentration have been linked to sub-lethal effects in rivers [53]. For example, following the methods recently used by Tejada-Meza et al. [54], pollutant concentrations in the Chili River upstream and downstream from Arequipa can be tested for several bioindicators, to see if significant changes can be detected. Similarly, a simple ecological assessment in both portions of the river can also easily determine if discharges from the city are affecting native life. Moreover, B (the metal that violated MPLs the most) is considered toxic to plants in large quantities [55], while Sr is an element that can have both beneficial and detrimental effects on plants, depending on its concentrations in water and availability in crop soils (e.g., [56]).
Despite the above, the most concerning effects of metals exceeding Peruvian irrigation standards are their potential to be ingested by people after they bioaccumulate in food crops. Found naturally in soils and surface waters [57,58], B has been related to irritation of nose and throat, sore throat, vascular congestion, bleeding, parenchymal degeneration, and death of babies, among others [59]. Cu is a common vehicle-related pollutant originating from brakes, brake wear, and wearing of engines (e.g., [60]), and has been linked to gastrointestinal and hepatic problems, immunity risks, psychological issues, and even cerebrovascular mortality, among others [61,62]. Moreover, the ingestion of Fe, which has been shown to be generated from emissions of lubricating oils in vehicles (e.g., [63]), has been associated with hemosiderosis (increased iron in the tissue accompanied by headaches, difficulty breathing, fatigue, dizziness, weight loss and grayish discoloration of the skin) and hemochromatosis (tissue damage with excessive Fe deposits in the body) [64,65]. Finally, excessive Mn (also from brakes and wearing of engines) and Zn (vehicle exhaust, tires, and car washing) [66] in the human body can cause serious respiratory and neurological problems [67,68,69,70] Additionally, the presence of the above-mentioned metals being released to the environment can result in a series of adverse effects in aquatic ecosystems such as bioaccumulation in plants, insects, and fish, among others [71].
The presence of these contaminating metals is also likely related to different manufacturing activities in addition to traffic sources. For example, Cu is used in roof coating, causing corrosion in contact with rainwater. Similarly, Zn is used to coat iron and prevent corrosion and to form alloys such as brass and bronze, and its increase is directly proportional to the increase in the acidity of the water [70]. However, B has been shown to have a natural source (e.g., [72]), though further studies are needed to determine why there is so much B in Arequipa’s stormwater. Nevertheless, B represents a problem that needs to be addressed by local authorities.
Being an urban area heavily occupied by vehicles, the presence of Pb was expected (e.g., [73]). However, our results indicate maximum concentrations lower than 0.01 mg/L, which is below Peruvian standards (0.05 mg/L), and Pb in gasoline has been banned in Peru since 2021 [74]. Reyes [75] evaluated the content of Pb in PM2.5 in the District of Arequipa, ruling out the vehicle fleet as the main source of contamination to the environment by this metal. In fact, results from this investigation suggest that Pb might not have the same source as the rest of the considered metals, based on low and negative correlation coefficients, compared to those from the rest of the metals, which are positive and high (see Figure 4, Figures S1 and S2). Moreover, while Wijesiri et al. [76] compared stormwater quality generated in China and Australia, also finding that Pb does not correlate well with other metals, most research findings conclude positive correlations (e.g., [77,78,79,80]). Even the meta-analysis developed by Simpson et al. [81] concluded that Pb is a good indication to estimate the presence of other metals in urban stormwater. In short, the reasons why Pb is not well correlated with other metals in Arequipa are unknown but, following the results from Doria [34] in Bogotá, Pb is possibly originated from an independent source within the city of Arequipa.
In addition to the above, results indicate that Se is not well correlated with most metals either, at least not during first flush (see Figures S1 and S2). Being an essential element for mammals, research suggest that Se sources are found mostly in food products and chronic diseases in humans can be caused if not ingested in proper quantities [82].
With over a million inhabitants, Arequipa is the second largest city in Peru after Lima (the country’s capital); however, the former city is located under extremely dry climate with no plant cover to protect soils [83] or clean the city’s air [84], making it very vulnerable to stormwater events in terms of how much pollution can be mobilized. Similarly, local traffic consists of mostly older vehicles, which are more likable to release pollutants (e.g., [85]). Considering that our results were obtained from a drainage area of just 0.04 km2, i.e., a fraction of the city’s total surface (around 275.8 km2, according to Arela-Bobadilla et al. [86]), it is expected that pollutants being released from the city to the environment can be multiplied by a factor of 9395. From our results and considering an average documented flow rate of 0.44 L/s generated from our small drainage study area during a period of two years (Table S1), the rates of pollutants released to the environment during each storm can be extremely high. For example, Figure 5 illustrates the pollutants’ average mass flow rate for each contaminant included in this study, showing that B (a known toxic urban contaminant that was detected above MPLs in many occasions towards the study period) (e.g., [87]) was released from the study area to the environment at a mean rate of 0.245 mg/s (see Table S2). This seems like a small amount, but if we assume that this same process happens in most of the city’s urban area, it would be 2.4 kg/s of B for a storm that covers the entire city. According to SENAMHI’s climatic records, average storm duration from the events sampled in this study is around 68 min (Table S1), i.e., around 10 MT of B released to the environment from the entire urban area of Arequipa, in one event, though most of the pollution indeed occurs at the beginning of each rainy season and at the beginning of each storm, according to our results (see Figure 2 and Figure 3a–d). However, different land uses could release different amounts of contaminants for a given storm [81], so further studies are needed to determine how much pollution can be generated at different parts of Arequipa and in other Peruvian cities. Similarly, it is important to mention that, besides the variables included in this investigation, further studies should include other dangerous pollutants such as per- and polyfluoroalkyl substances [88].
Considering the above, it is possible to initiate measures used elsewhere such as sweepers and vacuum cleaners, which help eliminate waste and therefore prevent pollution of urban stormwater [89]. Another option is to install sediment filters that prevent some contaminants from entering the stormwater evacuation systems [90], targeting those that have been detected in sediments carried in urban stormwater elsewhere (e.g., [91,92,93,94,95]). Similarly, a third option is represented by “green infrastructure”, which explores the use of eco-pavements and green areas to reduce runoff and filter water naturally [12]. Moreover, considering the aridity of the area, constructed wetlands might be a suitable option to be explored in Arequipa (e.g., [96]), as wetlands in Peru have been declining, according to recent studies [97]. In short, further research should test different decontamination options to ensure proper quality of urban stormwater released from Arequipa and other Peruvian cities, for which urban water quality modelling is crucial to better understand how to treat those contaminants [98]. Additionally, regarding vehicle maintenance, it is important to consider some aspects such as engine care that helps in reducing emissions to the environment, as well as the use of ecological vehicular products that minimize the environmental impact [99]. Many countries around the word are working in electro-mobility to reduce CO2 emissions from the transport sector by 2050 [100,101]. One option to reduce carbon and metal pollution in Arequipa could be public electro-mobility, since Arequipa is one of the most congested cities in Peru, especially in the downtown area, taking into consideration that the main source of air pollution is automobiles [102]. Most importantly, this study needs to be replicated in all major cities in Peru to provide a better assessment of how much water pollution is currently being generated from urban areas.
Moreover, urban stormwater and its further use needs to be regulated to ensure the sustainability of water resources. In Peru, Technical Standard CE.040 (Storm Drainage, the only legal instrument related to urban stormwater) establishes guidelines and minimum requirements for the design and construction of stormwater drainage infrastructure with the purpose of preventing flooding in urban areas and protecting existing buildings and infrastructure. However, this law does not consider the quality of the water or the contaminants that could affect aquatic environments downstream from the cities. Moreover, given the increasing amount of metal bioaccumulation in food products recently evidenced in Peru [103], there is an urgent need to regulate the quality of urban stormwater to ensure that downstream crops are irrigated with healthy water.

4.2. Global Perspective

It is important to discuss how results from this study compare to those obtained by other authors elsewhere. From a national perspective and to the best of our knowledge, nobody has evaluated urban stormwater quality in Peru, making this the very first investigation in this important topic. Furthermore, only a handful of studies on urban stormwater quality have been developed in the entire Latin American continent, with the majority of them conducted in Bogotá (Colombia) [91,92,93,94,95,104] and Tijuana (Mexico) [105], but only analyzing sediments accumulated in streets after storm events, making it hard to put in perspective with the results obtained in this investigation. Moreover, even though Mijangos-Montiel et al. [106] evaluated the quality of stormwater generated from urban land uses such as gas stations, residential, and commercial, the authors documented variables not included in this study, except for TDS, which was up to 1500 and 590 mg/L for residential and commercial areas, respectively (our results indicated a maximum TDS value of 2.28 ppt during the first storm of the 2023 rainy season, as indicated in Table 1, which is much smaller than the Tijuana study). Ortiz-Hernández et al. [107], on the other hand, collected and analyzed first flush samples from urban stormwater in Pacheco (central Mexico), reporting also strong differences between wet and dry periods. Additionally, those authors documented maximum metal concentrations far superior to those obtained in our study. Mosquera and Morales [108] characterized stormwater quality under different land uses in Bogotá, concluding that areas with more vehicular traffic contribute the largest portion of runoff pollution being released to the environment, though their values are far below those documented in our study, possibly because of the significantly wetter climate that the Colombian city experiences compared to Arequipa. Finally, Shubo et al. [109] evaluated the microbiology of urban stormwater in Brazil, not including the analytes considered in our study, while da Silva et al. [110] studied stormwater quality in a retention pond (not compatible with our methods).
Despite the above, significant work has been conducted outside of Latin America. While urban stormwater quality has been successfully modeled (e.g., [111]), Simpson et al. [81] developed a remarkable meta-analysis to link urban stormwater quality with land use, climate, and imperviousness. The authors concluded that urban stormwater generated in arid regions with wet summers are among the most polluted types worldwide. Considering this and for the specific case of southern Peru where climate is extremely dry and summers are wet, urban stormwater in Arequipa has the potential to be a serious environmental threat, provided that those waters are soon used to produce food and not mentioning the possible ecological consequences to downstream ecosystems. Recently, Tejada-Meza et al. [54] revealed the deadly effects of untreated metal-rich industrial effluents in four bioindicators in Arequipa, providing solid evidence that environmental regulations in the region need to be strengthened. Moreover, new regulations must include urban stormwater quality, as evidenced in this investigation.
Finally, global research on urban stormwater quality has documented a positive correlation between metal concentrations and antecedent dry periods [78,112], as well as metal concentrations and physicochemical variables [113], agreeing with the results obtained in this study. Similarly, Ortiz-Hernandez et al. [107] also found higher pollutant concentrations at the beginning of the wet season in stormwater generated from the streets of Bogotá, just like we found in our study.

5. Conclusions

For the first time, urban stormwater quality in Peru has been documented and analyzed. Results show that toxic pollutants are indeed above Peruvian MPLs for irrigation uses, with B being the most recurrent concern, followed by Cu, Fe, Mn, and Zn, though some physicochemical variables also overpassed the standards. In addition, some metals not regulated under Peruvian standards highly overpassed international irrigation norms.
In general, pollution was not homogeneous over time, with most contaminant concentrations being higher at the beginning of each rainy season and at the beginning of each storm. Finally, a good correlation among analytes was found, except for Pb and Se, which are believed to have an independent source of pollution.
Nevertheless, this investigation shows how little relevance the study of urban stormwater quality has, not only in Peru but also in the entire Latin American continent, revealing the urgent need for more research and legal instruments to ensure better aquatic environments and human health. We also recommend the incorporation of toxic pollutants found in Arequipa’s stormwater in the Peruvian regulatory system, as well as stormwater pollution prevention and treatment options.
Finally, this initial assessment does not represent the reality of this large and heterogeneous urban area. Moreover, further investigations should evaluate urban stormwater quality from different parts of the city such as residential, parks, highways, suburbs, gas stations, etc., to have a better idea of which areas can generate more pollutants. Similarly, the incorporation of other pollutants commonly found in cities would be highly valuable, as well as investigating the effects of urban stormwater in downstream aquatic ecosystems.

Supplementary Materials

The following supporting information can be downloaded at: https://www.mdpi.com/article/10.3390/w16010108/s1, Table S1: Antecedent dry days (ADD), total precipitation amount (PP), and storm duration (D) of each storm event considered in this study, with stormwater physicochemical characteristics. Letters indicate first flush (F) and peak flow (P). Colors indicate analyses below MPLs (black), above MPLs (red), and not regulated (blue) under Peruvian irrigation norm DS 004-2017-MINAM. Table S2: Results from the laboratory analyses applied to stormwater samples. Letters indicate first flush (F) and peak flow (P). Colors indicate analyses below MPLs (black), above MPLs (red), and not regulated (blue) under Peruvian irrigation norm DS 004-2017-MINAM. Table S3: Results from the laboratory analyses applied to stormwater samples. Letters indicate first flush (F) and peak flow (P). Colors indicate analyses below MPLs (black), above MPLs (red), and not regulated (blue) under Peruvian irrigation norm DS 004-2017-MINAM. Figure S1: Correlation matrix for all analytes considered in this study, including only samples collected during first flush. Color scale indicates how strong correlations are between two given variables, being this negative (red), positive (blue), and no correlation (white). Figure S2: Correlation matrix for all analytes considered in this study, including only samples collected during peak flow. Color scale indicates how strong correlations are between two given variables, being this negative (red), positive (blue), and no correlation (white).

Author Contributions

Conceptualization, G.M., P.A.G.-C. and J.E.M.; Methodology, P.A.G.-C., M.G., J.C. and J.E.M.; Validation, P.A.G.-C.; Formal analysis, G.M., M.G., T.T.-P., K.M., S.T. and H.M.N.; Investigation, G.M., P.A.G.-C., T.T.-P. and K.M.; Data curation, M.G., T.T.-P., K.M., S.T. and H.M.N.; Writing—original draft, P.A.G.-C., T.T.-P., K.M., S.T., H.M.N. and J.C.; Writing—review & editing, J.C., E.A.H. and J.E.M.; Project administration, G.M., P.A.G.-C., M.G., E.A.H. and J.E.M.; Funding acquisition, G.M., E.A.H. and J.E.M. All authors have read and agreed to the published version of the manuscript.

Funding

This investigation was supported by the Center for Mining Sustainability (Index Numbers 470160 and 470158), a joint venture between the Universidad Nacional San Agustin (Arequipa, Peru) and Colorado School of Mines (USA).

Data Availability Statement

Data are contained within the article and supplementary materials.

Acknowledgments

The authors sincerely thank the contributions from Daniel Santos and Francisco Alejo toward the development of this research.

Conflicts of Interest

The authors declare no conflicts of interest.

References

  1. Hoornweg, D.; Pope, K. Population predictions for the world’s largest cities in the 21st century. Environ. Urban. 2017, 29, 195–216. [Google Scholar] [CrossRef]
  2. Tuholske, C.; Caylor, K.; Funk, C.; Verdin, A.; Sweeney, S.; Grace, K.; Peterson, P.; Evans, T. Global urban population exposure to extreme heat. Proc. Natl. Acad. Sci. USA 2021, 118, e2024792118. [Google Scholar] [CrossRef] [PubMed]
  3. Moudon, A.V. Real noise from the urban environment: How ambient community noise affects health and what can be done about it. Am. J. Prev. Med. 2009, 37, 167–171. [Google Scholar] [CrossRef] [PubMed]
  4. Al Bakri, D.; Rahman, S.; Bowling, L. Sources and management of urban stormwater pollution in rural catchments, Australia. J. Hydrol. 2008, 356, 299–311. [Google Scholar] [CrossRef]
  5. Gao, Z.; Zhang, Q.; Li, J.; Wang, Y.; Dzakpasu, M.; Wang, X.C. First flush stormwater pollution in urban catchments: A review of its characterization and quantification towards optimization of control measures. J. Environ. Manag. 2023, 340, 117976. [Google Scholar] [CrossRef] [PubMed]
  6. Zgheib, S.; Moilleron, R.; Chebbo, G. Priority pollutants in urban stormwater: Part 1—Case of separate storm sewers. Water Res. 2012, 46, 6683–6692. [Google Scholar] [CrossRef] [PubMed]
  7. Vaze, J.; Chiew, F.H. Nutrient loads associated with different sediment sizes in urban stormwater and surface pollutants. J. Environ. Eng. 2004, 130, 391–396. [Google Scholar] [CrossRef]
  8. Tuomela, C.; Sillanpää, N.; Koivusalo, H. Assessment of stormwater pollutant loads and source area contributions with storm water management model (SWMM). J. Environ. Manag. 2019, 233, 719–727. [Google Scholar] [CrossRef]
  9. Gustafson, K.R.; Garcia-Chevesich, P.; Slinski, K.; Sharp, J.; McCray, J. Quantifying the Effects of Residential Infill Redevelopment on Urban Stormwater Quality in Denver, Colorado. Water 2021, 13, 988. [Google Scholar] [CrossRef]
  10. Kuster, A.C.; Pilgrim, K.M.; Kuster, A.T.; Huser, B.J. Field Application of Spent Lime Water Treatment Residual for the Removal of Phosphorus and other Pollutants in Urban Stormwater Runoff. Water 2022, 14, 2135. [Google Scholar] [CrossRef]
  11. Herzog, S.P.; Eisenstein, W.A.; Halpin, B.N.; Portmann, A.C.; Fitzgerald, N.J.M.; Ward, A.S.; Higgins, C.P.; McCray, J.E. Co-Design of Engineered Hyporheic Zones to Improve In-Stream Stormwater Treatment and Facilitate Regulatory Approval. Water 2019, 11, 2543. [Google Scholar] [CrossRef]
  12. Spahr, K.M.; Smith, J.; McCray, J.; Hogue, T. Reading the Green Landscape: Public Attitudes toward Green Stormwater Infrastructure and the Perceived Nonmonetary Value of Its Co-Benefits in Three US Cities. J. Sustain. Water Built Environ. 2021, 7, 04021017. [Google Scholar] [CrossRef]
  13. Wible, B. The Clean Water Act actually cleans water. Sci. Am. Assoc. Adv. Sci. 2018, 362, 555–556. [Google Scholar] [CrossRef]
  14. Floriano, C.E. Propuesta de Drenaje Pluvial en la Urbanización Praderas III Etapa, del Distrito de Nuevo Chimbote–Santa–Ancash. Professional Thesis, National University of Santa, Chimbote, Peru, 2019. Available online: https://hdl.handle.net/20.500.14278/3400 (accessed on 12 September 2023).
  15. Sanchez, A.; Pérez, K. Análisis y Evaluación del Comportamiento Hidráulico con Aliviaderos de Tormentas en el Sistema de Alcantarillado Sanitario del Casco Urbano de la Ciudad de Pucallpa. Professional Thesis, National University of Ucayali, Pucallpa, Peru, 2022. Available online: http://repositorio.unu.edu.pe/handle/UNU/6047 (accessed on 13 September 2023).
  16. Ferreyros, J.E.; Vela, K.M. Análisis y Evaluación del Sistema de Drenaje Pluvial en Zonas I, II, III y IV de la Ciudad de Pucallpa-Coronel Portillo–Ucayali. Professional Thesis, National University of Ucayali, Pucallpa, Peru, 2020. Available online: http://repositorio.unu.edu.pe/handle/UNU/4521 (accessed on 12 September 2023).
  17. Cuti, K. Drenaje Pluvial Urbano en la Localidad de Espinar, Provincia de Espinar, Región Cusco. Professional Thesis, National University of San Agustín, Arequipa, Peru, 2018. Available online: http://repositorio.unsa.edu.pe/handle/UNSA/5759 (accessed on 14 September 2023).
  18. Lima, M.; Quispe, L. Evacuación de Aguas Pluviales Aplicando Técnicas de Drenaje Urbano Sostenible en la Localidad de Alto Libertad. Professional Thesis, National University of San Agustín, Arequipa, Peru, 2018. Available online: http://repositorio.unsa.edu.pe/handle/UNSA/5784 (accessed on 13 September 2023).
  19. Ticona, W. Propuesta de Diseño de la Captación de agua de Lluvia Mediante Coberturas en las Viviendas Rurales, Con Fines de Consumo Doméstico en la Comunidad Pucarani Tiraccollo–Ilave. Professional Thesis, National University of Altiplano, Puno, Peru, 2017. Available online: https://tesis.unap.edu.pe/handle/20.500.14082/12440 (accessed on 12 September 2023).
  20. Muñoz, R. Evaluación de la Calidad de Aguas de Lluvias en los Distritos de Chaupimarca, Yanacancha y Simón Bolívar de Rancas–Provincia de Pasco. Professional Thesis, National University of Daniel Alcides Carrión, Cerro de Pasco, Peru, 2019. Available online: http://repositorio.undac.edu.pe/handle/undac/1491 (accessed on 13 September 2023).
  21. Casas, S.; Fachin, A.; Panduro, E. Evaluación del Aprovechamiento de Agua de Lluvia Para Uso Doméstico en Moyobamba-San Martín. Professional Thesis, National University of San Martín, Tarapoto, Peru, 2005. Available online: http://hdl.handle.net/11458/1054 (accessed on 15 September 2023).
  22. Grandez, P. Aprovechamiento de Agua de Lluvia, Para Optimizar el Uso de Agua Potable Residencial. Master’s Thesis, National University of Engineering, Lima, Peru, 2015. Available online: http://cybertesis.uni.edu.pe/handle/uni/2515 (accessed on 14 September 2023).
  23. Velasquez, J. Sistema de Captación y Tratamiento de Agua de Lluvia por Canaletas en Coberturas Impermeables de Viviendas Rurales en el Centro Poblado de Inchupalla. Professional Thesis, National University of Altiplano, Puno, Peru, 2021. Available online: https://tesis.unap.edu.pe/handle/20.500.14082/15337 (accessed on 16 September 2023).
  24. Chalco, G. Evaluación, Análisis y Diseño de un Sistema de Captación de Agua de Lluvia en Viviendas Rurales en Molino–Juli. Professional Thesis, National University of Altiplano, Puno, Peru, 2016. Available online: http://repositorio.unap.edu.pe/handle/UNAP/4620 (accessed on 12 September 2023).
  25. Chino, M. Evaluación y Propuesta de Diseño de Captación de Agua de Lluvia en Viviendas Rurales de la Comunidad Vilca Maquera–Pilcuyo. Professional Thesis, National University of Altiplano, Puno, Peru, 2013. Available online: http://tesis.unap.edu.pe/handle/20.500.14082/4509 (accessed on 11 September 2023).
  26. Guerra, K.P. Evaluación de Metales Pesados (Cr, Al, Fe) en Aguas de Escorrentía Pluvial en las Cunetas y su Impacto en Cultivos de Arroz-Marona. Professional Thesis, Universidad Nacional de San Martín, Tarapoto, Peru, 2018; 96p. [Google Scholar]
  27. Apaza, R. Impacto de la Contaminación Ambiental en la Salud de la Población de Arequipa Metropolitana. Professional Thesis, National University of San Agustin, Arequipa, Peru, 2018. Available online: https://repositorio.unsa.edu.pe/items/9f522cb9-aa1e-468d-b1f2-e1843c912ed1 (accessed on 10 September 2023).
  28. Ayers, R.S.; Westcot, D.W. Water Quality for Agriculture; FAO Irrigation and Drainage Paper 29 Rev: Rome, Italy, 1984; Volume 29, p. 174. Available online: https://www.fao.org/3/t0234e/T0234E00.htm (accessed on 18 September 2023).
  29. National Vegetable Extension Network. Irrigation Water Quality for Vegetables. Available online: http://www.ausvegvic.com.au/wp-content/uploads/2018/04/Factsheet_Irrigation-water-quality_v4.pdf (accessed on 2 August 2023).
  30. Environmental Protection Agency. Ambient Water Quality Criteria for Tallium. Available online: https://www.epa.gov/sites/default/files/2019-03/documents/ambient-wqc-thalllium-1980.pdf (accessed on 3 August 2023).
  31. Rowe, D.R.; Abdel-Magid, I.M. Irrigation Water Quality Standards and Salinity Management Strategies. Texas A&M Agrilife Extensión, 1995, Inc., 550. Available online: https://twon.tamu.edu/wp-content/uploads/sites/3/2021/06/irrigation-water-quality-standards-and-salinity-management-strategies-1.pdf (accessed on 20 September 2023).
  32. May, D.B.; Sivakumar, M. Prediction of heavy metal concentrations in urban stormwater. Water Environ. J. 2009, 23, 247–254. [Google Scholar] [CrossRef]
  33. Lee, C.; Chen, J.; Chang, W.; Shiah, I. Effect of pH on the solubilities of divalent and trivalent amino acids in water at 298.15 K. Fluid Phase Equilibria 2013, 343, 30–35. [Google Scholar] [CrossRef]
  34. Doria, C. Heavy metals (Cd, Cu, V, Pb) in rainwater in the most influence area of the coal mine in La Guajira, Colombia. Rev. Colomb. Quim. 2017, 46, 37–44. [Google Scholar] [CrossRef]
  35. Müller, A.; Österlund, H.; Marsalek, J.; Viklander, M. The pollution conveyed by urban runoff: A review of sources. Sci. Total Environ. 2020, 709, 136125. [Google Scholar] [CrossRef] [PubMed]
  36. Langmuir, D. Aqueous Environmental Geochemistry; Prentice Hall: Upper Saddle River, NJ, USA, 1997. [Google Scholar]
  37. Brinkmann, W.L.F. Urban Stormwater Pollutants: Sources and Loadings. GeoJournal 1985, 11, 277–283. [Google Scholar] [CrossRef]
  38. U.S. Geological Survey. Water Density. Available online: https://www.usgs.gov/special-topics/water-science-school/science/water-density (accessed on 30 September 2023).
  39. Hayashi, M. Temperature-Electrical Conductivity Relation of Water for Environmental Monitoring and Geophysical Data Inversion. Environ. Monit. Assess. 2004, 96, 119–128. [Google Scholar] [CrossRef]
  40. Ruiz, O.; Vásquez, M.; Duarte, N.; Jácome, A. Influencia de la variabilidad climática de la temperatura sobre los índices de calidad de agua. In III Congreso Internacional de Tecnologías Limpias, IV Seminario Internacional de Saneamiento, Ambiente y Desarrollo; Distrital University Francisco José de Caldas: Bogotá, Colombia, 2021. [Google Scholar]
  41. Adamiec, E.; Jarosz-Krzemińska, E.; Wieszała, R. Heavy metals from non-exhaust vehicle emissions in urban and motorway road dusts. Environ. Monit. Assess. 2016, 188, 369. [Google Scholar] [CrossRef]
  42. Oorts, K. Copper. In Heavy Metals in Soils; Alloway, B., Ed.; Springer: Dordrecht, The Netherlands, 2013; Volume 22. [Google Scholar] [CrossRef]
  43. Napier, F.; D’Arcy, B.; Jefferies, C. A review of vehicle related metals and polycyclic aromatic hydrocarbons in the UK environment. Desalination 2008, 226, 143–150. [Google Scholar] [CrossRef]
  44. Barałkiewicz, D.; Chudzińska, M.; Szpakowska, B.; Świerk, D.; Gołdyn, R.; Dondajewska, R. Storm water contamination and its effect on the quality of urban surface waters. Environ. Monit. Assess. 2014, 186, 6789–6803. [Google Scholar] [CrossRef] [PubMed]
  45. Agency for Toxic Substances and Disease Registry. Toxicological Profile for Thallium: Health Effects. 1992. Available online: https://www.atsdr.cdc.gov/ToxProfiles/tp54.pdf (accessed on 20 May 2023).
  46. Genchi, G.; Carocci, A.; Lauria, G.; Sinicropi, M.S.; Catalano, A. Thallium Use, toxicity, and Detoxification therapy: An Overview. Appl. Sci. 2021, 11, 8322. [Google Scholar] [CrossRef]
  47. Yang, C.-H.; Tan, S.; Cheng, C.; Chen, P. Revealing the toxicity of monovalent and trivalent thallium to medaka fish in controlled exposure conditions. Aquat. Toxicol. 2022, 250, 106258. [Google Scholar] [CrossRef] [PubMed]
  48. Vidal Lopez, C.M. Mitigación de Riesgos Físicos Causados por la Expansividad y Capilaridad de las Aguas Dulces Y Salobres en el Sector Sur de los Pantanos de Villa, Caso Base y Cima del Cerro la Corvina-Lima. Master’s Thesis, National University Mayor de San Marcos, Lima, Peru, 2023. Available online: https://hdl.handle.net/20.500.12672/19194 (accessed on 28 September 2023).
  49. Liu, J.; Wang, J.; Chen, Y.; Xie, X.; Qi, J.; Lippold, H.; Luo, D.; Wang, C.; Long-Xiao, S.; He, L.; et al. Thallium transformation and partitioning during PB–ZN smelting and environmental implications. Environ. Pollut. 2016, 212, 77–89. [Google Scholar] [CrossRef] [PubMed]
  50. Weih, M.; Hamnér, K.; Pourazari, F. Analyzing plant nutrient uptake and utilization efficiencies: Comparison between crops and approaches. Plant Soil 2018, 430, 7–21. [Google Scholar] [CrossRef]
  51. Hrytsyniak, I.; Yanovych, D.; Shvets, T. Biological role and toxic influence of Molybdenum in aquatic ecosystems (a review). Ribogospodarsʹka Nauka Ukraïni 2016, 3, 32–46. [Google Scholar] [CrossRef]
  52. Hébert, M. Lake salinization drives consistent losses of zooplankton abundance and diversity across coordinated mesocosm experiments. Limnol. Oceanogr. Lett. 2023, 8, 19–29. [Google Scholar] [CrossRef]
  53. Leite, T.; Branco, P.; Ferreira, M.; Santos, J. Activity, boldness and schooling in freshwater fish are affected by river salinization. Sci. Total Environ. 2022, 819, 153046. [Google Scholar] [CrossRef]
  54. Tejada-Meza, K.; Arenazas, A.; Garcia-Chevesich, P.; Flores, C.; Morales, L.; Romero, G.; Ticona, J.; Vanzin, G.; Sharp, J. Acute Ecotoxicity Potential of Untreated Tannery Wastewater Release in Arequipa, Southern Peru. Sustainability 2023, 15, 15240. [Google Scholar] [CrossRef]
  55. Landi, M.; Margaritopoulou, T.; Papadakis, I.; Araniti, F. Boron toxicity in higher plants: An update. Planta 2019, 250, 1011–1032. [Google Scholar] [CrossRef] [PubMed]
  56. Shaw, G. Blockade by fertilisers of caesium and stronium uptake into crops: Effects on the root uptake process. Sci. Total Environ. 1993, 137, 119–133. [Google Scholar] [CrossRef]
  57. Acuña, A.M. Los suelos como fuente de boro para las plantas. Rev. Científica UDO Agrícola 2005, 5, 10–26. [Google Scholar]
  58. Pizarro Rabanal, J.C. Estudio de Remoción de Boro del Agua Destinada Para la Agricultura en el Distrito de Ite–Tacna Utilizando una Resina Selectiva al Boro y Propuesta de Diseño de una Columna de Intercambio Iónico. Professional Thesis, National University Jorge Basadre Grohmann, Tacna, Peru, 2021. Available online: http://repositorio.unjbg.edu.pe/handle/UNJBG/4223 (accessed on 18 September 2023).
  59. Agency for Toxic Substances and Disease Registry. Toxicological Profile for Boron: Health Effects. 2010. Available online: https://www.atsdr.cdc.gov/toxprofiles/tp26.pdf (accessed on 20 May 2023).
  60. Hulskotte, J.; Roskam, G.; Van Der Gon, H.D. Elemental composition of current automotive braking materials and derived air emission factors. Atmos. Environ. 2014, 99, 436–445. [Google Scholar] [CrossRef]
  61. Agency for Toxic Substances and Disease Registry. Toxicological Profile for Cupper: Health Effects. 2022. Available online: https://www.atsdr.cdc.gov/toxprofiles/tp132.pdf (accessed on 20 May 2023).
  62. Polo Bravo, C.; Sulca Quispe, L. Metales pesados: Fuentes y su toxicidad sobre la salud humana. Ciencias 2019, 2, 20–36. [Google Scholar] [CrossRef]
  63. Gertler, A.; Abu-Allaban, M.; Coulombe, W.; Gillies, J.; Pierson, W.; Rogers, C.; Sagebiel, J.; Tarnay, L.; Cahill, T. Measurements of Mobile Source Particulate Emissions in a Highway Tunnel. Int. J. Veh. Des. 2002, 27, 86–93. [Google Scholar] [CrossRef]
  64. Amatrain, M. Efectos del exceso de hierro sobre la salud. Med. Natur. 2000, 2, 92–95. [Google Scholar]
  65. Cuellar, J.; Navarro, J. Niveles de contaminantes que afectan la calidad de aguas del Rio Huaura en su cuenca baja. Infinitum 2016, 6, 80–89. [Google Scholar] [CrossRef]
  66. Jeong, C.; Wang, J.M.; Hilker, N.; Debosz, J.; Sofowote, U.M.; Su, Y.; Noble, M.; Healy, R.M.; Munoz, T.; Da̧bek-Złotorzyńska, E.; et al. Temporal and spatial variability of traffic-related PM2.5 sources: Comparison of exhaust and non-exhaust emissions. Atmos. Environ. 2019, 198, 55–69. [Google Scholar] [CrossRef]
  67. Agency for Toxic Substances and Disease Registry. Toxicological Profile for Zinc: Health Effects. 2005. Available online: https://www.atsdr.cdc.gov/toxprofiles/tp60.pdf (accessed on 20 May 2023).
  68. Agency for Toxic Substances and Disease Registry. Toxicological Profile for Manganesse: Health Effects. 2012. Available online: https://www.atsdr.cdc.gov/ToxProfiles/tp151.pdf (accessed on 20 May 2023).
  69. O’Neal, S.L.; Zheng, W. Manganese Toxicity Upon Overexposure: A Decade in Review. Curr. Environ. Health Rep. 2015, 2, 315–328. [Google Scholar] [CrossRef]
  70. Hernández Avilés, D. Metales Pesados en el Agua Lluvia. Master’s Thesis, Colombia Engineering School Julio Garavito, Bogotá, Colombia, 2017. Available online: https://repositorio.escuelaing.edu.co/handle/001/528 (accessed on 17 September 2023).
  71. Aguilar, B.; Martin, K. Revisión Sistemática: Tipos de Bioindicadores Para la Identificación de la Calidad de Ecosistemas Acuáticos. Professional Thesis, University César Vallejo, Lima, Peru, 2021. Available online: https://hdl.handle.net/20.500.12692/83655 (accessed on 14 September 2023).
  72. Dotsika, E.; Poutoukis, D.; Michelot, J.; Kloppmann, W. Stable isotope and chloride, boron study for tracing sources of boron contamination in groundwater; boron contents in fresh and thermal water in different areas in Greece. Water Air Soil Pollut. 2006, 174, 19–32. [Google Scholar] [CrossRef]
  73. Mielke, H.W.; Laidlaw, M.; Gonzales, C. Lead (Pb) legacy from vehicle traffic in eight California urbanized areas: Continuing influence of lead dust on children’s health. Sci. Total Environ. 2010, 408, 3965–3975. [Google Scholar] [CrossRef] [PubMed]
  74. Diario Gestión. Available online: https://gestion.pe/mundo/internacional/eliminacion-del-uso-de-la-gasolina-con-plomo-es-un-hito-para-la-salud-y-el-medio-ambiente-onu-noticia/ (accessed on 14 October 2023).
  75. Reyes, J. Cuantificación y Evaluación del Contenido de Pb y Cd en el Material Particulado PM 2.5 por Técnica Voltamperométrica a la que Esta Expuesta la Población del Área de Ingenierías de la UNSA. Professional Thesis, National University of de San Agustín, Arequipa, Peru, 2019. Available online: http://repositorio.unsa.edu.pe/handle/UNSA/10989 (accessed on 19 September 2023).
  76. Wijesiri, B.; Liu, A.; Gunawardana, C.; Hong, N.; Zhu, P.; Guan, Y.; Goonetilleke, A. Influence of urbanisation characteristics on the variability of particle-bound heavy metals build-up: A comparative study between China and Australia. Environ. Pollut. 2018, 242, 1067–1077. [Google Scholar] [CrossRef] [PubMed]
  77. McDonald, S.; Holland, A.; Simpson, S.; Gadd, J.; Bennett, W.; Walker, G.; Keough, M.; Cresswel, T.; Hassell, K. Metal forms and dynamics in urban stormwater runoff: New insights from diffusive gradients in thin-films (DGT) measurements. Water Res. 2022, 209, 117967. [Google Scholar] [CrossRef] [PubMed]
  78. Egodawatta, P.; Ziyath, A.; Goonetilleke, A. Characterising metal build-up on urban road surfaces. Environ. Pollut. 2013, 176, 87–91. [Google Scholar] [CrossRef] [PubMed]
  79. Song, H.; Qin, T.; Wang, J.; Wong, T. Characteristics of Stormwater Quality in Singapore Catchments in 9 Different Types of Land Use. Water 2019, 11, 1089. [Google Scholar] [CrossRef]
  80. Soltaninia, S.; Taghavi, L.; Hosseini, S.; Motamedvaziri, B.; Eslamian, S. The effect of land-use type and climatic conditions on heavy metal pollutants in urban runoff in a semi-arid region. J. Water Reuse Desalination 2022, 12, 384–402. [Google Scholar] [CrossRef]
  81. Simpson, I.M.; Winston, R.; Brooker, M. Corrigendum to “Effects of land use, climate, and imperviousness on urban stormwater quality: A meta-analysis” [Sci. Total Environ. 809 (2022)/152206]. Sci. Total Environ. 2022, 823, 153683. [Google Scholar] [CrossRef]
  82. Hu, W.; Zhao, C.; Hu, H.; Yin, S. Food Sources of Selenium and Its Relationship with Chronic Diseases. Nutrients 2021, 13, 1739. [Google Scholar] [CrossRef]
  83. Garcia-Chevesich, P. Erosion Control and Land Restoration; Outskirts Press: Denver, CO, USA, 2016; 486p. [Google Scholar]
  84. Garcia-Chevesich, P.; Alvarado, S.; Neary, D.; Valdes, R.; Valdes, J.; Aguirre, J.; Mena, M.; Pizarro, R.; Jofré, P.; Vera, M.; et al. Respiratory disease and particulate air pollution in Santiago Chile: Contribution of erosion particles from fine sediments. J. Environ. Pollut. 2014, 187, 202–205. [Google Scholar] [CrossRef]
  85. Dill, J. Estimating emissions reductions from accelerated vehicle retirement programs: Transportation research. Part D Transp. Environ. 2004, 9, 87–106. [Google Scholar] [CrossRef]
  86. Arela-Bobadilla, R.; Riesco-Lind, G.; Chávez, G. Una Mirada a la Expansión de la Ciudad de Arequipa en los Últimos 40 Años; Informe del Centro de Estudios en Economía y Empresa; Universidad Católica San Pablo: Arequipa, Peru, 2021; 29p, Available online: https://ucsp.edu.pe/una-mirada-a-la-expansion-de-la-ciudad-de-arequipa-en-los-ultimos-40-anos/ (accessed on 28 August 2023).
  87. Turkez, H.; Geyikoglu, F.; Tatar, A.; Keles, M.; Kaplan, İ. The effects of some boron compounds against heavy metal toxicity in human blood: Experimental and toxicologic pathology. Off. J. Ges. Für Toxikol. Pathol. 2012, 64, 93–101. [Google Scholar] [CrossRef]
  88. Kurwadkar, S.; Dane, J.; Kanel, S.; Nadagouda, M.; Cawdrey, R.; Ambade, B.; Struckhoff, G.; Wilkin, R. Per- and polyfluoroalkyl substances in water and wastewater: A critical review of their global occurrence and distribution. Sci. Total. Environ. 2022, 809, 151003. [Google Scholar] [CrossRef] [PubMed]
  89. Rochfort, Q.; Exall, K.; Jonathan, P.; Shi, V.; Stevanovic-briatico, V.; Kok, S.; Marsalek, J. Street Sweeping as a Method of Source Control for Urban Stormwater Pollution Street Sweeping as a Method of Source Control for Urban Stormwater Pollution. Water Qual. Res. J. 2009, 44, 48–58. [Google Scholar] [CrossRef]
  90. Nichols, K.; Moncur, K.; Howe, J. Hydrodynamic Separators as Stormwater Best Management Practices. Final Report Prepared for: Utah Department of Transportation Research and Development Division Submitted by: Stantec Consulting Inc. Authored by: Karen Nichols. 2005. Available online: https://rosap.ntl.bts.gov/view/dot/38802 (accessed on 27 September 2023).
  91. Zafra-Mejía, C.; González, J.; Tejero, J. Contaminación por escorrentía superficial urbana: Metales pesados acumulados sobre la superficie de una vía. Ing. E Investig. 2007, 27, 4–10. [Google Scholar]
  92. Zafra-Mejía, C.; González, J.; Tejero, J. Evaluación de la contaminación por escorrentía urbana: Sedimentos depositados sobre la superficie de una vía. Ing. E Investig. 2009, 29, 101–108. [Google Scholar]
  93. Zafra, C.A.; Luengas, E.; Temprano, J. Influencia del tráfico en la acumulación de metales pesados sobre vías urbanas: Torrelavega (España)-Soacha (Colombia). Rev. Fac. Ing. 2013, 67, 146–160. [Google Scholar]
  94. Zafra-Mejia, C.; Santamaria-Galindo, D.; Torres-Galindo, C. Climatic analysis of heavy metal concentration associated with urban road-deposited sediment/Analisis climatico de la concentracion de metales pesados asociados al sedimento depositado sobre vias urbanas. Rev. Salud Pública 2015, 17, 351. [Google Scholar] [CrossRef]
  95. Zafra-Mejia, C.; Rondon-Quintana, H.; Gutierrez-Malaxechebarria, A. Heavy metal contribution by runoff in a high-altitude megacity; a method based on the road-deposited sediment characterization. Dyna 2018, 85, 85–94. [Google Scholar] [CrossRef]
  96. Yang, Z.; Acker, S.; Brady, A.; Rodríguez, A.; Paredes, L.; Ticona, J.; Mariscal, G.; Vanzin, G.; Ranville, J.; Sharp, J. Heavy metal removal by the photosynthetic microbial biomat found within shallow unit process open water constructed wetlands. Sci. Total Environ. 2023, 876, 162478. [Google Scholar] [CrossRef]
  97. Romero, G.; Garcia-Chevesich, P.; Morales, L.; Arenazas, A.; Ticona, J.; Vanzin, G.; Sharp, J. Peruvian Wetlands: National Survey, Diagnosis, and Further Steps toward Their Protection. Sustainability 2023, 15, 8255. [Google Scholar] [CrossRef]
  98. Wong, T.; Fletcher, T.; Duncan, H.; Jenkins, G. Modelling urban stormwater treatment—A unified approach. Ecol. Eng. 2006, 27, 58–70. [Google Scholar] [CrossRef]
  99. Riveros, H.G.; Cabrera, E.; Ovalle, P. Vehicle inspection and maintenance, and air pollution in Mexico City: Transportation research. Part D Transp. Environ. 2002, 7, 73–80. [Google Scholar] [CrossRef]
  100. Ehrler, V.; Hebes, P. Electromobility for city logistics–The solution to urban transport collapse? An analysis beyond theory. Procedia-Soc. Behav. Sci. 2012, 48, 786–795. [Google Scholar] [CrossRef]
  101. Leal Filho, W.; Abubakar, I.R.; Kotter, R.; Grindsted, T.S.; Balogun, A.L.; Salvia, A.L.; Aina, Y.A.; Wolf, F. Framing Electric Mobility for Urban Sustainability in a Circular Economy Context: An Overview of the Literature. Sustainability 2021, 13, 7786. [Google Scholar] [CrossRef]
  102. Chana, J.L. Efectos de la Contaminación Atmosférica en el Clima Urbano y Calidad Ambiental de Arequipa. Professional Thesis, National University of San Agustín, Arequipa, Peru, 2004. [Google Scholar]
  103. Tejada, T.; Garcia-Chevesich, P.; Morales, L.; Romero, G.; Arenazas, A.; Ticona, J.; Martinez, G.; Martinez, K.; Sharp, J.; McCray, J. Heavy Metal Bioaccumulation in Peruvian Food/Medicinal Products: A Review. 2023; under review. [Google Scholar]
  104. Romero, M.d.P.; Pinilla, R.; Zafra, C. Evaluación temporal de la concentración de metales pesados (Pb y Cu) asociada con el sedimento vial: Fontibón-Barrios Unidos (Bogotá D. C., Colombia). Ing. Y Univ. 2015, 19, 315–333. [Google Scholar] [CrossRef]
  105. Wakida, F.T.; Martinez, S.; Garcia, E.; Piñon, T.D.; Espinoza, H.; Ames, A. Pollutant association with suspended solids in stormwater in Tijuana, Mexico. Int. J. Environ. Sci. Technol. 2014, 11, 319–326. [Google Scholar] [CrossRef]
  106. Mijangos-Montiel, J.L.; Wakida, F.; Temores, J. Stormwater Quality from Gas Stations in Tijuana, Mexico. Int. J. Environ. Res. 2010, 4, 777–784. [Google Scholar]
  107. Ortiz-Hernández, J.; Lucho, C.; Lizárraga, L.; Beltrán, R.; Coronel, C.; Vázquez, G. Quality of urban runoff in wet and dry seasons: A case study in a semi-arid zone. Environ. Sci. Pollut. Res. Int. 2016, 23, 25156–25168. [Google Scholar] [CrossRef]
  108. Mosquera, M.; Morales, L.F. Caracterización de Agua de Escorrentía Pluvial Para Diferentes Usos del Suelo en Bogotá. Professional Thesis, University of the Andes, Bogotá, Colombia, 2018. Available online: https://repositorio.uniandes.edu.co/entities/publication/6b9bd106-93a0-4220-b49f-d48376379510 (accessed on 25 September 2023).
  109. Shubo, T.; Maranhão, A.; Ferreira, F.; de Silva e Mouta Júnior, S.; de Pedrosa Macena, L.; do Rosário Vaz Morgado, C.; Warish, A.; Sidhu, J.; Miagostovich, M. Microbiological characterization of stormwater in a high-income neighborhood in Rio de Janeiro, Brazil. Environ. Monit. Assess. 2022, 194, 51. [Google Scholar] [CrossRef]
  110. Da Silva, E.; Filho, N.; Pereira, J.; Martins Formiga, K. Temporal variation and risk assessment of heavy metals and nutrients from water and sediment in a stormwater pond, Brazil: Water science & technology. Water Supply 2023, 23, 206–221. [Google Scholar] [CrossRef]
  111. Mannina, G.; Viviani, G. An urban drainage stormwater quality model; model development and uncertainty quantification. J. Hydrol. 2010, 381, 248–265. [Google Scholar] [CrossRef]
  112. Popick, H.; Brinknn, M.; McPhedran, K. Assessment of stormwater discharge contamination and toxicity for a cold-climate urban landscape. Environ. Sci. Eur. 2022, 34, 43. [Google Scholar] [CrossRef] [PubMed]
  113. McKee, L.J.; Gilbreath, A. Concentrations and loads of suspended sediment and trace element pollutants in a small semi-arid urban tributary, San Francisco Bay, California. Environ. Monit. Assess. 2015, 187, 499. [Google Scholar] [CrossRef]
Figure 1. (A) Aerial view of the study site within the Arequipa city, showing the exact location where stormwater samples were collected (red dot). (B) Stormwater evacuation system, which exits to the San Lorenzo stormwater canal in (C).
Water 16 00108 g001
Figure 2. Temporal variability of physicochemical variables between storms, during first flush (red) and peak flow (blue). Grey lines indicate MPLs under Peruvian irrigation norm DS 004-2017-MINAM.
Water 16 00108 g002
Figure 3. (a). Temporal variability of analytes between storms, during first flush (red) and peak flow (blue). Grey lines indicate MPLs under Peruvian irrigation norm DS 004-2017-MINAM. (b). Temporal variability of analytes between storms, during first flush (red) and peak flow (blue). Grey lines indicate MPLs under Peruvian irrigation norm DS 004-2017-MINAM. (c). Temporal variability of analytes between storms, during first flush (red) and peak flow (blue). Grey lines indicate MPLs under Peruvian irrigation norm DS 004-2017-MINAM. (d). Temporal variability of analytes between storms, during first flush (red) and peak flow (blue). Grey lines indicate MPLs under Peruvian irrigation norm DS 004-2017-MINAM.
Water 16 00108 g003aWater 16 00108 g003bWater 16 00108 g003cWater 16 00108 g003d
Figure 4. Correlation matrix for all analytes considered in this study, including all analyses together. Color scale indicates how strong correlations are between two given variables, being negative (red), positive (blue), and no correlation (white).
Water 16 00108 g004
Figure 5. Average mass flow rate for all metal(oid)s considered in this study.
Water 16 00108 g005
Table 1. Pollutants not regulated under Peruvian irrigation standards, contrasted with other international norms.
AnalyteMPL (mg/L)Number of Samples above MPLsType of Norm
CaNo limits for irrigation
KNo limits for irrigation
Mo0.0114Irrigation water quality [28]
Na1008Australian irrigation water quality standard [29]
P0.2522Australian irrigation water quality standard [29]
SNo limits for irrigation
SiNo limits for irrigation
SrNo limits for irrigation
TiNo limits for irrigation
Tl0.040EPA standard for aquatic ecosystems [30]
V0.10Texas irrigation water quality standard [31]
Disclaimer/Publisher’s Note: The statements, opinions and data contained in all publications are solely those of the individual author(s) and contributor(s) and not of MDPI and/or the editor(s). MDPI and/or the editor(s) disclaim responsibility for any injury to people or property resulting from any ideas, methods, instructions or products referred to in the content.

