Article

Growth, Physiological, Nutrient-Uptake-Efficiency and Shade-Tolerance Responses of Cacao Genotypes under Different Shades

by
Enrique Arévalo-Gardini
1,2,*,
Abel Farfán
1,
Fiorella Barraza
1,3,
César O. Arévalo-Hernández
1,
Luis B. Zúñiga-Cernades
1,
Julio Alegre
4 and
Virupax C. Baligar
5
1
Instituto de Cultivos Tropicales (ICT), Tarapoto 22200, Peru
2
Agronomy Faculty, Universidad Nacional Autonoma de Alto Amazonas (UNAAA), Yurimaguas 16501, Peru
3
Department of Renewable Resources, University of Alberta, Edmonton, AB T6G 2G7, Canada
4
Agronomy Faculty, Universidad Nacional Agraria La Molina (UNALM), Lima 15026, Peru
5
Beltsville Agricultural Research Center, U.S. Department of Agriculture/Agricultural Research Service, Beltsville, MD 20705, USA
*
Author to whom correspondence should be addressed.
Agronomy 2021, 11(8), 1536; https://doi.org/10.3390/agronomy11081536
Submission received: 2 July 2021 / Revised: 20 July 2021 / Accepted: 27 July 2021 / Published: 30 July 2021
(This article belongs to the Special Issue Advances in Understanding Physiological Processes of the Cacao Tree)

Abstract

:
Cacao is an understory plant cultivated in full-sun monocultures, multistrata agroforestry systems, where cacao trees are planted together with fruit, timber, firewood, and leguminous trees, or within thinned native forests. In agroforestry systems of cultivation, cacao is subjected to excess shade due to high density, excess growth, and the unmanaged pruning of shade trees. Cacao is tolerant to shade, and the maximum photosynthetic rate occurs at an irradiance of around 400 μmol m−2 s−1. However, excess shade further reduces the irradiance, which is detrimental to photosynthesis and growth functions. Intra-specific variation is known to exist in cacao for the required saturation irradiance. A greenhouse study was implemented with 58 cacao genotypes selected from four geographically diverse groups: (i) wild cacao from river basins of the Peruvian Amazon (PWC); (ii) Peruvian farmers’ collection (PFC); (iii) Brazilian cacao collection (BCC); and (iv) national and international cacao collections (NIC). All of the cacao genotypes were subjected to 50% and 80% shade where photosynthetic photon flux density (PPFD) was 1000 and 400 μmol m−2 s−1, respectively. Intra-specific variations were observed for growth, physiological and nutritional traits, and tolerance to shade. Cacao genotypes tolerant to shade were: UNG-77 and UGU-130 from PWC; ICT-2173, ICT-2142, ICT-2172, ICT-1506, ICT-1087, and ICT-2171 from PFC; PH-21, CA-14, PH-990, and PH-144 from BCC; and ICS-1, ICS-39, UF-613, and POUND-12 from NIC. Genotypes that tolerate excess shade may be useful plant types for maintaining productivity and sustainability in agroforestry systems of cacao management.

1. Introduction

In addition to the basic concept of shade tolerance, which is defined as the minimum light required for a plant to survive and develop in different strata, this factor involves a wide range of effects that are connected to several aspects of the plant life cycle and ecosystem dynamics [1,2,3,4]. The adaptation of species to shade is still poorly understood [5], and the positive or negative effects are sometimes contradictory, which is the case in cacao [6].
Cacao (Theobroma cacao) is an understory plant [7,8] cultivated under different cropping systems: from full-sun monocultures to multistrata agroforestry systems, where cacao trees are planted together with fruit, timber, firewood, and leguminous trees, or within thinned forests [7,8]. The use of shade trees is a common agricultural and sustainable practice in cacao production systems [9,10,11,12,13,14,15,16]. These trees act as a protection barrier against stressful environmental conditions, such as extreme temperature, solar radiation, drought, and intense rainfall, and wind [6,7,17,18].
Several benefits have been attributed to cacao growing within shaded agroforestry systems, such as control of diseases or insect attacks, maintaining soil fertility, enhancing nutrient cycling, reducing soil erosion and deforestation, increasing tree diversity, mitigating climatic changes thorough C sequestration, and helping to reduce the use of pesticides and fertilizer applications [13,19,20,21,22,23,24,25,26].
However, some authors have reported that lower yields have been observed in shaded cacao systems, mostly related to climate conditions (i.e., precipitation and temperature) and probably because, in these systems, the lower light reduce the photosynthetic activities needed to better yields [27,28,29,30]. Nonetheless, farmers can achieve higher net revenues because of the lower maintenance cost (compare to conventional systems) and higher prices obtained per kilogram of cacao beans [31].
Cacao is considered a sun species that is tolerant to moderate shade [32]. Its yield is affected by the presence of too many trees, trees with large canopies, and poorly managed tree canopy structures [24,33]. Under these conditions, the longevity of the plantation may also be affected [34]; therefore, it is advantageous to adopt cacao genotypes that maintain their productivity despite high shade levels, and that can be recommended for the establishment of agroforestry systems.
The definition of shade levels in cacao is a major concern, especially for agroforestry systems [7,17,34], as well as the selection of appropriate tree species to avoid the detrimental effects of shade [6]. It is also important to mention that the need for shade may not be required in all cacao-growing regions, especially in island and heavy cloud cover ecosystems [6].
In tropical forests, understory plants receive a photosynthetic photon flux density (PPFD) of between 5 and 25 μmol m−2 s−1 or 1 to 2% of the irradiance obtained above the tree canopy level but they also intermittently obtain high levels of PPFD in the form of sunflecks [35,36,37,38,39,40,41]. Miyaji et al. [42] reported that the light intensity (at full daylight) above the cacao canopy shaded by trees in Bahia, Brazil was between 30% and 100%, and between 4 and 10% at ground level. In another study conducted in Alto Beni (Bolivia), Niether et al. [18], measured the light levels of various cacao systems and determined a PPFD between 1580 and 2028 μmol m−2 s−1 above the canopy. In contrast, in an open sun monoculture, irradiance varied between 985 and 1546 μmol m−2 s−1 depending on canopy pruning (before and after, respectively). Consequently, light levels have significant influence on growth, physiological traits and nutrition of cacao [33,43,44].
It has been reported that maximum photosynthesis in cacao occurs at a PPFD of 350 to 550 µmol m−2 s−1, which is about 20% to 25% of the intensity of full sunlight [44,45,46,47]. In some cacao genotypes, an increase in PPFD from 50 to 400 µmol m–2 s–1 entails an increase in the net photosynthetic rate (PN) by about 50%, but further increases (up to 1500 µmol m−2 s−1) have no effect, indicating that very little radiant energy is required to support efficient PN in cacao [43].
Variations in morphological characteristics among different genotypes have been reported in cacao [48,49]. In addition, these characteristics are influenced by the level of irradiance [10,11,43,50]. Baligar et al. [43] reported that, in juvenile cacao genotypes, increasing PPFD from 65 to 190 µmol m−2 s−1 increased shoot and root growth, mineral nutrition, and net assimilation rate. Thus, the identification of plant traits for growth and physiological parameters that are influenced by light quality and intensity (PPFD) will help to identify cacao genotypes that may perform well under a range of light intensities (or shade levels).
This research aimed to evaluate the effects of two levels of shade (50% and 80%) on growth, physiological, macronutrients, and micronutrients use efficiency responses of national (wild, domesticated) and international cacao genotypes.

2. Materials and Methods

2.1. Experimental Conditions

2.1.1. Cacao Genotypes

The greenhouse experiment was implemented at the Instituto de Cultivos Tropicales-ICT (Tropical Crops Institute), Tarapoto, San Martin, Peru. A total of 58 cacao genotypes from the germplasm bank located at “El Choclino” experimental station was selected from four geographic origins: (i) wild cacao from river basins of the Peruvian Amazon collection (PWC); (ii) Peruvian farmers’ collection (PFC); (iii). Brazilian cacao collection (BCC); and (iv) national and international cacao collections (NIC). Several expeditions were undertaken by ICT during 2008 to collect wild cacao genotypes from the river basins of Aypena (AYP), Pastaza (PAS), Ungumayo (UGU), and Ungurahui rivers (UNG). Peruvian farmers’ collections were gathered by ICT from 2002 to 2004 in the Provinces of Mariscal Cáceres and Tocache of San Martin department in northeast Peru. Brazilian clones were sourced from Comissão Executiva do Plano da Lavoura Cacaueira/Centro de Pesquisas de Cacau (CEPLAC/CEPEC), Ilhéus/Itabuna, Bahia, Brazil; and international clones were sourced from CFC/ICCO/ Bioversity Clones, International Cocoa Quarantine Centre, University of Reading, Reading, UK (Table 1).

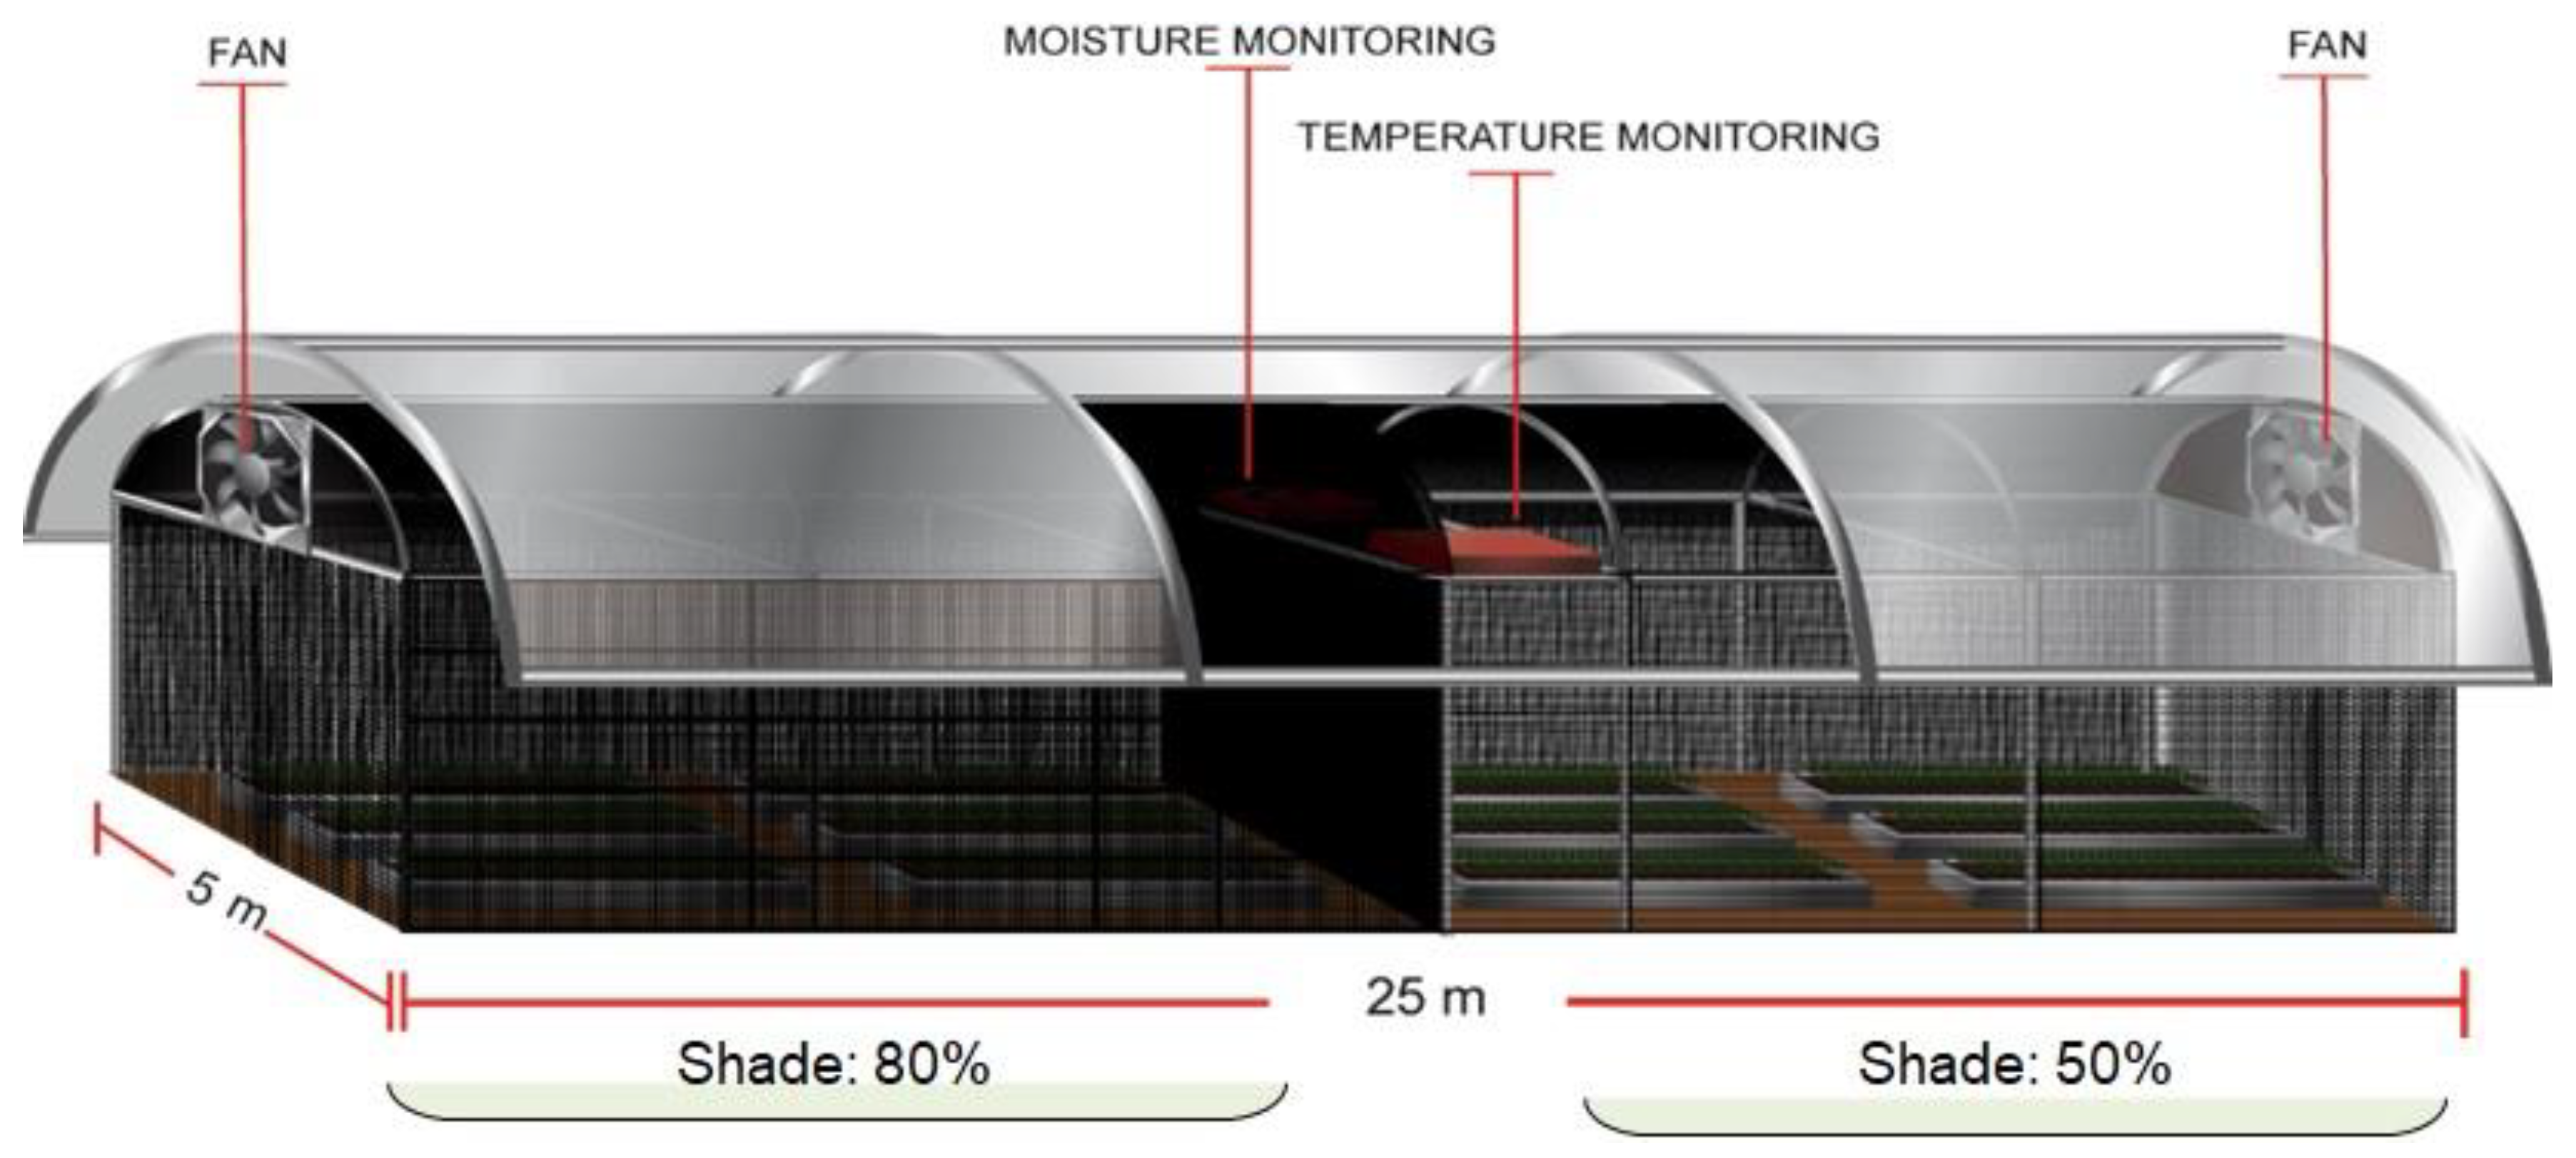
2.1.2. Shade (PPFD) Levels

The greenhouse was constructed and aligned in an east–west direction to evaluate the response of cacao genotypes to two levels of shade (Figure 1). The greenhouse was divided into two sections and covered with different light transmissibility plastic screens (Raschel mesh, Arborizaciones EIRL®) to achieve different levels of shade. The first section provided 80% shade with a PPFD of 400 ± 50 μmol m−2 s1, and the second section provided 50% shade with PPFD of 1000 ± 50 μmol m−2 s−1. The PPFD in each section of the greenhouse was measured by a MQ-200 Quantum sensor (Apogee Instruments, Logan, UT, USA). At both ends of the greenhouse, exhaust and inlet fans were installed to circulate air from inside to outside.

2.1.3. Plant Growth Conditions

The rooted clonal cuttings from plagiotropic branches of various genotypes were prepared in the greenhouse. Terminal apical shoots with 3 or 4 leaves from each of the genotypes were cut, by making a bevel cut, at the base of the branches (¾ from the leaf area) and dipped into plant rooting hormone (Hormodin3®, 0.8% indole-3-butyric acid, IBA) to induce roots. These cuttings were transplanted into polyethylene bags containing 2 kg of agricultural soil (sand = 50.96%, silt = 22%, clay = 27.04%) previously fertilized with 60 N:50P:90 K kg ha−1 applied as urea, calcium dihydrogen phosphate, and potassium chloride, respectively. Dolomitic lime (1 MT ha−1) was added to raise the pH to 6.0. Plants were maintained in the greenhouse at 28 °C, 80% relative humidity, with minimum light PPFD 50 ± 5 μmol∙m−2 s−1; soil moisture was maintained at the field capacity until root formation and proper pest control methods were adapted. At the end of 4 months’ growth, seedlings were transplanted into plastic pots containing 5 kg of sandy loam soil previously fertilized with urea (30 mg N kg−1), Ca(H2PO4)2 (25 mg P kg−1), KCl (45 mg K kg−1), and dolomitic lime (2.5 g kg−1). Soil physicochemical properties of the sandy loam soil used for the study were: 72% sand, 18% clay, 1.55 g cm−3 bulk density, 58% porosity, pH 6.1, organic matter 1.77%, CEC 4.44 cmol kg−1, N (0.08%), P (4 mg kg−1), K (75 mg kg−1), Ca (1.22 cmolc+ kg−1), and Mg (0.60 cmolc+ kg−1), determined using the methods of Silva [51].
All the rooted genotype seedlings were divided into two equal groups and subjected to two shade (PPFD) levels (Figure 1). Plants were grown for 6 months under different shade levels, and soil moisture during growth was maintained at field capacity (−33 KPa) by watering with deionized water every other day; soil moisture status was monitored with a soil moisture tensiometer (2724 ARL Jet Fill tensiometer, Soilmoisture Equipment Corp, Santa Barbara, CA, USA). During growth of the plants, the greenhouse provided a mean temperature of 30.0 °C and relative humidity of 63%. The experiment was conducted using a split-plot design with three replications under complete random distribution; two shade treatments were the main plots (50% and 80% shade) and 58 cacao genotypes were the subplots.

2.2. Biometric Parameters

At the time of harvest, shoot length was measured from the base of the stem to the apex of the plant (cm) with a ruler, and stem diameter was measured using a digital Vernier (mm), respectively. At harvest, stems, leaves, and roots were separated; leaf and root area were measured in cm2 using image analysis (Assess 2.0: Image Analysis Software for Plant Disease Quantification, APS, Saint Paul, MN, USA) [52]. All plant parts were washed with tap water, dipped in 1% HCl, and rinsed in distilled water, placed in paper sachets, and oven-dried at 60 °C for 72 h, until reaching a constant weight.

2.3. Physiological Parameters

A week before harvest, three mature leaves were selected randomly per genotype/pot and per shade treatment to record stomatal conductance (in mmol m−2 s1) using a SC-1 leaf porometer (Decagon Devices, Pullman, WA, USA). Leaf chlorophyll content or “greenness” (in SPAD units) was measured using a SPAD 502-Plus ((Konica Minolta, Inc., Tokyo, Japan).
Water use efficiency (WUE, g plant−1 L−1) was calculated as follows:
WUE = SDW Total   water   used   during   entire   growth
where SDW = shoot dry weight, g plant−1
Total water used during entire growth period = 18.0 L (50% shade) and 11.7 L (80% shade) plant−1.

2.4. Nutrient Uptake Parameters

2.4.1. Concentration of Nutrients

Oven-dried shoots of all genotypes were ground to pass through a 1 mm sieve and 500 mg of sample was digested in 10 mL of 65% HNO3 [53]. The concentrations of macronutrients (K, Ca, Mg) and micronutrients (Cu, Fe, Mn, and Zn) in the digested material were determined by atomic absorption spectrophotometry (AAS, Varian model “Spectra 55B”, Victoria, Australia); P was determined using the ascorbic-molybdate color development method [51]. Total N was determined by the Kjeldahl method (digestion with 5 mL of H2SO4 95%), and both N and P were detected using a spectrophotometer (Spectronic 20D, Thermo Fisher, Waltham, MA USA) [51]. Concentrations are presented as the mean values from three replicates and expressed in g kg−1 for macronutrients and mg kg−1 for micronutrients.

2.4.2. Nutrient Uptake (U)

The nutrient uptake (U) or element content was calculated as follows:
U   = Element   concentration   × SDW 1000
where
  • SDW (shoot dry weight) = in g plant−1
  • Element concentration = in g kg−1 (for macronutrients) or mg kg−1 (for micronutrients)
  • U (or content) = g plant−1 (macronutrients) or mg plant−1 (micronutrients)

2.4.3. Nutrient Uptake Efficiency (NUE)

Nutrient uptake efficiency (NUE), which is used to differentiate plant species, genotypes, and cultivars based on their ability to absorb and utilize nutrients for maximum yields [54,55], was calculated as follows:
NUE   = 1 Element   concentration × 1000
where
  • element concentration = g kg−1 for macronutrients and mg kg−1 for micronutrients
  • NUE = in g shoot g−1 of any macronutrient or in g shoot mg−1 of any micronutrient

2.5. Shade Tolerance Index (STI)

Shade tolerance is the ability of a tree to survive and develop under light-limited conditions [2,3]. In this study we consider cacao genotype that does not or shows little decrease in total biomass when grown in low light (high shade) conditions is considered shade-tolerant and to classify the tolerance of cacao genotypes, STI was calculated as described in the following equation:
STI = Totol   dry   biomass   at   80 %   shade Total   dry   biomass   at   50 %   shade × 100
where
  • total (shoot + root) dry biomass (g plant−1) at 80% shade (PPFD 400 μmol m−2 s−1); this represents low light or heavy shade;
  • total (shoot + root) dry biomass (g plant−1) at 50% shade (PPFD 1000 μmol m−2 s−1); this represents high light or low shade.
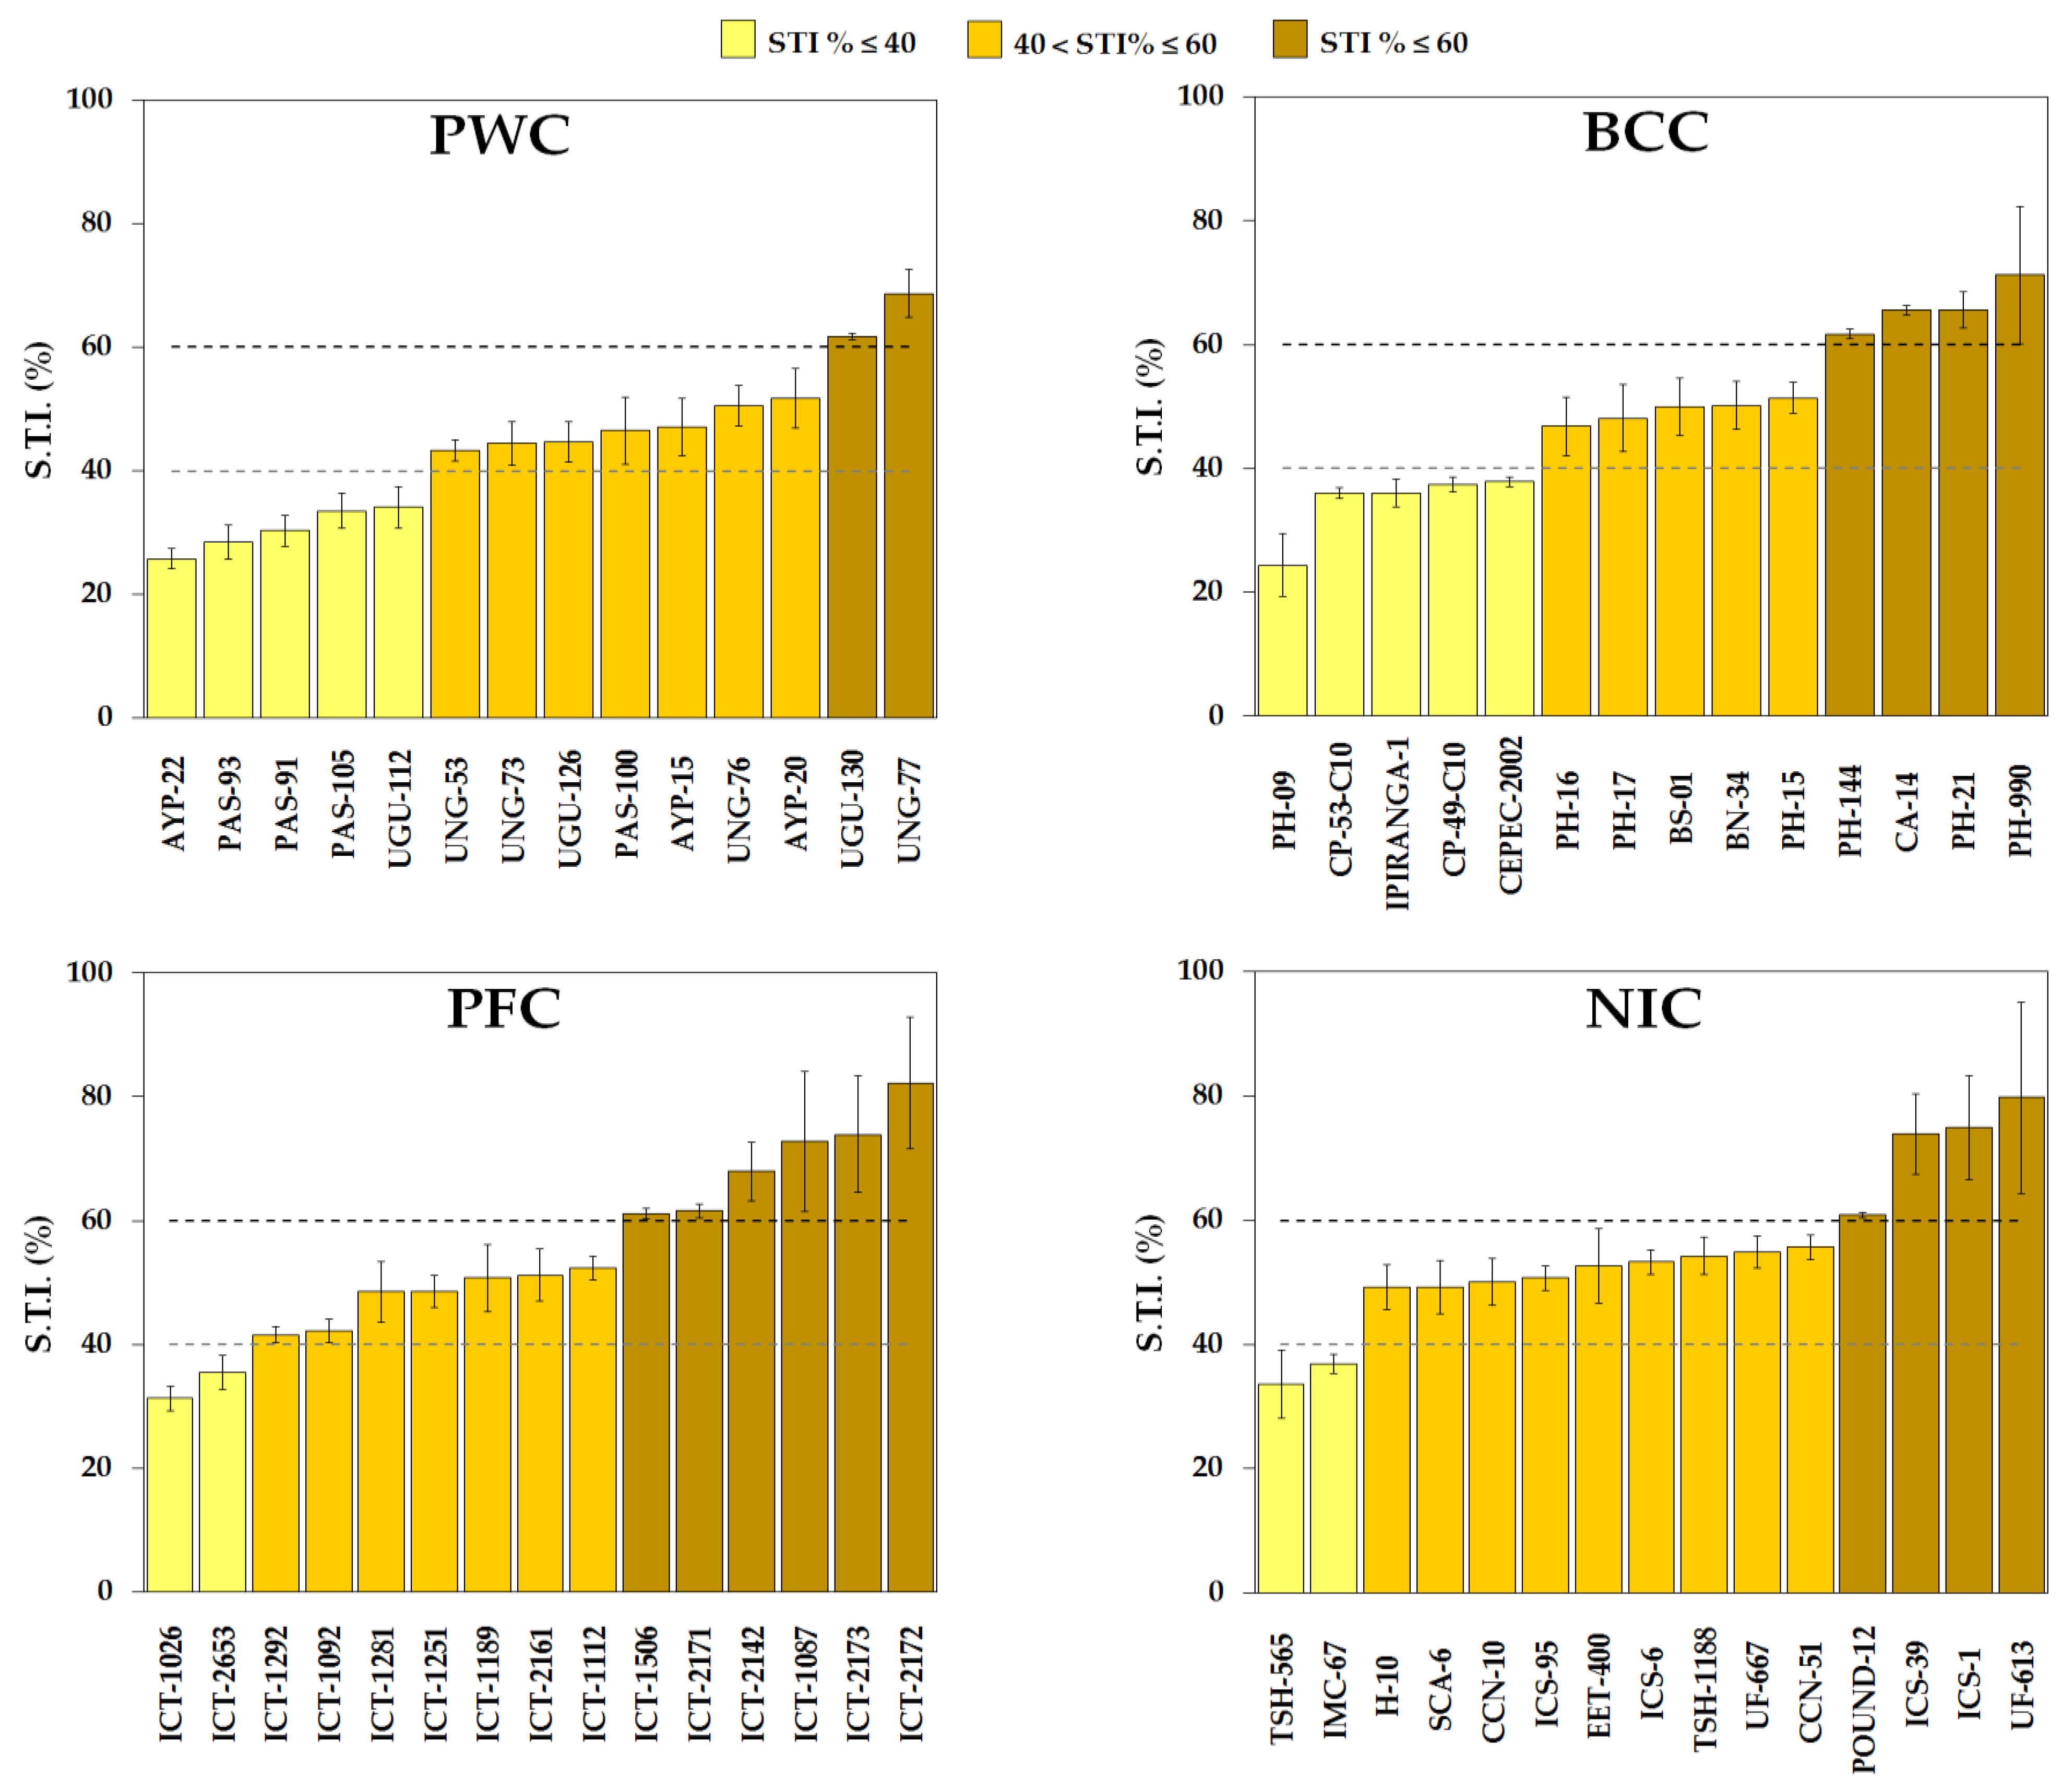
  • Genotypes were classified into 3 groups: sensitive to shade (STI% ≤ 40), medium shade-tolerant (40 < STI% ≤ 60), and tolerant to shade (STI% > 60).

2.6. Statistical Analysis

Statistical analyses of all of the parameters were performed using Infostat ver. 2020 [56] and consisted of a split-plot design under complete random distribution to compare means across two or more independent variables; in this case, shade was the main plot and cacao genotypes were subplots. The normality and homogeneity of each parameter were determined using the Shapiro–Wilk test and Q-Q plot. When the effect of interactions between factors was not statistically significant (α > 0.05) and the effect of a factor was significant, the analysis was extended to include a Scott–Knott test to compare means of the parameters.
Double bar graphs were drawn for NU and NUE, where the results of each nutrient are represented with comparisons between treatments: Shade—50% and Shade—80%, the average for each origin. For NUE, the x-axis is presented in a logarithmic scale to facilitate the interpretation of the results. “ns” indicates the results were not significant (p > 0.05).
Principal Component Analysis (PCA) using R software version 1.2.5042 was used to evaluate the general correlations between standardized data of biometric, physiological parameters, and nutrient uptake (NU) of cacao seedlings for genotypes sensitive to shade and tolerant to 50% and 80% shade. The objective of this analysis was also to assess differences in nutrition that would partially explain the mechanisms of shade tolerance in cacao. In this analysis, two principal components were used as they accounted for more than 50% of the variance of all variables for both 50% and 80% shade treatments.

3. Results and Discussion

Plants can adjust their morphology and physiology to a particular light environment. In the case of tropical and subtropical tree species, they have developed species-specific morphological and physiological features that allow them to optimize the capture of scarce solar radiation [37]. Larger leaf areas with anatomical properties associated with increased photosynthetic efficiency, in addition to an accumulation of anthocyanin, are some of the responses of trees to low and high irradiance levels [37,50] whereas root dry matter remains invariable, suggesting few anatomical or chemical changes [57].
Several authors have reported negative effects of shade on cacao growth [30,58], whereas greater chlorophyll contents [7] and higher photosynthetic rates related to water regime have been observed in plants under light shade, thus highlighting the genotypic differences as a response to shade [9,59]. The following sections summarize the results obtained in this study for 58 cacao genotypes subjected to 50% and 80% shade conditions.

3.1. Growth Parameters Influenced by Shade Levels

A lot of the growth parameter responses of cacao under different light regimes reported here are quite similar to most plants as well as a lot of the cacao literature cited (Table 2 and Table S1). The interactions between cacao genotypes and shade levels for biometric parameters were significant (p ≤ 0.05), except for leaf area (Table 2); however, for this parameter, significant differences were found between the shade levels and across genotypes (Table 2 and Table S1). These findings agree with those of a previous study conducted by Daymond et al. [60], in which leaf area varied significantly in eight cacao clones (AMAZ 15/15, ICS-1, IMC-47, MAN 15/2, SC-1, SCA-6, SPEC 54/1, UF-676) exposed to different levels of irradiance (0 to 696 µmol m−2 s−1). As highlighted by Acheampong et al. [9], genotypic differences in leaf area under different shade levels suggest differential partitioning of assimilates in response to light in terms of final biomass.
In most cases, mean values of shoot length, leaf area, root area, and shoot/root ratio per genotype were higher under 80% shade, and stem diameter, root dry weight, and total dry biomass were higher under 50% shade (Table 2 and Table S1). The slow growth of the length of the shoots at higher light levels is probably due to the limitations in the expansion of the leaves caused by greater transpiration; on the contrary, in low light conditions the greater growth is due to the plants seeking light [7], stem diameter increases under high light environments because the shoots are not growing as tall, and leaf area increases in low light in an attempt to capture more light [7,61]. The minimum values of leaf and root area were observed for the AYP-20 genotype at 50% and 80% shade. The lowest value of stem diameter, of 6.45 mm (80% shade), was recorded for the UGU-130 genotype (Table S1). The minimum values of shoot length were 23.07 cm (50% shade) and 33.07 cm (80% shade) for PH-09 and CA-14 (BCC), respectively (Table S1).
As reported by Galyuon et al. [12], cacao grown under full sunlight (1800 μmol m−2 s−1) and shade (900 μmol m−2 s−1) had different morphologies. Under full sunlight, leaf size, internode length, total leaf area, and dry matter per plant were significantly reduced, whereas leaf thickness and leaf number per plant were increased compared to plants grown in shade. In addition, cacao plants grown between 35% and 55% shade have a leaf area higher than those grown under heavy shade, whereas stem dry matter accumulation decreases as the level of shade increases [9].
Da Silva Branco et al. [10] evaluated the effects of four levels of shade (no shade, 50% 29%, and 22% of the incidence of radiation) and two levels of water regime (control and flooded plants) on cacao seedlings’ performance. They reported that responses of shoot length, stem diameter, leaf number, total leaf area, specific leaf area, root biomass, and total biomass varied by genotype, treatment, or combined effects. For example, leaf number and leaf area were reduced by increasing light intensity; by comparison, root length and collar diameter did not vary when exposed to different shade levels.
Similarly, stem diameter was found to be greater in cacao monocultures, followed by agroforestry and successional agroforestry systems, in a long-term field trial in Alto Beni, Bolivia [18]. Nevertheless, the production system (full-sun monoculture, agroforestry system, both under organic and conventional farming, and a highly diverse successional agroforestry system under organic farming) did not affect root length, surface area, specific root length, specific root area, or diameter [62]. However, in the highly successional agroforestry system, root volume and biomass were higher than those found in the agroforestry system [62]. These results are in agreement with our findings (Table 2). An investment in root growth is most relevant in plants under high rather than low light intensity to provide a large surface for evapotranspiration and to maintain cell turgor pressure [10].
A maximum shoot/root ratio was recorded for the AYP-15 cacao genotype (PWC) for both shade levels. The highest values of root dry weight, of 12.65 and 5.70 g plant−1, were noted for the genotypes ICT-1112 (PFC) and CCN-51 (NIC) at 50% and 80% shade, respectively. The genotypes having the highest total dry weight were PAS-91, 42.38 g plant−1 (50% shade), and ICT-1087, 26.77 g plant−1 (80% shade) (Table S1). Baligar et al. [43] observed an increase in biomass accumulation in cacao roots, leaves, stems, and shoots in a greenhouse experiment when PPFD increased from 65 to 190 µmol m2 s−1 (high to medium shade), which also entailed a reduction in leaf area and leaf specific area. Recently, Baligar et al. [61] reported that, in seven genetically different cacao genotypes, increasing PPFD from 100 to 400 μmol m−2 s−1 increased shoot and root growth, relative growth rate (RGR), and net assimilation rate (NAR). Moreover, cacao grown under two shaded systems, one with N-fixing legume trees and one with different shade trees, compared to a monoculture system, had higher stem density, shoot:root ratio, and above-ground and root biomass, but a similar tree height and a lower stem diameter [19].

3.2. Physiological Parameters Influenced by Shade

The interaction between cacao genotypes and shade levels was significant for the physiological parameters (Table 3).
An increase in chlorophyll content (SPAD unit) was observed in cacao seedlings under 80% shade compared to 50% shade, with some exceptions across genotypes. By contrast, overall stomatal conductance was higher in plants grown under 50% shade; however, there were some exceptions in genotypes of PFC and NIC (Table 3).
The maximum level of chlorophyll content at 50% shade was 34.70 SPAD for the UGU-130 genotype, whereas at 80% shade it was 34.50 SPAD for AYP-15; both were from PWC. The range of observed stomatal conductance was between 104.57 and 363.03 mmol m−2 s−1 at 50% shade for UGU-112 and PH-21, respectively, and between 47.33 and 260.67 mmol m−2 s−1 at 80% shade for UGU-126 and H-10, respectively (Table S2).
Concerning chlorophyll content, shade adapted plants tend to have greater concentrations of chlorophyll to capture more light [32]. Shade leaves in cacao often exhibit greater total chlorophyll concentrations per unit mass than sun leaves [32]. Almeida and Valle [63] and Daymond and Hadley [59] reported a consistent decline in chlorophyll content with increasing light in three cacao genotypes, and this factor can vary considerably over time. Moreover, Acheampong et al. [64] reported that no clear pattern was observed for leaf chlorophyll in cacao genotypes grown under three shade levels provided by plants and under fertilizer application. Our results show either a reduction in leaf chlorophyll content as PPFD increases or little variation between shade levels (Table 3 and Table S2).
Acheampong et al. [9] conducted a study with four cacao genotypes (T 79/501, PA-150, SCA-6, and P-30) and subjected them to three shade levels (32.5%, 55%, and 76%) during two seasons of growth (dry and rainy). They reported that stomatal conductance was higher in seedlings under heavy shade during the dry season, and lower in the rainy season for seedlings under lighter shade. As a consequence, photosynthesis rates were higher in the wet season for cacao under medium and light shade. The results from one crop year for the same genotypes grown under three shade levels provided by plants and under fertilizer application showed that a higher stomatal conductance was related to an increase in shade, but only for two genotypes [64]. However, the opposite trend was observed in our study, in which stomatal conductance decreased with higher shade (Table 3 and Table S2); this was shown by the overall results and specific values for the SCA-6 cacao genotype (Table S2). Overall stomatal conductance was higher in plants grown at low shade (50% shade); however, there were some exceptions in genotypes of PFC and NIC (Table S2).
The evaluation of stomatal conductance in nine cacao genotypes (TCS-13, TCS-19, SCC-53, SCC-82, SCC-83, CCS-73, CCS-77, CCS-80, and ICS-95) grown in two agroforestry systems in Colombia with a maximum irradiance of 2100 and 1800 μmol m−2 s−1 showed lower stomatal conductance for the former, due to a lower transpiration rate associated with low water bioavailability in the soil [65]; this is in alignment with our overall results.
Nevertheless, if we only consider the ICS-95 genotype, a slight increase in stomatal conductance was observed when exposed to a higher PPFD (Table S2). Da Silva Branco et al. [10] found that a decrease in stomatal conductance in TSA-792 and TSH-774 cacao genotypes was observed when plants were subjected to flooding, but not when the light intensity was attenuated. These results were attributed to an accumulation of abscisic acid (ABA) with the increase in shading density, which regulated the stomatal opening. The opposite was observed in our study, in which a decrease in stomatal conductance in TSH cacao genotypes was recorded when seedlings were exposed to a higher shade level (Table S2).
Under field conditions, Jaimez et al. [66] reported that an increase in PPFD (from 400 to 1000 μmol m−2 s−1) in a 7-year-old cacao plot in Ecuador involved an increase in net photosynthetic rate, while high stomatal conductance was maintained, although in some cases greater stomatal conductance at a low PPFD (high shade) was recorded for some genotypes. Baligar et al. [44] reported that stomatal conductance (around 0.02 mol m−2 s−1) in three cacao genotypes (CCN-51, LCT EEN 37/A, and VB 1117) was not significantly affected by PPFD in the range of 50 to 400 μmol m−2 s−1. Nonetheless, maintaining a high conductance at very low irradiance may be an advantage to understory plants, by allowing photosynthesis to respond rapidly to sunflecks.
When cacao leaves were continually exposed to light intensities higher than half of that in which instantaneous maximum photosynthesis occurred (about 350–400 μmol m−2 s−1, which is nearly 20% of the intensity of full sunlight), the rate of photosynthesis began to decline after four hours. At light intensities higher than 100% of saturating photosynthetic intensity, the decline began almost immediately, causing a certain degree of photoinhibition [39]. Taking into account these findings, our results indicate that shade levels of 50% (PPFD of 1000 ± 50 μmol m−2 s−1) may be too high and may cause some form of stress in terms of chlorophyll content, whereas the increase in stomatal conductance was probably due to an increase in leaf temperature under 50% shade.
In this study, WUE was significantly affected by shade, genotypes, and their interaction. WUE tended to decrease significantly with the increase in shade (Table 3). The average observed WUE under 50% shade was 1.32 g L−1, which was significantly higher than the value of 1.12 g L−1 obtained under 80% shade (Table S2). Similar tendencies were reported by Lopez-Marin et al. [67], with a negative correlation between shade levels and WUE in a greenhouse experiment with sweet pepper plants, in which the highest values were registered under non-shaded conditions. In addition, Yang [68] found similar tendencies in forages. In cacao growing under high and low PPFD, Jaimez et al. [66] found that WUE showed a negative linear relationship with light level. In addition, the high WUE observed in the evaluated clones under 50% shade (Table 3 and Table S2) indicated the possibility of growing these cacao genotypes with less shade. In contrast, in a study of coffee in the dry season, Baliza et al. [69] found WUE increased as shade increased to 50%, before decreasing under higher levels of shade. In the current study, the maximum levels of WUE, of 1.77 g L−1 and 1.81 g L−1, were recorded for the ICT-1087 genotype (PFC) under 50% and 80% shade, respectively. The high WUE recorded in this genotype could be related to its overall highest shoot and root dry biomass under both levels of shade (Table S2).

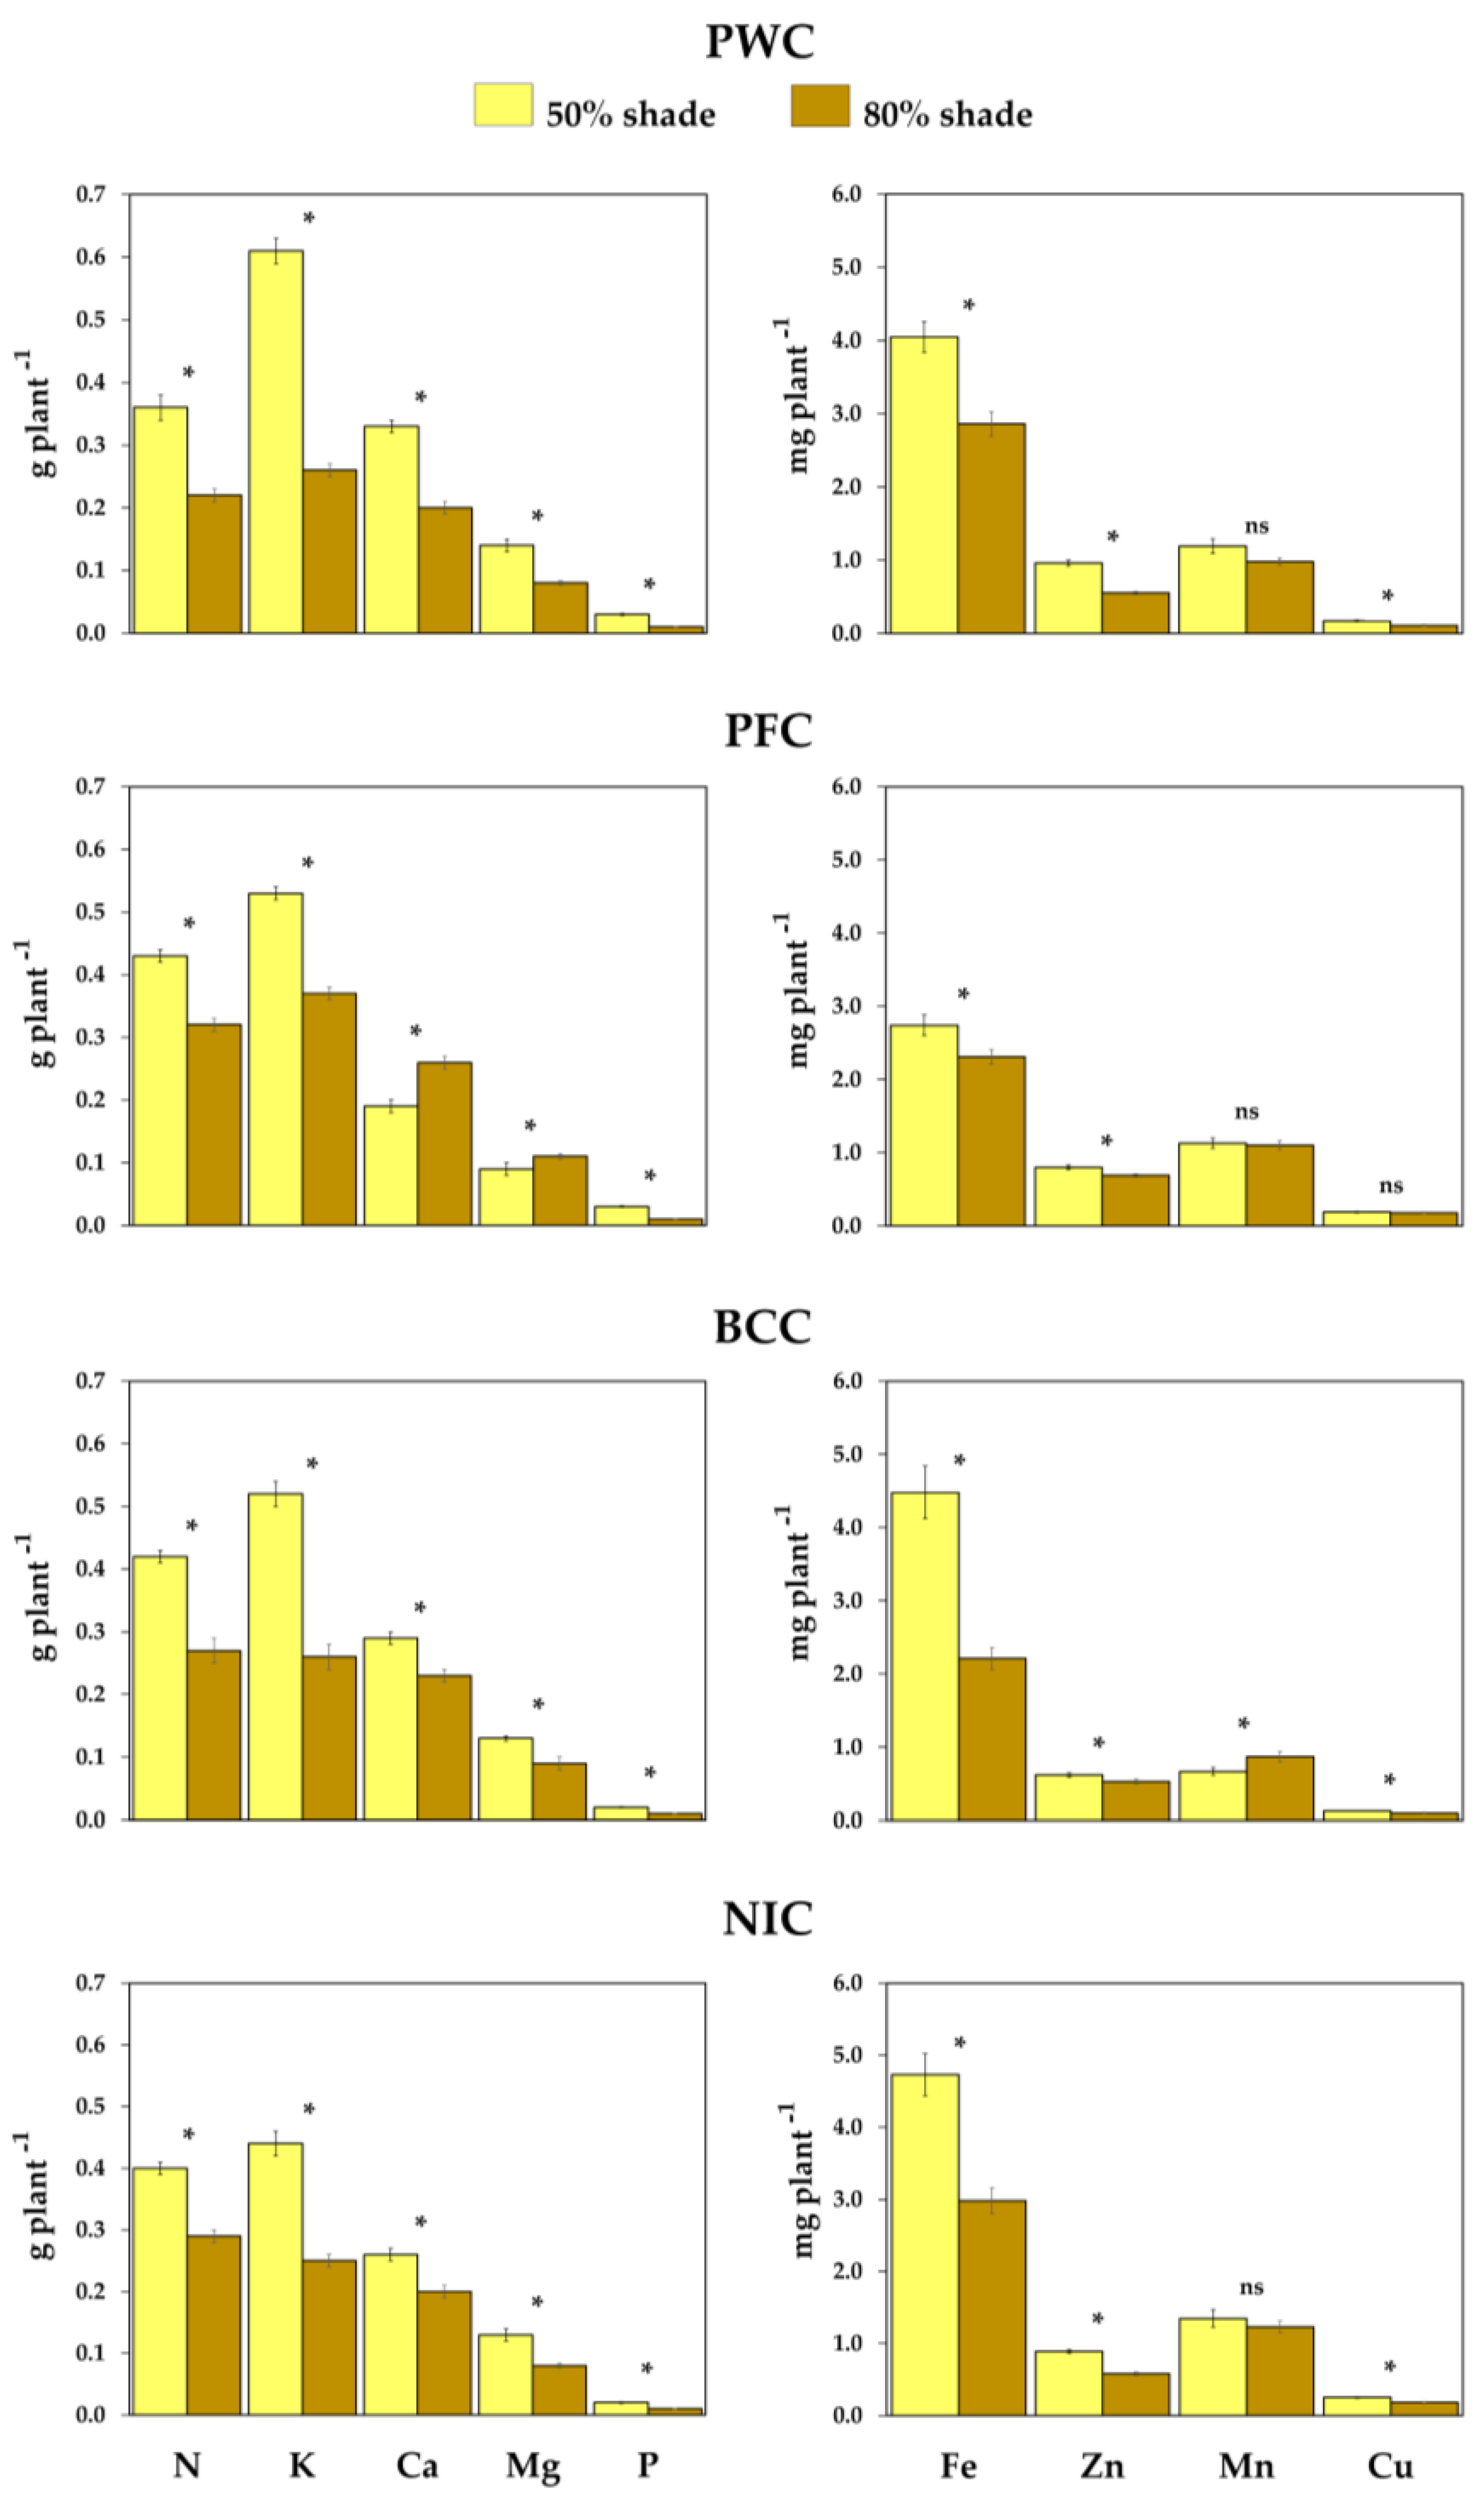
3.3. Nutritional Status Influenced by Shade

Numerous effects of shade on cacao are not well understood, including the differences in response to specific nutrients under shade [26]. Some cacao varieties are more nutrient demanding than others [61]. In soils with low fertility, shade acts as a buffer that reduces metabolic activity, which also reduces nutrient uptake. Cacao trees without shade demand higher quantities of nutrients than shaded trees: the former may contain higher levels of N and K than the latter, which have higher levels of P, Ca, and Mg [70].
Murray [71] reported that cacao leaves under shade had higher levels of nutrients than unshaded leaves. In a long-term study, Ahenkorah et al. [72] reported the beneficial effects of fertilization on cacao yield without shade. Macronutrient and micronutrient concentrations by genotype and shade level are given in Table 4. Overall macronutrient and micronutrient concentrations were at adequate levels; however, concentrations of K, Ca, and Mg were slightly higher, and P concentrations were slightly lower than the reported adequate levels in cacao [71,72,73,74,75].
In the current study, the interaction between cacao genotype and shade level was significant for macronutrient and micronutrient concentrations, except for N. The concentrations of all macronutrients (except for P and K) and all micronutrients were higher under 80% shade than 50% shade, and significant differences were observed between the two shade levels and across genotypes (Table 4, Tables S3 and S4). An increase of nearly 25% in the N concentration was recorded for cacao genotypes grown under the 80% shade level, contrary to the findings reported by Cabala Rosand et al. [70].
Overall, cacao genotypes from the four collections showed decreases in Ca concentration when grown under 50% shade. The highest concentrations of P were 1.77 and 0.99 g kg−1 for the AYP-15 (50% shade) and ICT-1281 (80% shade) genotypes, respectively (Table S3).
Slight differences were noted between cacao genotypes on leaf nitrogen concentration with respect to shade treatments, which increased with increasing shade, contrary to P, which had a higher concentration under low shade. For K concentration, decreases in shade were associated with higher leaf K; however, no significant differences were observed between the shade levels (Table 4 and Table S3).
Overall micronutrient concentrations increased significantly as shade increased 50% to 80% (Table 4). Regarding micronutrients, Fe concentration under 50% shade ranged from 72 to 346 mg kg−1 for ICT-1189 and CP-53-C10, respectively, and from 120 to 389 mg kg−1 for CEPEC-2002 and UF-667 at 80% shade, respectively (Table S4). The lowest concentrations for Cu were nearly 5 mg kg−1 for the CP-49-C10 and UGU-112 genotypes at 50% and 80% shade, respectively (Table S4). The Zn concentration at 50% shade ranged from 21.06 to 47.89 mg kg−1 for IPIRANGA-1 and UNG-77, respectively, whereas at 80% shade the concentration ranged from 36.85 to 76.39 mg kg−1 for PH-21 and AYP-22, respectively. Finally, Mn concentration at 50% shade ranged from 18.42 to 100.1 mg kg−1 for CA-14 and UF-667, respectively, whereas at 80% shade, it ranged from 50.23 to 155.58 mg kg−1 for UNG-53 and PH-17, respectively (Table S4).
Significant differences were observed in nutrient uptake between the shade levels within each cacao collection, except for Mn (PWC, PFC, and NIC) and Cu (BCC) (Figure 2); and K, Mg, and P NUE (NIC), and Fe NUE (BCC and NIC) (Figure 3).
Under 50% shade, the highest uptakes of K, Ca, Mg, P, and Zn were found in PWC, with values of 0.61, 0.33, 0.14, and 0.03 g plant−1 and 0.96 mg plant−1, respectively; whereas at 80% shade, the highest uptakes of N, K, Ca, Mg, Cu, and Zn were found in PFC, with values of 0.32; 0.37, 0.26, and 0.11 g plant−1; and 0.18 and 0.69 mg plant−1, respectively. The NIC under 50% and 80% shade showed the highest nutrient uptake values for Fe (4.73 and 2.98 mg plant−1, respectively), Mn (1.35 and 1.23 mg plant−1, respectively), and Cu (0.25 and 0.18 mg plant−1, respectively) (Figure 2).
In a field study conducted in an 8-year-old cacao plantation with different shade trees, and compared to a monoculture system, in Ghana, Isaac et al. [76] noted that nutrient uptake by cacao increased under shade (43–80% and 22–45% for N and P, respectively), and K (96–140%) was the most responsive nutrient.
Baligar et al. [43] conducted a greenhouse experiment in which cacao was grown at three shade levels: high, medium, and low shade (PPFD of 65 ± 25, 190 ± 46, and 1050 ± 260 µmol m−2 s−1, respectively)—combined with two levels of CO2 (380 and 700 µmol mol−1). Nutrient uptake (or content) was in the range of 158 to 168, 82 to 146, 40 to 86, 38 to 55, and 7.5 to 10 mg plant−1 for N, K, Ca, Mg, and P, respectively, and in the range of 44 to 69, 410 to 538, 1127 to 1764, and 444 to 731 µg plant−1 for Cu, Fe, Mn, and Zn, respectively. At ambient CO2 (380 µmol mol−1), an increase in PPFD to 1050 µmol m−2 s−1, except for K and Mn content, had a negative effect on all the essential macro- and micronutrient contents. This reduction in nutrient uptake could be attributed to a reduction in dry matter accumulation at a very high level of PPFD.
Our values for U were higher than those reported by Baligar et al. [43], and higher at 1000 ± 50 (50% shade) than at 400 ± 50 µmol m−2 s−1 (80% shade). These differences could be because, in the current study, plants were grown for a longer period (180 days vs. 57 days) and with a wide collection of cacao genotypes.
Significant differences were observed in NUE of macronutrients and micronutrients between the shade levels and within each cacao collection (Figure 3). With the exception of NUE for P in PWC, PFC, and BCC, and K in PWC and BCC, increasing shade from 50% to 80% reduced NUE for all the nutrients. However, Baligar et al. [43] reported that at ambient CO2 (380 µmol mol−1), increasing PPFD from 65 to 1050 µmol m−2 s−1 decreased the NUE of all macronutrients and micronutrients, with the exception of NUE for N and Ca, which increased. In a recent study, Baligar et al. [61] showed that increasing PPFD from 100 to 400 µmol m−2 s−1 increased uptake and NUE for all macro- and micronutrients in seven cacao genotypes.

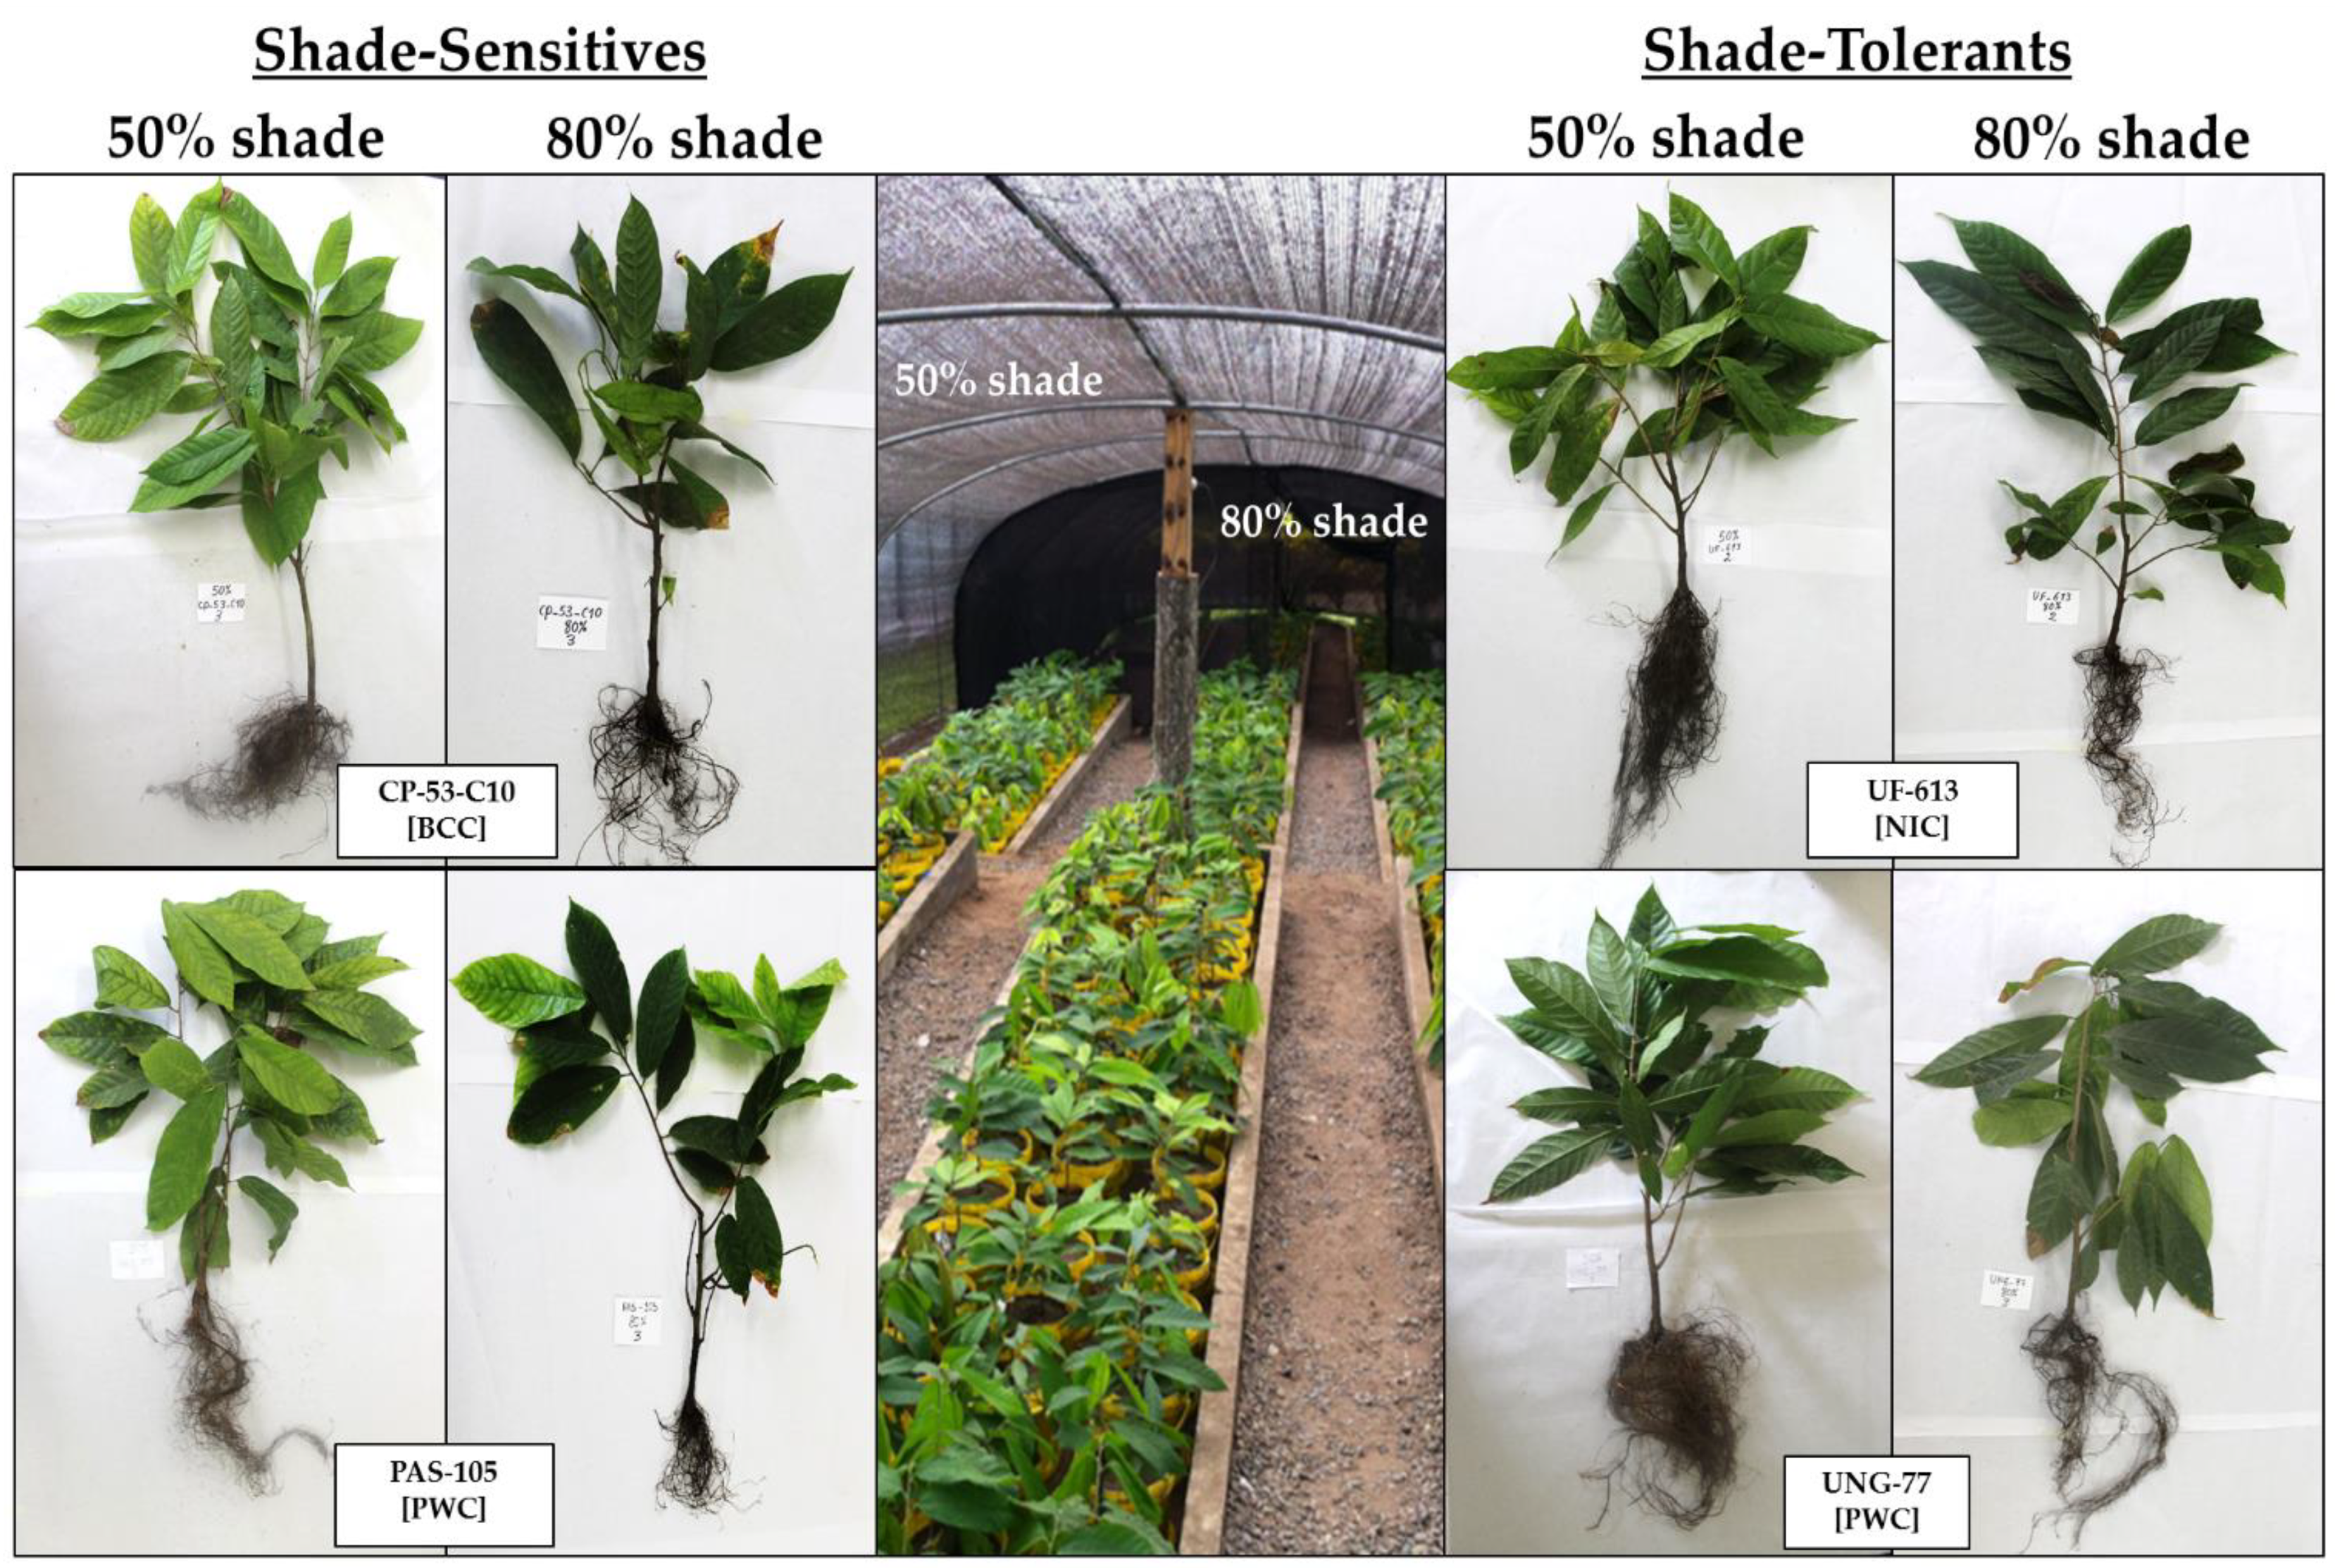
3.4. Cacao Genotypes Tolerant to Shade

Shade tolerance is a complex property of plants that is achieved by different sets of responses, such as alterations in leaf physiology and biochemistry, leaf anatomy and morphology, and/or plant architecture [4]. Many methods have been proposed to measure the degree of shade tolerance of several plant species, such as sapling ratios (number of saplings growing in a low-light environment over the total abundance of the species), abundance-based index (number of stems, leaf density), mortality rate, and relative growth (which is assumed to be larger in shade-tolerant species) [1,2]. Differences observed in shade tolerance are mostly related to variations among the species’ adaptations of their photosynthetic apparatus to low light intensity. The effective growth of plants at low irradiance requires the capacity to efficiently catch the available light and convert it into chemical energy, maintain a low rate of respiration, and use a large fraction of the carbohydrate pool for leaf growth [39,57]. In contrast, shade-intolerant species tend to respond to high light regimes with a significant increase in photosynthetic capacity, reduced leaf expansion, decreased branching, and early flowering. These responses are known as shade avoidance syndrome (SAS), which is one of the best-studied forms of plant phenotypic plasticity [4,77].
In our study, significant differences were observed across cacao genotypes regarding STI, in addition to a moderate variability within replicates. This index varied from 25.72% to 76.15% for AYP-22 (PWC) and ICS-1 (NIC) genotypes, respectively (Table S2, Figure 4).
The genotypes sensitive to shade were: AYP-22, PAS-91, PAS-93, PAS-105, and UGU-112 from PWC; ICT-1026 and ICT-2653 from PFC; PH-09, IPIRANGA-1, CP-53-C10, CP-49-C10, and CEPEC-2002 from BCC; and TSH-565 an IMC-67 from NIC (Figure 4). By contrast, cacao genotypes tolerant to shade were: UGU-130 and UNG-77 from PWC; ICT-1506, ICT-2171, ICT-2142, ICT-1087, ICT-2172, and ICT-2173 from PFC; PH-144, PH-21, CA-14, and PH-990 from BCC; and POUND-12, UF-613, ICS-39, and ICS-1, from NIC. The remaining genotypes were classified as medium shade-tolerant (Figure 4).
The growth characteristics of some shade-sensitive cocoa genotypes (CP-53-C10 [BCC] and PAS-105 [PWC]), and shade-tolerant cocoa genotypes (UF-13 [ NIC] and UNG-77 [PWC] subject to 50% and 80% shade are shown in Figure 5.

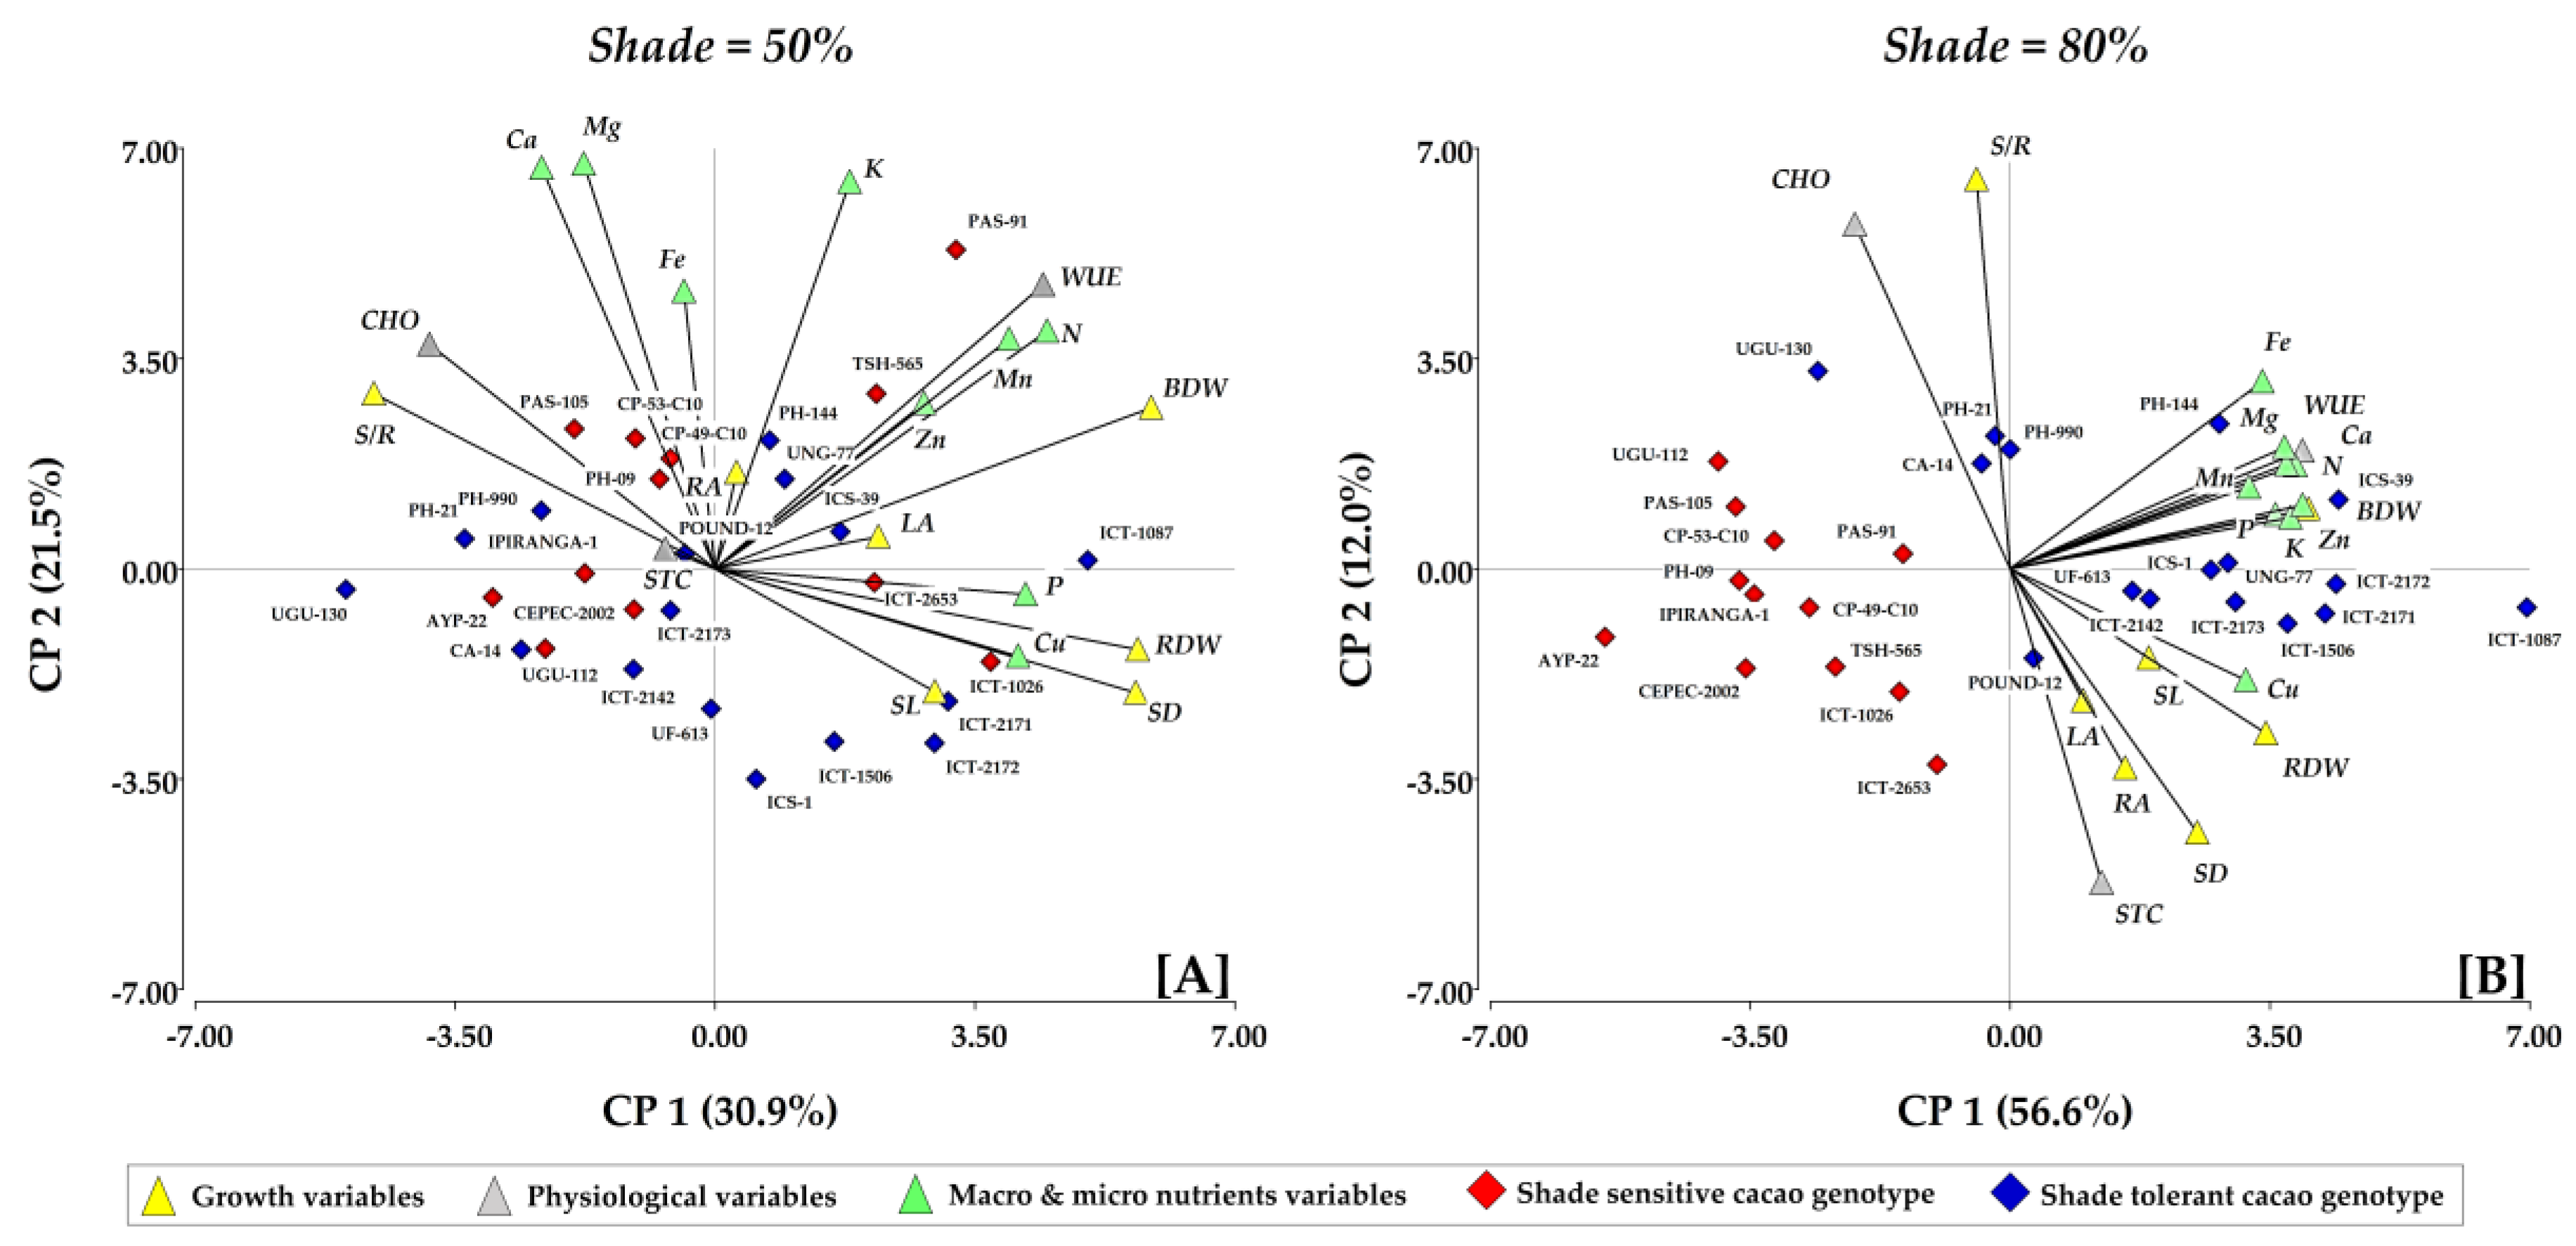
3.5. Interaction between Growth, Physiological Parameters, and Nutrient Uptake

The results of the general PCA for the growth, physiological, and nutrient uptake variables under two levels of shade with sensitive and tolerant cacao genotypes are shown in Figure 6. The first two PCA axes explained 54.5% of the overall variation of genotypes under 50% shade (Figure 6A) and 69.2% of the overall variability of genotypes under 80% shade (Figure 6B).
Under 50% shade, the first PCA axis accounted for 31.6% of the overall variation and was related to negative values with high values of S/R, and positive values with high values of CHL, Ca, and Mg, which were positively correlated among themselves and negatively correlated with SL, SD, RDW, and Cu; the sensitive genotypes PAS-105, CP-53-C10, PH-09, and CP-49-C10 were related to Ca, Mg, and Fe uptake. Positive values related to genotypes with high values of BDW, SD, RDW, WUE, N, K, Mn, P, and Cu, which were also positively correlated among themselves. Proportions of 71.4% and 37.5% of sensitive and tolerant genotypes, respectively, were related to macro- and micronutrients, CHL, and WUE. The second principal component, which explained 22.9% of the overall variance, was represented mainly by variations in negative values of growth parameters (RDW, SD, SL, LA, RA) and Cu uptake, and by variations in positive values of the remainder of the nutrient and physiological parameters. The axis divided positively 71.4% of sensitive genotypes, and 50% of tolerant genotypes.
Under 80% shade, the first PCA axis accounted for 56.5% of the overall variation and was related to negative values of CHL and S/R, and divided 100% and 12.5% of sensitive and tolerant genotypes, respectively. In positive values, we found that all shade-tolerant genotypes were related to physiological parameters and nutrient uptake.
Based on these results, we can infer that the sensitive and tolerant genotypes have better development at 50% shade, whereas at 80% shade the tolerant genotypes are directly related to nutrient uptake, physiology, and growth parameters. This characteristic of shade-tolerant genotypes permits better development of plants and selection of genotypes that withstand the high level of shade, whereas the sensitive genotypes do not have a positive relationship with the nutrient uptake, physiology, and growth parameters.
Shade intolerant species usually exhibit greater physiological plasticity, which allows them to achieve rapid growth rates, probably associated with more effective net assimilation rates than with structural traits [39,78] The increase in light intensity when photosynthesis and growth rate are faster causes a decrease in total N in the leaf (which is the source of proteins, chlorophyll, etc.) and a decrease in P. This implies that P uptake cannot keep up with increased growth at higher light levels [57].
In cacao genotypes sensitive to shade, it is expected that growth parameters have a strong correlation with almost all nutrients, which is the case of RDW in tolerant genotypes. By comparison, only shade-sensitive cacao genotypes showed a positive correlation between RDW and N content in the aboveground tissues. This is probably because a long and branched root system is necessary to increase water and nutrient capture [79], which may be reduced under heavy shade conditions.
Under controlled conditions, some plants grown hydroponically have shown a decline in chlorophyll content as the Mn concentration increased [80,81], whereas in other cases chlorophyll content decreased as the Mn content decreased [82]. In the case of cacao, all genotypes showed a negative but not significant correlation between these two parameters.
Finally, shade-sensitive and tolerant cacao genotypes exhibited negative correlations between Cu and chlorophyll content. Several authors observed that increasing levels of Cu in the nutrient solution or in soil were associated with a decrease in stomatal conductance, which causes a decline in photosynthetic gas exchange [83,84,85], or that an increase in Cu lowered the leaf chlorophyll concentration, enhancing sensitivity to photoinhibition [86].

4. Conclusions

The quality and quantity of PPFD that reaches the canopy of cacao trees leaves grown in field conditions are very different than PPFD that reaches the canopy of cacao leaves under artificial shade. In field-grown cacao upper story tree leaves filter out most of the light so the red: far-red ratio changes depending on the greater or lesser absorbance and/or transmittance of electromagnetic light. Therefore, the cacao genotypes’ responses to two levels of shade (PPFD) in this research are based on response to artificial shade
Fifty-eight cacao genotypes grown under greenhouse conditions and subjected to 50% shade (PPFD of 1000 ± 50 μmol m−2 s−1) and 80% shade (PPFD 400 ± 50 μmol m−2 s−1) were evaluated to determine their growth, physiological, and nutrient-use-efficiency responses, and tolerance to shade. For almost all growth, physiological, and nutritional parameters, interactions between shade levels and genotypes were statistically significant; therefore, it was not possible to establish significant differences for each factor individually. Only maximum root length, leaf area, N concentration, Cu content, and Cu efficiency appeared to vary significantly between shade levels and across genotypes.
Overall results suggest that heavy shade negatively affects cacao, except for shoot length, leaf and root area, shoot/root ratio, and chlorophyll content, which were usually higher at 80% than at 50% shade.
From the wild cacao, Peruvian farmers (or ICT), Brazilian, and national and international cacao collections, only 28% of the cacao genotypes evaluated were identified as being tolerant to shade, whereas 21% were sensitive to shade.
Total dry weight and WUE showed a strong relationship with almost all macronutrient and micronutrient contents in cacao plants that were tolerant to shade. In addition, these plants also had a higher total dry biomass than the sensitive genotypes.
The cacaos with shade-tolerant were, from PWC: UNG-77 and UGU-130; from PFC: ICT-1506, ICT-2171, ICT-2142, ICT-1087, ICT-2173; from BCC: PH-144, CA-14, PH-21 and PH-990; from NIC: POUND-12, ICS-39, ICS-1 and UF-613.
The results of this study indicate that cacao genotypes adapted to unfavorable conditions, such as high shade, could be used in breeding programs as a strategy to breed shade-tolerant cacao cultivars, thereby maintaining sustainable cacao production under agroforestry systems.

Supplementary Materials

The following are available online at https://www.mdpi.com/article/10.3390/agronomy11081536/s1, Table S1: Growth parameters (mean values per plant) of cacao genotypes from different origins subjected to two levels of shade (50% and 80%); Table S2: Physiological parameters (mean values)- and Shade Tolerance Index (STI) for 58 cacao genotypes subjected to two levels of shade (50 and 80%); Table S3: Mean concentrations of macronutrients (g kg−1) in shoots of 58 cacao genotypes subjected to two levels of shade (50 and 80%); Table S4: Mean concentration of micronutrients (mg kg−1) in shoots of 58 cacao genotypes subjected to two levels of shade (50 and 80%).

Author Contributions

E.A.-G. implemented the original idea, planned the experimental details, wrote the manuscript, carried out the research and data analysis. A.F. collected and compiled the reported data. F.B. took the lead in writing the manuscript, organized and interpreted the data, and conducted the statistical analysis. C.O.A.-H. performed the plant analysis and worked out the correlation matrix of all the observed parameters. L.B.Z.-C. assisted with the implementation and data analysis. J.A. assisted with planning and implementation of the experiment. V.C.B. conceived the study and was in charge of the overall direction and planning. All authors provided critical feedback during the writing process. All authors have read and agreed to the published version of the manuscript.

Funding

This research was supported by the project 428-PNICP-PIAP-2014/Fincyt and the project NACA 58-1275-7-112F and 58-1275-2-090F of USDA-ARS-ICT partially supported the lab and greenhouse activities of this research project.

Data Availability Statement

Data presented in this study are available on request from the corresponding author.

Acknowledgments

The project 428-PNICP-PIAP-2014/Fincyt and the project NACA 58-1275-7-112F and 58-1275-2-090F of USDA-ARS-ICT partially supported the lab and greenhouse activities of this research project. We thank Andrew Daymond, School of Agriculture, Policy and Development, University of Reading, Whiteknights, Reading, UK for providing the CFC/ICCO/Biodiversity Clones used in this research; also, we thank Raul Valle of CEPLAC/CEPEC (Comissao Executiva do Plano da Lavoura Cacaueira/Centro de Pesquisas de Cacau), Ilhues/Itabuna, Bahia, Brazil for providing the Brazilian clones used for this research. We thank Lucinda Vela Vargas and Juan Arévalo-Gardini, for management of the field research of ICT. Technical and logistical facilities for the field research and laboratory analytical facilities, provided by Instituto de Cultivos Tropicales (Tropical Crops Institute)—ICT/CITE Cacao y Otros Cultivos Tropicales (Productive Innovation and Technology Transfer Centre (CITE) of Cacao and Other Tropical Crops) and the Universidad Nacional Autonoma de Alto Amazonas (UNAAA), Yurimaguas, Peru are greatly appreciated. We thank Marshall Elson for an excellent review of this paper.

Conflicts of Interest

The authors declare no conflict of interest.

References

  1. Feng, J.; Zhao, K.; He, D.; Fang, S.; Lee, T.; Chu, C.; He, F. Comparing shade tolerance measures of woody forest species. PeerJ 2018, 6, e5736. [Google Scholar] [CrossRef] [PubMed]
  2. Lienard, J.; Florescu, I.; Strigul, N. An appraisal of the classic forest succession paradigm with the shade tolerance index. PLoS ONE 2015, 10, e0117138. [Google Scholar] [CrossRef] [PubMed] [Green Version]
  3. Valladares, F.; Laanisto, L.; Niinemets, Ü.; Zavala, M.A. Shedding light on shade: Ecological perspectives of understorey plant life. Plant Ecol. Divers. 2016, 9, 237–251. [Google Scholar] [CrossRef] [Green Version]
  4. Martínez-García, J.F.; Galstyan, A.; Salla-Martret, M.; Cifuentes-Esquivel, N.; Gallemí, M.; Bou-Torrent, J. Regulatory components of shade avoidance syndrome. In Advances in Botanical Research; Elsevier: Amsterdam, The Netherlands, 2010; pp. 65–116. [Google Scholar] [CrossRef]
  5. Semchenko, M.; Lepik, M.; Götzenberger, L.; Zobel, K. Positive effect of shade on plant growth: Amelioration of stress or active regulation of growth rate?: Effects of shade on plant growth. J. Ecol. 2012, 100, 459–466. [Google Scholar] [CrossRef]
  6. Lahive, F.; Hadley, P.; Daymond, A.J. The physiological responses of cacao to the environment and the implications for climate change resilience. A review. Agron. Sustain. Dev. 2019, 39, 5. [Google Scholar] [CrossRef] [Green Version]
  7. Almeida, A.-A.F.; de Valle, R.R. Ecophysiology of the cacao tree. Braz. J. Plant Physiol. 2007, 19, 425–448. [Google Scholar] [CrossRef] [Green Version]
  8. Rice, R.A.; Greenberg, R. Cacao Cultivation and the Conservation of Biological Diversity. AMBIO J. Hum. Environ. 2000, 29, 167–173. [Google Scholar] [CrossRef]
  9. Acheampong, K.; Hadley, P.; Daymond, A.J. Photosynthetic activity and early growth of four cacao genotypes as influenced by different shade regimes under West African dry and wet season conditions. Exp. Agric. 2013, 49, 31–42. [Google Scholar] [CrossRef] [Green Version]
  10. Da Silva Branco, M.C.; De Almeida, A.-A.F.; Dalmolin, Â.C.; Ahnert, D.; Baligar, V.C. Influence of low light intensity and soil flooding on cacao physiology. Sci. Hortic. 2017, 217, 243–257. [Google Scholar] [CrossRef]
  11. Galyuon, I.K.A.; McDavid, C.R.; Lopez, F.B.; Spence, J.A. The effect of irradiance level on cocoa (Theobroma cacao L): I. Growth and leaf adaptations. Trop. Agric. 1996, 73, 23–28. [Google Scholar]
  12. Galyuon, I.K.A.; McDavid, C.R.; Lopez, F.B.; Spence, J.A. The effect of irradiance level on cocoa (Theobroma cacao L.): II. Gas exchange and chlorophyll fluorescence. Trop. Agric. 1996, 73, 29–33. [Google Scholar]
  13. Jagoret, P.; Ngnogue, H.T.; Malézieux, E.; Michel, I. Trajectories of cocoa agroforests and their drivers over time: Lessons from the Cameroonian experience. Eur. J. Agron. 2018, 101, 183–192. [Google Scholar] [CrossRef]
  14. Nijmeijer, A.; Lauri, P.-E.; Harmand, J.-M.; Freschet, G.T.; Essobo Nieboukaho, J.-D.; Fogang, P.K.; Enock, S.; Saj, S. Long-term dynamics of cocoa agroforestry systems established on lands previously occupied by savannah or forests. Agric. Ecosyst. Environ. 2019, 275, 100–111. [Google Scholar] [CrossRef]
  15. Saj, S.; Durot, C.; Mvondo Sakouma, K.; Tayo Gamo, K.; Avana-Tientcheu, M.-L. Contribution of associated trees to long-term species conservation, carbon storage, and sustainability: A functional analysis of tree communities in cacao plantations of Central Cameroon. Int. J. Agric. Sustain. 2017, 15, 282–302. [Google Scholar] [CrossRef]
  16. Tscharntke, T.; Clough, Y.; Bhagwat, S.A.; Buchori, D.; Faust, H.; Hertel, D.; Hölscher, D.; Juhrbandt, J.; Kessler, M.; Perfecto, I.; et al. Multifunctional shade-tree management in tropical agroforestry landscapes—A review: Multifunctional shade-tree management. J. Appl. Ecol. 2011, 48, 619–629. [Google Scholar] [CrossRef] [Green Version]
  17. Asante, W.A.; Acheampong, E.; Kyereh, E.; Kyereh, B. Farmers’ perspectives on climate change manifestations in smallholder cocoa farms and shifts in cropping systems in the forest-savannah transitional zone of Ghana. Land Use Policy 2017, 66, 374–381. [Google Scholar] [CrossRef]
  18. Niether, W.; Armengot, L.; Andres, C.; Schneider, M.; Gerold, G. Shade trees and tree pruning alter through fall and microclimate in cocoa (Theobroma cacao L.) production systems. Ann. For. Sci. 2018, 75, 38. [Google Scholar] [CrossRef] [Green Version]
  19. Abou Rajab, Y.; Leuschner, C.; Barus, H.; Tjoa, A.; Hertel, D. Cacao cultivation under diverse shade tree cover allows high carbon storage and sequestration without yield losses. PLoS ONE 2016, 11, e0149949. [Google Scholar] [CrossRef] [PubMed] [Green Version]
  20. Andres, C.; Blaser, W.J.; Dzahini-Obiatey, H.K.; Ameyaw, G.A.; Domfeh, O.K.; Awiagah, M.A.; Gattinger, A.; Schneider, M.; Offei, S.K.; Six, J. Agroforestry systems can mitigate the severity of cocoa swollen shoot virus disease. Agric. Ecosyst. Environ. 2018, 252, 83–92. [Google Scholar] [CrossRef]
  21. Bos, M.M.; Steffan-Dewenter, I.; Tscharntke, T. Shade tree management affects fruit abortion, insect pests and pathogens of cacao. Agric. Ecosyst. Environ. 2007, 120, 201–205. [Google Scholar] [CrossRef]
  22. Bunn, C.; Läderach, P.; Quaye, A.; Muilerman, S.; Noponen, M.R.A.; Lundy, M. Recommendation domains to scale out climate change adaptation in cocoa production in Ghana. Clim. Serv. 2019, 100123. [Google Scholar] [CrossRef]
  23. Hosseini Bai, S.; Trueman, S.J.; Nevenimo, T.; Hannet, G.; Bapiwai, P.; Poienou, M.; Wallace, H.M. Effects of shade-tree species and spacing on soil and leaf nutrient concentrations in cocoa plantations at 8 years after establishment. Agric. Ecosyst. Environ. 2017, 246, 134–143. [Google Scholar] [CrossRef]
  24. Sambuichi, R.H.R.; Vidal, D.B.; Piasentin, F.B.; Jardim, J.G.; Viana, T.G.; Menezes, A.A.; Mello, D.L.N.; Ahnert, D.; Baligar, V.C. Cabruca agroforests in southern Bahia, Brazil: Tree component, management practices and tree species conservation. Biodivers Conserv. 2012, 21, 1055–1077. [Google Scholar] [CrossRef]
  25. Vanhove, W.; Vanhoudt, N.; Van Damme, P. Effect of shade tree planting and soil management on rehabilitation success of a 22-year-old graded cocoa (Theobroma cacao L.) plantation. Agric. Ecosyst. Environ. 2016, 219, 14–25. [Google Scholar] [CrossRef]
  26. Vliet, J.A.; van Giller, K.E. Mineral nutrition of cocoa: A review. In Advances in Agronomy; Donald, L.S., Ed.; Academic Press: Cambridge, MA, USA, 2017; Volume 141, pp. 185–270. [Google Scholar]
  27. Abdulai, I.; Jassogne, L.; Graefe, S.; Asare, R.; Van Asten, P.; Läderach, P.; Vaast, P. Characterization of cocoa production, income diversification and shade tree management along a climate gradient in Ghana. PLoS ONE 2018, 13, e0195777. [Google Scholar] [CrossRef]
  28. Asare, R.; Markussen, B.; Asare, R.A.; Anim-Kwapong, G.; Ræbild, A. On-farm cocoa yields increase with canopy cover of shade trees in two agro-ecological zones in Ghana. Clim. Dev. 2019, 11, 435–445. [Google Scholar] [CrossRef] [Green Version]
  29. Blaser, W.J.; Oppong, J.; Hart, S.P.; Landolt, J.; Yeboah, E.; Six, J. Climate-smart sustainable agriculture in low-to-intermediate shade agroforests. Nat. Sustain. 2018, 1, 234–239. [Google Scholar] [CrossRef]
  30. Blaser, W.J.; Oppong, J.; Yeboah, E.; Six, J. Shade trees have limited benefits for soil fertility in cocoa agroforests. Agric. Ecosyst. Environ. 2017, 243, 83–91. [Google Scholar] [CrossRef] [Green Version]
  31. Jezeer, R.E.; Verweij, P.A.; Santos, M.J.; Boot, R.G.A. Shaded Coffee and Cocoa—Double Dividend for Biodiversity and Small-scale Farmers. Ecol. Econ. 2017, 140, 136–145. [Google Scholar] [CrossRef] [Green Version]
  32. Almeida, A.-A.F.; Gattward, J.N. Respostas do cacaueiro as variacoes da intensidad de luz. In Em Capitulo 2 de Cacao: Cultivo, Pesquisa e Inovação; de Souza Junior, J.O., Ed.; Editora da Universidade Estadual de Santa Cruz: Ilhéus, Brazil, 2018; pp. 35–58. [Google Scholar]
  33. Suárez Salazar, J.C.; Melgarejo, L.M.; Casanoves, F.; Di Rienzo, J.A.; DaMatta, F.M.; Armas, C. Photosynthesis limitations in cacao leaves under different agroforestry systems in the Colombian Amazon. PLoS ONE 2018, 13, e0206149. [Google Scholar] [CrossRef] [PubMed] [Green Version]
  34. Wood, G.A.R.; Lass, R.A. Cocoa, 4th ed.; Blackwell Science: Oxford, UK, 2001; 619p. [Google Scholar]
  35. Chazdon, R.L. Sunflecks and their importance to forest understorey plants. In Advances in Ecological Research; Elsevier: Amsterdam, The Netherlands, 1988; pp. 1–63. [Google Scholar] [CrossRef]
  36. De Castro, F. Light spectral composition in a tropical forest: Measurements and model. Tree Physiol. 2000, 20, 49–56. [Google Scholar] [CrossRef]
  37. Goldstein, G.; Santiago, L.S.; Campanello, P.I.; Avalos, G.; Zhang, Y.-J.; Villagra, M. Facing shortage or excessive light: How tropical and subtropical trees adjust their photosynthetic behavior and life history traits to a dynamic forest environment. In Tropical Tree Physiology; Goldstein, G., Santiago, L.S., Eds.; Springer International Publishing: Cham, Switzerland, 2016; pp. 319–336. [Google Scholar] [CrossRef]
  38. Liang, N.; Tang, Y.; Okuda, T. Is elevation of carbon dioxide concentration beneficial to seedling photosynthesis in the understory of tropical rain forests? Tree Physiol. 2001, 21, 1047–1055. [Google Scholar] [CrossRef] [Green Version]
  39. Pallardy, S.G. Photosynthesis. In Physiology of Woody Plants; Elsevier: Amsterdam, The Netherlands, 2008; pp. 107–167. [Google Scholar] [CrossRef]
  40. Pearcy, R.W. Photosynthetic gas exchange responses of Australian tropical forest trees in canopy, gap and understory micro-environments. Funct. Ecol. 1987, 1, 169. [Google Scholar] [CrossRef]
  41. Tang, Y.; Kachi, N.; Furukawa, A.; Awang, M.B. Heterogeneity of light availability and its effects on simulated carbon gain of tree leaves in a small gap and the understory in a tropical rain forest. Biotropica 1999, 31, 268–278. [Google Scholar] [CrossRef]
  42. Miyaji, K.-I.; Da Silva, W.S.; Alvim, P.D.T. Longevity of leaves of a tropical tree, Theobroma cacao, grown under shading, in relation to position within the canopy and time of emergence. New Phytol. 1997, 135, 445–454. [Google Scholar] [CrossRef] [Green Version]
  43. Baligar, V.C.; Bunce, J.A.; Machado, R.C.R.; Elson, M.K. Carbon dioxide and photosynthetic photon flux density effects on growth and mineral uptake of cacao. J. Food Agric. Environ. 2005, 3, 142–147. [Google Scholar]
  44. Baligar, V.C.; Bunce, J.A.; Machado, R.C.R.; Elson, M.K. Photosynthetic photon flux density, carbon dioxide concentration, and vapor pressure deficit effects on photosynthesis in cacao seedlings. Photosynthetica 2008, 46, 216–221. [Google Scholar] [CrossRef]
  45. Bastid, P.; Jimmy, I. Gas transfer measurements on young cocoa trees in field and modeling of photosynthetic activity. In Proceedings of the 14th International Cocoa Research Conference, Accra, Ghana, 13–18 October 2003; pp. 195–203. [Google Scholar]
  46. Hutcheon, W.F. Photosynthesis of Cocoa: Photosynthesis in Relation to the Light and Plant Nutrient Status. 1973–1974; Cocoa Research Institute of Ghana: Accra, Ghana, 1976. [Google Scholar]
  47. Raja Harun, R.M.; Hardwick, K. The effects of prolonged exposure to different light intensities on the photosynthesis of cocoa leaves. In Proceedings of the 10th International Cocoa Research Conference, Santo Domingo, Dominican Republic, 17–23 May 1988; pp. 205–209. [Google Scholar]
  48. Daymond, A.J.; Hadley, P.; Machado, R.C.R.; Ng, E. Canopy characteristics of contrasting clones of cacao (Theobroma cacao). Exp. Agric. 2002, 38, 359–367. [Google Scholar] [CrossRef]
  49. Motamayor, J.C.; Lachenaud, P.; da Silva e Mota, J.W.; Loor, R.; Kuhn, D.N.; Brown, J.S.; Schnell, R.J. Geographic and genetic population differentiation of the Amazonian chocolate tree (Theobroma cacao L.). PLoS ONE 2008, 3, e3311. [Google Scholar] [CrossRef] [Green Version]
  50. Pereira de Araújo, R.; Furtado de Almeida, A.-A.; Pinto Barroso, J.; Aparecida de Oliveira, R.; Pinto Gomes, F.; Ahnert, D.; Baligar, V. Molecular and morphophysiological responses cocoa leaves with different concentrations of anthocyanin to variations in light levels. Sci. Hortic. 2017, 224, 188–197. [Google Scholar] [CrossRef] [Green Version]
  51. Silva, F.C. Manual de análises químicas de solos, plantas e fertilizantes. In 2ª edição Revista e Ampliada; Embrapa Informação Tecnológica: Brasília, Brazil, 2009; 627p. [Google Scholar]
  52. Lamari, L. ASSESS 2.0. Image Analysis Sofware for Plant Disease Quantification. American Phytopathological Society; APS Press: St. Paul, MN, USA, 2008; 125p. [Google Scholar]
  53. United States Environmental Protection Agency (US EPA). Method 3050B: Acid Digestion of Sediments, Sludges, and Soils, Revision 2; United States Environmental Protection Agency (US EPA): Washington, DC, USA, 1996.
  54. Baligar, V.C.; Fageria, N.K.; He, Z.L. Nutrient use efficiency in plants. Commun. Soil Sci. Plant Anal. 2001, 32, 921–950. [Google Scholar] [CrossRef]
  55. McDonald, G.; Bovill, W.; Huang, C.; Lightfoot, D. Nutrient use efficiency. In Genomics and Breeding for Climate-Resilient Crops; Kole, C., Ed.; Springer: Berlin/Heidelberg, Germany, 2013; pp. 333–393. [Google Scholar] [CrossRef]
  56. Di Rienzo, J.A.; Casanoves, F.; Balzarini, M.G.; Gonzalez, L.; Tablada, M.; Robledo, C.W. InfoStat Versión 2020; Centro de Transferencia InfoStat, FCA, Universidad Nacional de Córdoba: Córdoba, Argentina, 2020; Available online: http://www.infostat.com.ar (accessed on 25 March 2021).
  57. Poorter, H.; Niklas, K.J.; Reich, P.B.; Oleksyn, J.; Poot, P.; Mommer, L. Biomass allocation to leaves, stems and roots: Meta-analyses of interspecific variation and environmental control: Tansley review. New Phytologist. 2012, 193, 30–50. [Google Scholar] [CrossRef]
  58. Wartenberg, A.C.; Blaser, W.J.; Roshetko, J.M.; Van Noordwijk, M.; Six, J. Soil fertility and Theobroma cacao growth and productivity under commonly intercropped shade-tree species in Sulawesi, Indonesia. Plant Soil 2020, 453, 87–104. [Google Scholar] [CrossRef]
  59. Daymond, A.J.; Hadley, P. The effects of temperature and light integral on early vegetative growth and chlorophyll fluorescence of four contrasting genotypes of cacao (Theobroma cacao). Ann. Appl. Biol. 2004, 145, 257–262. [Google Scholar] [CrossRef]
  60. Daymond, A.J.; Tricker, P.J.; Hadley, P. Genotypic variation in photosynthesis in cacao is correlated with stomatal conductance and leaf nitrogen. Biol. Plant. 2011, 55, 99–104. [Google Scholar] [CrossRef]
  61. Baligar, V.C.; Elson, M.K.; Almeida, A.A.F.; de Araujo, Q.R.; Ahnert, D.; He, Z. The impact of carbon dioxide concentrations and low to adequate photosynthetic photon flux density on growth, physiology and nutrient use efficiency of juvenile cacao genotypes. Agronomy 2021, 11, 397. [Google Scholar] [CrossRef]
  62. Niether, W.; Schneidewind, U.; Fuchs, M.; Schneider, M.; Armengot, L. Below- and aboveground production in cocoa monocultures and agroforestry systems. Sci. Total Environ. 2019, 657, 558–567. [Google Scholar] [CrossRef]
  63. Almeida, A.-A.F.; Valle, R.R. Cacao: Ecophysiology of growth and production. In Ecophysiology of Tropical Tree Crops; DaMatta, F., Ed.; Nova Science Publishers: New York, NY, USA, 2010; p. 389. [Google Scholar]
  64. Acheampong, K.; Hadley, P.; Daymond, A.; Adu-Yeboah, P. The influence of shade and organic fertilizer treatments on the physiology and establishment of Theobroma cacao clones. Am. J. Exp. Agric. 2015, 6, 347–360. [Google Scholar] [CrossRef] [Green Version]
  65. Agudelo-Castañeda, G.A.; Cadena-Torres, J.; Almanza-Merchán, P.J.; Pinzón-Sandoval, E.H. Desempeño fisiológico de nueve genotipos de cacao (Theobroma cacao L.) bajo la sombra de tres especies forestales en Santander, Colombia. Rev. Colomb. Cienc. Hortic. 2018, 12, 223–232. [Google Scholar] [CrossRef] [Green Version]
  66. Jaimez, R.E.; Amores Puyutaxi, F.; Vasco, A.; Loor, R.G.; Tarqui, O.; Quijano, G.; Jimenez, J.C.; Tezara, W. Photosynthetic response to low and high light of cacao growing without shade in an area of low evaporative demand. Acta Biológica Colomb. 2018, 23, 95–103. [Google Scholar] [CrossRef]
  67. López-Marín, J.; Gálvez, A.; González, A.; Egea-Gilabert, C.; Fernández, J.A. Effect of shade on yield, quality and photosynthesis-related parameters of sweet pepper plants. Acta Hortic. 2012, 956, 545–552. [Google Scholar] [CrossRef]
  68. Yang, M.; Liu, M.; Lu, J.; Yang, H. Effects of shading on the growth and leaf photosynthetic characteristics of three forages in an apple orchard on the Loess Plateau of eastern Gansu, China. PeerJ 2019, 7, e7594. [Google Scholar] [CrossRef] [PubMed] [Green Version]
  69. Baliza, D.P.; Cunha, R.L.; Guimarães, R.J.; Barbosa, J.P.R.A.D.; Ávila, F.W.; Passos, A.M.A. Physiological characteristics and development of coffee plants under different shading levels. Rev. Bras. Ciênc. Agrár. Recife. 2012, 7, 7–43. [Google Scholar] [CrossRef] [Green Version]
  70. Cabala Rosand, P.; Santana, M.B.M.; de Santana, C.J.L. Cacao. In Detecting Mineral Nutrient Deficiencies in Tropical and Temperate Crops; Plucknett, D., Sprague, H.B., Eds.; CRC Press: Boca Raton, FL, USA, 1989. [Google Scholar] [CrossRef]
  71. Murray, D.B. Leaf analysis applied to cocoa. In Cocoa Growers’ Bulletin; Cadbury Brothers Ltd., Bournville: Birmingham, UK, 1967; Volume 9, pp. 25–35. [Google Scholar]
  72. Ahenkorah, Y.; Halm, B.; Appiah, M.; Akrofi, G.; Yirenkyi, J. Twenty Years’ Results from a Shade and Fertilizer Trial on Amazon Cocoa (Theobroma cacao) in Ghana. Exp. Agric. 1987, 23, 31–39. [Google Scholar] [CrossRef]
  73. Loue, A. Etude des Carences et des Deficincies Minerales sur le Cacaoyer (Study of Deficiencies and Mineral Deficiencies of Cacao); Institut Français du Café et du Cacao: Paris, France; Bulletin: Santa Rosa, CA, USA, 1961; Volume 1, p. 53. [Google Scholar]
  74. Snoeck, J. Cacao. In L’analyse Végétale dans le Contrôle de L’alimentation des Plantes Temperées et Tropicales; Martin-Prevel, P., Gagnard, J., Gautier, P., Eds.; Technique et doc. (Plant Analysis of Nutrient Requirements in Temperate and Tropical Plants); Lavoisier Publishing Inc.: New York, NY, USA, 1987; pp. 432–439. [Google Scholar]
  75. Bhargava, B.S.; Raghupati, H.B. Analysis of plants. In Methods of Analysis of Soils, Water and Fertilizers; Tondon, H.S., Ed.; FDCO: New Delhi, India, 1993; pp. 49–82. [Google Scholar]
  76. Isaac, M.E.; Timmer, V.R.; Quashie-Sam, S.J. Shade tree effects in an 8-year-old cocoa agroforestry system: Biomass and nutrient diagnosis of Theobroma cacao by vector analysis. Nutr. Cycl. Agroecosyst. 2007, 78, 155–165. [Google Scholar] [CrossRef]
  77. Bongers, F.J.; Evers, J.B.; Anten, N.P.R.; Pierik, R. From shade avoidance responses to plant performance at vegetation level: Using virtual plant modeling as a tool. New Phytol. 2014, 204, 268–272. [Google Scholar] [CrossRef] [Green Version]
  78. Portsmuth, A.; Niinemets, Ü. Structural and physiological plasticity in response to light and nutrients in five temperate deciduous woody species of contrasting shade tolerance. Funct. Ecol. 2007, 21. [Google Scholar] [CrossRef]
  79. Markesteijn, L.; Poorter, L. Seedling root morphology and biomass allocation of 62 tropical tree species in relation to drought- and shade-tolerance. J. Ecol. 2009, 97, 311–325. [Google Scholar] [CrossRef]
  80. Macfie, S.M.; Taylor, G.J. The effects of excess manganese on photosynthetic rate and concentration of chlorophyll in Triticum aestivum grown in solution culture. Physiol. Plant 1992, 85, 467–475. [Google Scholar] [CrossRef]
  81. Moroni, J.S.; Briggs, K.G.; Taylor, G.J. Chlorophyll content and leaf elongation rate in wheat seedlings as a measure of manganese tolerance. Plant Soil 1991, 136, 1–9. [Google Scholar] [CrossRef]
  82. Singh, P.; Misra, A.; Srivastava, N.K. Influence of Mn deficiency on growth, chlorophyll content, physiology, and essential monoterpene oil(s) in genotypes of spearmint (Mentha spicata L.). Photosynthetica 2001, 39, 473–476. [Google Scholar] [CrossRef]
  83. Bazihizina, N.; Colzi, I.; Giorni, E.; Mancuso, S.; Gonnelli, C. Photosynthesizing on metal excess: Copper differently induced changes in various photosynthetic parameters in copper tolerant and sensitive Silene paradoxa L. populations. Plant Sci. 2015, 232, 67–76. [Google Scholar] [CrossRef] [PubMed]
  84. Gonzalez-Mendoza, D.; Gil, F.E.; Escoboza-Garcia, F.; Santamaria, J.M.; Zapata-Perez, O. Copper stress on photosynthesis of black mangle (Avicennia germinans). An. Acad. Bras. Ciênc. 2013, 85, 665–670. [Google Scholar] [CrossRef] [PubMed] [Green Version]
  85. Moustakas, M.; Ouzounidou, G.; Symeonidis, L.; Karataglis, S. Field study of the effects of excess copper on wheat photosynthesis and productivity. Soil Sci. Plant Nutr. 1997, 43, 531–539. [Google Scholar] [CrossRef] [Green Version]
  86. Pätsikkä, E.; Kairavuo, M.; Šeršen, F.; Aro, E.-M.; Tyystjärvi, E. Excess copper predisposes photosystem II to photoinhibition in vivo by outcompeting iron and causing decrease in leaf chlorophyll. Plant Physiol. 2002, 129, 1359–1367. [Google Scholar] [CrossRef] [PubMed] [Green Version]
Figure 1. Greenhouse constructed at the Tropical Crops Institute (ICT), Tarapoto, Peru to evaluate the response of 58 cacao genotypes to two levels of shade: 50% (PPFD of 1000 ± 50 μmol m−2 s−1) and 80% (PPFD of 400 ± 50 μmol m−2 s−1).
Agronomy 11 01536 g001
Figure 2. Nutrient uptake (U, macronutrients in g plant−1 or micronutrients in mg plant−1, ± SE) of cacao genotypes subjected to two levels of shade (50%, 80%). PWC: wild cacao (from river basins of Peruvian Amazon) [n = 14]; PFC: Peruvian farmers’ cacao [n = 15]; BCC: Brazilian cacao [n = 14]; NIC: national and international cacao collections [n = 15]. All paired bar graphs that have an * above have significant differences and those with “ns” above do not have significant differences between shade levels (Scott and Knott test, p ≤ 0.05).
Agronomy 11 01536 g002
Figure 3. Effect of shade on nutrient uptake efficiency (NUE, macronutrients in g shoot g−1 or micronutrients in g shoot mg−1 ± SE) of cacao genotypes subjected to two levels of shade (50%, 80%). PWC: wild cacao (from river basins of Peruvian Amazon) [n = 14]; PFC: Peruvian farmers’ cacao [n = 15]; BCC: Brazilian cacao [n = 14]; NIC: national and international cacao collections [n = 15]. All paired bar graphs that have an * above have significant differences and those with “ns” above do not have significant differences between shade levels (Scott and Knott test, p ≤ 0.05).
Agronomy 11 01536 g003
Figure 4. Shade tolerance index (STI, ±SD) of 58 cacao genotypes subjected to two levels of shade (40%, 80%). PWC: wild cacao (from river basins of Peruvian Amazon) [n = 14]; PFC: Peruvian farmers’ cacao [n = 15]; BCC: Brazilian cacao [n = 14]; NIC: national and international cacao collections [n = 15]. Genotypes were classified into three groups: sensitive to shade (STI% ≤ 40), medium shade-tolerant (40 < STI% ≤ 60) and tolerant to shade (STI% > 60).
Agronomy 11 01536 g004
Figure 5. Seedlings captions of growth characteristics of cacao genotypes—both sensitive and tolerant to shade. The center figure shows the greenhouse with the plant distribution, note the net that provides 50% shade (grey color) and at the end net that provides 80% shade (black color).
Agronomy 11 01536 g005
Figure 6. PCA analysis of shade effect on growth, physiological parameters, and nutrient uptake of shade-sensitive and tolerant genotypes, subjected to 50% shade (A) and 80% shade (B).
Agronomy 11 01536 g006
Table 1. List of 58 cacao genotypes used for this experiment from 4 different origins maintained at the ICT germplasm bank.
Wild Cacao Genotypes from River Basins of Peru Amazon (PWC)Peruvian Farmers’ Cacao Genotypes (PFC)Brazilian Genotypes (BCC)National and International Genotypes (NIC)
GenotypeOriginGenotypeOriginGenotypeOriginGenotypeOrigin
1AYP-15Aypena1ICT-1026Mariscal Cáceres—Juanjui1BN-34Fazenda Boa Nova1CCN-10Ecuador
2AYP-20Aypena2ICT-1087Mariscal Cáceres—Juanjui2BS-01Fazenda Bom Sossego2CCN-51Ecuador
3AYP-22Aypena3ICT-1092Mariscal Cáceres—Juanjui3CA-14Fazenda Canta Galo3EET-400Ecuador
4PAS-91Pastaza4ICT-1112Mariscal Cáceres—Juanjui4CEPEC-2002Centro de pesquisa do cacau4H-10Peru
5PAS-93Pastaza5ICT-1189Mariscal Cáceres—Juanjui5CP-49-C10Centro de pesquisa do cacau5ICS-1Trinidad and Tobago
6PAS-100Pastaza6ICT-1251Mariscal Cáceres—Juanjui6CP-53-C10Centro de pesquisa do cacau6ICS-6Trinidad and Tobago
7PAS-105Pastaza7ICT-1281Mariscal Cáceres—Juanjui7IPIRANGA-1Cidade de Ipiranga7ICS-39Trinidad and Tobago
8UGU-112Ungumayo8ICT-1292Mariscal Cáceres—Juanjui8PH-09Fazenda Porto Hibrido8ICS-95Trinidad and Tobago
9UGU-126Ungumayo9ICT-1506Mariscal Cáceres—Juanjui9PH-15Fazenda Porto Hibrido9IMC-67Peru
10UGU-130Ungumayo10ICT-2142Tocache10PH-16Fazenda Porto Hibrido10POUND-12Peru
11UNG-53Ungurahui11ICT-2161Tocache11PH-17Fazenda Porto Hibrido11SCA-6Peru
12UNG-73Ungurahui12ICT-2171Tocache12PH-21Fazenda Porto Hibrido12TSH-565Trinidad and Tobago
13UNG-76Ungurahui13ICT-2172Tocache13PH-144Fazenda Porto Hibrido13TSH-1188Trinidad and Tobago
14UNG-77Ungurahui14ICT-2173Tocache14PH-990Fazenda Porto Hibrido14UF-613Costa Rica
15ICT-2653Tocache 15UF-667Costa Rica
Table 2. Effect of shade on growth parameters in 58 cacao genotypes from different origins subjected to 50% and 80% shade.
Growth
Parameter *
Unit per PlantPWCPFCBCCNICTotalSource of Variation [df]
Shade (S)
[1]
Genotype (G) [57]G*S
[57]
pv
SL 50%cm33.6239.5634.5639.0536.790.0004<0.00010.0072
SL 80%cm44.6051.9042.4645.3046.15
SL Δcm−10.98−12.34−7.90−6.25−9.36
SD 50%mm10.1712.149.8012.0411.070.0001<0.00010.0003
SD 80%mm7.889.278.069.038.58
SD Δmm2.292.871.743.012.49
LA 50%cm2780.59898.51834.11952.53868.470.0001<0.00010.6657
LA 80%cm21023.991145.911037.561188.251110.27
LA Δcm2−243.40−247.40−203.45−235.72−241.80
RA 50%cm2241.50300.99317.97327.91297.69<0.0001<0.00010.0008
RA 80%cm2295.97388.69337.21418.28361.54
RA Δcm2−54.47−87.70−19.24−90.37−63.85
RDW 50%g6.9410.617.219.028.50<0.0001<0.0001<0.0001
RDW 80%g2.383.932.923.603.23
RDW Δg4.566.684.295.425.27
BDW 50%g30.8135.5830.0532.0832.19<0.0001<0.0001<0.0001
BDW 80%g13.8318.7614.4317.1616.11
BDW Δg16.9816.8215.6214.9216.08
S/R 50% 3.922.443.452.643.090.0001<0.00010.0006
S/R 80% 5.534.014.233.994.42
S/R Δ −1.61−1.57−0.78−1.35−1.33
* SL: shoot length; SD: stem diameter; LA: leaf area; RA: root area; RDW: root dry weight; BDW: total dry weight; S/R: shoot/root rate; PWC: wild cacao (from river basins of Peruvian Amazon) [n = 14]; PFC: Peruvian farmers’ cacao [n = 15]; BCC: Brazilian cacao [n = 14]; NIC: national and international cacao collections [n = 15].
Table 3. Effect of shade on physiological parameters in 58 cacao genotypes from different origins Scheme 50 and 80% shade.
Physiological
Parameter *
UnitPWCPFCBCCNICTotalSource of Variation [df]
Shade (S)
[1]
Genotype (G) [57]G*S
[57]
pv
CHL 50%SPAD33.7429.1731.7128.6630.75<0.0001<0.0001<0.0001
CHL 80%SPAD33.5530.4433.4631.1932.12
CHL ΔSPAD0.19−1.27−1.75−2.53−1.37
gs 50%mmol m−2 s−1188.40184.01226.86183.78195.350.00010.00020.0007
gs 80%mmol m−2 s−170.56169.41115.04139.80124.77
gs Δmmol m−2 s−1117.8414.60111.8243.9870.58
WUE 50%g L−11.331.391.271.281.310.0003<0.0001<0.0001
WUE 80%g L−10.981.270.981.161.09
WUE Δg L−10.350.120.290.120.22
* CHL: leaf chlorophyll content; gs: stomatal conductance; WUE: water use efficiency; PWC: wild cacao (from river basins of Peruvian Amazon) [n = 14]; PFC: Peruvian farmers’ cacao [n = 15]; BCC: Brazilian cacao [n = 14]; NIC: national and international cacao collections [n = 15].
Table 4. Effect of shade on macro- and micronutrients concentration in 58 cacao genotypes from different origins subjected to 50% and 80% shade.
Nutrient *Unit per PlantPWCPFCBCCNICTotalSource of Variation [df]
Shade (S)
[1]
Genotype (G) [57]G*S
[57]
N 50%g kg−115.0917.4518.2617.2017.01<0.0001<0.00010.002
N 80%g kg−119.0221.7822.5321.4521.21
N Δg kg−1−3.93−4.33−4.27−4.25−4.20
K 50%g kg−125.6421.1723.0018.7922.080.1034<0.0001<0.0001
K 80%g kg−121.8224.6621.5218.5321.63
K Δg kg−13.82−3.491.480.260.45
Ca 50%g kg−113.817.8112.6611.0111.26<0.0001<0.0001<0.0001
Ca 80%g kg−117.4717.6719.0815.1417.31
Ca Δg kg−1−3.66−9.86−6.42−4.13−6.05
Mg 50%g kg−16.023.605.695.785.25<0.0001<0.0001<0.0001
Mg 80%g kg−16.407.207.525.696.69
Mg Δg kg−1−0.38−3.60−1.830.09−1.44
P 50%g kg−11.181.140.930.871.030.0002<0.0001<0.0001
P 80%g kg−10.740.800.540.830.73
P Δg kg−10.440.340.390.040.30
Fe 50%mg kg−1173.09110.65194.57202.88169.830.0017<0.0001<0.0001
Fe 80%mg kg−1240.11156.13181.33218.20198.54
Fe Δmg kg−1−67.02−45.4813.24−15.32−28.71
Zn 50%mg kg−140.3932.2627.7439.2034.93<0.0001<0.0001<0.0001
Zn 80%mg kg−147.9146.6244.5043.1845.53
Zn Δmg kg−1−7.52−14.36−16.76−3.98−10.60
Mn 50%mg kg−150.6044.7329.2857.2545.660.00060.0006<0.0001
Mn 80%mg kg−184.1572.8776.9888.2480.56
Mn Δmg kg−1−33.55−28.14−47.70−30.99−34.90
Cu 50%mg kg−17.047.495.7110.857.82<0.0001<0.00010.0017
Cu 80%mg kg−19.4312.428.3314.1511.16
Cu Δmg kg−1−2.39−4.93−2.62−3.30−3.34
* N: nitrogen, K: potassium, Ca: calcium, Mg: magnesium, P: phosphorous, Fe: iron, Zn: zinc, Mn: manganese, Cu: cooper. PWC: Wild cacao (from River basins of Peruvian Amazon) [n = 14], PFC: Peruvian farmers’ cacao [n = 15], BCC: Brazilian cacao [n = 14], NIC: National and International cacao collections [n = 15].
Publisher’s Note: MDPI stays neutral with regard to jurisdictional claims in published maps and institutional affiliations.

