Article

Chemical Characterization of Brown and Red Seaweed from Southern Peru, a Sustainable Source of Bioactive and Nutraceutical Compounds

by
Yesica Vilcanqui
1,*,
Luis Omar Mamani-Apaza
1,
Marcos Flores
2,
Jaime Ortiz-Viedma
3,
Nalda Romero
3,
María Salomé Mariotti-Celis
4 and
Nils Leander Huamán-Castilla
1,*
1
Escuela de Ingeniería Agroindustrial, Universidad Nacional de Moquegua, Prolongación Calle Ancash s/n, Moquegua 18001, Peru
2
Departamento de Ciencias Básicas, Facultad de Ciencias, Universidad Santo Tomas, Av. Carlos Schorr 255, Talca 3460000, Chile
3
Departamento de Ciencia de los Alimentos y Tecnología Química, Facultad de Ciencias Químicas y Farmacéuticas, Universidad de Chile, Santos Dumont 964, Santiago 8320000, Chile
4
Escuela de Nutrición y Dietética, Facultad de Medicina, Universidad Finis Terrae, Santiago 7501015, Chile
*
Authors to whom correspondence should be addressed.
Agronomy 2021, 11(8), 1669; https://doi.org/10.3390/agronomy11081669
Submission received: 3 August 2021 / Accepted: 18 August 2021 / Published: 22 August 2021

Abstract

:
The southern coast of Peru presents a wide diversity of seaweed, which could be used as a new sustainable source of nutritional and bioactive compounds. For the first time, we chemically characterized two species of brown (Macrocystis pyrifera) and red (Chondracanthus chamissoi) Peruvian seaweed. Both species contained significant amounts of proteins (5–12%), lipids (0.16–0.74%), carbohydrates (43.29–62.65%) and minerals (1300–1800 mg kg−1 dw: dry weight). However, the profiles of amino acids, fatty acids and minerals were highly dependent on species type. C. chamissoi had a higher content of essential amino acids and minerals than M. pyrifera (170% and 45%, respectively), while the presence of polyunsaturated fatty acids (ω 6) as well as the content of tocopherols was higher in M. pyrifera (15.77 g 100 g−1 and 2.37 μg 100 g−1, respectively). Additionally, both species presented significant concentrations of total polyphenols (39–59 mg GAE g−1) and a high antioxidant capacity (67–98 µM TE g−1). Although M. pyrifera and C. chamissoi seem to be excellent raw materials for the food and nutraceutical industry, both species contained toxic heavy metals (cadmium: Cd and nickel: Ni) which could affect the safety of their direct use. Therefore, new separation strategies that allow the selective recovery of nutrients and bioactive compounds from Peruvian seaweed are required.

Graphical Abstract

1. Introduction

Seaweeds are recognized as a new sustainable source of micro and macronutrients, which can be classified as Chlorophytes (green), Rhodophyta (red) and Phaeophyceae (brown) [1]. The coast of southern Peru produces two types of brown and red seaweed (160 tons per year) [2], whose chemical composition, nutritional value and presence of bioactive compounds have awoken the interest of the food industry [3]. Thus, the demand for these seaweeds has increased considerably in the world (8000 million tons per year) [4].
Both red and brown seaweed have significant concentrations of proteins, minerals, fatty acids, hydrocolloids and polyphenols [3,5]. Brown seaweed has a lower protein content (8–12%) than red seaweed (14–20%) [3,5,6]. However, both seaweeds are natural sources rich in essential amino acids such as arginine, histidine, tryptophan and leucine [7]. These amino acids are related to the synthesis of hormones and nitrogen compounds in our bodies, as well as to the treatment and prevention of diseases such as cerebral ischemia, diabetes, obesity, liver and lung injuries [8,9,10,11]. Consequently, finding new sustainable sources rich in essential amino acids is desirable to obtain functional ingredients with biological activity.
Carbohydrate polymers are other macronutrients present in brown (12–56%) and red seaweed (34–76%) [5]. Interestingly, a high proportion of these compounds is not digestible by our bodies; thus, these polymers can be considered a potential source of dietary fiber [12]. The composition may vary depending on the type of species. For example, brown seaweeds are rich in cellulose and alginates, while red seaweeds are rich in cellulose and glucomannans [13]. Alginates and carrageenans are hydrocolloids of interest because they can be used not only as thickening and gelling agents, but also to reduce the risks of colon cancer, obesity and diabetes [12,13].
Although the lipid content present in seaweed is relatively low, its nutritional value is based on the composition of its unsaturated fatty acids [14]. Brown seaweeds have unsaturated fatty acids like linoleic acid (6–13%), arachidonic acid (12–16%), eicosapentaenoic acid (8–16%) and docosahexaenoic acid (DHA) (1–2%) [15], while red seaweeds have significant concentrations of unsaturated fatty acids such as DHA (14–24%), pentadecanoic acid (9–16%), palmitoleic acid (4–7%), linoleic acid (1–5%) and linolenic acid (0.5–2%). These fatty acids can be used in the prevention of cardiovascular diseases and diabetes [16]. Hence, a correct characterization of the fatty acid profile would allow us to establish future nutraceutical applications. Additionally, seaweeds contain elevated amounts of polyphenols (florotannins, flavonols, flavanols) and present a high antioxidant capacity [17]. In this sense, the mentioned antioxidant properties are significantly affected not only by location, but also by species. For example, brown seaweed has a higher concentration of total polyphenols from 3.8 to 6.7 mg GAE (gallic acid equivalent) g−1, dry weight (dw) and antioxidant capacity as analyzed by an ORAC assay (440–680 mg TE (trolox equivalent) g−1, dw) when compared to red seaweed (1.4–3.9 mg GAE g−1, dw; 6.9–30.7 mg TE g−1, dw) [18].
On the other hand, due to their high bioabsorption capacity, brown and red seaweed accumulate between 10 and 100 times more minerals such as sodium (Na), magnesium (Mg), phosphorus (P), potassium (K) and iodine (I) than other plant sources [19]. For example, the mineral content in both seaweeds can reach up to 40% of their dry weight, while spinach presents up to 20% of minerals [20].
Seaweed can be considered an alternative dietary source of nutrients and bioactive compounds. However, the presence of toxic heavy metals like copper (Cu), arsenic (As), cadmium (Cd), mercury and lead (Pb) in these marine vegetals may represent a health risk [21]. In this sense, before establishing the future food applications of seaweed, it is even more important to characterize its minerals. This information will allow us to establish selective separation strategies, such as extraction and purification, to obtain seaweed´s beneficial compounds and eliminate its toxic substances.
Under these considerations, we evaluated the potential of two unexploited brown and red Peruvian seaweeds as new sources of nutrients and bioactive compounds. To accomplish this purpose, we characterized the proximal chemical composition of two species of native seaweed from the southern Peruvian coast. Additionally, we determined the profiles of amino acids, fatty acids and metals, as well as the total polyphenol content and antioxidant capacity.

2. Materials and Methods

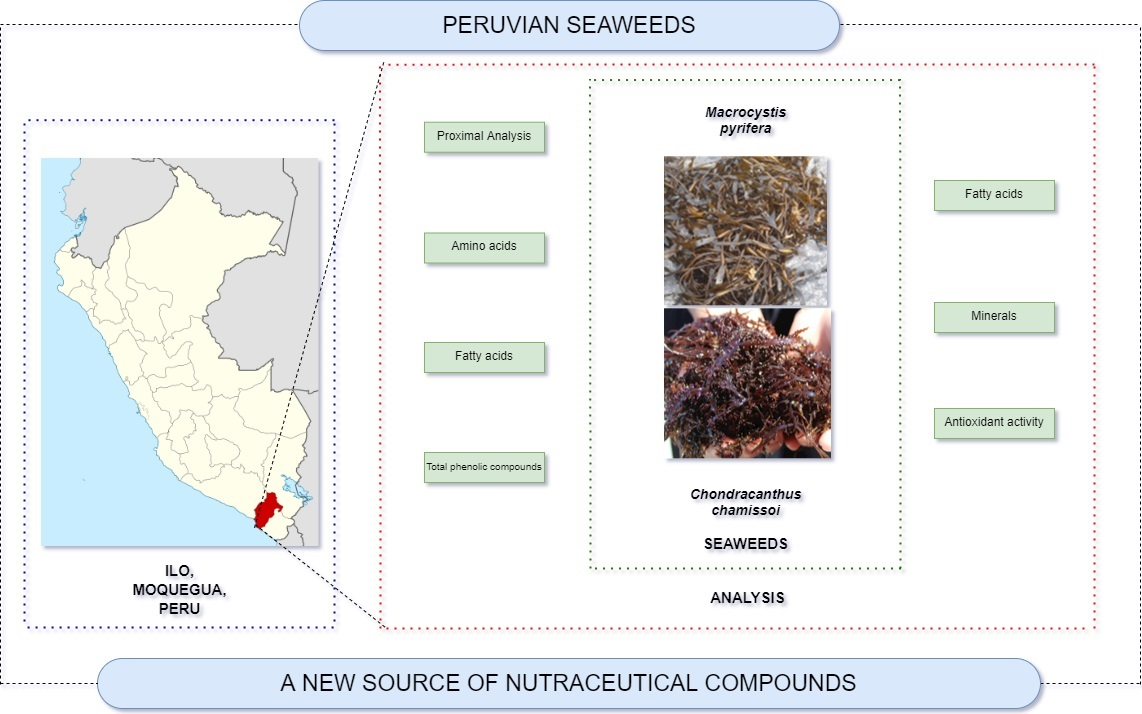
2.1. Seaweed Collection

Five kilograms of both Macrocystis pyrifera (Linnaeus) C. Agardh 1820 and Chondracanthus chamissoi (C. Agardh) Kützing 1843 seaweed were collected from the southern coast of Ilo, Moquegua, Peru (coordinates: 17°38′38 S 71°20′47 W). The collected samples were washed and dehydrated/frozen in a freeze-drying system (Labconco, FreeZone 2.5 L, Thermo Fisher Scientific, Waltham, MA, USA). Prior to the analysis, the freeze-dried samples were reduced to a particle size of 0.4 mm using a mill (Grain Mill, Corona, Peru). Then the samples were stored at −18 °C for further analysis.

2.2. Chemicals and Analytic Reagents

Organic solvents like ethanol (≥99%), methanol (≥99%), hexane (≥99%), propan-2-ol (≥99%), acetonitrile (≥99.9%), chlorhydric acid (36.5–38.0%) and sodium carbonate (≥99.5%) were acquired from J.T. Baker Chemical Co (Temixco, Morelos, Mexico). Folin-Ciocalteu, Trolox, 2,2-azobis(2-amidinopropane) dihydrochloride (AAPH), 17-amino acid standard, o-phthalaldehyde (OPA), 9-fluorenylmethyl chloroformate (FMOC), fatty acid methyl esters (FAME), calcium, magnesium, phosphorus, iodine, arsenic, manganese and iron were acquired from Sigma Aldrich Chemical Co (St. Louis, MO, USA).

2.3. Proximal Analysis

The samples were analyzed to determine the moisture by the gravimetric method [22]. Protein content was determined by the Kjeldhal method [22]. The ash content was realized by heating the samples to 500 °C for 4 h [22]. The Soxhlet method was used for extracting lipids, and then the solvent was evaporated and the mass of remaining lipid was measured [22]. Finally, the carbohydrate content was determined by difference: 100% − Σ (% moisture + % protein + % lipid + % ash).

2.4. Determination of Amino Acids

The samples of both seaweeds were analyzed to determine the aminoacidic profile according to the method proposed by Gonzales Castro et al. [23]. In summary, 1 g of the sample and 5 mL of HCl (6 N) were mixed and hydrolyzed (110 °C, 4 h). Then, 1 mL of the hydrolyzed sample and 1.66 mL of deionized water were mixed and filtered using a Nylon filter (0.45 μm). Then, 0.5 μL were injected into an HPLC system (Agilent 1200 series, model G1329A, Agilent Technologies, Santa Clara, CA, USA) equipped with a diode arrangement detector (DAD) (Agilent 1200 series, model G1329A, Agilent Technologies, Santa Clara, CA, USA). Prior to the analysis, the sample was derivatized using o-phthalaldehyde (0.5 μL) and 0.5 μL of 9-fluorenylmethyl for primary amino acids. One Column Zorbax Eclipse Rapid Resolution 4.6 × 75 mm, 3.5 µm (Column Agilent, Zorbax Eclipse, Agilent Technologies, Santa Clara, CA, USA) was used for the separation of amino acids at 35 °C. The mobile phase was composed of two solvents such as A (Buffer NaH2PO4 at pH 7.8) and B (Acetonitrile: Methanol: Water (45:45:10)). The total running time was 59.3 min with the following solvent gradient: 100% A for the first min, 57% B and 43% A for the next 9.8 min, 100% B for the next 22 min and 100% A for the next 26.5 min. The column was heated at 30 °C, and the flow rate was 2 mL/min. Finally, the amino acids present in both seaweeds were identified and quantified by comparison of the retention time and the area under the curve of the different amino acid standards. The analyses were performed in triplicate and the results were expressed as mg of amino acid per 100 g of dry weight (dw).

2.5. Determination of Fatty Acids

The samples were analyzed to determine the fatty acid profile according to the method proposed by Frank et al. [24]. To obtain oil, 2 g of sample and 10 mL of hexane (concentration) were mixed and stirred for 5 min. Then, the mixture was centrifuged at 4000 rpm for 10 min in a centrifuge (Greetmed, GT119-100T, Greetmed, Ningbo, China). The supernatant (crude oil) was methylated with 200 μL of potassium hydroxide (2 N) in methanol (0.56 g in 5 mL). Then, the mixture was stirred for 30 s and centrifuged at 4000 rpm for 10 min, and the obtained supernatant was refrigerated for further analysis. For chromatographic analysis, 1.0 μL of the sample was injected using a Split ratio: 1/10 into a gas chromatographic system (GC) (Agilent, 6890N, Agilent Technologies, USA) equipped with a mass detector (Agilent, 5975B, Agilent Technologies, Santa Clara, CA, USA) and automatic injector (Agilent, 7683B, Agilent Technologies, Santa Clara, CA, USA). One column (60 m × 0.25 mm × 0.15 μm) (Agilent, DB-23, Agilent Technologies, Santa Clara, CA, USA) was used for fatty acid separation. The analysis conditions were established as: (i) 250 °C of injection port temperature, (ii) 0.7 mL/min flow of entrainment gas (Helium) at constant pressure and (iii) a temperature gradient from 140 °C to 230 °C with increments of 5 °C/min. Finally, using different fatty acid methyl esters of reference (FAME) from Merck (Merck, Darmstadt, Germany), the content of each fatty acid in both species was identified and expressed as a percentage value in relation to the total content of them.

2.6. Determination of Tocopherols

For the analysis of tocopherols present in both species, the standard AOCS method [25] was followed. In summary, lipids were extracted with hexane. Then, 20 μL of the lipid sample was injected into an HPLC system (Hitachi, L-6200A, Merck, Darmstadt, Germany) equipped with a fluorescence detector (Merck–Hitachi, Chromaster 5440, Merck, Darmstadt, Germany) and a column of 25 cm × 4 mm i.d., particle size 5 µm (LichroCART, Superspher Si 60, Merck, Darmstadt, Germany). The mobile phase was propan-2-ol in hexane (0.5:99.5, volume per volume) at 1 mL/min. The peaks were detected at 290 and 330 nm of excitation and emission wavelengths respectively. Tocopherols were identified and quantified by comparison of retention time and area under the curve using external standards.

2.7. Determination of Minerals

Minerals were determined according to the method proposed by AOAC (Association of Official Agricultural Chemists) [26]. In summary, 1.9 g of the sample was placed in a muffle at 500 °C (Lindberg/Bue M., Thermo Scientific, Waltham, MA, USA). Then, the obtained ash was moistened with 10 drops of H2O and 4 mL of HNO3, and the excess HNO3 was evaporated with a hot plate until white vapors of HClO4 could be obtained. The residue was placed in a volumetric flask of 50 mL, which was then filled with ultrapure water. Finally, the mineral content was determined from different calibration curves established by the manufacturer of the Atomic Absorption Spectrophotometry equipment (Varian AA240FS (flame) and AA240Z (graphite furnace), Agilent Technologies, Santa Clara, CA, USA).

2.8. Conventional Extraction and Determination of Total Polyphenols (TPC)

The obtained extracts from both species were carried out using a conventional extraction method proposed by Fernández-Segovia et al. [27]. In summary, 0.25 g of the sample was mixed with 10 mL of methanol. The mixture was protected from light and centrifuged at 1200 rpm for 1 h at room temperature. Then, the obtained extract was centrifuged at 4000 rpm for 10 min (Centurion Scientific, model Pro-Analyt C2004, Chichester, UK). The supernatant was filtered using a filter with a pore size of 0.45 mm. After the extraction, the samples were stored in amber vials (100 mL) at −20 °C for further analysis.
To determinate the total polyphenol content, the samples were analyzed according to the method proposed by Sung-Sook et al. [28]. In summary, 100 µL of extract, 4900 µL of pure water, 500 µL of Folin−Ciocalteu reagent and 1700 µL of sodium carbonate (20% w/v) were mixed. Then, the mixture was incubated for 30 min at room temperature. Finally, the absorbance was measured at 765 nm. The results were expressed as mg of gallic acid equivalent (GAE) per gram of dry sample.

2.9. Determination of Antioxidant Capacity by ORAC

The ORAC analyses for both species of seaweed were performed on a multi-detector microplate fluorometer (Synergy/HTX, Biotek Instruments Inc, Winooski, VT, USA) according to the methodology proposed by Davalos et al. [29]. Fluorescein solution 48 nM and a solution of AAPH (153 nM) were diluted in a phosphate buffered saline (PBS) solution (pH 7.0). Standard Trolox was prepared (10, 20, 30, 40, 50, 60 µmolor diluted sample were mixed and were incubated for 10 min at 37 °C before automatic injection into the microplate reader. Fluorescence was determined at 485 nm (λ: excitation) and 520 nm (λ: emission) every minute for 50 min. The final ORAC values were calculated using the area under the curve and were expressed as μmol of Trolox equivalents (TE) per gram of seaweed.

2.10. Statistical Analysis

A paired t student test was performed to establish differences between the species of C. chamissoi (red seaweed) and M. pyrifera (brown seaweed) on the different response variables. The results were presented as mean and coefficient of variation (CV) and statistical analysis was performed (p ≤ 0.05) using statistical program Statgraphics Plus for Windows 4.0 (Statpoint Technologies, Inc., Warrenton, VA, USA).

3. Results and Discussion

3.1. Proximal Characterization of Seaweeds

The protein and carbohydrate content present in C. chamissoi (red seaweed) was 2 and 1.5 times higher than in M. pyrifera (brown seaweed) (Table 1). Similar differences were also reported by Vasquez et al. [30], who found that the protein content present in red seaweed was 1.7 times higher than in brown seaweed. This behavior could be because the red seaweed has a greater presence of free amino acids in its matrix as compared to other species of seaweed [31].
Conversely, M. pyrifera presented 3 times more ash content than C. chamissoi (Table 1) which is in accordance with previous research [6,30,32]. The ash content is a good indicator of the presence of inorganic compounds in seaweeds [33]. M. pyrifera present a greater presence of alginate and alginic acid compared to other species, and it allows for a greater ability to adsorb inorganic compounds like minerals, which are absorbed from the environment.
Although the lipid content was relatively low (<1%) in both species, M. pyrifera presented 5 times more content of these compounds compared to C. chamissoi (Table 1). Under conditions of direct light, the brown seaweed synthesized between 3 and 4 times more fatty acids compared to red seaweed [34]. The southern coast of Peru presents more than 13.5 h of sun exposure, which could explain the higher lipid content of brown seaweed and the results observed in both species.
On the other hand, the moisture percentage in both freeze-dried species varied between 6% and 11% (Table 1).

3.2. Composition of Amino Acids

The composition of amino acids present in both species varies from 4 to 59 mg 100 g−1, dw (Table 2). Similar content was also observed by Harrison et al. [35] and Astorga et al. [36], who reported that amino acid concentrations in red and brown seaweed can vary between 2 and 42 mg 100 g−1, dw.
An important aspect to consider is the profile of essential amino acids, which can vary depending on the type of species. For example, C. chamissoi presented 2, 4, 4, 3 and 4 times more histidine, valine, isoleucine, leucine and lysine content than M. pyrifera, while the threonine, methionine and phenylalanine content of both species did not show significant differences (p > 0.05) (Table 2). Harrison et al. [35] reported that in general, the content of essential amino acids is similar in both brown and red seaweed. However, other studies reported by Vasquez et al. [30] and Gamero et al. [31] mentioned that red seaweed such as C. chamissoi has a higher concentration of free amino acids as compared to brown seaweed. This fact could explain the differences found in the content of essential amino acids, which is highly influenced by the location of the seaweed.
Interestingly, C. chamissoi presented high concentrations of lysine (19.43 mg 100 g−1, dw) as compared to M. pyrifera (Table 2). Lysine is a limiting amino acid in different vegetables matrices; consequently, finding new sustainable sources is highly desirable [7].
Although C. chamissoi presented a higher content of non-essential amino acids when compared to M. pyrifera, the content of glycine (59.04 mg 100 g−1, dw) and proline (59.81 mg 100 g−1, dw) were higher when compared to other non-essential amino acids (Table 2). Proline is a compound that plays an important role in the synthesis of some amino acids, anti-oxidative reactions and immune responses [37], while glycine is a compound that acts as a precursor to several important metabolites of low molecular weight such as creatine [38].

3.3. Composition of Saturated and Unsaturated Fatty Acids

Although both species presented a low content of lipids (<1%) (Table 1), the presence of mono and polyunsaturated fatty acids allow for these seaweeds to be considered as a new alternative for the development of nutraceutical products [39].
In our study, both species present similar contents of monounsaturated fatty acids (16–18%), while the presence of polyunsaturated fatty acids (15.6%) was only detected in M. pyrifera (Table 3). Similar results were reported by Kendel et al. [16], Ortiz et al. [40] and Sánchez et al. [41], who observed that the content of monounsaturated fatty acids in red and brown seaweed do not present significant differences, while the content of polyunsaturated fatty acids (>5%) is higher in the brown seaweed.
Additionally, the presence of unsaturated fatty acids like ω 6, ω 7 and ω 9 in both studied seaweeds (Table 3) allows for their use as functional ingredients in the synthesis of eicosanoids, which increases hormonal and immunological activity in our body [42].
Regarding the presence of tocopherols, Peruvian M. pyrifera contained a higher proportion of α-tocopherol (2.14 μg 100 g−1, dw) and β-tocopherol (0.23 μg 100 g−1, dw) as compared to C. chamissoi (Table 3), which is in accordance with other studies carried out in Chilean seaweed [40] and with Biancarosa et al. [43].

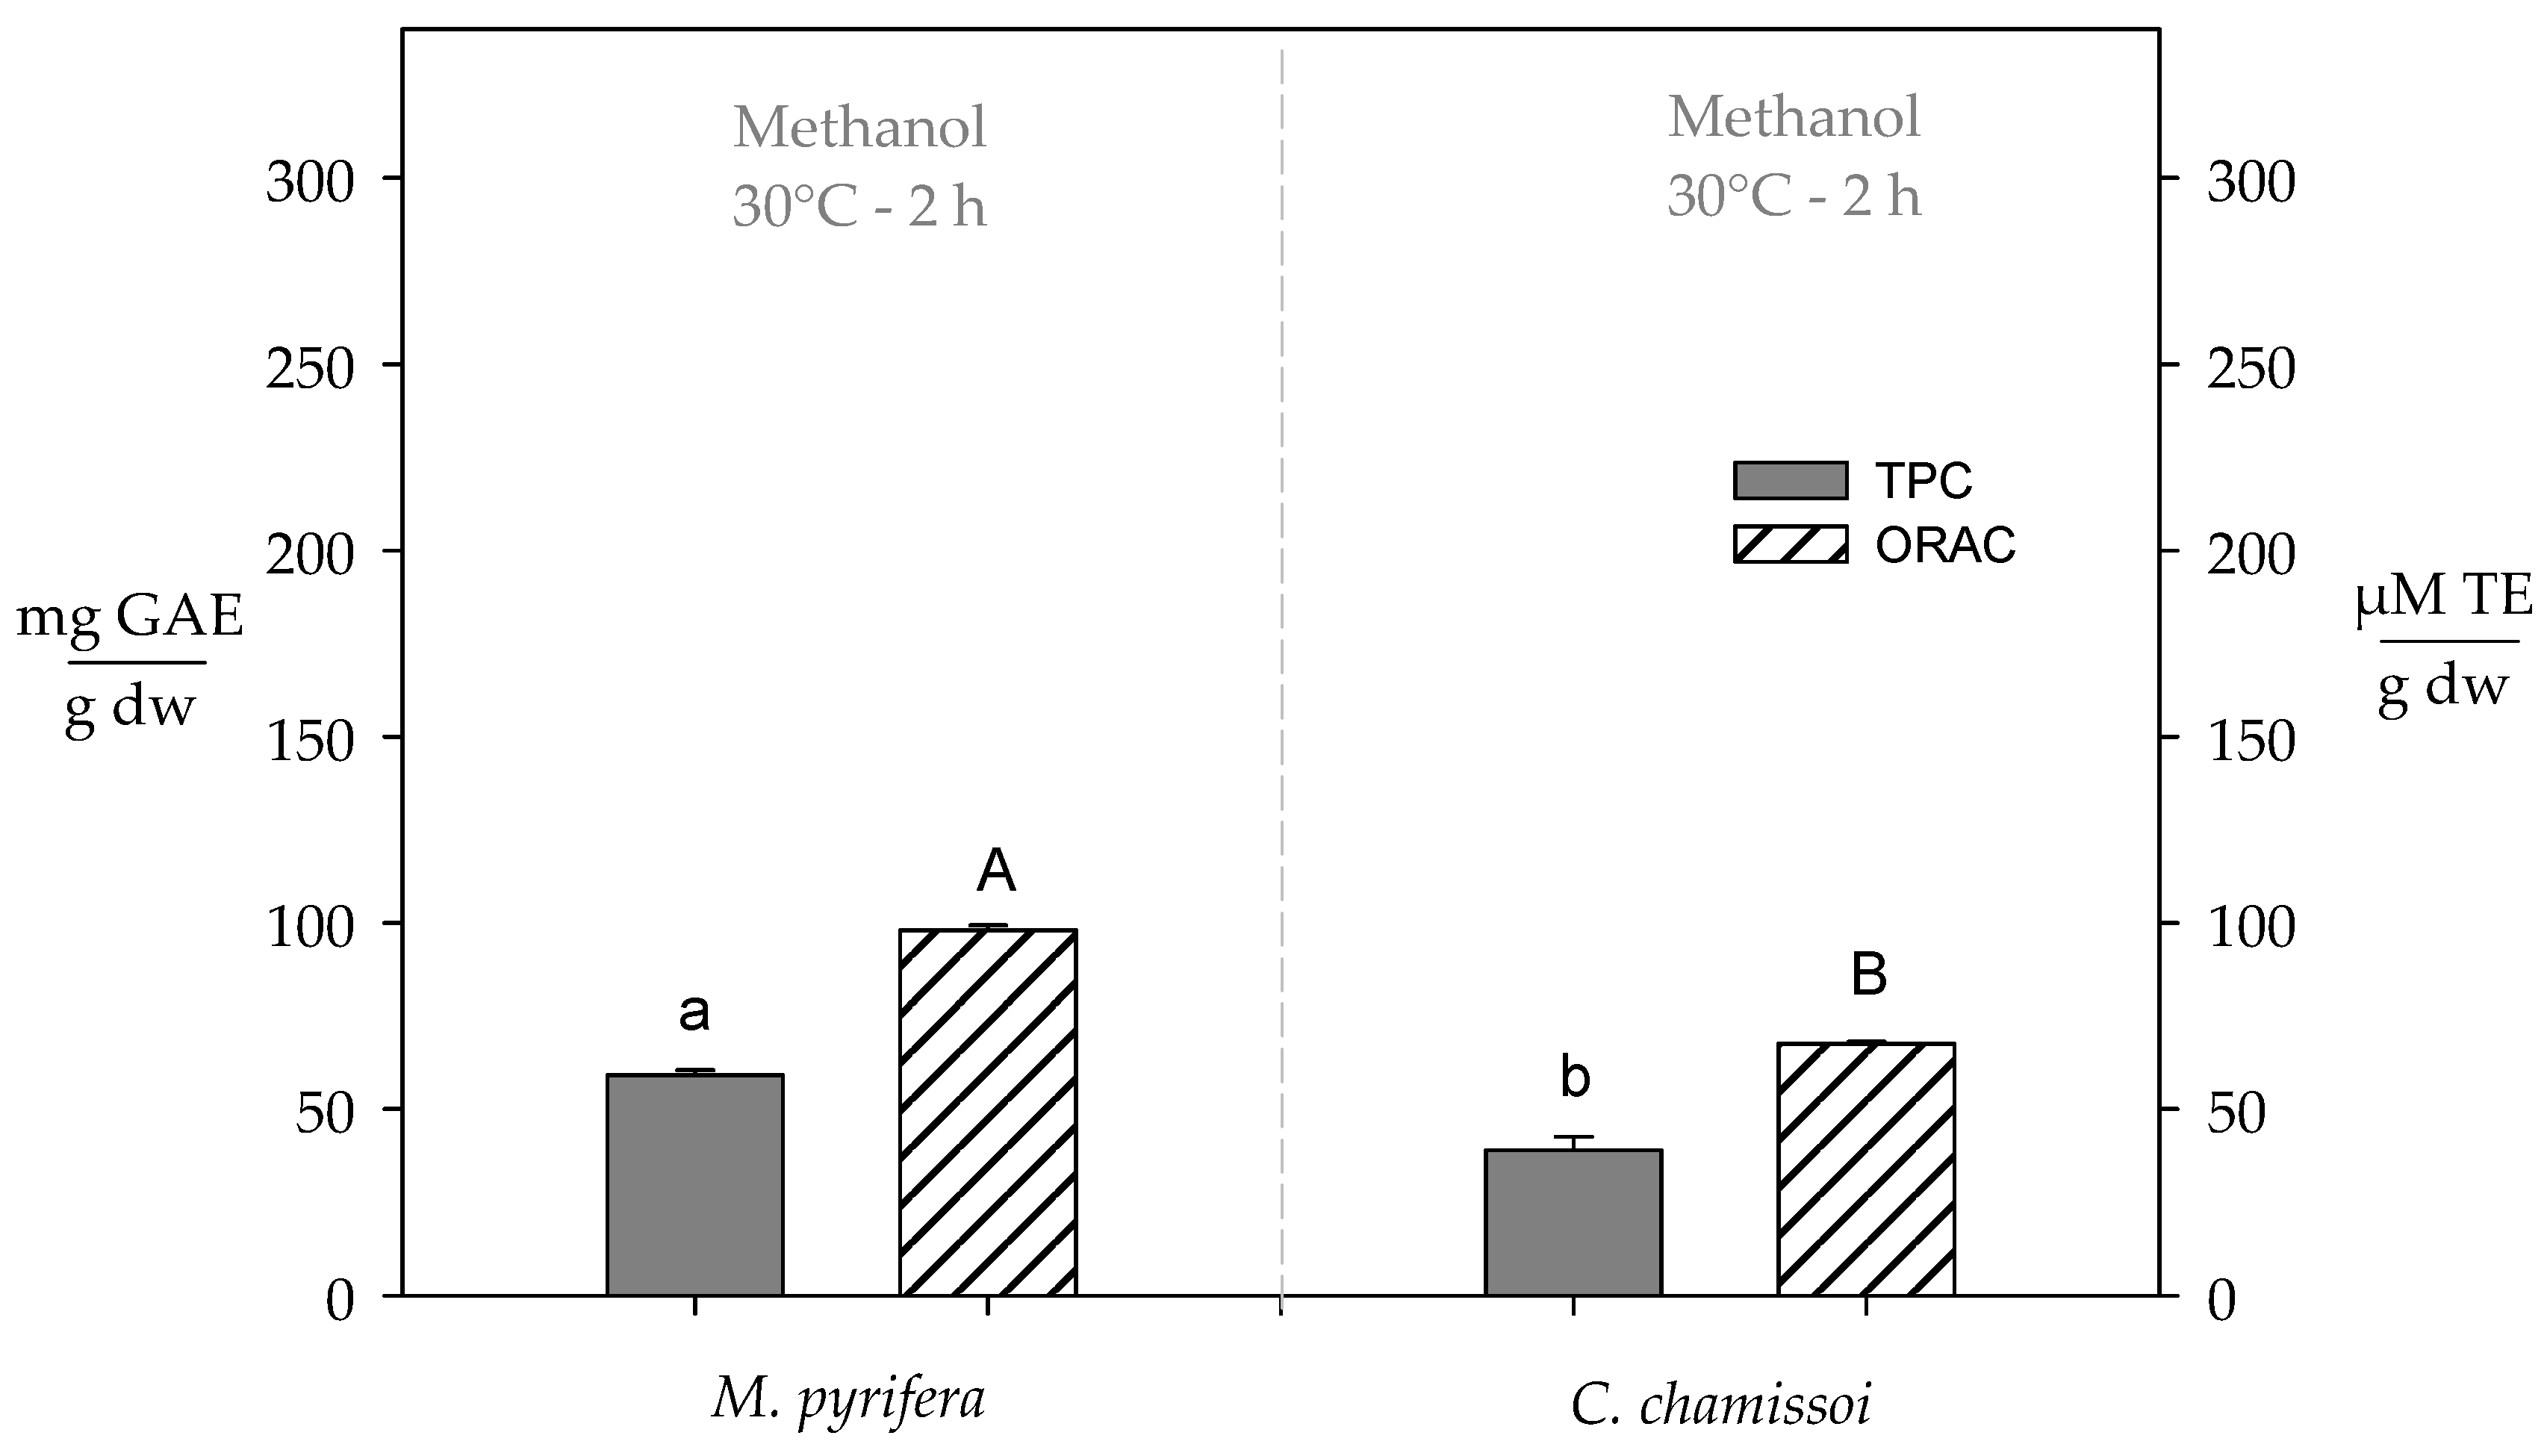
3.4. Total Polyphenol Content and Antioxidant Capacity of Extracts Obtained from Brown (M. pyrifera) and Red (C. chamissoi) Peruvian Seaweed

M. pyrifera extracts presented higher total polyphenol content (51%) and antioxidant capacity (46%) as compared to those obtained from C. chamissoi (Figure 1). Previously, we observed similar results in Chilean seaweed [18]. However, the red and brown seaweeds from Southern Peru presented 9 and 12 times more total polyphenol content as compared to Chilean seaweed. Although these differences would allow M. pyrifera and C. chamissoi to be recognized as a new sustainable source of bioactive compounds, it is necessary to carry out studies that analyze other external factors that can affect the content of polyphenols, such as temperature, light intensity, salinity and chemical composition of nutrients.

3.5. Composition of Minerals

Due to their high capacity to absorb inorganic compounds, seaweeds contain high amounts of minerals. Some of them are essential micronutrients in the human diet. while others are toxic compounds [33]. In our study, the mineral content varies between 0.21 and 912 mg kg−1 for M. pyrifera and from 0.32 to 739 mg kg−1 for C. chamissoi (Table 4). Biancarosa et al. [43] and Olsson et al. [6] found similar concentrations in both species (0.14–1100 mg kg−1).
The essential minerals present in both seaweeds can be ordered according to decreasing concentration as follows: Mg > Ca > Mn > P > Fe > Cu > I. M. pyrifera presented higher content of Mg (912.8 mg kg−1), Ca (657.17 mg kg−1), Mn (657.17 mg kg−1), Fe (46.36 mg kg−1) and Cu (13.19 mg kg−1) as compared to C. chamissoi (Table 4), which is similar to previously reported information for both species, according to Misurcova et al. [33]. Brown seaweed has a greater presence of alginate and alginic acids compared to red seaweed; consequently, they will have a greater ability to interact with the essential minerals previously mentioned. This could explain the differences found in our results.
On the other hand, M. pyrifera had a higher concentration of toxic metals such as Cd (6.62 mg kg−1) and Ni (6.30 mg kg−1) as compared to C. chamissoi (Table 4). Although these values appear to be relatively low, the European Community has established maximum permissible limits for both compounds set at concentrations below 0.5 mg kg−1 [19].
The presence of toxic compounds in Peruvian seaweed highlights the need to develop new strategies that allow for their safe exploitation. Green technologies such as ultrasound assisted extraction integrated to resin purification could be a scalable alternative to maximize the selective separation of beneficial compounds.

4. Conclusions

Peruvian C. chamissoi presented a higher content of carbohydrates, proteins and essential amino acids as compared to M. pyrifera. Conversely, the content of polyunsaturated fatty acids, tocopherols and minerals was significantly higher in M. pyrifera. Additionally, both M. pyrifera and C. chamissoi have significant concentrations of total polyphenols. However, both species contained toxic compounds like Cd and Ni in higher concentrations than the levels demanded by the European Community.
The seaweed species from the southern Peruvian coast are an alternative natural source of nutrients, micronutrients and polyphenols. However, due to the presence of toxic compounds like Ni and Cd in their tissues, the application of new strategies such as ultrasound extraction and resin purification are required for their safe exploitation.

Author Contributions

Designed the experiments and analyzed the data, Y.V., M.F., J.O.-V. and N.L.H.-C.; performed the experiments, Y.V., N.R., L.O.M.-A. and N.R.; wrote the paper, Y.V. and N.L.H.-C. writing—review and editing, M.S.M.-C. All authors have read and agreed to the published version of the manuscript.

Funding

This research received funding from Universidad Nacional de Moquegua-Perú through Resolution C.O. N° 0581-2019-UNAM and Resolution C.O. N° 059-2021-UNAM.

Institutional Review Board Statement

Not applicable.

Informed Consent Statement

Not applicable.

Data Availability Statement

Not applicable.

Conflicts of Interest

The authors declare no conflict of interest.

References

  1. Cotas, J.; Leandro, A.; Monteiro, P.; Pacheco, D.; Figueirinha, A.; Goncąlves, A.M.M.; Da Silva, G.J.; Pereira, L. Seaweed phenolics: From extraction to applications. Mar. Drugs 2020, 18, 384. [Google Scholar] [CrossRef] [PubMed]
  2. Tejada, A.G. Evaluacion de la Variacion Temporal de Biomasa de Algas Marinas Lessonia Nigrescens “Aracanto Negro” en el litoral sur del Peru y Propuesta de Manejo. Master’s Thesis, Ciencias Universidad Nacional San Agustin de Arequipa, Arequipa, Peru, 2019. [Google Scholar]
  3. El-Said, G.F.; El-Sikaily, A. Chemical composition of some seaweed from Mediterranean Sea coast, Egypt. Environ. Monit. Assess. 2013, 185, 6089–6099. [Google Scholar] [CrossRef] [PubMed] [Green Version]
  4. FAO (Food and Agriculture Organization). Alcance de la Industria de las Algas Marinas. Available online: http://www.fao.org/3/y5600s/y5600s07.htm (accessed on 20 January 2021).
  5. Salehi, B.; Sharifi-rad, J.; Seca, A.M.L.; Pinto, D.C.G.A. Current Trends on Seaweeds: Looking at Chemical. Molecules 2019, 24, 4182. [Google Scholar] [CrossRef] [PubMed] [Green Version]
  6. Olsson, J.; Toth, G.B.; Albers, E. Biochemical composition of red, green and brown seaweeds on the Swedish west coast. J. Appl. Phycol. 2020, 32, 3305–3317. [Google Scholar] [CrossRef]
  7. Machado, M.; Machado, S.; Pimentel, F.B.; Freitas, V.; Alves, R.C.; Oliveira, M.B.P.P. Amino acid profile and protein quality assessment of macroalgae produced in an integrated multi-trophic aquaculture system. Foods 2020, 9, 1382. [Google Scholar] [CrossRef]
  8. Pedroso, J.A.B.; Zampieri, T.T.; Donato, J. Reviewing the effects of l-leucine supplementation in the regulation of food intake, energy balance, and glucose homeostasis. Nutrients 2015, 7, 3914–3937. [Google Scholar] [CrossRef] [Green Version]
  9. Singhal, N.K.; Freeman, E.; Arning, E.; Wasek, B.; Clements, R.; Sheppard, C.; Blake, P.; Bottiglieri, T.; McDonough, J. Dysregulation of methionine metabolism in multiple sclerosis. Neurochem. Int. 2018, 112, 1–4. [Google Scholar] [CrossRef]
  10. Chen, S.F.; Pan, M.X.; Tang, J.C.; Cheng, J.; Zhao, D.; Zhang, Y.; Liao, H.B.; Liu, R.; Zhuang, Y.; Zhang, Z.F.; et al. Arginine is neuroprotective through suppressing HIF-1α/LDHA-mediated inflammatory response after cerebral ischemia/reperfusion injury. Mol. Brain 2020, 13, 1–13. [Google Scholar] [CrossRef] [Green Version]
  11. Lee, D.-Y.; Kim, E.-H. Therapeutic Effects of Amino Acids in Liver Diseases: Current Studies and Future Perspectives. J. Cancer Prev. 2019, 24, 72–78. [Google Scholar] [CrossRef]
  12. Lafarga, T.; Acién-Fernández, F.G.; Garcia-Vaquero, M. Bioactive peptides and carbohydrates from seaweed for food applications: Natural occurrence, isolation, purification, and identification. Algal Res. 2020, 48, 1–10. [Google Scholar] [CrossRef]
  13. Stiger-Pouvreau, V.; Bourgougnon, N.; Deslandes, E. Chapter 8—Carbohydrates from Seaweeds. In Seaweed in Health and Disease Prevention; Fleurence, J., Levine, I., Eds.; Academic Press: San Diego, CA, USA, 2016; pp. 223–274. [Google Scholar]
  14. Gosch, B.J.; Magnusson, M.; Paul, N.A.; de Nys, R. Total lipid and fatty acid composition of seaweeds for the selection of species for oil-based biofuel and bioproducts. GCB Bioenergy 2012, 4, 919–930. [Google Scholar] [CrossRef] [Green Version]
  15. Susanto, E.; Fahmi, A.S.; Abe, M.; Hosokawa, M.; Miyashita, K. Lipids, Fatty Acids, and Fucoxanthin Content from Temperate and Tropical Brown Seaweeds. Aquat. Procedia 2016, 7, 66–75. [Google Scholar] [CrossRef]
  16. Kendel, M.; Wielgosz-Collin, G.; Bertrand, S.; Roussakis, C.; Bourgougnon, N.B.; Bedoux, G. Lipid composition, fatty acids and sterols in the seaweeds ulva armoricana, and solieria chordalis from brittany (France): An analysis from nutritional, chemotaxonomic, and antiproliferative activity perspectives. Mar. Drugs 2015, 13, 5606–5628. [Google Scholar] [CrossRef]
  17. Hwang, E.S.; Thi, N. Do Effects of extraction and processing methods on antioxidant compound contents and radical scavenging activities of laver (Porphyra tenera). Prev. Nutr. Food Sci. 2014, 19, 40–48. [Google Scholar] [CrossRef]
  18. Pacheco, L.V.; Parada, J.; Pérez-Correa, J.R.; Mariotti-Celis, M.S.; Erpel, F.; Zambrano, A.; Palacios, M. Bioactive Polyphenols from Southern Chile Seaweed as Inhibitors of Enzymes for Starch Digestion. Mar. Drugs 2020, 18, 353. [Google Scholar] [CrossRef]
  19. Circuncisão, A.R.; Catarino, M.D.; Cardoso, S.M.; Silva, A.M.S. Minerals from macroalgae origin: Health benefits and risks for consumers. Mar. Drugs 2018, 16, 400. [Google Scholar] [CrossRef] [PubMed] [Green Version]
  20. Rupérez, P. Mineral content of edible marine seaweeds. Food Chem. 2002, 79, 23–26. [Google Scholar] [CrossRef]
  21. Roleda, M.Y.; Marfaing, H.; Desnica, N.; Jónsdóttir, R.; Skjermo, J.; Rebours, C.; Nitschke, U. Variations in polyphenol and heavy metal contents of wild-harvested and cultivated seaweed bulk biomass: Health risk assessment and implication for food applications. Food Control 2019, 95, 121–134. [Google Scholar] [CrossRef]
  22. Horwitz, W.; Latimer, G. Official Methods of Analysis of AOAC International, 18th ed.; AOAC International: Gaithersburg, MA, USA, 2005. [Google Scholar]
  23. González-Castro, M.J.; López-Hernández, J.; Simal-Lozano, J.; Oruña-Concha, M.J. Determination of Amino Acids in Green Beans by Derivatization with Phenylisothiocianate and High-Performance Liquid Chromatography with Ultraviolet Detection. J. Chromatogr. Sci. 1997, 35, 181–185. [Google Scholar] [CrossRef] [Green Version]
  24. Frank, D.; Sandra, P.; Philip, W. Improving the Analysis of Fatty Acid Methyl Esters Using Retention Time Locked Methods and Retention Time Databases; Agilent Technologies, Inc.: Wilmington, DE, USA, 2002; pp. 1–10. [Google Scholar]
  25. Lampi, A.M. Tocopherols and Tocotrienols in Vegetable Oils and Fats by HPLC, 3rd ed.; AOCS American Oil Chemists Society: Urbana, IL, USA, 1993. [Google Scholar]
  26. Jorhem, L. Determination of metals in foods by atomic absorption spectrometry after dry ashing. J AOAC Int. 2000, 83, 1204. [Google Scholar] [CrossRef] [Green Version]
  27. Fernández-Segovia, I.; Lerma-García, M.J.; Fuentes, A.; Barat, J.M. Characterization of Spanish powdered seaweeds: Composition, antioxidant capacity and technological properties. Food Res. Int. 2018, 111, 212–219. [Google Scholar] [CrossRef]
  28. Chun, S.S.; Vattem, D.A.; Lin, Y.T.; Shetty, K. Phenolic antioxidants from clonal oregano (Origanum vulgare) with antimicrobial activity against Helicobacter pylori. Process Biochem. 2005, 40, 809–816. [Google Scholar] [CrossRef]
  29. Davalos, A.; Gómez, C.; Begoña, B. Extending Applicability of the Oxygen Radical Absorbance Capacity (ORAC–Fluorescein) Assay. J. Agric. Food Chem. 2004, 52, 48–54. [Google Scholar] [CrossRef]
  30. Vásquez, V.; Martínez, R.; Bernal, C. Enzyme-assisted extraction of proteins from the seaweeds Macrocystis pyrifera and C hondracanthus chamissoi: Characterization of the extracts and their bioactive potential. J. Appl. Phycol. 2019, 31, 1999–2010. [Google Scholar] [CrossRef]
  31. Gamero-vega, G.; Palacios-palacios, M.; Quitral, V. Nutritional Composition and Bioactive Compounds of Red Seaweed: A Mini-Review. J. Food Nutr. Res. 2020, 8, 431–440. [Google Scholar] [CrossRef]
  32. Leyton, A.; Pezoa-conte, R.; Barriga, A.; Buschmann, A.H.; Mäki-arvela, P.; Mikkola, J.; Lienqueo, M.E. Identi fi cation and ef fi cient extraction method of phlorotannins from the brown seaweed Macrocystis pyrifera using an orthogonal experimental design. ALGAL 2016, 16, 201–208. [Google Scholar] [CrossRef]
  33. Misurcova, L. Chemical Composition of Seaweeds. In Handbook of Marine Macroalgae: Biotechnology and Applied Phycology; Kim, S.K., Ed.; John Wiley & Sons, Ltd.: Hoboken, NJ, USA, 2018; pp. 171–192. [Google Scholar]
  34. Hotimchenko, S. V Fatty Acid Composition of Algae from Habitats with Varying Amounts of Illumination. Biol. Chem. 2002, 28, 218–220. [Google Scholar]
  35. Harrysson, H. Production of protein extracts from Swedish red, green, and brown seaweeds, Porphyra umbilicalis Kützing, Ulva lactuca Linnaeus, and Saccharina latissima (Linnaeus) J.V. Lamouroux using three different methods. J. Appl. Phycol. 2018, 30, 3565–3580. [Google Scholar] [CrossRef] [Green Version]
  36. Astorga-españa, M.S.; Rodríguez-galdón, B.; Rodríguez-rodríguez, E.M.; Díaz-romero, C. Journal of Food Composition and Analysis Amino acid content in seaweeds from the Magellan Straits (Chile). J. Food Compos. Anal. 2016, 53, 77–84. [Google Scholar] [CrossRef]
  37. Burghardt, R.C.; Johnson, G.A. Proline and hydroxyproline metabolism: Implications for animal and human nutrition. HHS Public Access 2013, 40, 1053–1063. [Google Scholar]
  38. Razak, M.A.; Begum, P.S.; Viswanath, B.; Rajagopal, S. Multifarious Beneficial Effect of Nonessential Amino Acid, Glycine: A Review. Oxidative Med. Cell. Longev. 2017, 2017, 1–10. [Google Scholar] [CrossRef]
  39. Shannon, E.; Abu-Ghannam, N. Seaweeds as nutraceuticals for health and nutrition. Phycologia 2019, 58, 563–577. [Google Scholar] [CrossRef] [Green Version]
  40. Ortiz, J.; Romero, N.; Robert, P.; Araya, J.; Lopez-Hernández, J.; Bozzo, C.; Navarrete, E.; Osorio, A.; Rios, A. Dietary fiber, amino acid, fatty acid and tocopherol contents of the edible seaweeds Ulva lactuca and Durvillaea antarctica. Food Chem. 2006, 99, 98–104. [Google Scholar] [CrossRef]
  41. Sánchez-Machado, D.I.; López-Cervantes, J.; López-Hernández, J.; Paseiro-Losada, P. Fatty acids, total lipid, protein and ash contents of processed edible seaweeds. Food Chem. 2004, 85, 439–444. [Google Scholar] [CrossRef]
  42. Herrero, M.; Mendiola, J.; Plaza, M.; Ibañez, E. Screening for Bioactive Compounds from Algae. In Advanced Biofuels and Bioproducts; Lee, J.W., Ed.; Springer: New York, NY, USA, 2012; pp. 833–872. [Google Scholar]
  43. Biancarosa, I.; Belghit, I.; Bruckner, C.G.; Liland, N.S.; Waagbø, R.; Amlund, H.; Heesch, S.; Lock, E.J. Chemical characterization of 21 species of marine macroalgae common in Norwegian waters: Benefits of and limitations to their potential use in food and feed. J. Sci. Food Agric. 2018, 98, 2035–2042. [Google Scholar] [CrossRef] [PubMed] [Green Version]
Figure 1. Total content of polyphenols and antioxidant capacity of methanolic extracts obtained from Peruvian brown and red seaweed. The significant differences (p < 0.05) between M. pyrifera and C. chamissoi were established with different lower-case letters and capital letters for TPC and ORAC, respectively.
Agronomy 11 01669 g001
Table 1. Proximal analysis of brown (M. pyrifera) and red (C. chamissoi) Peruvian seaweed.
DescriptionC. chamissoiM. pyrifera
MeanCVMeanCV
Moisture (%)11.69 a0.046.37 b0.05
Protein (%)12.16 a0.055.86 b0.04
Fat (%)0.16 b0.090.74 a0.08
Ash (%)13.34 b0.0343.74 a0.02
Carbohidrates (%)62.65 a0.0043.29 b0.02
The results are expressed as g per 100 g dry weight and CV (coefficient variation). Different lower-case letters in the same row indicate differences between species of seaweed (p < 0.05).
Table 2. Amino acids profile of brown (M. pyrifera) and red (C. chamissoi) Peruvian seaweed.
DescriptionM. pyriferaC. chamissoi
Mean
(mg 100 g−1, dw)
CVMean
(mg 100 g−1, dw)
CV
Essential amino acids
Histidine4.91 a0.1012.14 b0.06
Threonine9.91 a0.1515.67 a0.09
Valine5.10 a0.2219.45 b0.10
Methionine8.96 a0.1211.76 a0.13
Phenylalanine6.02 a0.1418.18 a0.12
Isoleucine3.58 a0.1313.23 b0.10
Leucine11.83 a0.1338.93 b0.09
Lysine4.66 a0.0519.43 b0.12
Non-essential amino acids
Aspartic Acid7.41 a0.1421.29 b0.12
Glutamic Acid15.26 a0.1142.72 b0.10
Serine15.52 a0.1457.66 b0.08
Glycine20.60 a0.1159.04 b0.05
Arginine11.04 a0.1350.36 b0.07
Alanine13.88 a0.1228.56 a0.09
Tyrosine4.38 a0.1410.72 a0.09
CystineND ND
Proline22.70 a0.1459.81 b0.04
The results are expressed as g per g of protein dry weight (%) and CV (coefficient variation). Different lower-case letters in the same row indicate differences between species of seaweed (p < 0.05).
Table 3. Composition of saturated and unsaturated acids of brown (M. pyrifera) and red (C. chamissoi) Peruvian seaweed.
DescriptionM. pyriferaC. chamissoi
Fatty Acids (%) Mean CVMean CV
Arachidonic acid (C20:4, ω 6)15.770.03ND
Stearic acid (C18:0)10.31 a0.0217.22 b0.02
Omega 9 (C18:1, ω 9)16.40 a0.0215.52 a0.04
Palmitoleic acid (C16:1, ω 7)ND 2.760.01
Palmitic acid (C16:0)24.69 a0.0327.91 b0.02
Myristic acid (C14:0)10.770.06ND0.03
Total saturated49.14 a0.0245.13 b0.02
Total monounsaturated16.40 a0.0418.29 b0.03
Total polyunsaturated15.770.03ND
Tocopherols
(µg 100 g−1, dw)
α-Tocopherol2.14 a0.141.21 b0.05
δ-Tocopherol0.23 a 0.110.12 b0.02
Fatty acids are expressed as g per 100 g of lipid dry weight (%) and CV (coefficient variation). Different lower-case letters in the same row indicate differences between species of seaweed (p < 0.05).
Table 4. Mineral composition of brown (M. pyrifera) and red (C. chamissoi) Peruvian seaweed.
DescriptionM. pyriferaC. chamissoi
MineralsMean
(mg kg−1, dw)
CVMean
(mg kg−1, dw)
CV
Copper13.19 a0.038.41 a0.04
Cadmium6.62 a0.021.57 b0.02
Nickel6.30 a0.003.72 b0.01
Calcium657.17 a0.02413.77 b0.02
Magnesium912.80 a0.03739.48 b0.02
Phosphorus98.82 a0.04119.53 a0.04
Iodine2.04 a0.000.37 b0.01
Arsenic0.21 a0.010.32 a0.03
Manganese143.33 a0.024.81 b0.02
Iron46.36 a0.028.61 b0.03
The results are expressed as mean and CV (coefficient variation). Different lower-case letters in the same row indicate differences between species of seaweed (p < 0.05).
Publisher’s Note: MDPI stays neutral with regard to jurisdictional claims in published maps and institutional affiliations.

