
A Hybrid Intelligent Approach to Predict Discharge Diagnosis in Pediatric Surgical Patients

 ,
,  ,
,  ,
, 
 and
and 
Abstract
:1. Introduction
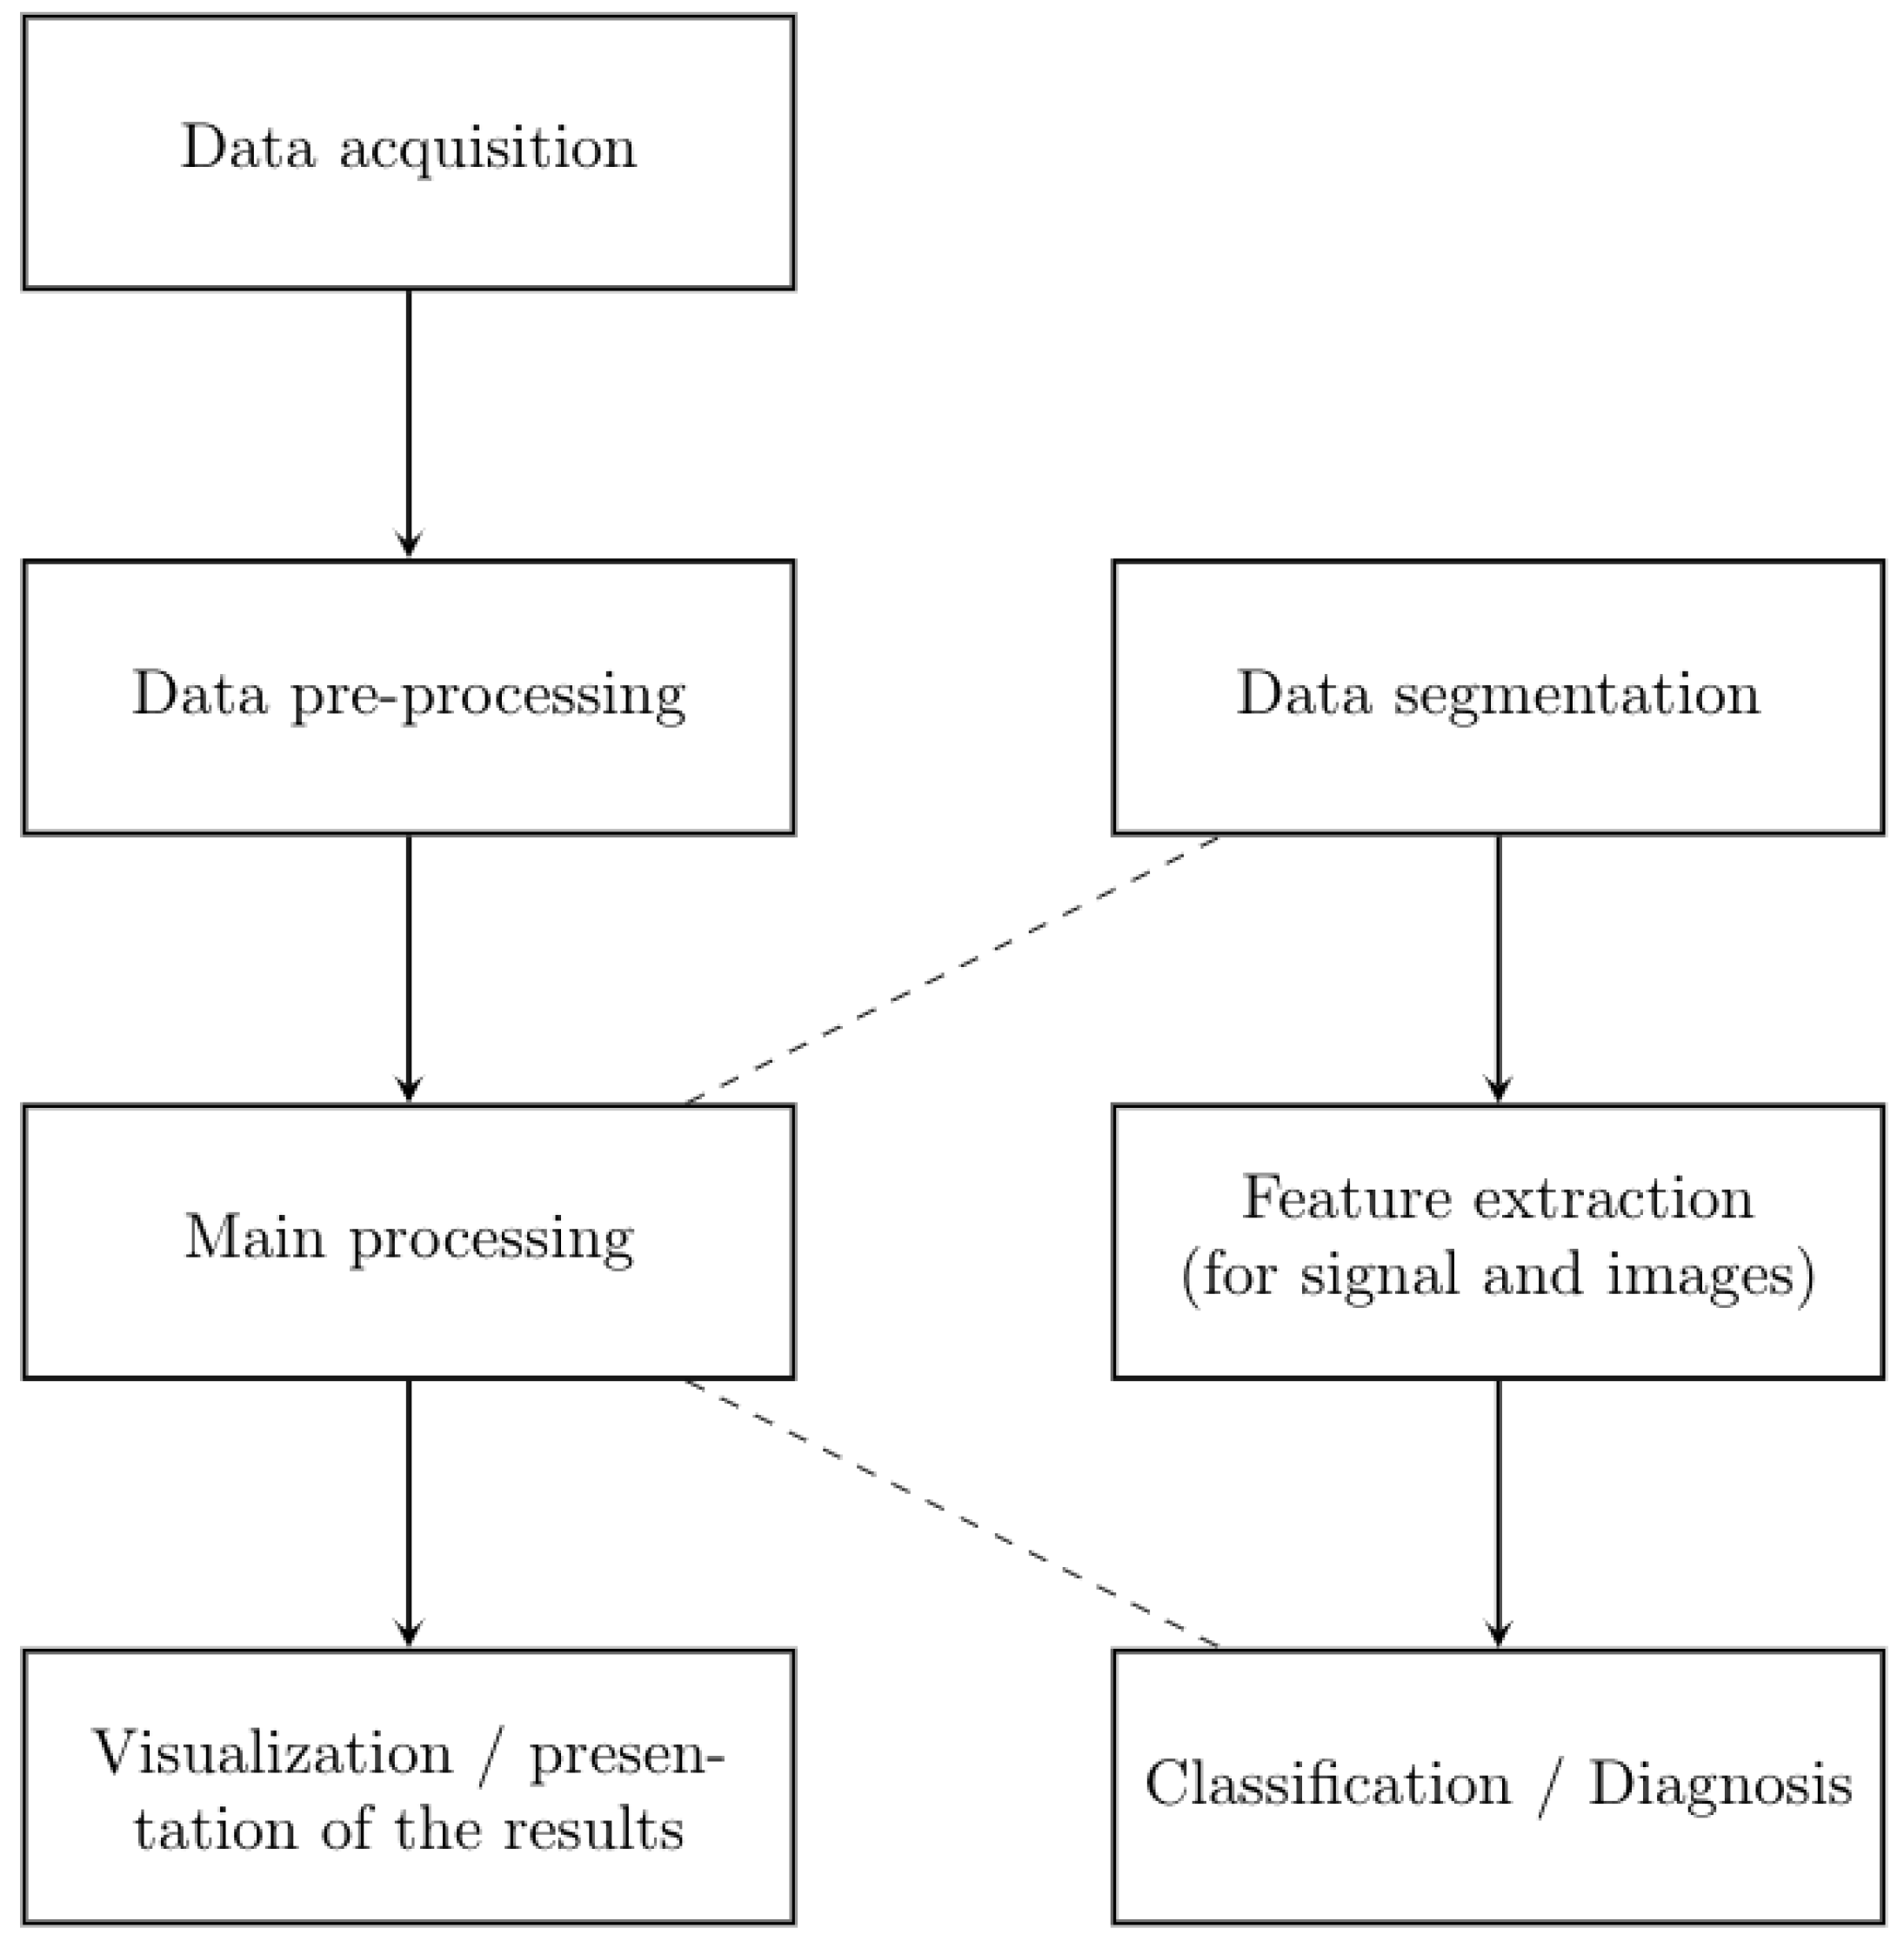
2. Materials and Methods
2.1. Data Acquisition
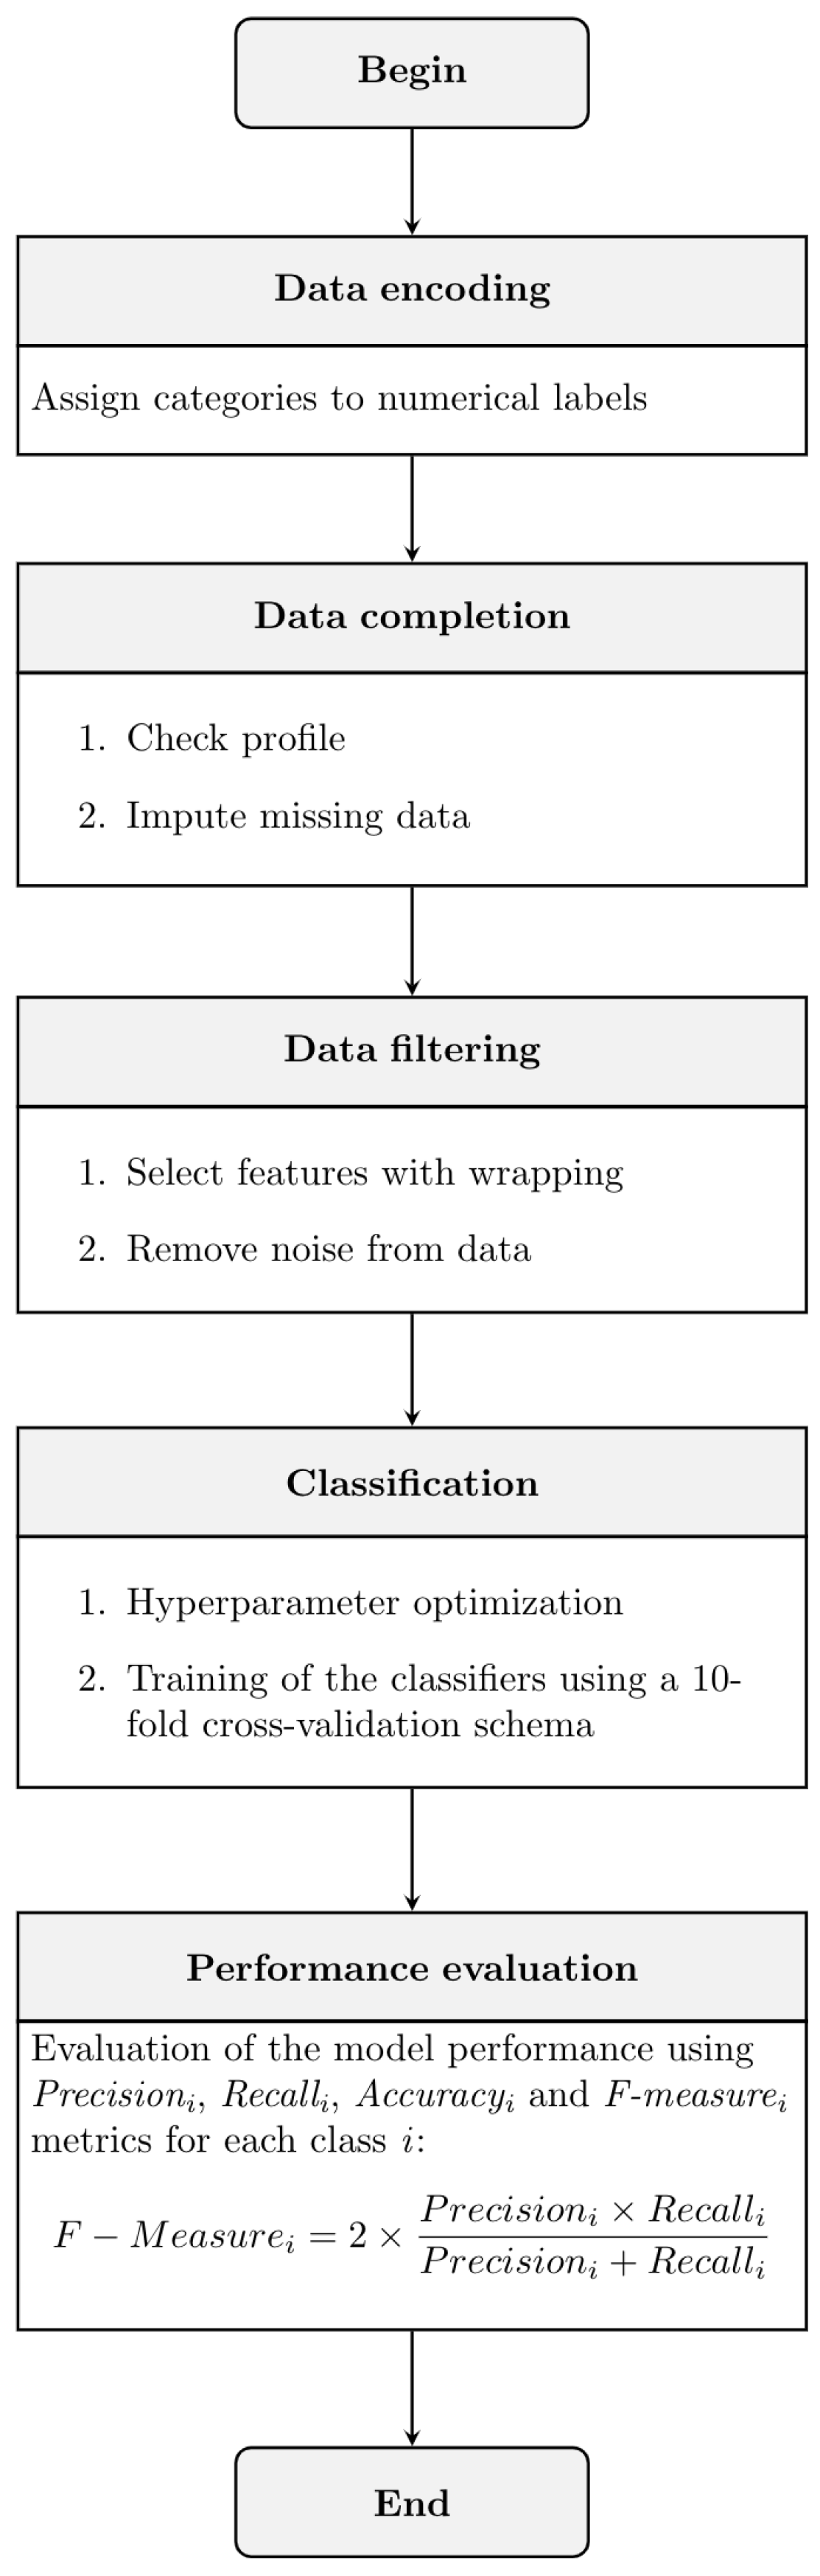
2.2. Experimental Methodology
2.2.1. Pre-Processing Data
Data Encoding
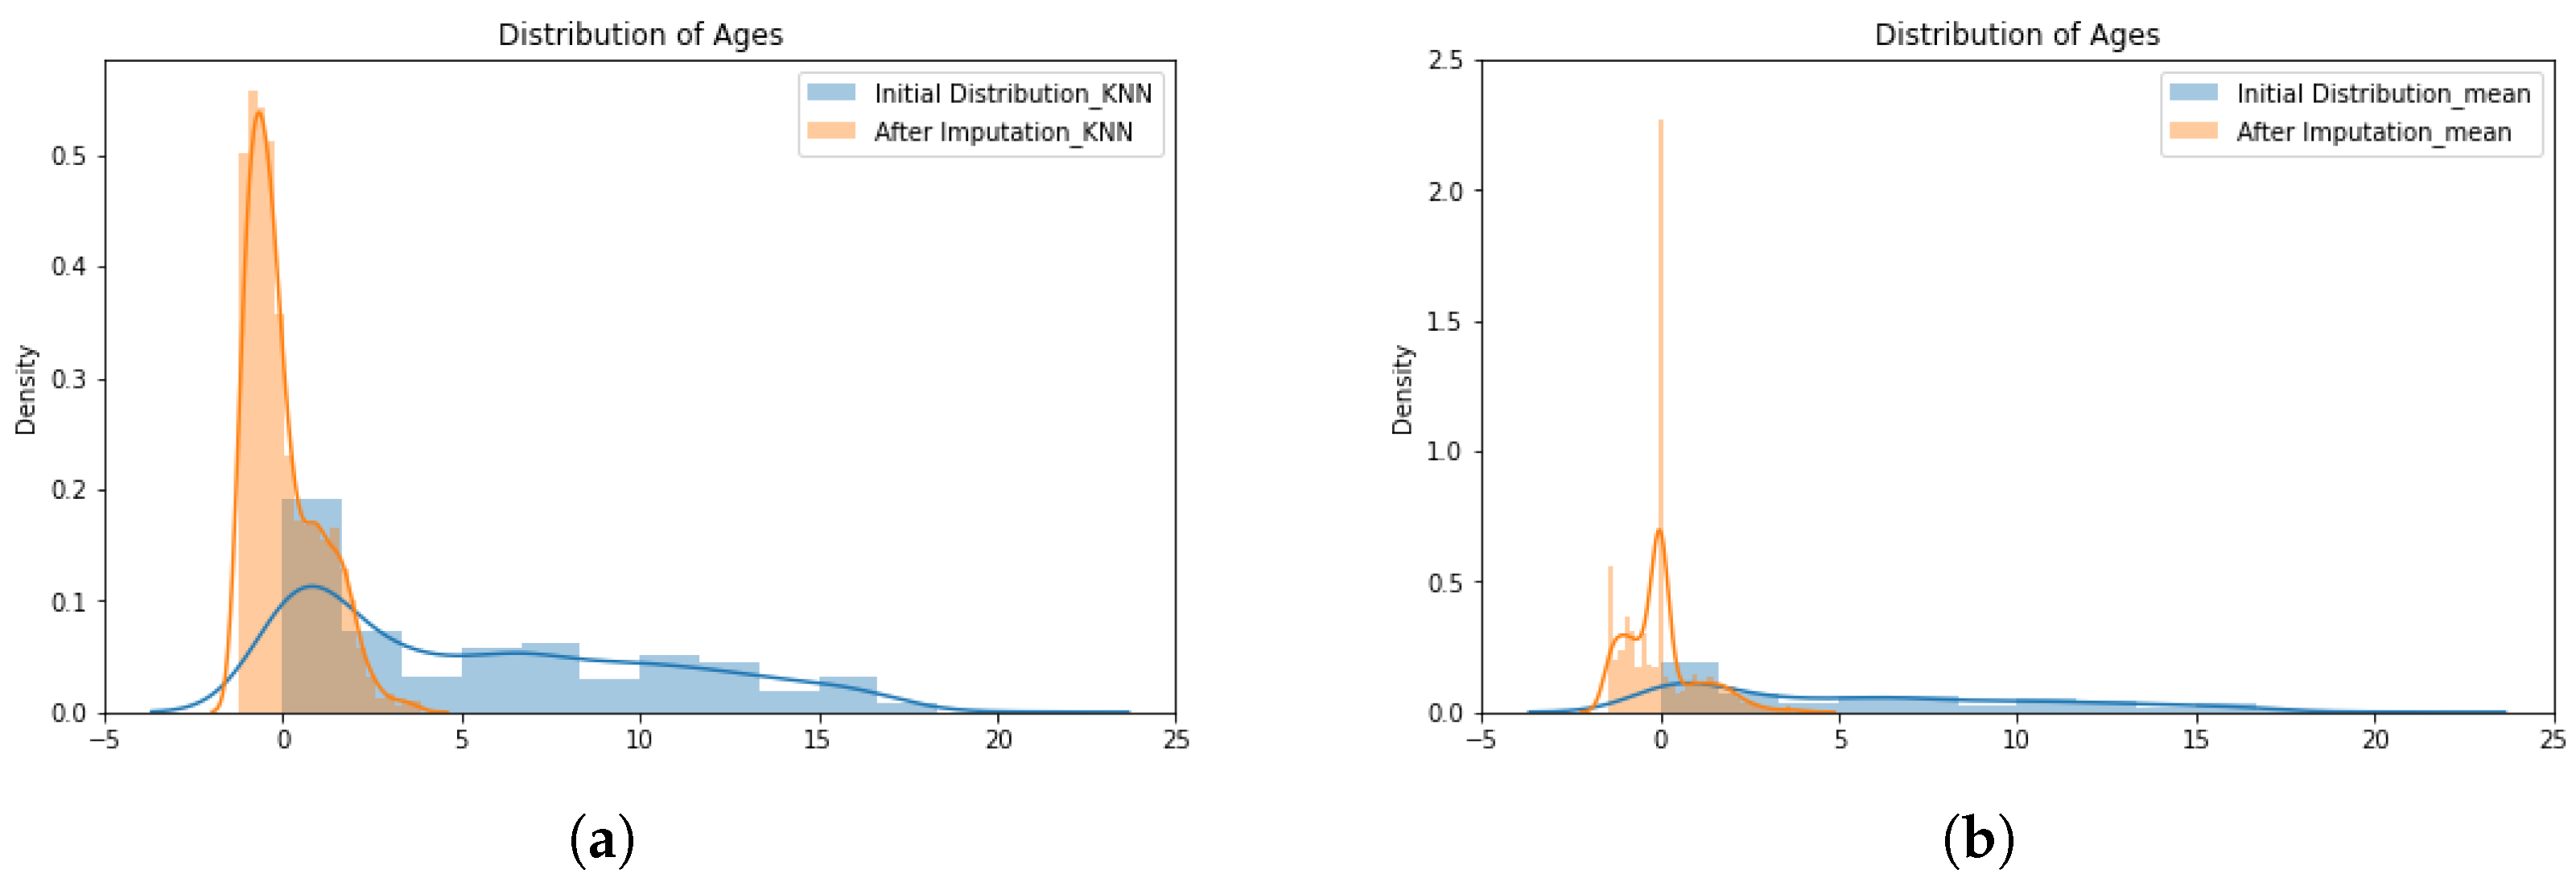
Data Completion
- The K-nearest neighbors imputer employs the K-nearest neighbor (KNN) classifier with Euclidean distance, as shown in Equation (1), to describe the similarity between the incomplete record () and other records nearby () [33,34]:where is the Euclidean distance between the encoded medical records; and n symbolizes the number of features. The estimate of the missing value at record i compared to the record j is given bywhere k is the number of samples selected from features; is the input matrix for the record; and is the similarity weight defined bywhere is the rank distance of the neighbors.
- The simple imputer method employed is based on mean, as described by Buuren and Groothuis-Oudshoorn [35]. The simple imputer replaces the missing values with the mean value of the missing feature, considering all records in training data, according to:where values in matrix X are the observations of each feature in the medical record; and N is the amount of records used for training.
2.2.2. Main Processing
Data Filtering
Classification with XGBoost
2.3. Performance Evaluation
3. Experimental Results
3.1. Pre-Processing Results
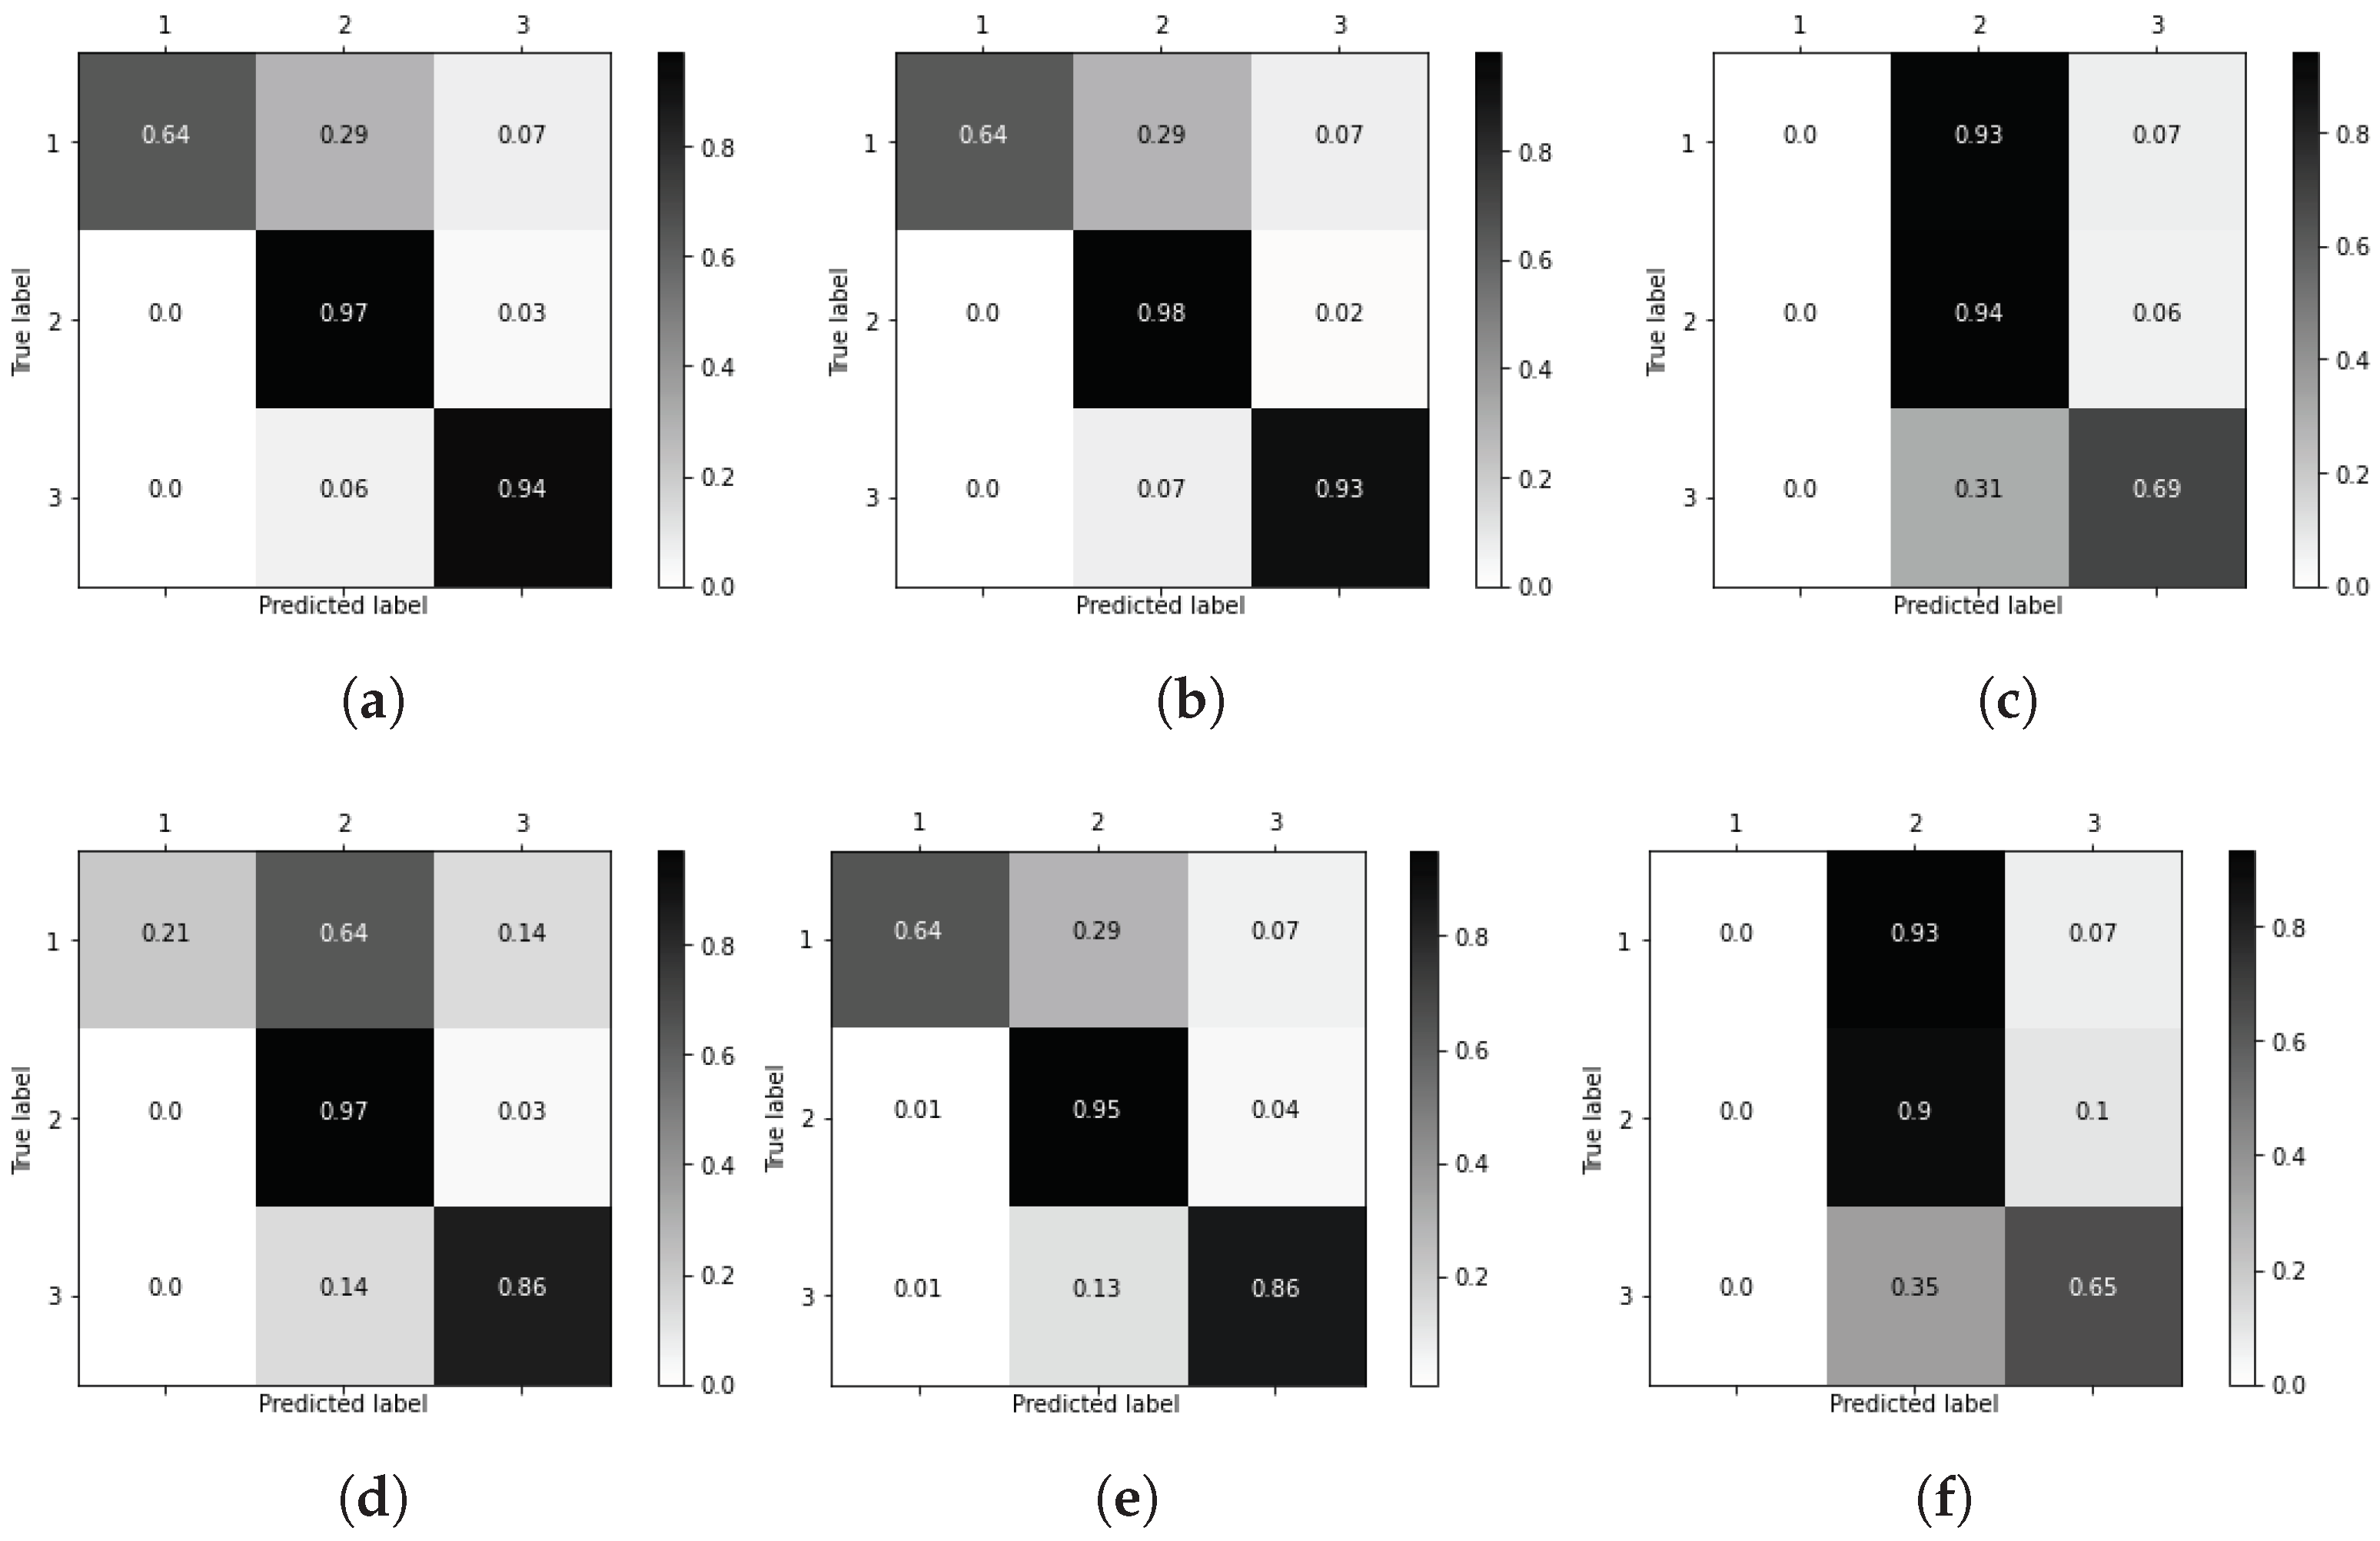
3.2. Main Processing
3.3. Decision Trees for Computer-Aided Diagnosis
4. Conclusions
Author Contributions
Funding
Institutional Review Board Statement
Informed Consent Statement
Data Availability Statement
Acknowledgments
Conflicts of Interest
References
- Yanase, J.; Triantaphyllou, E. A systematic survey of computer-aided diagnosis in medicine: Past and present developments. Expert Syst. Appl. 2019, 138, 1–25. [Google Scholar] [CrossRef]
- Yanase, J.; Triantaphyllou, E. The seven key challenges for the future of computer-aided diagnosis in medicine. Int. J. Med. Inform. 2019, 129, 413–422. [Google Scholar] [CrossRef]
- Coventry, B.J. Pediatric Surgery; Springer: London, UK, 2014. [Google Scholar]
- Frongia, G.; Mehrabi, A.; Ziebell, L.; Schenk, J.P.; Gunther, P. Predicting Postoperative Complications After Pediatric Perforated Appendicitis. J. Investig. Surg. 2016, 29, 185–194. [Google Scholar] [CrossRef] [PubMed]
- Ozgediz, D.; Langer, M.; Kisa, P.; Poenaru, D. Pediatric surgery as an essential component of global child health. Semin. Pediatr. Surg. 2016, 25, 3–9. [Google Scholar] [CrossRef] [PubMed]
- Fowler, B.; Rajendiran, M.; Schroeder, T.; Bergh, N.; Flower, A.; Kang, H. Predicting patient revisits at the University of Virginia Health System Emergency Department. In Proceedings of the 2017 Systems and Information Engineering Design Symposium (SIEDS), Charlottesville, VA, USA, 28 April 2017; pp. 253–258. [Google Scholar] [CrossRef]
- Greenberg, S.; Ng Kamstra, J.; Ameh, E.; Ozgediz, D.; Poenaru, D.; Bickler, S. An investment in knowledge: Research in global pediatric surgery for the 21st century. Semin. Pediatr. Surg. 2016, 25, 51–60. [Google Scholar] [CrossRef]
- Escobar, M.; Caty, M. Complications in neonatal surgery. Semin. Pediatr. Surg. 2016, 25, 347–370. [Google Scholar] [CrossRef] [PubMed]
- Peker, M. A decision support system to improve medical diagnosis using a combination of k-medoids clustering based attribute weighting and SVM. J. Med. Syst. 2016, 40, 116. [Google Scholar] [CrossRef] [PubMed]
- Bennett, T.D.; Callahan, T.J.; Feinstein, J.A.; Ghosh, D.; Lakhani, S.A.; Spaeder, M.C.; Szefler, S.J.; Kahn, M.G. Data science for child health. J. Pediatr. 2019, 208, 12–22. [Google Scholar] [CrossRef]
- Wong, H.R. Intensive care medicine in 2050: Precision medicine. Intensive Care Med. 2017, 43, 1507–1509. [Google Scholar] [CrossRef] [PubMed] [Green Version]
- Suri, J.S.; Singh, S.; Reden, L. Computer Vision and Pattern Recognition Techniques for 2-D and 3-D MR Cerebral Cortical Segmentation (Part I): A State-of-the-Art Review. Pattern Anal. Appl. 2002, 5, 46–76. [Google Scholar] [CrossRef]
- Khuwaja, G.A.; Abu-Rezq, A.N. Bi-modal breast cancer classification system. Pattern Anal. Appl. 2004, 7, 235–242. [Google Scholar] [CrossRef]
- Moore, M.M.; Slonimsky, E.; Long, A.D.; Sze, R.W.; Iyer, R.S. Machine learning concepts, concerns and opportunities for a pediatric radiologist. Pediatr. Radiol. 2019, 49, 509–516. [Google Scholar] [CrossRef]
- Triantaphyllou, E. Data Mining and Knowledge Discovery via Logic-Based Methods: Theory, Algorithms, and Applications; Springer Science+Business Media: New York, NY, USA, 2010. [Google Scholar]
- Kuncheva, L. Combining Pattern Classifiers; Wiley: Hoboken, NJ, USA, 2014. [Google Scholar] [CrossRef]
- Hameed, K.; Chai, D.; Rassau, A. A Progressive Weighted Average Weight Optimisation Ensemble Technique for Fruit and Vegetable Classification. In Proceedings of the 2020 16th International Conference on Control, Automation, Robotics and Vision (ICARCV), Shenzhen, China, 13–15 December 2020; pp. 303–308. [Google Scholar]
- Hameed, K.; Chai, D.; Rassau, A. A Sample Weight and AdaBoost CNN-Based Coarse to Fine Classification of Fruit and Vegetables at a Supermarket Self-Checkout. Appl. Sci. 2020, 10, 8667. [Google Scholar] [CrossRef]
- Lu, W.; Li, Z.; Chu, J. A novel computer-aided diagnosis system for breast MRI based on feature selection and ensemble learning. Comput. Biol. Med. 2017, 83, 157–165. [Google Scholar] [CrossRef]
- Savasci, D.; Ornek, A.H.; Ervural, S.; Ceylan, M.; Konak, M.; Soylu, H. Classification of unhealthy and healthy neonates in neonatal intensive care units using medical thermography processing and artificial neural network. In Classification Techniques for Medical Image Analysis and Computer Aided Diagnosis; Elsevier: Amsterdam, The Netherlands, 2019; pp. 1–29. [Google Scholar] [CrossRef]
- Simon, A.; Vinayakumar, R.; Sowmya, V.; Soman, K.P.; Gopalakrishnan, E.A.A. A deep learning approach for patch-based disease diagnosis from microscopic images. In Classification Techniques for Medical Image Analysis and Computer Aided Diagnosis; Elsevier: Amsterdam, The Netherlands, 2019; pp. 109–127. [Google Scholar] [CrossRef]
- Zheng, Q.; Furth, S.L.; Tasian, G.E.; Fan, Y. Computer-aided diagnosis of congenital abnormalities of the kidney and urinary tract in children based on ultrasound imaging data by integrating texture image features and deep transfer learning image features. J. Pediatr. Urol. 2019, 15, 75.e1–75.e7. [Google Scholar] [CrossRef] [PubMed] [Green Version]
- Hernandez-Suarez, D.F.; Ranka, S.; Kim, Y.; Latib, A.; Wiley, J.; Lopez-Candales, A.; Pinto, D.S.; Gonzalez, M.C.; Ramakrishna, H.; Sanina, C.; et al. Machine-learning-based in-hospital mortality prediction for transcatheter mitral valve repair in the United States. Cardiovasc. Revascularization Med. 2020. [Google Scholar] [CrossRef] [PubMed]
- Kandil, H.; Soliman, A.; Taher, F.; Ghazal, M.; Khalil, A.; Giridharan, G.; Keynton, R.; Jennings, J.R.; El-Baz, A. A novel computer-aided diagnosis system for the early detection of hypertension based on cerebrovascular alterations. Neuroimage Clin. 2020, 25, 102107. [Google Scholar] [CrossRef] [PubMed]
- Rajagopal, R. Automated arrhythmia classification for monitoring cardiac patients using machine learning techniques. In Classification Techniques for Medical Image Analysis and Computer Aided Diagnosis; Elsevier: Amsterdam, The Netherlands, 2019; pp. 153–177. [Google Scholar]
- Amami, R.; Smitib, A. An incremental method combining density clustering and support vector machines for voice pathology detection. Comput. Electr. Eng. 2017, 57, 257–265. [Google Scholar] [CrossRef]
- Samikannu, R.; Ravi, R.; Murugan, S.; Diarra, B. An Efficient Image Analysis Framework for the Classification of Glioma Brain Images Using CNN Approach. Comput. Mater. Contin. 2020, 63, 1133–1142. [Google Scholar] [CrossRef]
- Rahman, M.M.; Ghasemi, Y.; Suley, E.; Zhou, Y.; Wang, S.; Rogers, J. Machine learning based computer aided diagnosis of breast cancer utilizing anthropometric and clinical features. IRBM 2020. [Google Scholar] [CrossRef]
- Moon, W.K.; Lee, Y.W.; Ke, H.H.; Lee, S.H.; Huang, C.S.; Chang, R.F. Computer-aided diagnosis of breast ultrasound images using ensemble learning from convolutional neural networks. Comput. Methods Programs Biomed. 2020, 190, 105361. [Google Scholar] [CrossRef]
- Renz, D.M.; Böttcher, J.; Diekmann, F.; Poellinger, A.; Maurer, M.H.; Pfeil, A.; Streitparth, F.; Collettini, F.; Bick, U.; Hamm, B.; et al. Detection and classification of contrast-enhancing masses by a fully automatic computer-assisted diagnosis system for breast MRI. J. Magn. Reson. Imaging 2012, 35, 1077–1088. [Google Scholar] [CrossRef]
- Hospital San Bartolomé. Official Website Consulted on February 4th, 2020. 2020. Available online: https://www.sanbartolome.gob.pe/ (accessed on 5 April 2021).
- World Health Organization. International Classification of Diseases for Mortality and Morbidity Statistics (10th Revision). 1992. Available online: https://icd.who.int/browse10/2016/en (accessed on 5 April 2021).
- Meesad, P.; Hengpraprohm, K. Combination of KNN-Based Feature Selection and KNNBased Missing-Value Imputation of Microarray Data. In Proceedings of the 2008 3rd International Conference on Innovative Computing Information and Control, Dalian, China, 18–20 June 2008; p. 341. [Google Scholar]
- Troyanskaya, O.; Cantor, M.; Sherlock, G.; Brown, P.; Hastie, T.; Tibshirani, R.; Botstein, D.; Altman, R.B. Missing value estimation methods for DNA microarrays. Bioinformatics 2001, 17, 520–525. [Google Scholar] [CrossRef] [Green Version]
- Buuren, S.v.; Groothuis-Oudshoorn, K. MICE: Multivariate Imputation by Chained Equations in R. J. Stat. Softw. 2011, 45, 1–67. [Google Scholar] [CrossRef] [Green Version]
- Torres, R.; Judson-Torres, R.L. Research Techniques Made Simple: Feature Selection for Biomarker Discovery. J. Investig. Dermatol. 2019, 139, 2068–2074. [Google Scholar] [CrossRef] [Green Version]
- Sanchez, N.; Alonso, A.; Calvo, R.M. A Wrapper Method for Feature Selection in Multiple Classes Datasets. In Bio-Inspired Systems: Computational and Ambient Intelligence; Cabestany, J., Sandoval, F., Prieto, A., Corchado, J.M., Eds.; Springer: Berlin/Heidelberg, Germany; Salamanca, Spain, 2009; pp. 456–463. [Google Scholar]
- Tiwari, S.; Singh, B.; Kaur, M. An approach for feature selection using local searching and global optimization techniques. Neural Comput. Appl. 2017, 28, 2915–2930. [Google Scholar] [CrossRef]
- Chen, T.; Guestrin, C. XGBoost: A Scalable Tree Boosting System. In Proceedings of the 22nd ACM SIGKDD International Conference on Knowledge Discovery and Data Mining, San Francisco, CA, USA, 13–17 August 2016; pp. 785–794. [Google Scholar]
- Ponomareva, N.; Colthurst, T.; Hendry, G.; Haykal, S.; Radpour, S. Compact multi-class boosted trees. In Proceedings of the 2017 IEEE International Conference on Big Data (Big Data), Boston, MA, USA, 11–14 December 2017; pp. 47–56. [Google Scholar]
- Braga, I.; do Carmo, L.P.; Benatti, C.C.; Monard, M.C. A Note on Parameter Selection for Support Vector Machines. In Advances in Soft Computing and Its Applications; Castro, F., Gelbukh, A., González, M., Eds.; Springer: Berlin/Heidelberg, Germany, 2013; pp. 233–244. [Google Scholar]
- Feurer, M.; Hutter, F. Hyperparameter Optimization; Springer: Cham, Switzerland, 2019. [Google Scholar]
- Castro, W.; Oblitas, J.; De-La-Torre, M.; Cotrina, C.; Bazan, K.; Avila-George, H. Classification of Cape Gooseberry Fruit According to its Level of Ripeness Using Machine Learning Techniques and Different Color Spaces. IEEE Access 2019, 7, 27389–27400. [Google Scholar] [CrossRef]
- Nguyen, H.; Bui, X.; Bui, H.; Cuong, D. Developing an XGBoost model to predict blast-induced peak particle velocity in an open-pit mine: A case study. Acta Geophys. 2019, 67, 477–490. [Google Scholar] [CrossRef]
- Stoll, C.; Alembik, Y.; Dott, B.; Roth, M.P. Associated malformations in patients with esophageal atresia. Eur. J. Med. Genet. 2009, 52, 287–290. [Google Scholar] [CrossRef] [PubMed]
- German, J.C.; Mahour, G.H.; Woolley, M.M. Esophageal atresia and associated anomalies. J. Pediatr. Surg. 1976, 11, 299–306. [Google Scholar] [CrossRef]
- Xiao, B.; Luo, P.C.; Cheng, Z.J.; Zhang, X.N.; Hu, X.W. Systematic Combat Effectiveness Evaluation Model Based on Xgboost. In Proceedings of the 2018 12th International Conference on Reliability, Maintainability, and Safety (ICRMS), Shanghai, China, 17–19 October 2018; pp. 130–134. [Google Scholar]
- World Health Organization. International Classification of Diseases for Mortality and Morbidity Statistics (11th Revision). 2018. Available online: https://icd.who.int/browse11/l-m/en (accessed on 5 April 2021).


| Problem | Proposal | Technique | Results | Validation | Reference |
|---|---|---|---|---|---|
| Classification of unhealthy and healthy neonates | The authors introduced a system for classifying unhealthy and healthy neonates in neonatal intensive care units using medical thermography processing and artificial neural networks (ANN). | ANN | Accuracy: 98.42% | 10-fold cross validation | Savasci et al. [20] |
| Disease diagnosis (tuberculosis, malaria, and intestinal parasites) | The authors introduced a system based on convolutional neural networks (CNN) for disease diagnosis from microscopic images. | CNN | Accuracy: 96.05%AUC *: 0.99 | Data splitting | Simon et al. [21] |
| Detection of congenital abnormalities of the kidney and urinary tract in children | The authors introduced a computer-aided diagnosis (CAD) system based on ultrasound imaging data, which consists of 3 components, namely: (1) kidney segmentation, (2) feature extraction, and (3) A classification model based on the support vector machines (SVM) technique. | CNN and SVM | AUCs | 10-fold cross-validation | Zheng et al. [22] |
| Mortality prediction | In this study, the authors developed a model based on the naïve Bayes (NB) technique to predict in-hospital mortality in patients undergoing transcatheter mitral valve repair. | NB | AUC: 0.83 | Data splitting | Hernandez-Suarez et al. [23] |
| Detection of hypertension | The authors presented a CAD system to help clinicians in the hypertension prediction. | CNN and bagging | Accuracy: 90.9% AUC: 0.9091 | 10-fold cross-validation | Kandil et al. [24] |
| Arrhythmia classification | A system for monitoring cardiac patients using machine learning techniques like probabilistic neural network (PNN) and multilayer perceptron neural network (MLPNN). | PNN | F-measure: 91.83 | 22-fold cross-validation | Rajagopal [25] |
| Voice pathology detection | The authors presented a method combining density clustering and support vector machines for voice pathology detection. | SVM and DBScan | Accuracy: 98.00% | Cross validation | Amami and Smitib [26] |
| Disease diagnosis (heart disease, Parkinson’s disease, and BUPA liver disorder) | A hybrid system for diseases diagnostic is proposed, which is compounded by a new method entitled k-medoids clustering-based attribute weighting (kmAW) as a data preprocessing method, and an SVM was preferred in the classification phase. | SVM and kmAW | Accuracy: 98.95% | 10-fold cross-validation | Peker [9] |
| Predicting patient revisits | This study focuses on the predictive identification of patients frequently revisiting the University of Virginia Health System Emergency Department. The authors proposed the use of the XGBoost algorithm to predict the risk of revisit. | XGBoost | AUC: 0.754 | Data splitting | Fowler et al. [6] |
| Identification of brain tumors | The detection of tumors is performed with the help of automatic computing technique. | CNN | Accuracy: 99.1% | Data splitting | Samikannu et al. [27] |
| Detection of breast cancer | The proposed model is based on the SVM technique, which uses a radial basis function (RBF) kernel. | SVM | Accuracy: 93.9% | 10-fold cross-validation | Rahman et al. [28] |
| The proposed CAD system uses ensemble learning from CNN. | CNN | Accuracy: 95.77%AUC: 0.9462 | Data splitting | Moon et al. [29] | |
| The CAD system is based on feature selection and ensemble learning. Compared with other methods [30], the proposed method significantly reduces the false-positive classification rate. | AdaBoost | AUC: 0.9617 | 10-fold cross-validation | Lu et al. [19] |
| Features | Description | Ordinal |
|---|---|---|
| Age | Patient’s age | Yes |
| Weight | Patient’s weight | Yes |
| Gender | Patient’s gender | No |
| DI | Demographic information * | No |
| Time_qx | Surgery time | Yes |
| D_Hospital | Days in hospital | Yes |
| ICD10 | Entry diagnosis | No |
| Medicine | Medicine supplied | No |
| TT_Medic | Level of medical treatment | No |
| Found | Treatment findings | No |
| Complications | Treatment complications | No |
| Technique | Hyperparameter | Values |
|---|---|---|
| XGBoost | max_depth | {4,5,6,7} |
| learning_rate | {0.001, 0.01, 0.1, 0.2, 0,3} | |
| subsample | {0.5, 0.6, 0.7, 0.8, 0.9, 1.0} | |
| colsample_bytree | {0.4, 0.5, 0.6, 0.7, 0.8, 0.9, 1.0} | |
| colsample_bylevel | {0.4, 0.5, 0.6, 0.7, 0.8, 0.9, 1.0} | |
| min_child_weight | {0.4, 0.5, 0.6, 0.7, 0.8, 0.9, 1.0} | |
| gamma | {0, 0.25, 0.5, 1.0} | |
| reg_lambda | {0.1, 1.0, 5.0, 10.0, 50.0, 100.0} | |
| AdaBoost | base_estimator_criterion | {gini, entropy} |
| base_estimator_splitter | {best, random} | |
| algorithm | {SAMME.R, SAMME} | |
| n_estimators | {10, 100, 200, 250} | |
| learning_rate | {.05, 0.5, 1.5, 2.5} | |
| Gradient boosting | loss | {deviance} |
| learning_rate | {0.01, 0.025, 0.05, 0.075, 0.1, 0.15, 0.2} | |
| min_samples_split | {0.1,0.5,12} | |
| min_samples_leaf | {0.1,0.5,12} | |
| max_depth | {3,5,8} | |
| max_features | {log2,sqrt} | |
| criterion | {friedman_mse, mae} | |
| subsample | {0.5, 0.618, 0.8, 0.85, 0.9, 0.95, 1.0} | |
| n_estimators | {10} | |
| Random bagging | criterion | {gini, entropy} |
| learning_rate | {0.01, 0.025, 0.05, 0.075, 0.1, 0.15, 0.2} | |
| min_samples_split | {3,4,5,6,7} | |
| min_samples_leaf | {1,2,3} | |
| random_state | {123} | |
| n_jobs | {-1} | |
| n_estimators | {10,15,20,25,30} | |
| CART | max_features | {auto, sqrt, log2} |
| min_samples_split | {2,3,4,5,6,7,8,9,10,11,12,13,14,15} | |
| min_samples_leaf | {1,2,3,4,5,6,7,8,9,10,11} | |
| random_state | {123} | |
| Voting ensemble | lr_C | {1.0, 100.0} |
| svm_C | {2,3,4} |
| Technique | Accuracy | F-Measure |
|---|---|---|
| XGBoost | 84.62% | 73.99 |
| AdaBoost | 82.83% | 46.95 |
| Gradient boosting | 78.44% | 44.96 |
| Random bagging | 84.82% | 49.77 |
| CART | 77.63% | 46.79 |
| Voting ensemble | 74.05% | 46.35 |
Publisher’s Note: MDPI stays neutral with regard to jurisdictional claims in published maps and institutional affiliations. |
© 2021 by the authors. Licensee MDPI, Basel, Switzerland. This article is an open access article distributed under the terms and conditions of the Creative Commons Attribution (CC BY) license (https://creativecommons.org/licenses/by/4.0/).
Share and Cite
Avila-George, H.; De-la-Torre, M.; Castro, W.; Dominguez, D.; Turpo-Chaparro, J.E.; Sánchez-Garcés, J. A Hybrid Intelligent Approach to Predict Discharge Diagnosis in Pediatric Surgical Patients. Appl. Sci. 2021, 11, 3529. https://doi.org/10.3390/app11083529
Avila-George H, De-la-Torre M, Castro W, Dominguez D, Turpo-Chaparro JE, Sánchez-Garcés J. A Hybrid Intelligent Approach to Predict Discharge Diagnosis in Pediatric Surgical Patients. Applied Sciences. 2021; 11(8):3529. https://doi.org/10.3390/app11083529
Chicago/Turabian StyleAvila-George, Himer, Miguel De-la-Torre, Wilson Castro, Danny Dominguez, Josué E. Turpo-Chaparro, and Jorge Sánchez-Garcés. 2021. "A Hybrid Intelligent Approach to Predict Discharge Diagnosis in Pediatric Surgical Patients" Applied Sciences 11, no. 8: 3529. https://doi.org/10.3390/app11083529