1. Introduction
This paper is structured to present a research gap and relevant basics in complexity management in product development with the definition of the related terms. Subsequently, a method for developing an evaluation of specific product complexity is presented and applied using the example of lithium-ion battery electrodes. Finally, the method is critically appraised and an outlook on further research studies and integration into various phases of the product development process (PDP) is provided.
The term “complexity” is used in general language and is defined in the Duden dictionary as “complexity; the interrelation of many characteristics” [
1]. In addition, there are various different denominations of complexity depending on the subject area. However, there is no unambiguous and universally valid definition. The approaches differ depending on the applications. One approach is to denote complexity as the simple opposite of simplicity. In the context of the present study, the definition of product complexity is of particular importance. This is defined as follows: the complexity of a product is defined by the number of elements and their variability, as well as the relations between the elements and their variety [
2,
3,
4].
A complexity index provides information about the potential for complexity reduction and, thus, complexity induced costs. Furthermore, different product variants can be compared simply and objectively with each other on the basis of individual complexity characteristics or the determined complexity index. By using a more objective estimation of the expected product complexity, the variety, the degree of standardisation and product quality can be increased substantially in a targeted manner. This increases the profitability.
In the context of the present study, 15 evaluation methods (for a simplified distinction, the methods are named after the authors:
Austin [
5],
Caesar [
6],
Erixon [
1],
Feldhütter [
7],
Grotkamp [
2],
Hartmann [
8],
Junge [
9],
Kohlhase [
10],
Marti [
11],
Martin [
12],
Nussbaum [
13],
Reinhart [
14],
Rennekamp [
15],
Schuh89 [
16] and
Steinhilper [
17]) for product complexity assessment were analysed. Among them are current and proven research studies of national and international scientists. Six methods comprehensively and explicitly assessed product complexity and two others are in a preliminary stage. While only one method can be used independently of industry and product, ten methods have a specific industry focus, but they can be used independently of the product within the industry (e.g., automotive industry). Six are characterized by a detailed key figure system with a methodical approach and high reproducibility. Overall, it is noticeable that the methods follow different approaches and serve different levels of objectivity from primarily subjective evaluations (e.g.,
Erixon [
1]) to extensive evaluations based on physically measurable variables (e.g.,
Reinhart [
14]) or probability calculations (e.g.,
Grotkamp [
2]). It is noticeable that only a few methods allow general recommendations for action to be derived (e.g.,
Reinhart [
14]),
Nussbaum [
13],
Rennenkamp [
15] and
Marti [
12]) and no method allows the derivation of concrete recommendations for action. The mentioned methods were evaluated with the following criteria (see
Table 1).
In any case, a distinction can be made between explicit assessments of product complexity and comparative assessments. Furthermore, some methods offer the possibility of depicting the complexity of a company. However, this does not provide any decision-making support for different product variants.
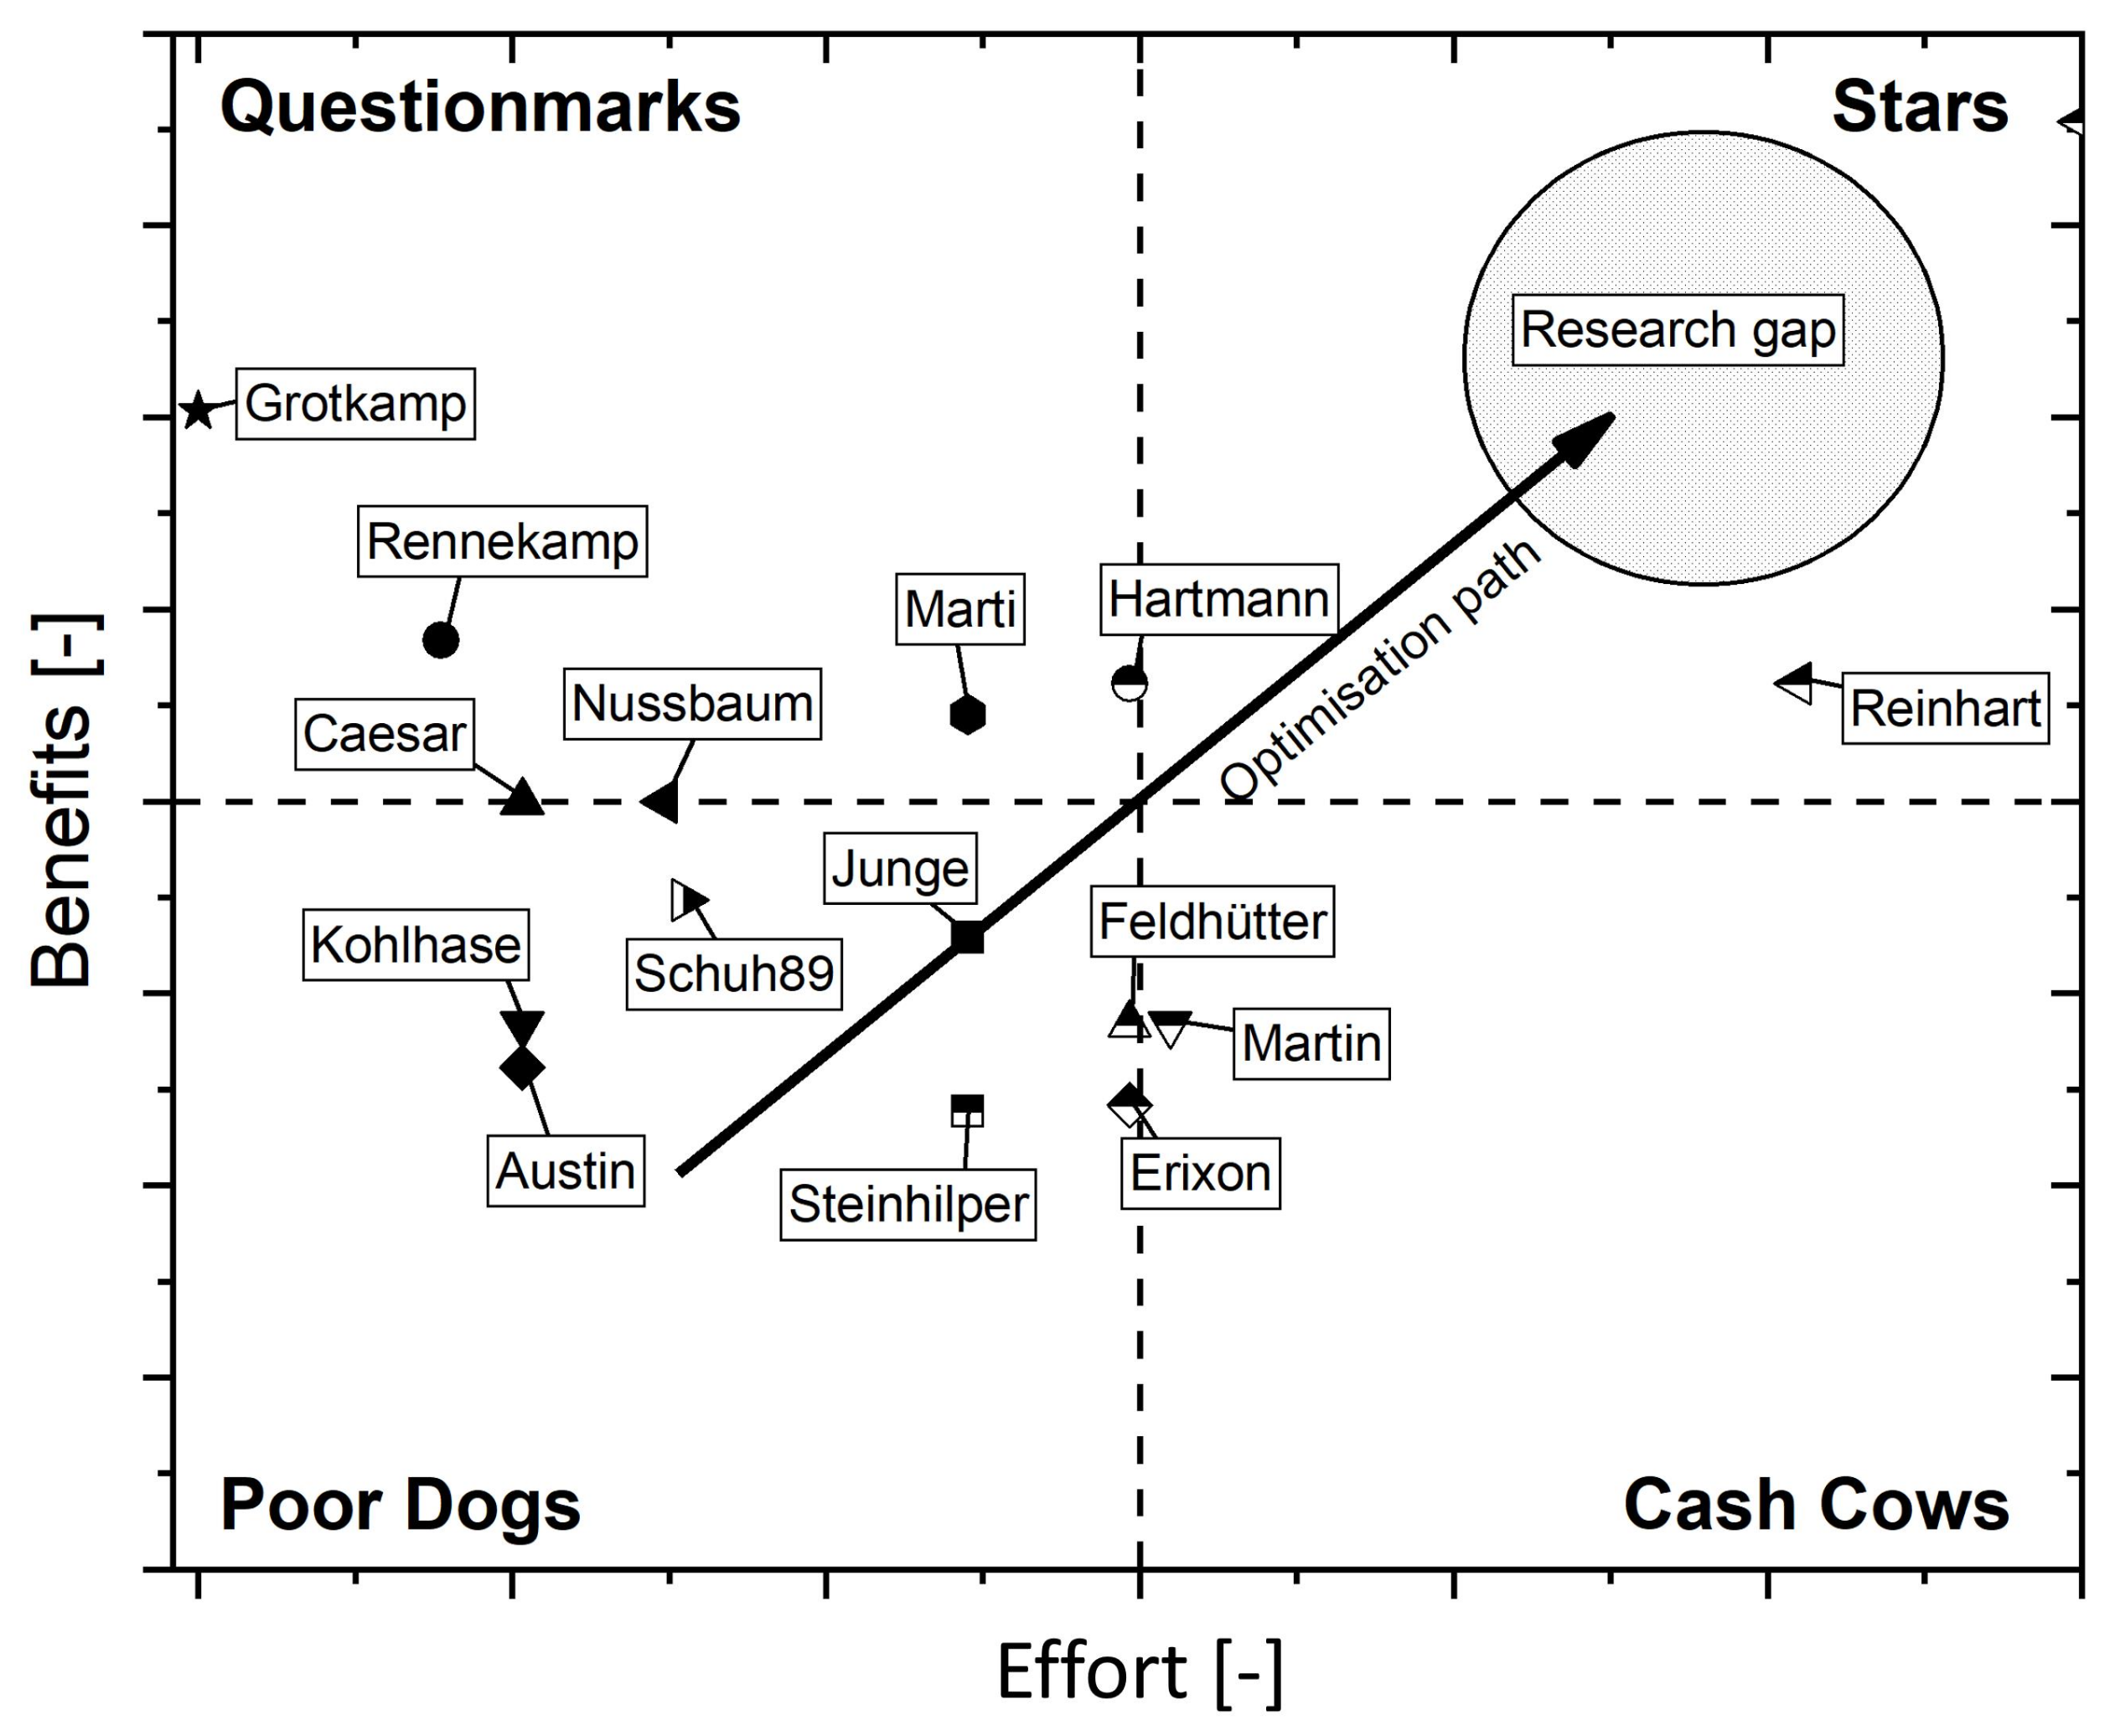
In summary, it should be noted that there are already many different methods in the literature. In the following, the methods will be evaluated in terms of effort and benefit. This evaluation will be assessed in the context of a portfolio analysis and classification into four fields: Questionmarks (a high benefit is offset by a high effort so that in each individual case the usefulness must be examined), Poor Dogs (these methods have a high effort and a low benefit so that they do not appear suitable), Cash Cows (these methods have a low to medium benefit at likewise low to medium effort so that an application is advantageous) and Stars (these methods offer a high benefit at low effort and are, therefore, the best). It is noticeable that none of the methods are currently optimal with regard to their individual implementation effort, adaptation and implementation and their benefit for the company (compare
Figure 1). Accordingly, an optimization can be made towards a lower effort. According to portfolio analysis, these methods can become cash cows. Overall, it is shown that methods that are both low cost and highly useful currently exist only in approaches with the methods according to
Hartmann and
Reinhart.
In this study, above all, a method should be developed that can be used in the early phases of product development. In these early phases, the greatest point of attack for improving the profitability of a company exists. In particular, product complexity can be used as an evaluation and comparison criterion and as an alternative for different product variants; therefore, the method itself must take effect early and allow good estimation with little data. The method must not be too complex. Since the complexity of a method is usually correlated with the accuracy of the results that can be generated, a specific trade off must be made here. As known from requirements management, the data for the method should be as accurate as necessary and as simple as possible.
In summary, the most suitable method is one that can be modified and also allows the implementation of new variants. The method should also be efficient to use and still allow an objective comparison of different variants.
In practice, there is currently no method that allows a sufficiently objective evaluation of the specific product complexity with moderate effort. However, the method according to Reinhart already shows a procedure that can serve as a model for low effort by the direct evaluation of individual complexity characteristics (complexity characteristics are defined in the context of this work as those characteristics that significantly influence the complexity of the product), which are measurable and/or countable, but this method is currently only available for electrical wiring harnesses. The specific benefit of such a method can be significantly increased by adaptability and transferability. By continuously updating the complexity features and their characteristics, the method could also be used to evaluate a wide variety of products within a company in the long term.
Overall, there is currently no documented procedure that describes the development and implementation of such an evaluation method. Furthermore, it must be examined to what extent this method can be applied to any complex products; therefore, the aim is to develop a method that has the same effort as the method according to Reinhart but a higher benefit.
2. Identify Complexity Characteristics
In the following chapter, the relevant definitions of terms are presented first, followed by a procedure model for developing the complexity indicator and finally a mathematical approach for linking complexity with characteristic values.
2.1. Definition of Terms
Properties and characteristics are defined very differently in the literature. Sometimes, the terms are not distinguished from each other but used synonymously.
Ehrenspiel, for example, defines particularly important properties as characteristics [
18]. This definition assumes that precise knowledge of the product is available in order to assess whether and what is particularly important. It is, therefore, a very subjective definition. According to
Grotkamp, however, characteristic values are “properties or values that can be assigned to characteristics in order to distinguish objects” [
2]. A comprehensive discussion of these terms can be found in
Inkermann [
19]. However, these two examples make it very clear that the definitions of the individual terms property, characteristic and characteristic value are interpreted very differently. However, a clear and unambiguous definition of these terms is necessary for the assessment of product complexity. Therefore, the following objective definition should apply:
For illustration, some examples are provided in
Table 2.
Complexity features are defined in the context of this thesis analogously as those features that significantly influence the complexity of the product.
2.2. Methodical Approach
A complexity index provides information about the product and product environment. Various established tools and aids can be used to analyze the product and product environment (e.g., search matrix, Pareto analysis, TCO, functional structures and portfolio analysis). In this first step, it is important to obtain an overview of the external influences that influence a product and the general conditions that exist for the product. For example, is it only used as a component in another product or is it an end product? What contribution does the product as a component of an end product make to the fulfillment of customer requirements? What proportion of costs and added value does the product have? Where do the requirements placed on the product come from? What is the environmental impact of the product? Is the product visible to the customer?
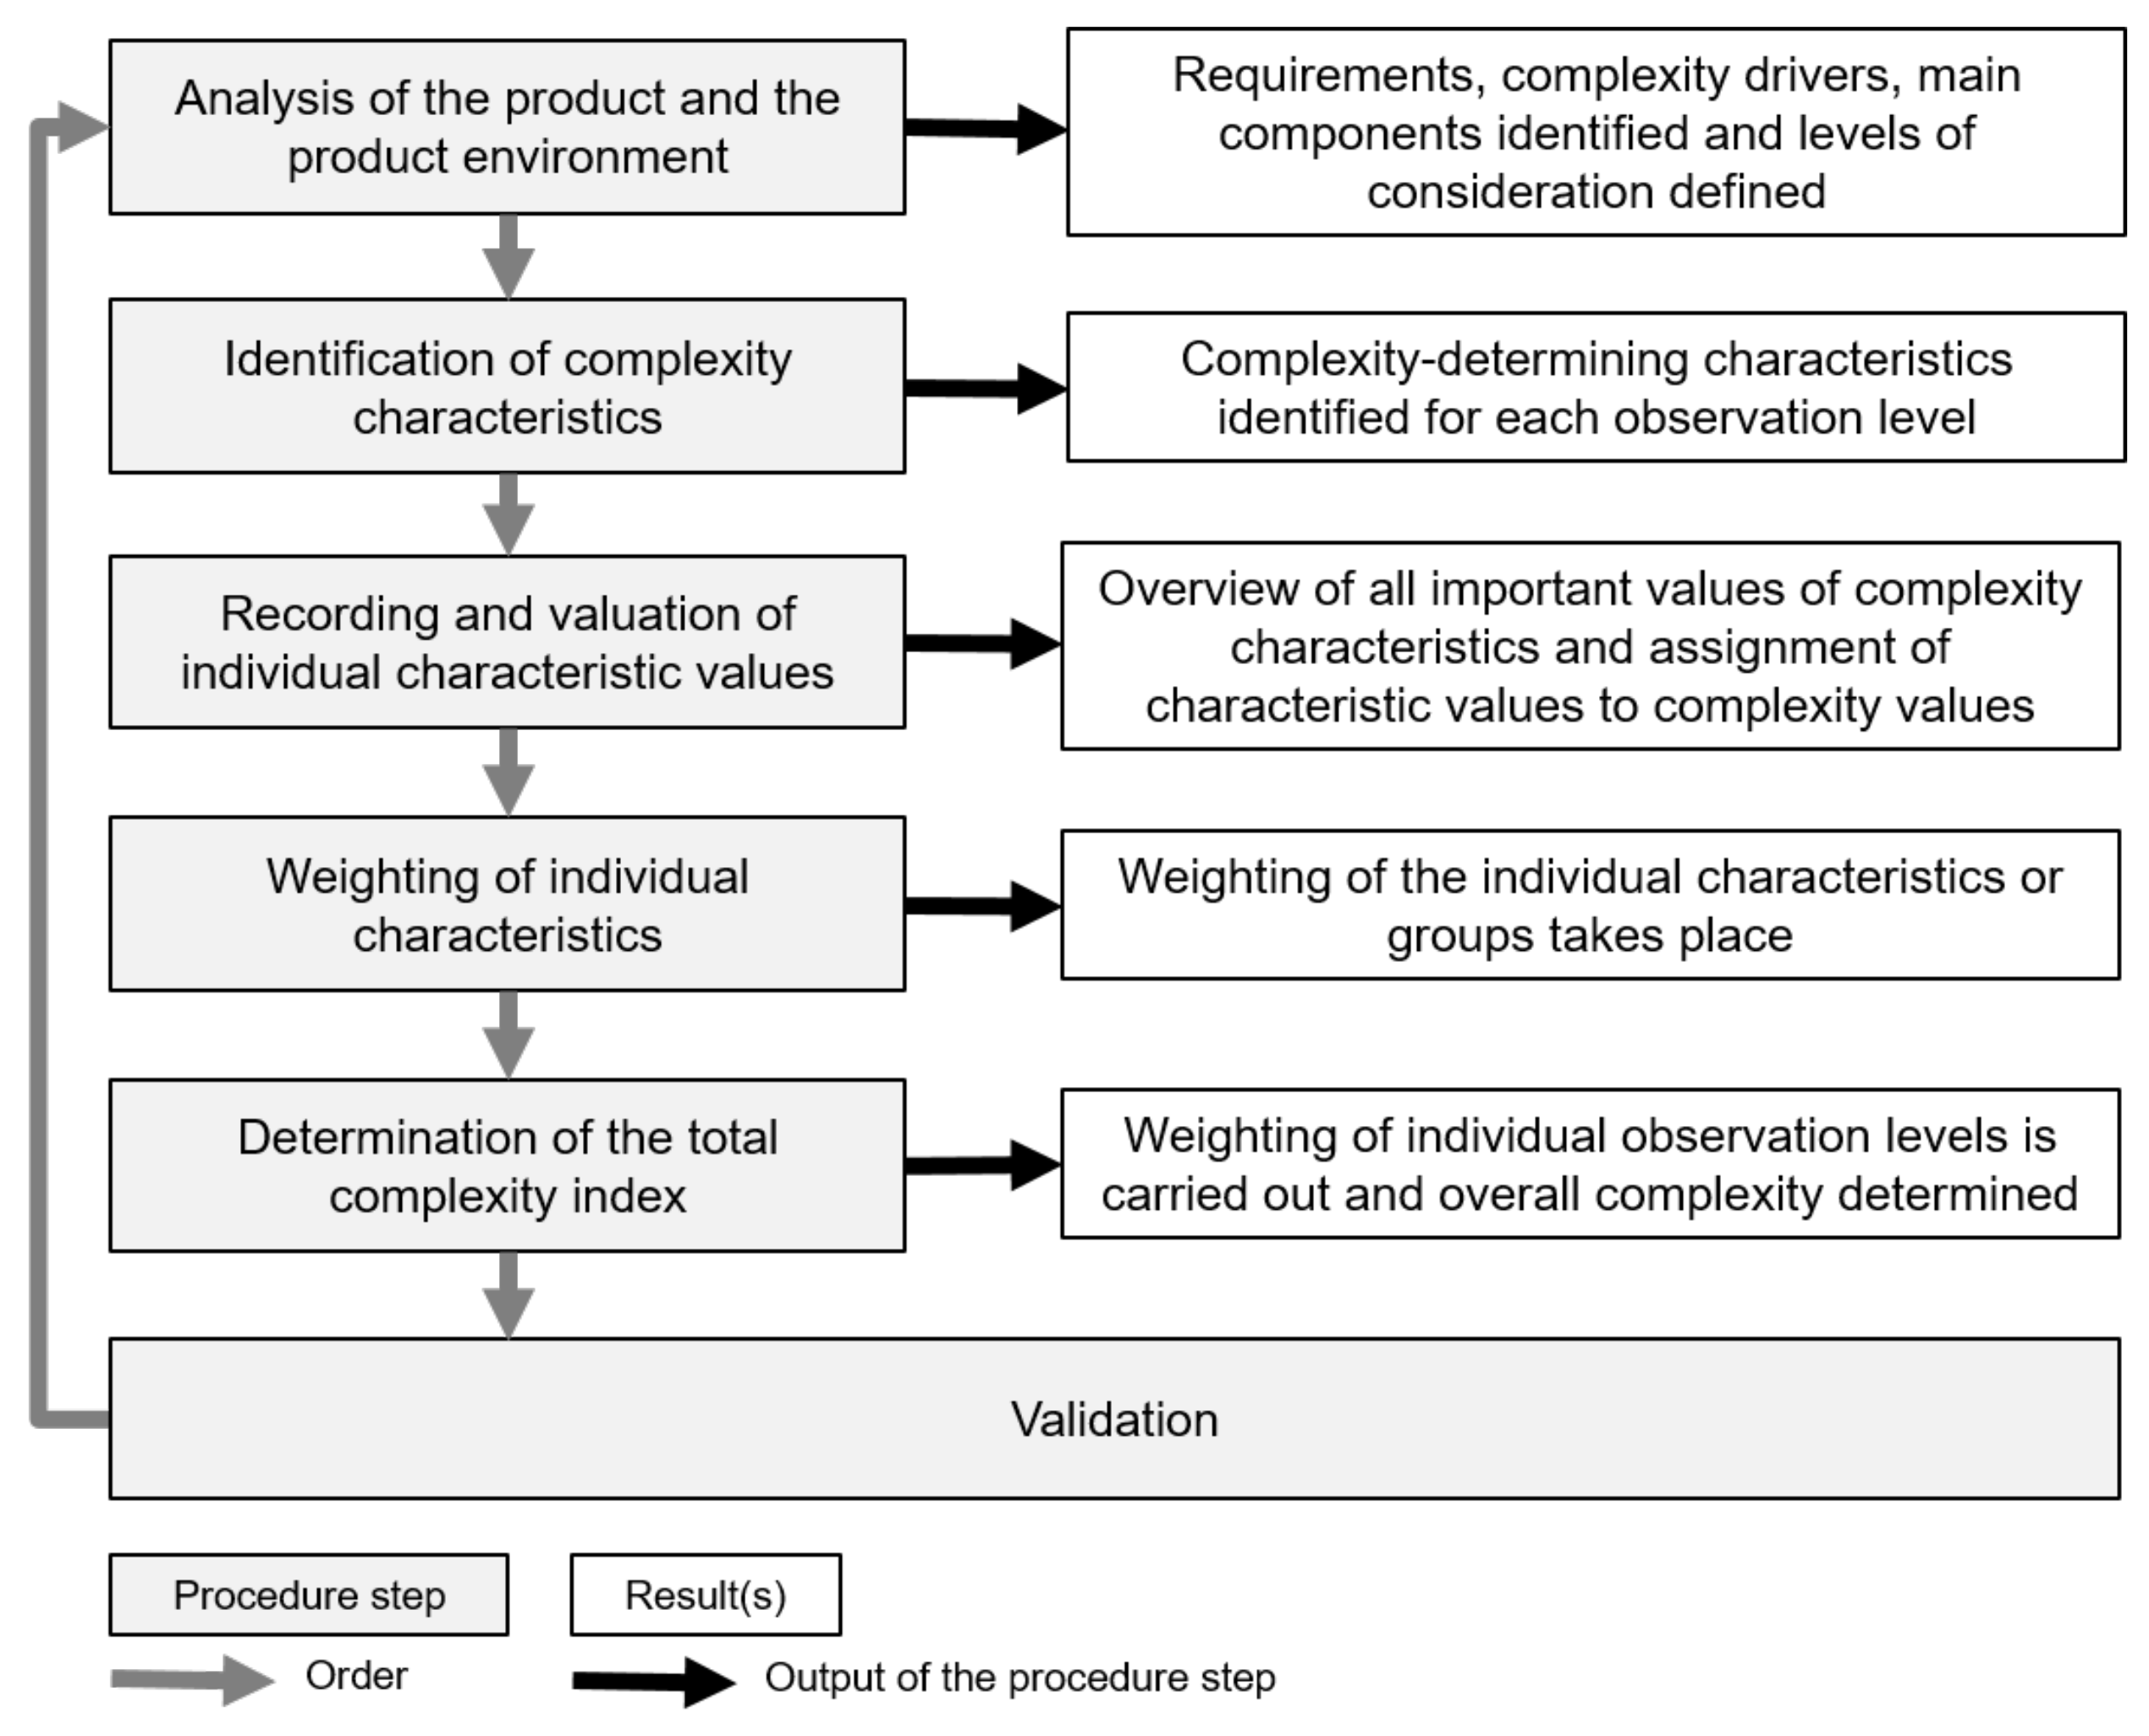
This section serves as a concluding summary of procedure for the development of a specific complexity indicator for the assessment of product complexity. As shown in
Figure 2, the procedure comprises five individual steps:
Analysis of the product and the product environment;
Identification of complexity characteristics;
Recording and evaluation of individual characteristic values;
Weighing characteristics;
Determination of total complexity index.
These five steps should be followed by a validation of the method. For this purpose, the first step can be started again, and the method can be applied to the product. Within the framework of the product and environment analysis, all product requirements, properties and characteristics are conclusively available. These can be collected and documented analogously to the example in
Table 2 in
Section 2.1 or graphically.
From these product characteristics, those that essentially determine complexity must now be identified. The goal of this step is to obtain a comprehensive and as complete as possible list of relevant complexity features. This can be conducted by means of expert interviews, a literature or market research or a use case analysis. A further possibility is the classification of the characteristics into different categories in order to identify the characteristics that form variants (Ref. [
23]). Complexity characteristics can also be identified by the fact that the characteristics contribute particularly to the fulfillment of requirements. Complexity characteristics must always be clearly described and directly recognizable. They must, therefore, be physical or clearly described characteristics. Individual characteristics can also be combined into one complexity characteristic (e.g., if the characteristics always occur in combination or dependent on each other). As a first result, complexity characteristics are identified and can be used to optimize the complexity.
2.3. Mathematical Approach to Describe and Calculate the Complexity
The assignment of the different characteristic values to certain complexities can be conducted in different ways. On the one hand, it is possible to conduct an expert survey on the basis of which the individual characteristic values are assigned to certain complexity evaluations. This is particularly advisable if the individual characteristic values are not well described in the literature or only theoretically, if they are not physically measurable or if the product is so new that they are not physically present. It is also possible to evaluate the characteristic values based on individual criteria. For this purpose, evaluations with a scale of at least 1–5 (based on [
24,
25]) are particularly suitable. These ratings are particularly advantageous when many different criteria describe a characteristic or variant. If explicit physically measurable or quantifiable values are available for a characteristic value, it makes sense to relate these directly to complexity.
Further possibilities for evaluating different characteristic values with regard to the complexity they induce are as follows: performance of a utility value analysis, purely subjective assessment and sensitivity analyses.
Mathematical models serve as a basis for identifying and defining the individual categories of complexity features and the associated complexity. For this purpose, the minimum and maximum value of the characteristic must be determined and the relationship between complexity and characteristic must be chosen.
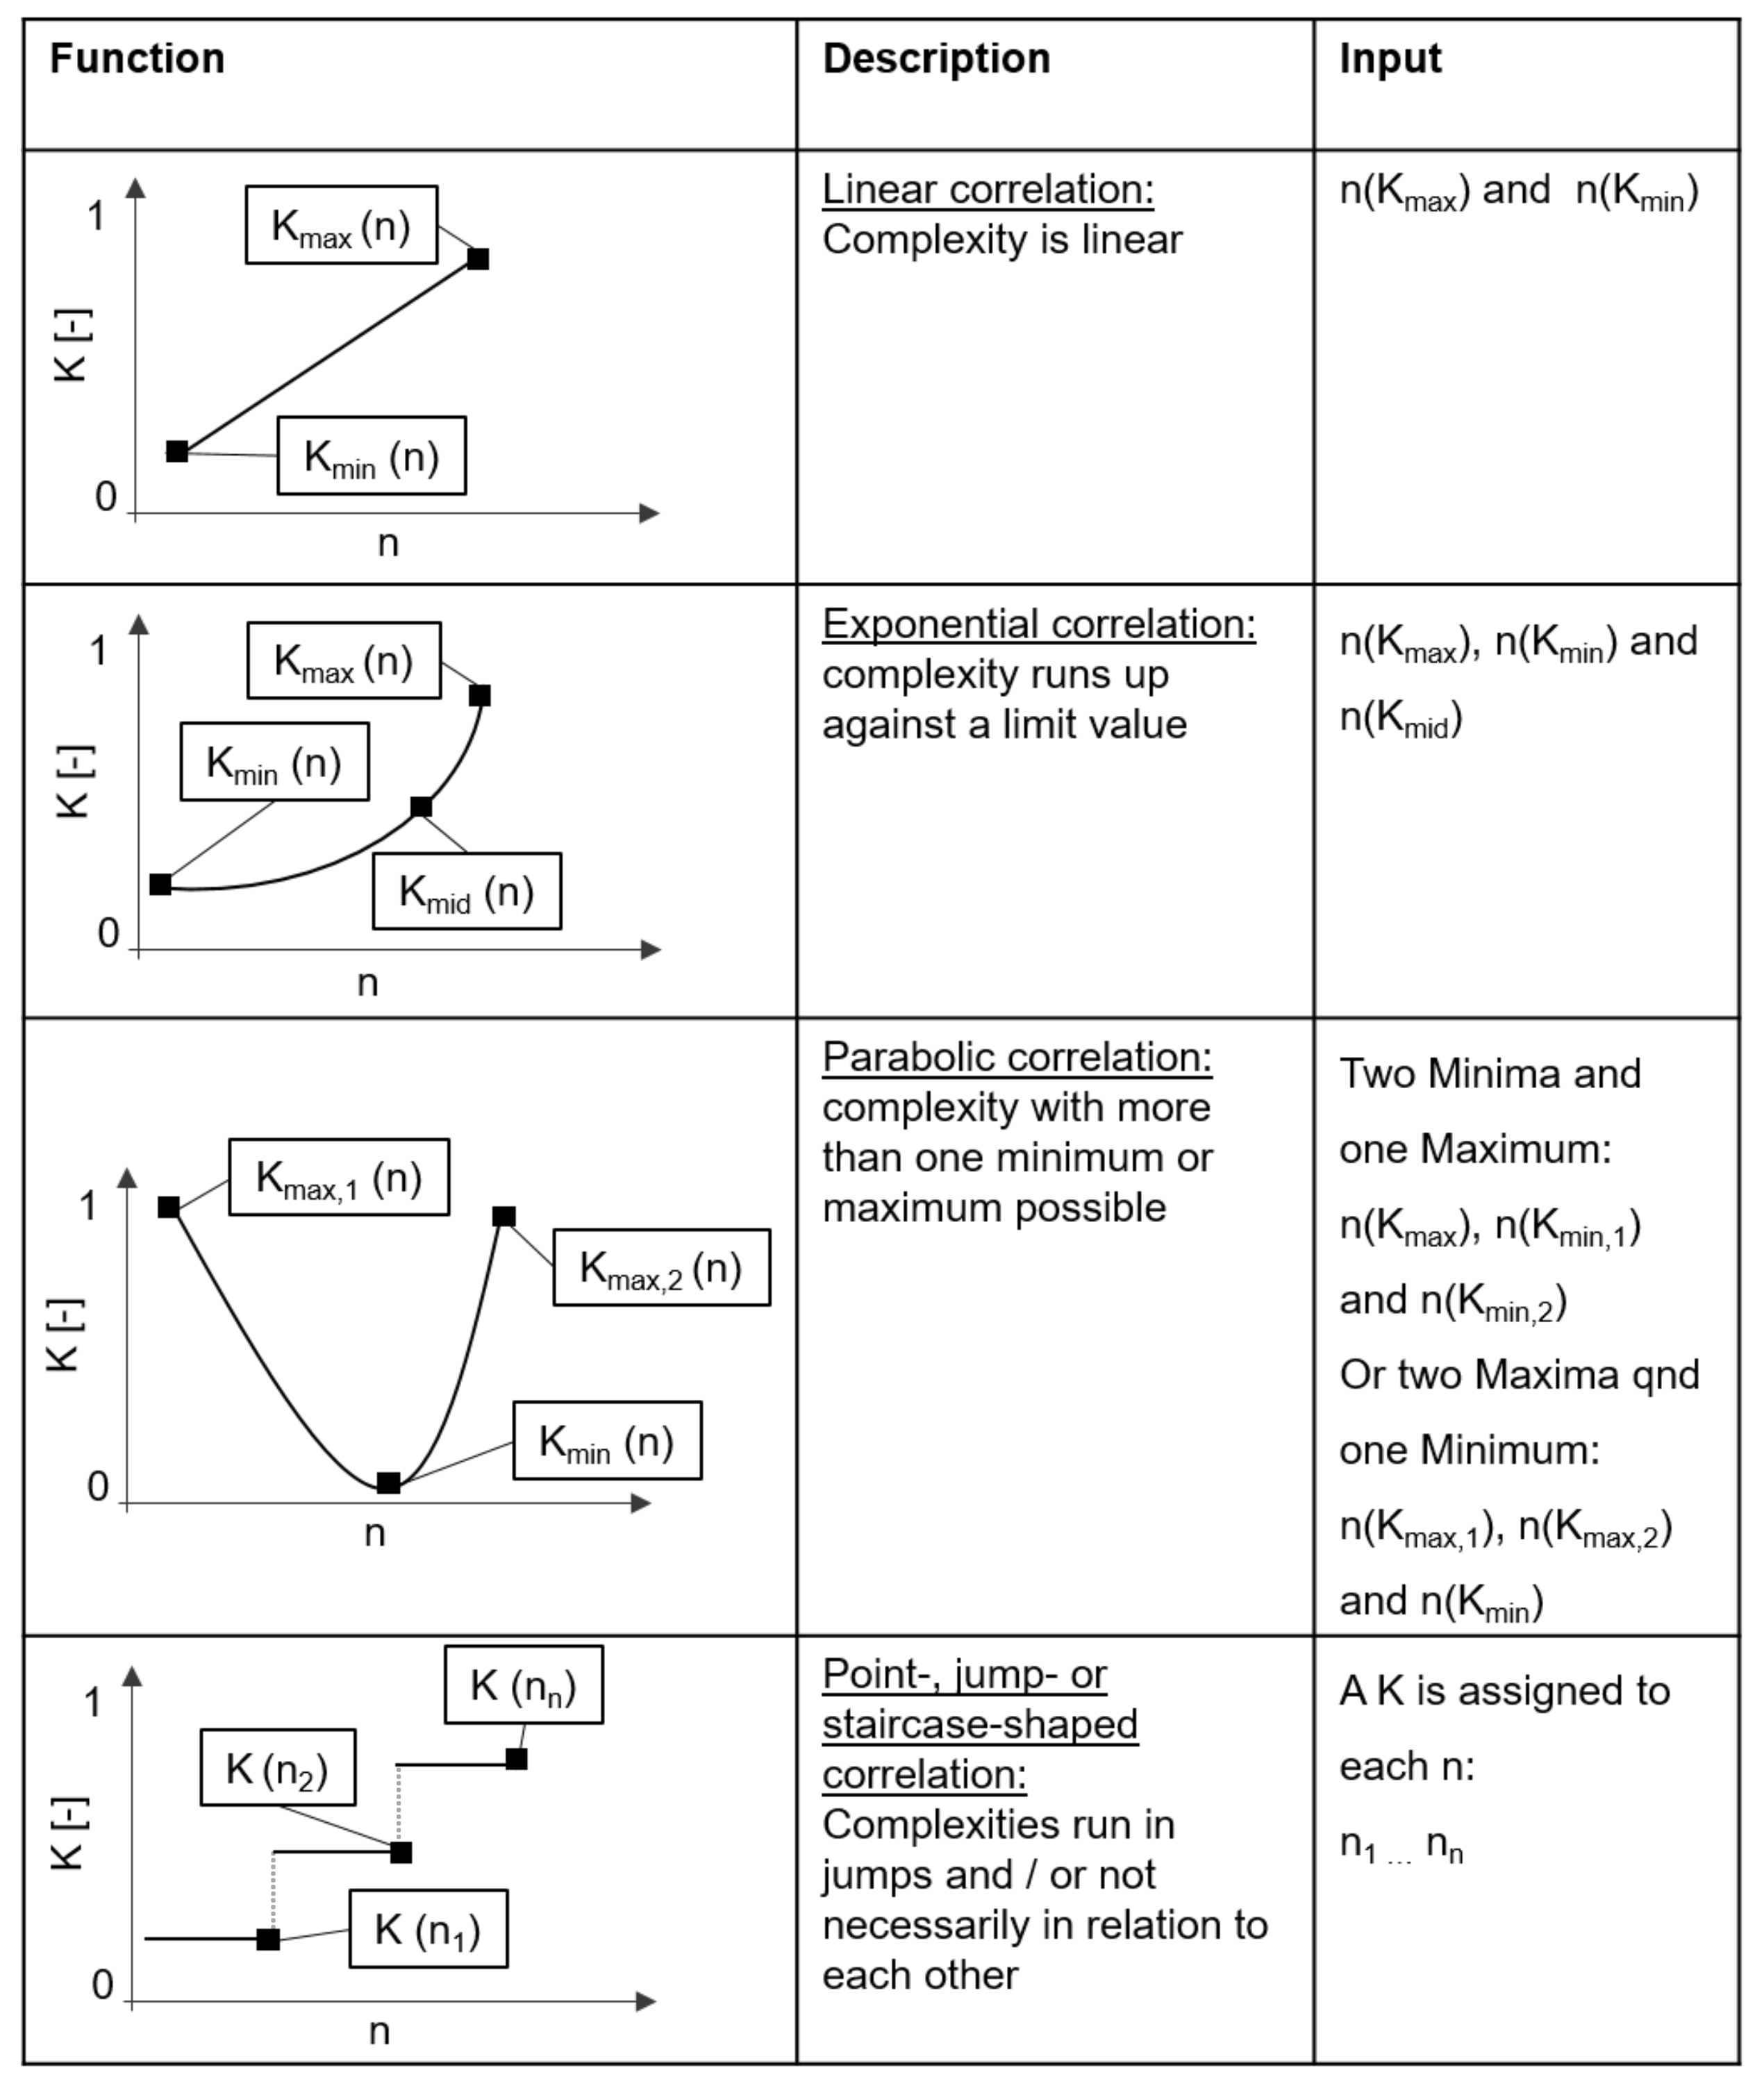
Figure 3 details the possible correlations between characteristic value and complexity and how such a relationship can be described mathematically.
The first step is to identify the limits of the characteristic value and, thus, the maximum and minimum possible value the characteristic can take. Then, the correlation between complexity and characteristic can be described as a mathematical function.
For linear relationships, only the minimum and maximum values with associated complexity values are required. In the case of exponential progressions, an average complexity must be specified in addition to these values, i.e., the value of the characteristic value at which the complexity is 0.5. For parabolic relations, values for the minima and maxima of the characteristic value have to be specified. In the case of staircase or jump functions, an explicit complexity value must be assigned to each characteristic value. After this step, all complexity characteristics are available with their values (in groups, if necessary) and the corresponding complexity values.
Not every complexity characteristic has the same influence on product complexity. In order to determine this influence, a simple pairwise comparison of the characteristics can be used. Using this comparison, individual characteristics can be weighed against each other and, thus, be included in the overall calculation of the product complexity. This allows a more precise result and a more detailed consideration of the individual complexity characteristics in terms of their influence on overall product complexity. As a final step in the procedure, the individual complexity indicators (the individual complexity describes the specific partial complexity of the part of the product or system or the element under consideration) of the different levels of observation (describes the part of the product or system or the element under consideration, e.g., use case battery system: electrode, cell, module or pack level) are combined. Thus, the total complexity (
KG) can be calculated on the basis of partial complexities (
Ki) and the individual weightings (
yi) and can be determined by using the following formula.
3. Evaluation on LiB Electrodes
A typical LIB cell is made up of several thin layers of positive and negative electrodes, current collectors, separators and electrolytes. Typically, the positive electrode or active cathode material includes lithium metal oxides coated on both sides of aluminium current collectors. Similarly, the negative electrode or active material of anode is graphite, which is coated on both sides of the copper current collectors. The layer of separation between electrodes serves the purpose of isolation and allows the transfer of lithium ions during charging and discharging. This set of components known as a compartment repeats multiple times in the battery cell. All these component layers taken together are called a jellyroll or stack of electrodes. The jellyroll or stack is then covered with metal or a plastic casing depending on the type of cell and the casing is then filled with electrolyte fluid. The following application refers to a part of the LIB: the electrode. For this purpose, the main complexity-influencing characteristics, active material of the cathode, active material of the anode, structure of the electrode, current collector material and thickness are considered.
3.1. Active Material of the Cathode and Anode
The choice of active material is very relevant to the complexity that arises, as it affects factors far beyond that of the electrode level to cell, module and system levels (battery cells are assembled into modules and these modules are assembled into the battery system). Since it is not possible to consider all the properties (the effects of the properties) of the anode active materials within the scope of the present study, in order to ensure comparability, the properties most relevant to the complexity are used as evaluation criteria in the following:
Production complexity: This refers to producibility. How easy is a material to handle and process? Do special protective measures/preparations/devices have to be taken? Is the material stable? Are there strong restrictions/limitations in processing;
Safety: Is the material safe both in production and in operation? What are the effects at module and system level? Is the material toxic? Both in processing and in subsequent recycling? In what form is the material present (powder and bonded coating);
Energy: In general, the product of capacity (Ah) and voltage (V). In battery context: the resulting absolute capacity (Ah) on electrode, cell, module and system level;
Power: specific electrical conductivity of the material.
The presented common anode active materials have different characteristic values (compare
Table 3).
The individual properties of the anode active materials are summarised again in the following and evaluated on the basis of the presented evaluation criteria (compare
Table 3). These results have a very good rating for the graphite, as it is easy to process without additional safety measures. Compared to the other active materials, however, the specific capacity is lower. The specific conductivity is good and can, thus, be rated similar to that of lithium metal. Silicon composites mainly show weaknesses in terms of processing ability and safety. LTO shows good processability and safety but has very poor specific capacity and also only mediocre specific conductivity.
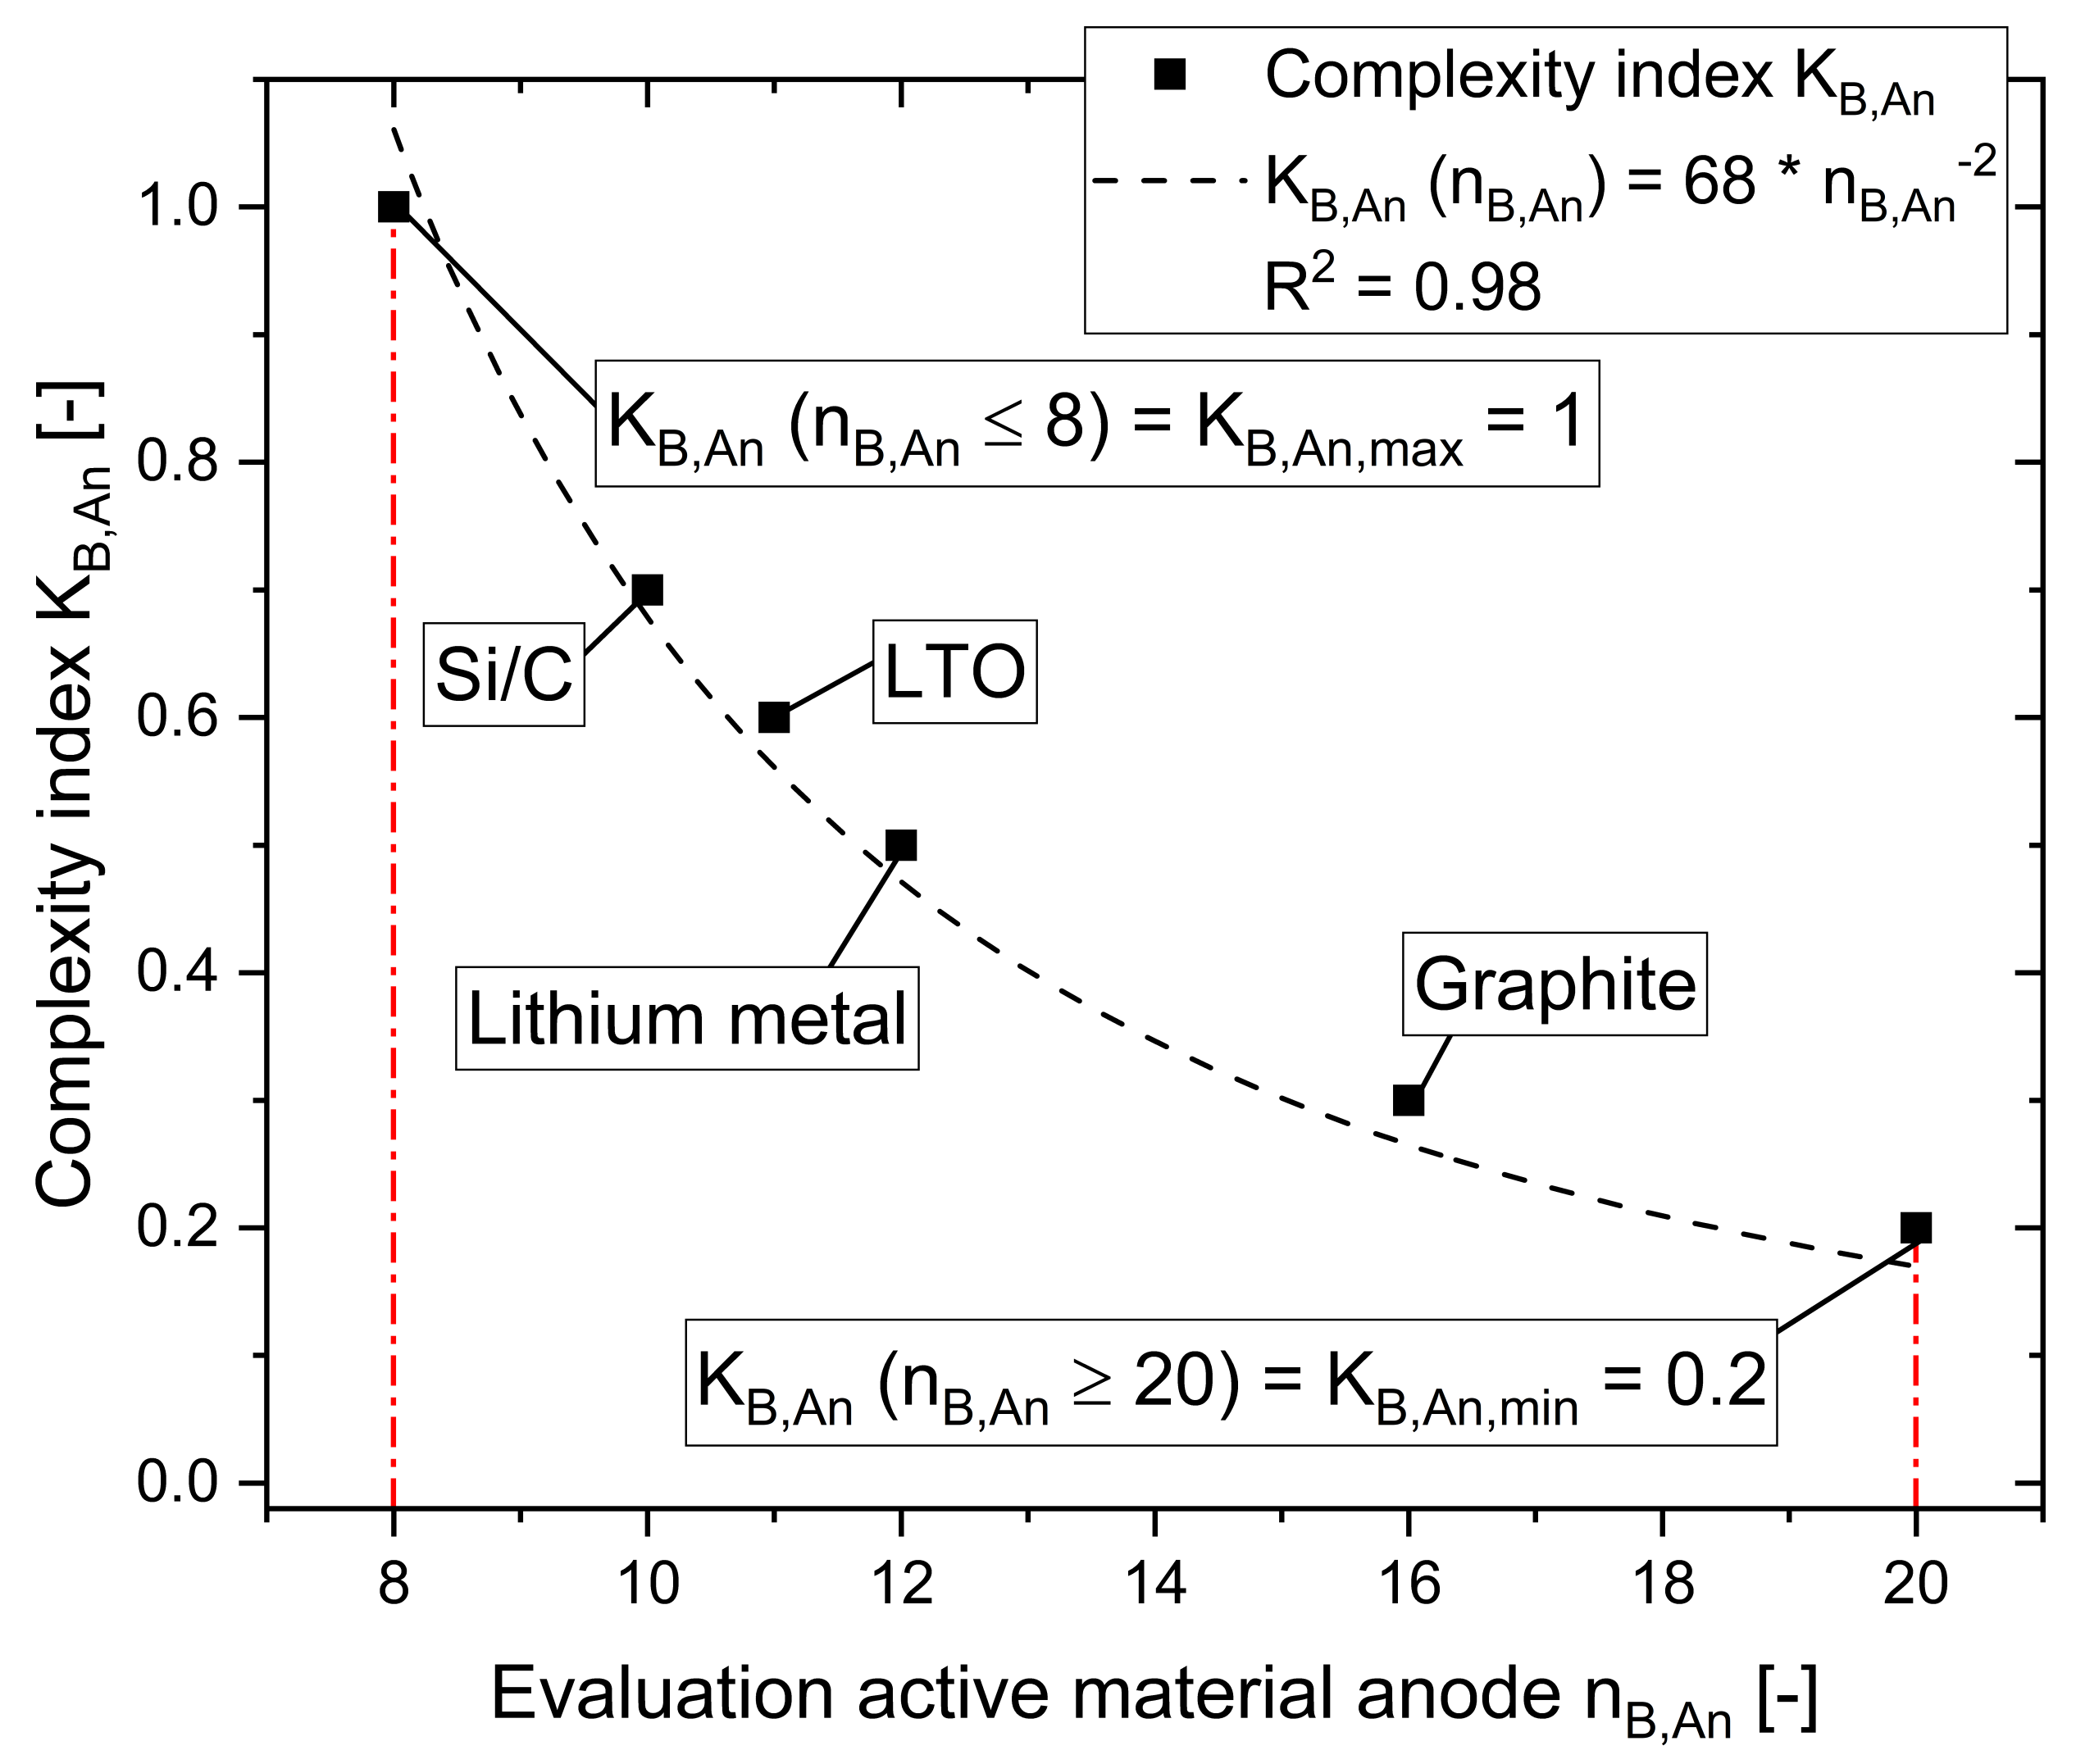
This evaluation was converted into a point evaluation in order to present it as a correlation between complexity and feature expression (compare
Figure 3). According to this, a score of 20 at minimum complexity and a score of 4 at maximum complexity of 1 is obtained. Since the complexity of active materials always remains given, a minimum complexity of 0.2 is set.
In
Figure 4 the individual ratings of the anode active materials are plotted with the associated complexity score. The following relationship is, thus, obtained.
With the help of this description, it is possible to determine the complexity values K on the basis of the evaluation score n of any other new materials. For the materials considered, the specific complexity values of approximately 0.7 for silicon, approximately 0.6 for LTO, approximately 0.5 for lithium metal and approximately 0.3 for graphite result. Furthermore, if the evaluation of the considered materials is updated, a simple adjustment of the specific complexity index is possible.
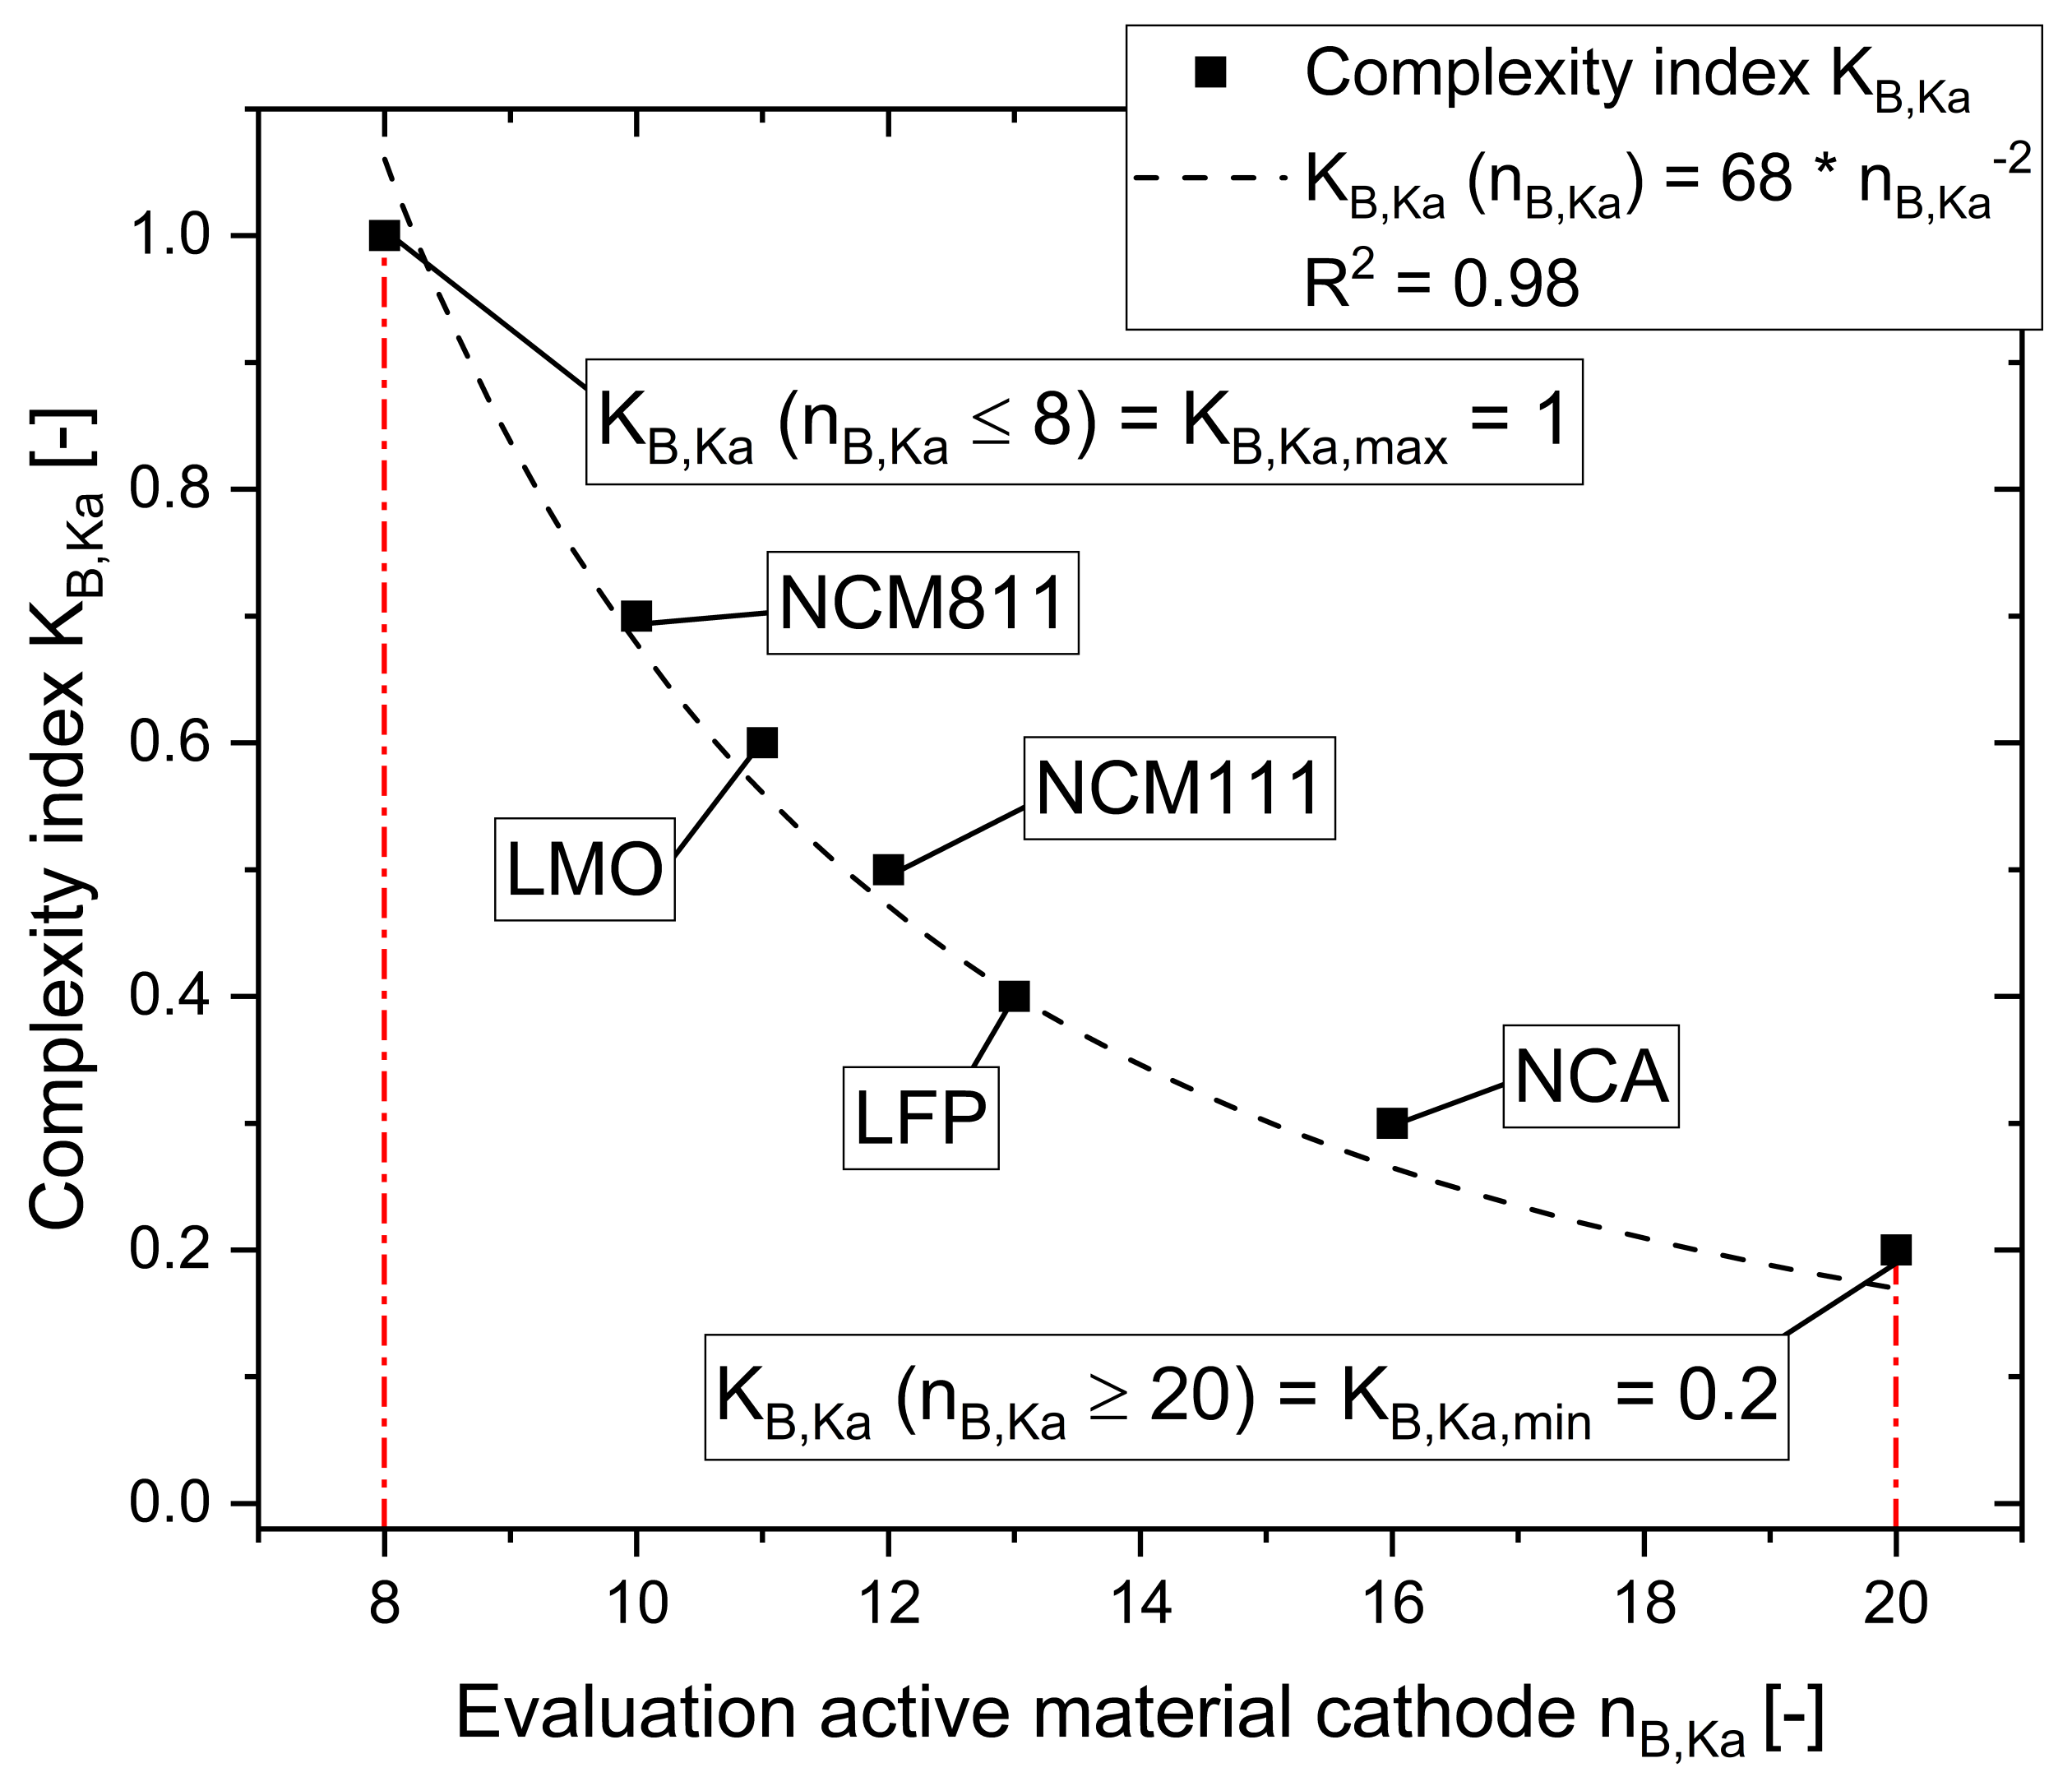
In summary, the same challenge in assessing complexity arises for the cathode active materials as for the anode active materials. Therefore, the four properties (production complexity, safety, energy and performance) are also used as a basis for evaluation in the following.
Accordingly, the following ratings (see
Table 4) result for the five cathode active materials presented.
LFP is advantageous in terms of processing and safety, but it shows clear weaknesses in terms of performance, as in specific capacitance, NCM811 and NCA show the highest values. However, it is noticeable that no material fulfills the requirements for specific conductivity wells. This results in the same minimum and maximum number of points as for anode evaluation in the complexity values shown in
Figure 5 for the individual cathode active materials considered.
The relationship between complexity and evaluation is as follows.
As with the specific complexity of the anode active materials, this equation can also be used to determine complexity values K based on the evaluation score n of any additional or new materials. Thus, the specific complexity values of about 0.7 for NCM811, about 0.6 for LMO, about 0.5 for NCM111, about 0.4 for LFP and about 0.3 for graphite are obtained. Furthermore, when updating the evaluation of the considered materials, a simple adjustment of the specific complexity index is possible.
3.2. Structure of the Electrode
The properties of the electrode structure have a significant influence on the degree of requirement fulfilment and are, therefore, considered separately in the following. The structural parameters on the anode and cathode side show similarities and are, therefore, considered together. Essentially, the following properties are detailed:
The capacity and voltage determine the energy of the cell. Capacity is essentially dependent on the active material and its mass. This mass results from the material used, the formulation and the adjusted structure as well as the surface loading of the coating. Electrode coatings of LIB are applied as a porous layer on the current collectors to allow infiltration with electrolyte and, thus, ion transport. Porosity can be determined as the ratio of the void volume to the total volume.Taking into account coating thickness and area, the coating volume VBe can then be calculated.
By adding the porosity
, the material volume
VMa is determined (compare Formula (
4)), which corresponds approximately to the active material volume
VAM.
By increasing the volume of active material, it is, therefore, possible to increase the capacity of the cell. The active material volume and porosity are adjusted by production parameters during coating and drying in addition to the recipe. Coating thickness, in particular, has a wide range of effects on production steps (especially handling before and after coating and calendering, packaging, assembly and electrolyte filling) and the performance of the cell.
With increasing coating thickness, higher specific energy densities can be achieved, but the maximum specific power also decreases as a function (this is more noticeable with thicker layers).
The densification of the electrode in the calendaring process particularly increases the adhesive strength of the porous structure on the current collector and energy density. At the same time, however, the adjusted structures remain in place during calendering. Even more detailed than the porosity, tortuosity can explain energy and power properties. By setting a porosity gradient from low porosity at the current collector to high porosity to the separator, an optimisation of lithium ion transport properties can be achieved. Higher tortuosity results in less power density and less energy density specifically at high discharge rates [
26].
In terms of high power density, a thinner coating is advantageous because power is mainly achieved by a fast transport of ions and electrons, which is most easily realised by short paths [
26].
The porosity of the electrode is a significant factor. However,
Meyer et al. have demonstrated that even with very different initial electrode coating porosities, an almost identical minimum final porosity of all electrode coatings regardless of used active materials (both anode and cathode) can be achieved by targeted calendering (due to process parameters) [
27].
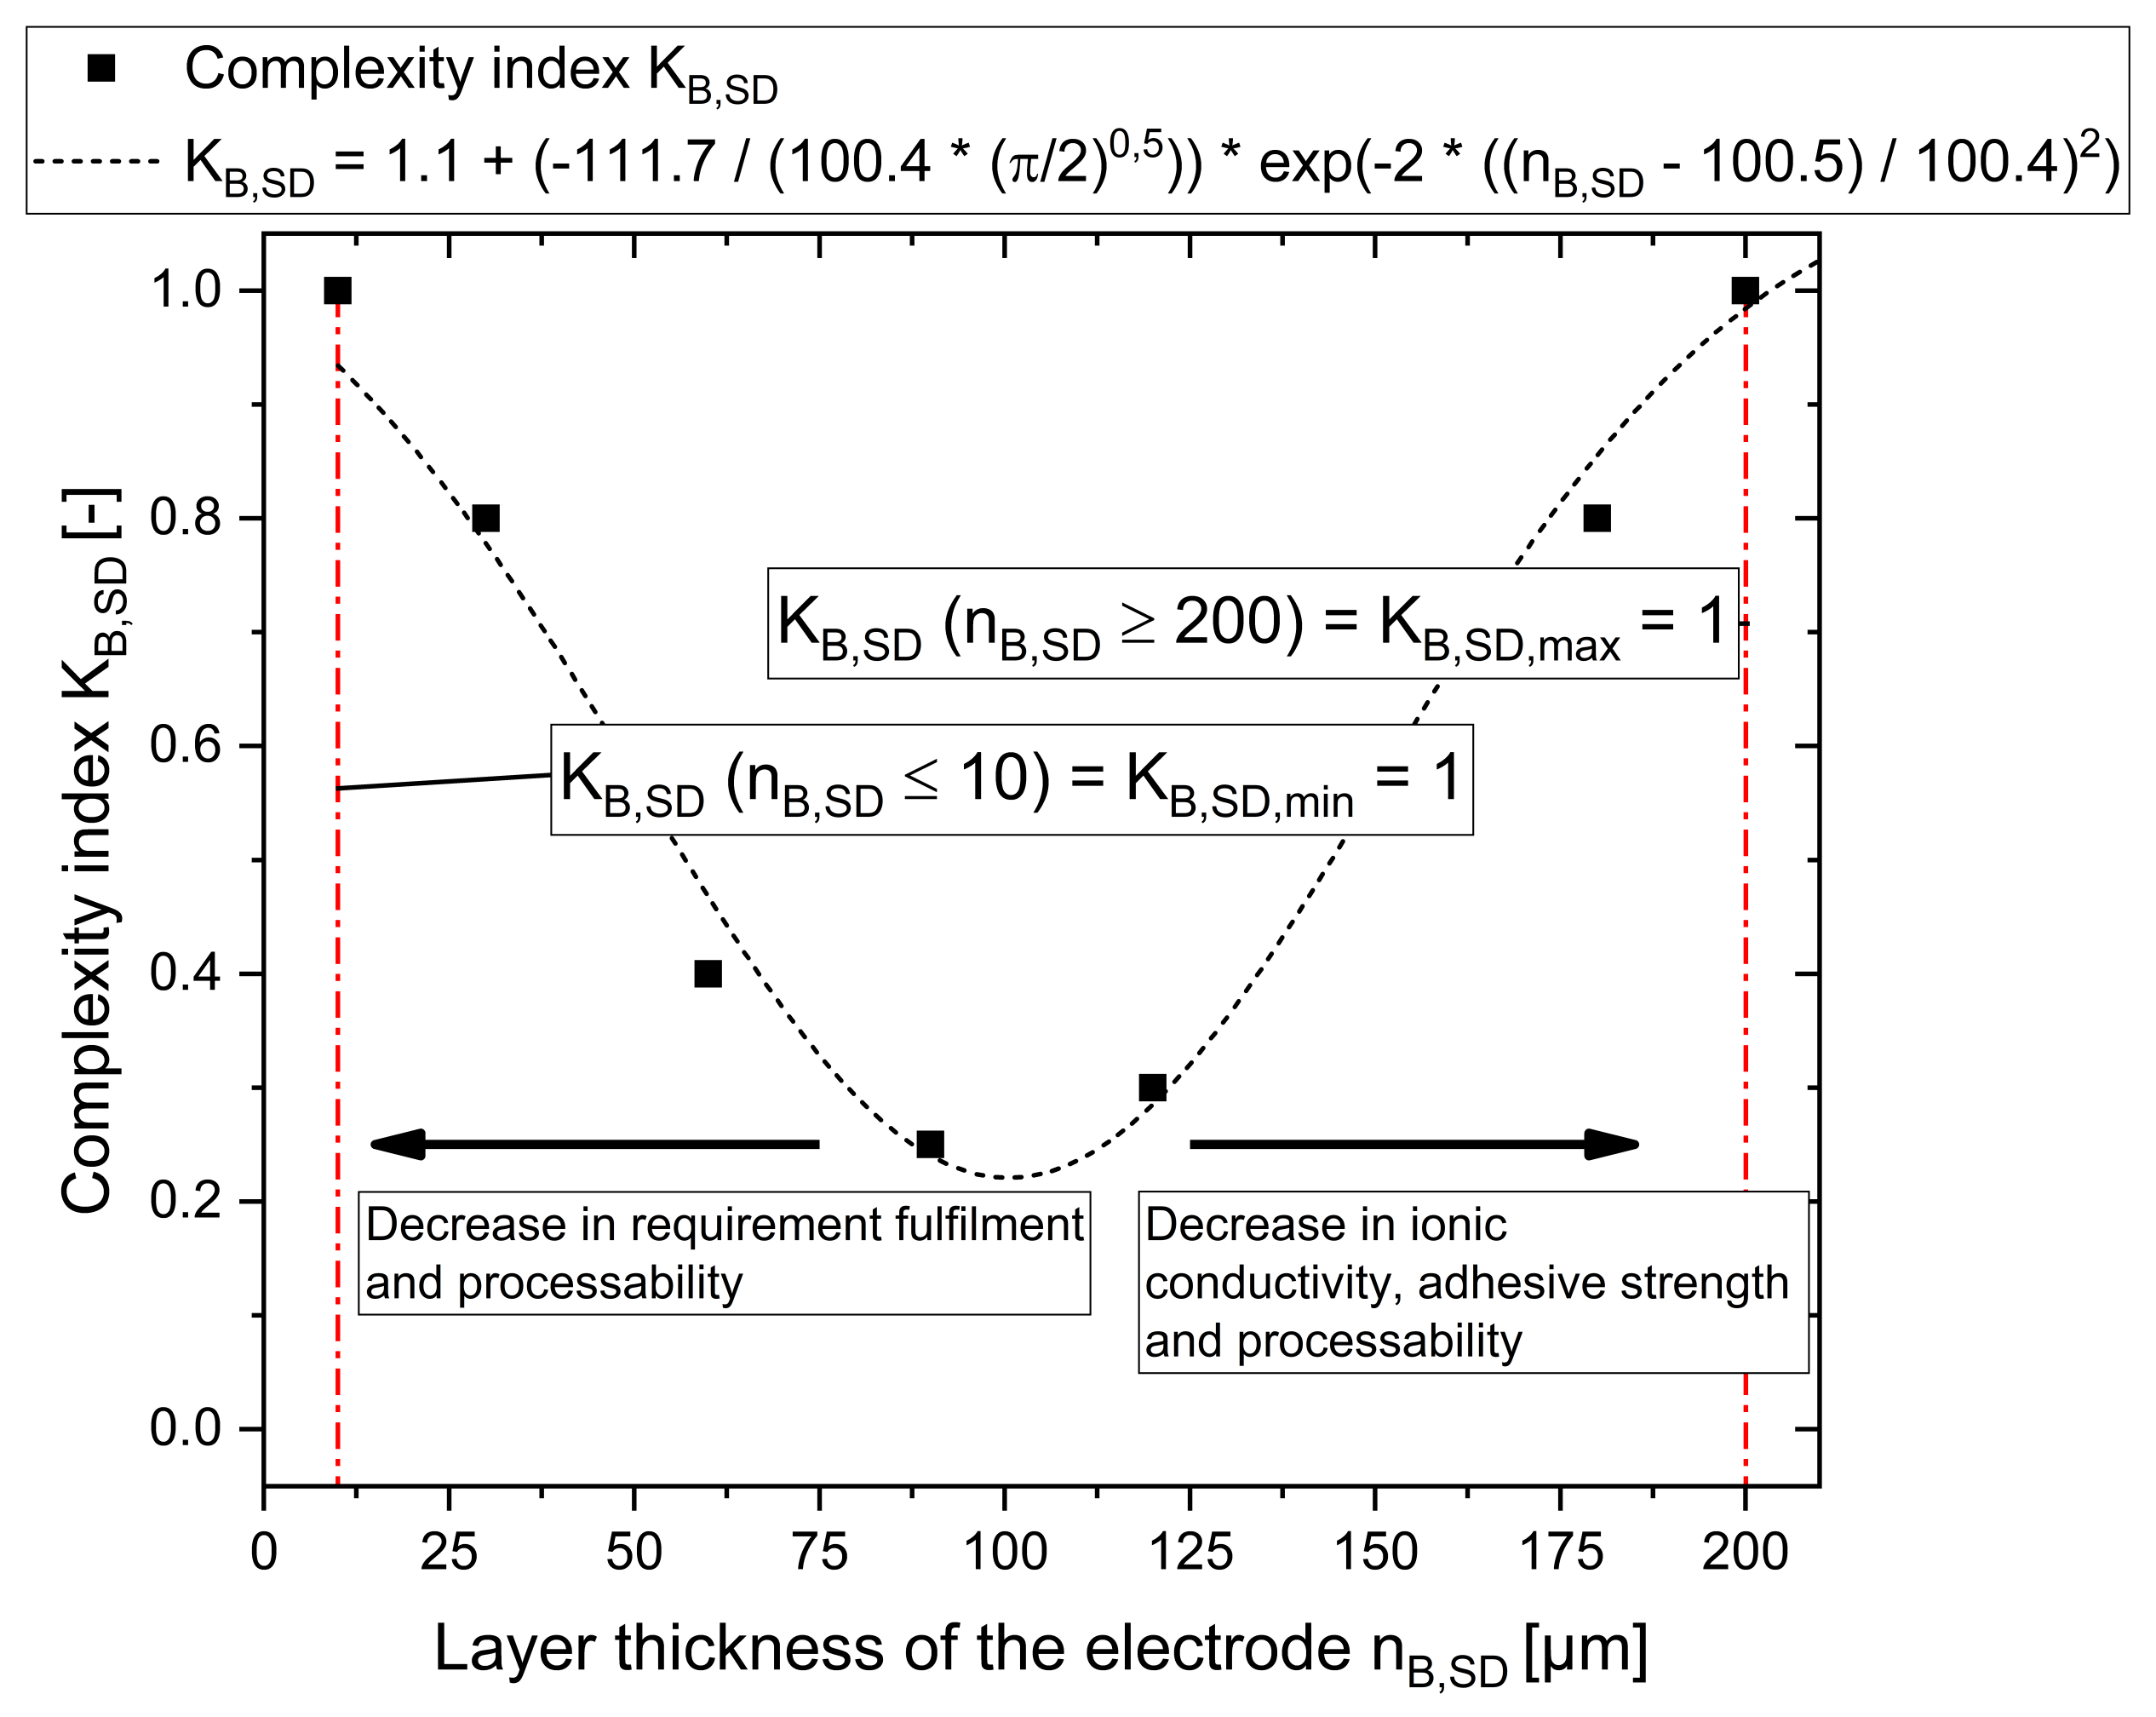
For the sake of simplicity, porosity is, therefore, summarised in the following with the parameter layer thickness as a complexity characteristic, e.g., the layer thickness of the electrode determines the energy density and, thus, the degree of requirement fulfillment at electrode, cell, module and system levels. In particular, layer thickness is an essential parameter for the complexity of production and handling of the coated film at the electrode level. Monolayers, which consist of one to two times the particle size diameter (x
50), are particularly complex in this respect. Since agglomeration must be strictly avoided to produce monolayers, the slurry production process (mixing and dispersing) and coating process are more complex. Very thick layers, in turn, have various disadvantages that result in increased complexity. These include a reduction in adhesive strength, inhomogeneous material distribution, increased production effort and longer production times as well as limitations in effective ionic conductivity (from a layer thickness of approximately 154 µm [
28]). (Refs. [
27,
29,
30,
31]) Thus, the specific complexities shown in
Figure 6 result for the different layer thicknesses.
This results in two maxima for very thin (≤10 µm) and very thick (≥200 µm) layers. Between the maxima, there is a parabolic progression towards the minimum at approximately 100 µm.
3.3. Current Collector Material and Thickness
The characteristics that determine the properties are derived from the requirements and properties for the current collector. The material is an essential feature of the current collector and can be functionalised, in particular, to optimise properties. However, the mentioned properties are also dependent on the geometry of the current collector and the arrester position. Thus, the characteristics of current collector cross section, current collector width, thickness and length are defined.
There are also various dependencies between individual characteristics. The dependencies sometimes exist beyond the limits of the individual component. For example, the length and width of the current collector affect the coating surfaces of the electrodes. Due to the specifications for cell geometry, geometric variables of length and width of the current collector are already taken into account and are not included as a separate complexity feature. However, the thickness, the material and the position of the tab have a significant influence on the complexity and are, therefore, defined as complexity features of the current collector.
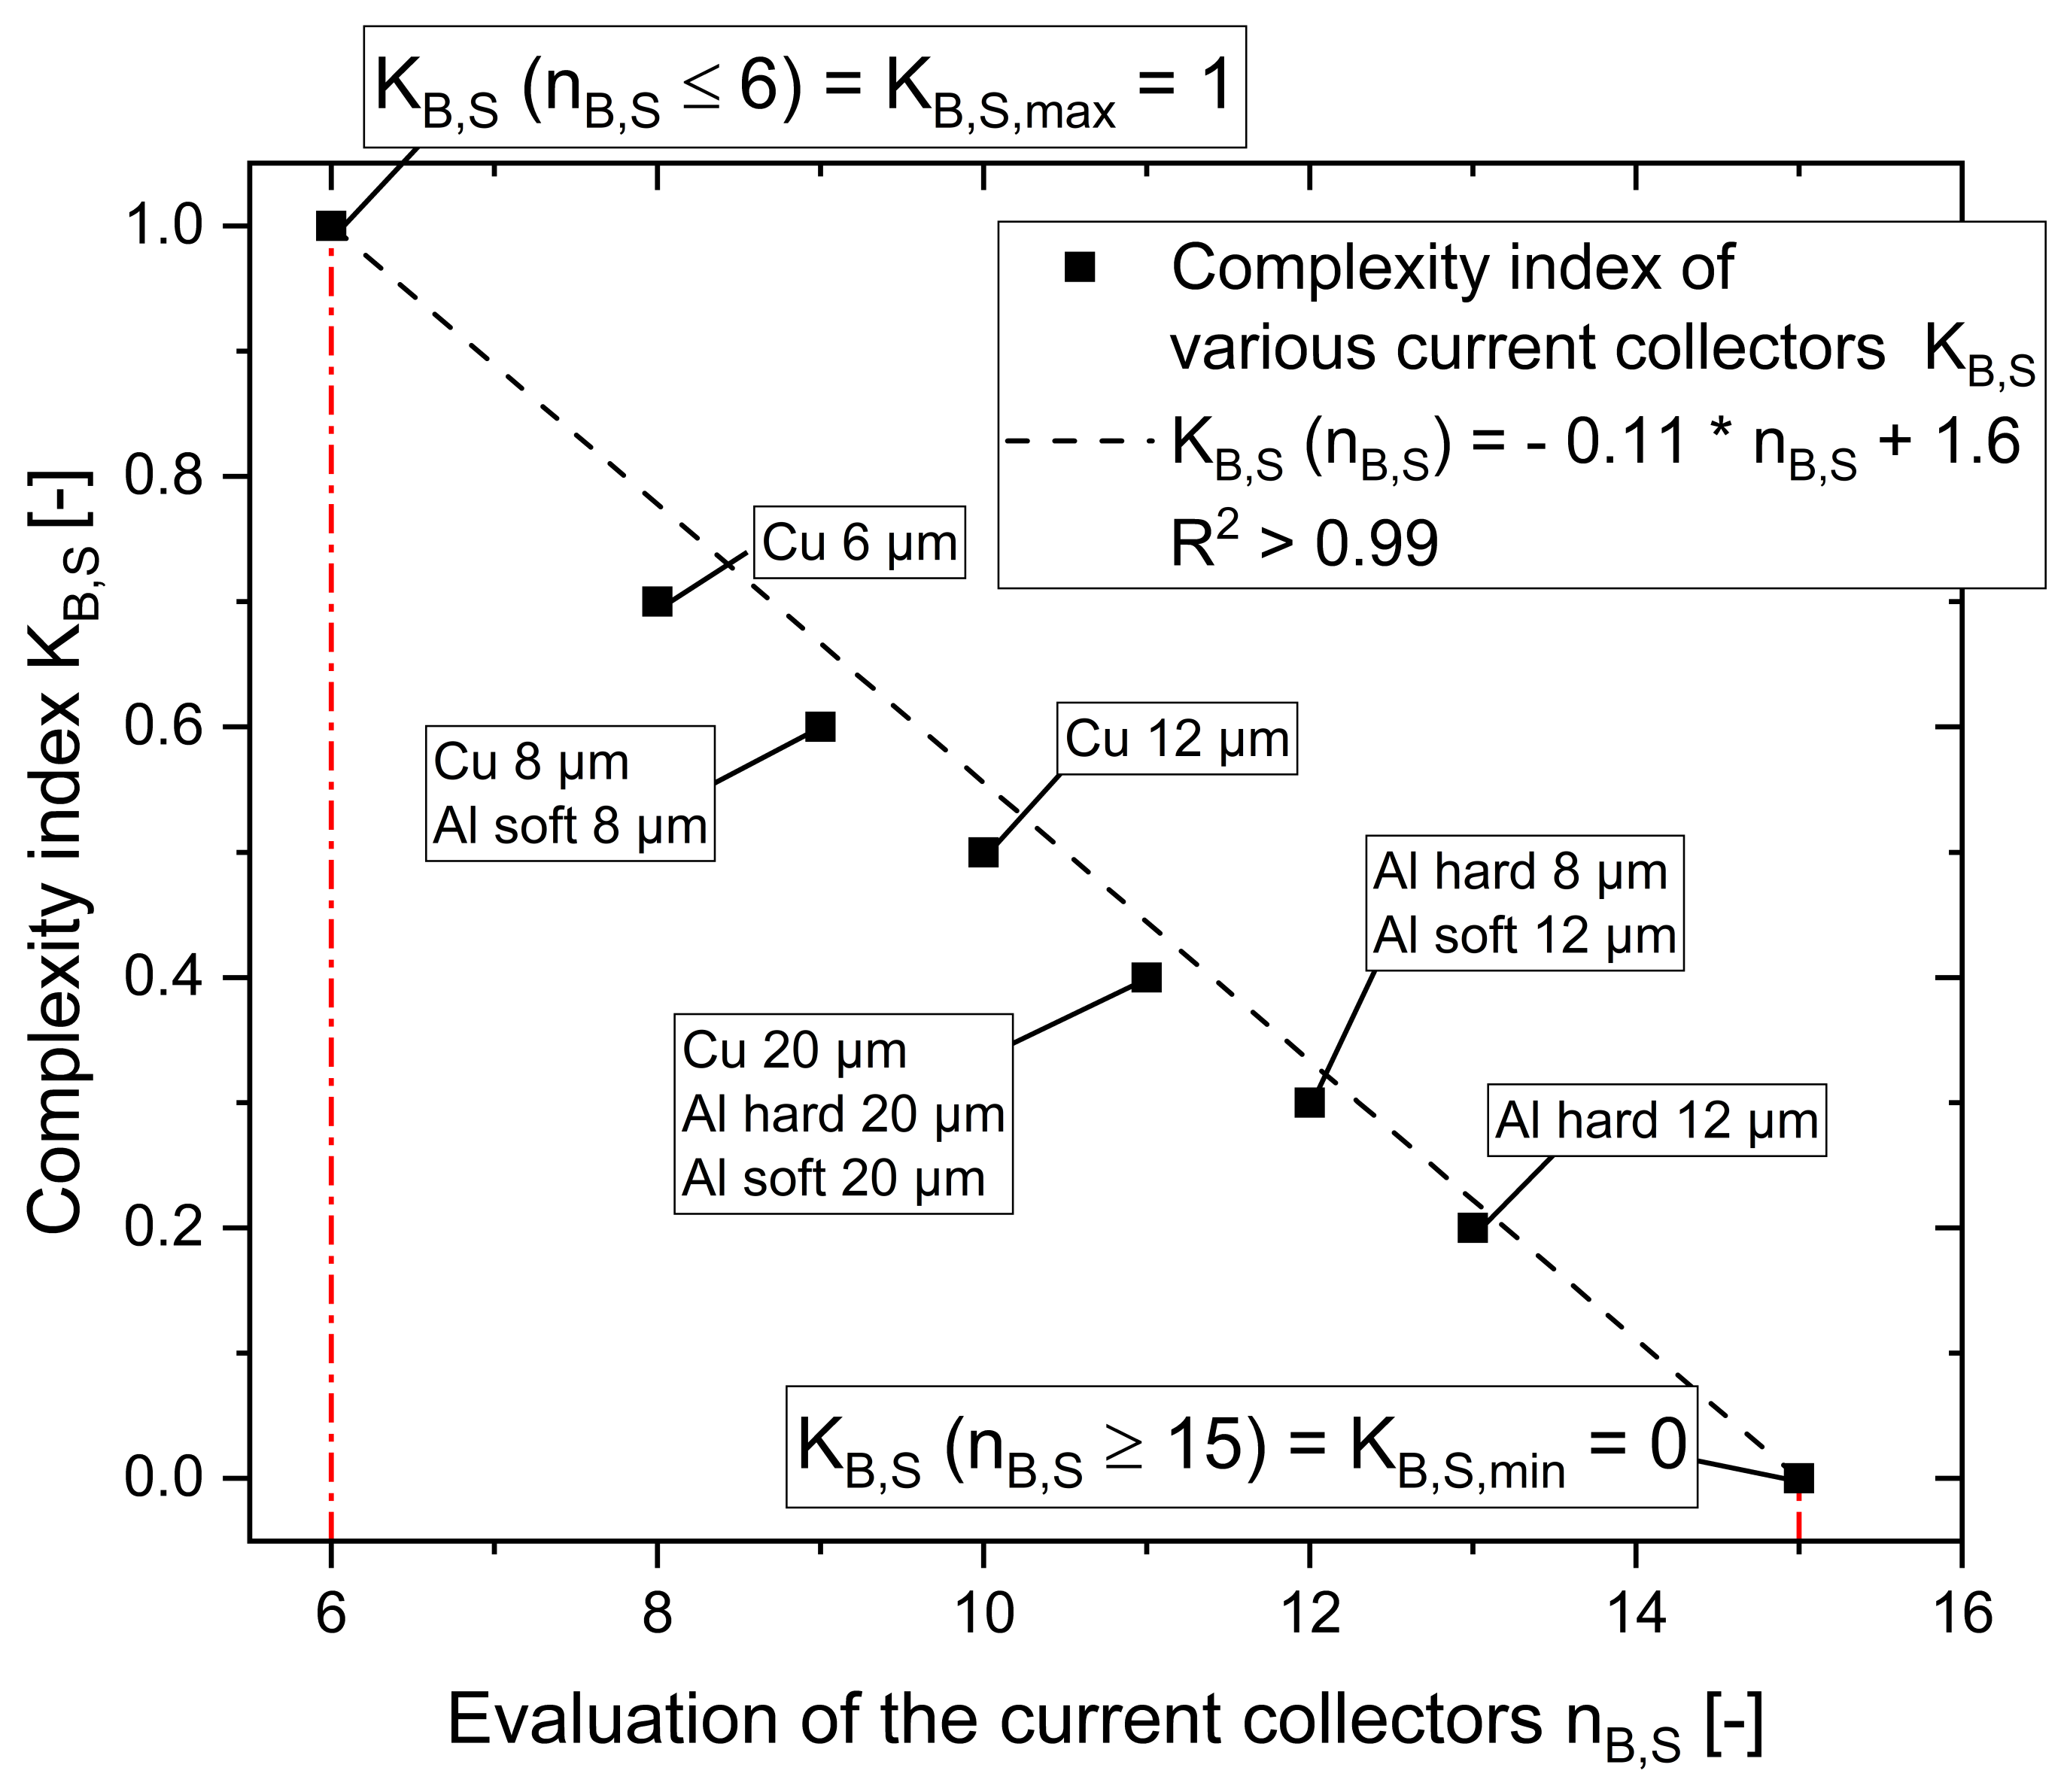
The choice of material for the current collector, on the other hand, is primarily dependent on the active materials used. An example is the use of aluminium in combination with lithium titanate on the anode side. Furthermore, the choice of the current collector material depends on the electrolyte used. For example, pure lithium metal can be selected as the anode in combination with a solid electrolyte. The current arrester variants have different requirements with regard to handling. On the other hand, the thickness and hardness of the material also determine coating, buckling and bulging behaviour of the coated electrodes. Thinner foils are, e.g., more flexible and more vulnerable to air currents during drying and, therefore, can cause damages in the coating. In addition, strength (e.g., tensile strength) is important for web tension during the coating process. If the tensile strength of the foil is low, less web tension is possible and tear offs are more likely. In particular, thin or soft foils are particularly difficult to handle during the production of electrodes and cells. In summary, the different current collector variants are evaluated on the basis of criteria energy (density), production complexity (handling) and temperature (tempering properties) (compare
Table 5).
Accordingly (with a minimum possible score of 3 and a maximum possible score of 15), the complexity values shown in
Figure 7 result in individually considered current collector variants depending on the evaluation.
This results in the relationship shown in Equation (
5).
This results in average specific complexity values at a thickness of 8–12 µm. There is a tendency for hard aluminium current collectors to be less complex and thin foils to show the greatest complexity. When updating the evaluation of the considered current collectors, a simple adjustment of the specific complexity index is possible.
4. Discussion
With the help of detailed knowledge (e.g., in complexity matrix shape), complexity features that increase complexity can be identified directly. By using targeted optimization of complexity, product characteristics can then be improved and sustainability and costs can be positively influenced. The developed tool for complexity assessment is scalable in its effort and offers the possibility to be implemented into existing complexity management. The method allows a quick adaptation or extension and, thus, well-founded decision making. By standardizing the evaluation and taking objectively measurable complexity characteristic values as a basis, a holistic and objective evaluation tool is shown, which can, thus, become a decisive success factor for manufacturers of complex products.
5. Conclusions and Outlook
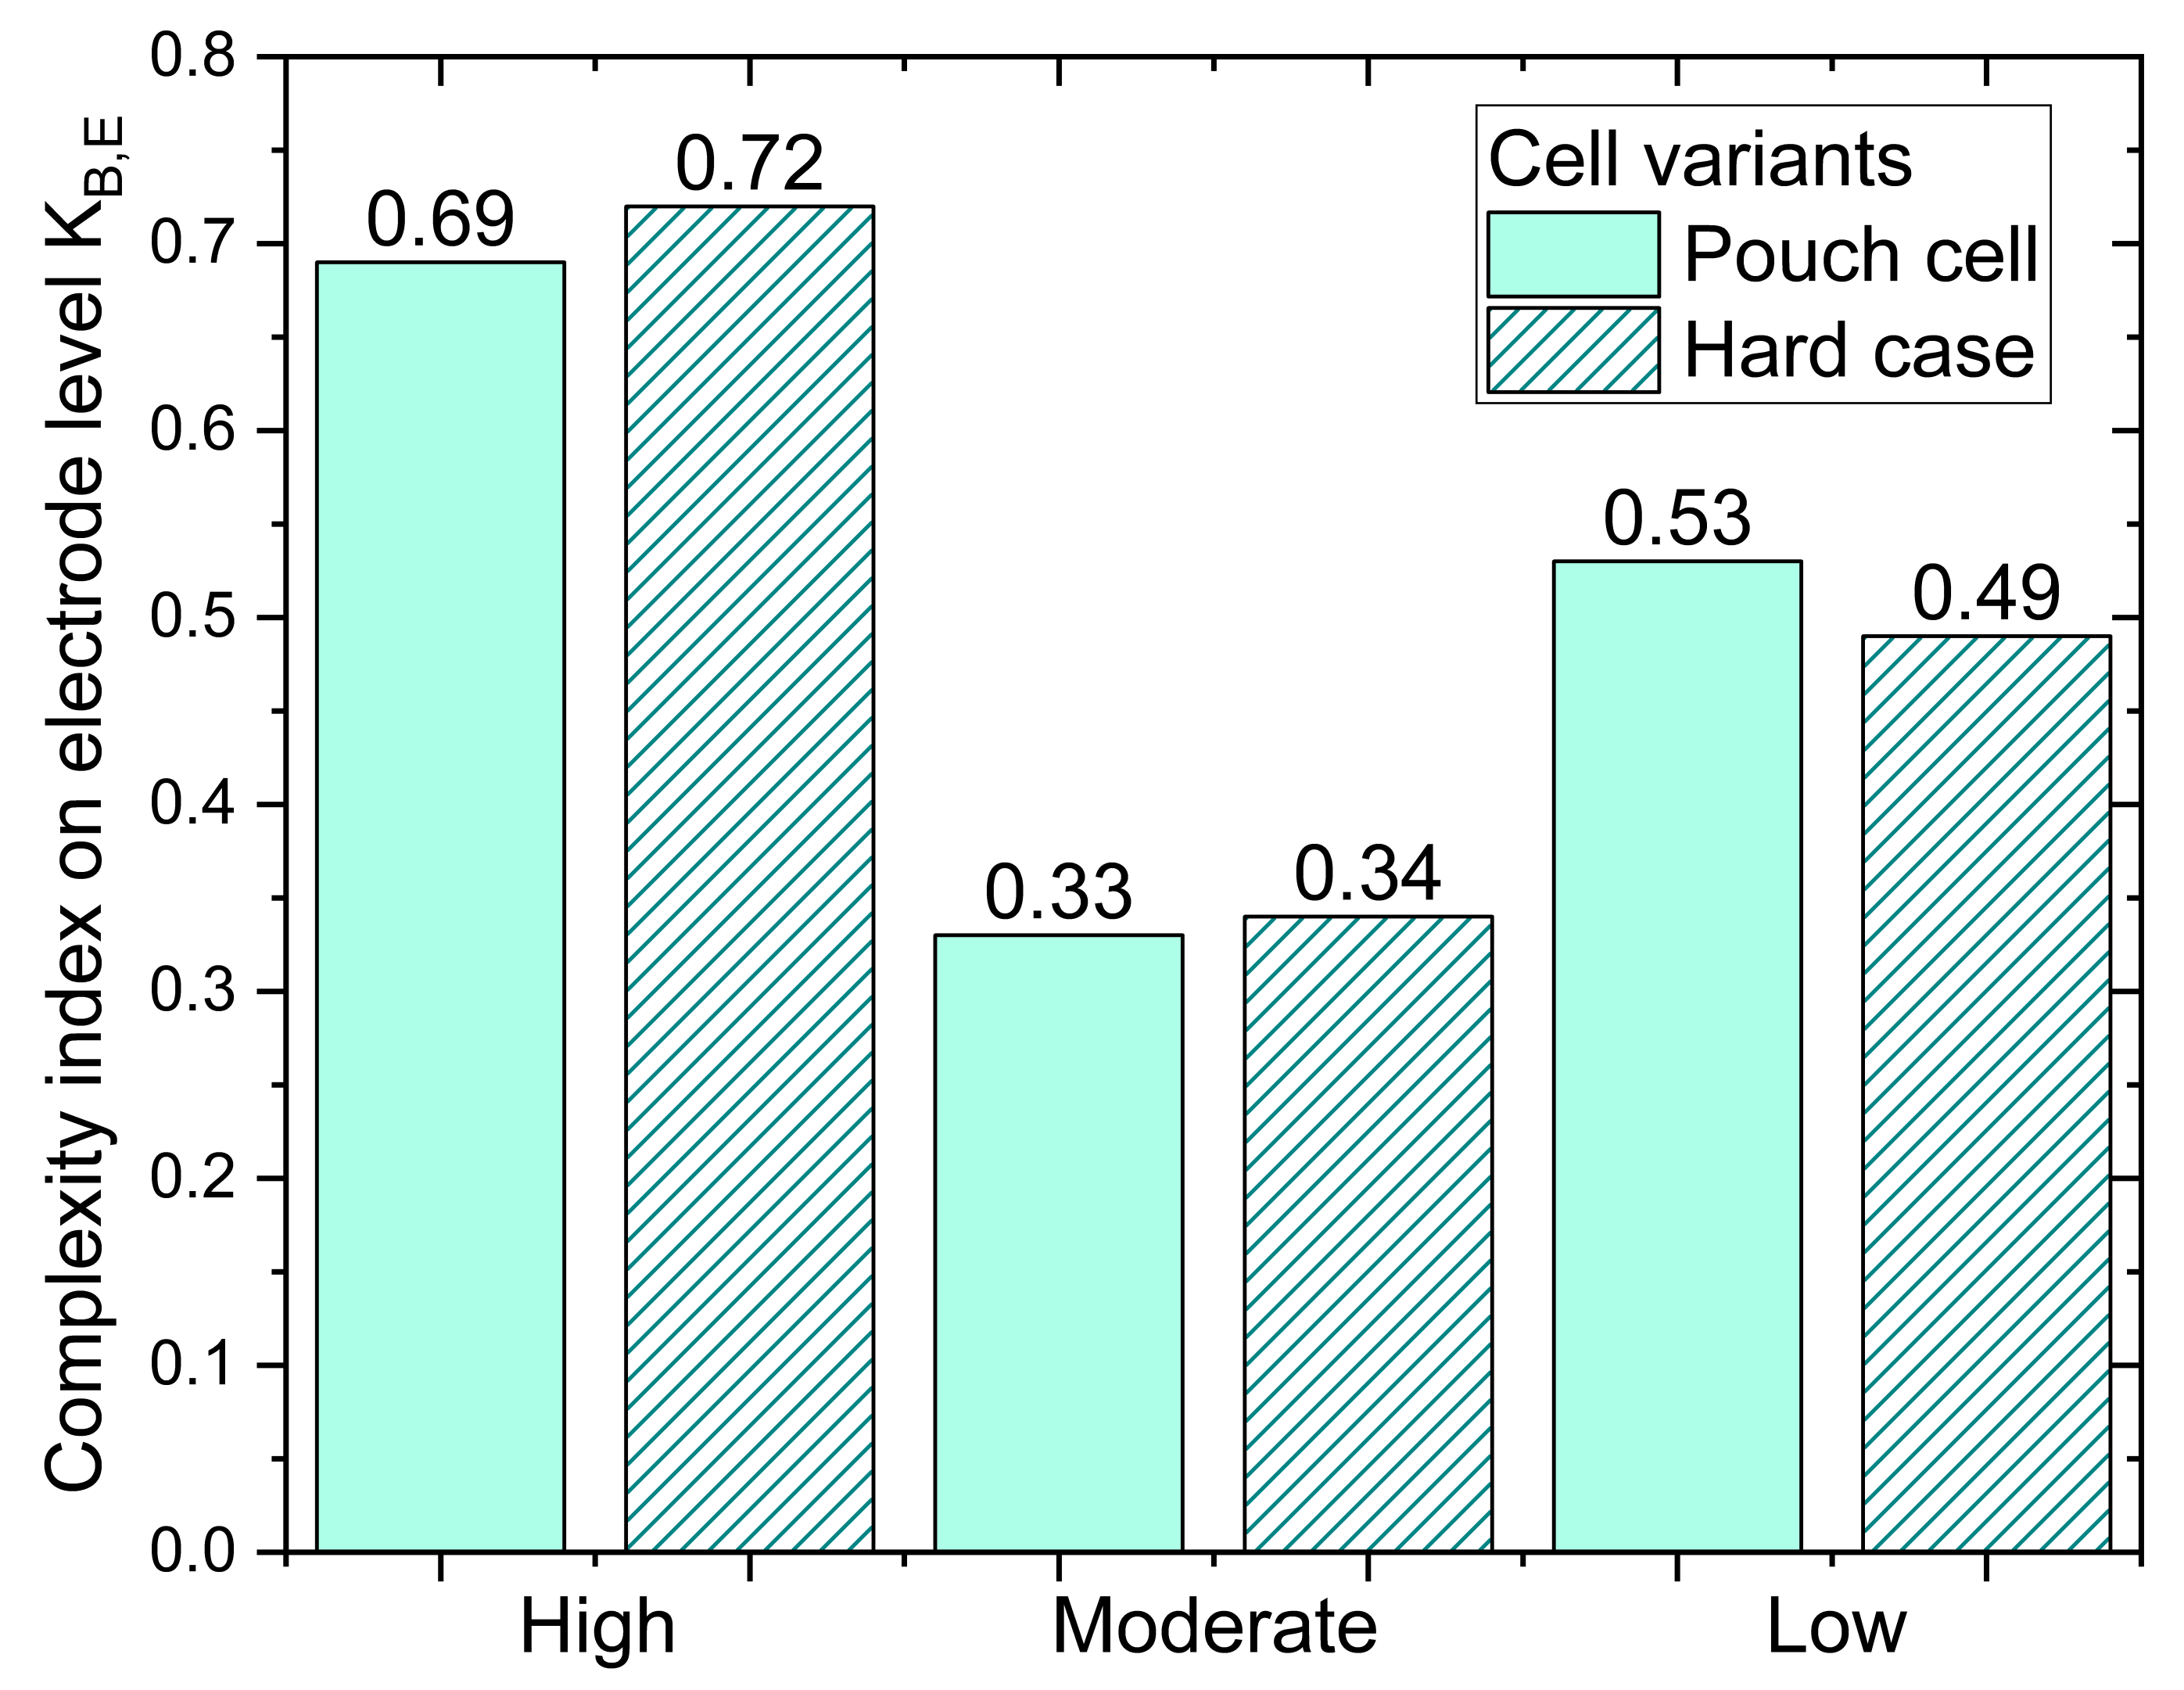
The developed method for complexity evaluation is an enabler for comparing different electrode variants. As an example (see
Figure 8), six different electrode configurations were compared: three for pouch cells and three for hardcase cells. The electrodes were configured differently with regard to their energy density. First of all, it is evident that pouch and hardcase cells have very similar complexities with regard to the different final energy density configurations. It is also clear that high energy densities at the electrode level indicate the highest complexity, and moderate ones indicate the lowest. However, very low energy densities also indicate a higher complexity than moderate energy densities. Here, a linear progression could have been assumed. However, the targeted consideration of complexity shows that moderate energy densities can be advantageous.
This results in the relationship shown in Equation (
5). In contrast to other methods, the developed method enables the determination of a concrete key figure to compare complexity. The method can be scaled variably in terms of effort and benefit. This method can be particularly helpful in supporting decision making. Depending on the decision to be made and the point in time of product development, a specific complexity with a correspondingly low, moderate or high levels of detail can be determined with little, moderate or high effort.
Unlike existing methods, the present approach provides additional adaptability through the universally applicable procedure. Another important advantage is that key figures can be compared independently of products and companies. Advantageous to the present method is the advantage over existing methods in which it can be used to realistically assess the complexity of a product even with limited data.
The developed method can be an adapted problem specifically both in terms of width and depth of the method. The method is characterized, in particular, by the fact that it can be applied to many different problems. The effort for adaptation and modification is linear to the benefit after the first implementation. Here, complexity evaluation of the individual characteristics by groups can be conducted by means of a complexity matrix or by means of the concrete characteristic value using the respective equation for the correlation between complexity and characteristic value. Thus, the developed method for the assessment of complexity allows flexible and sustainable use in the company.
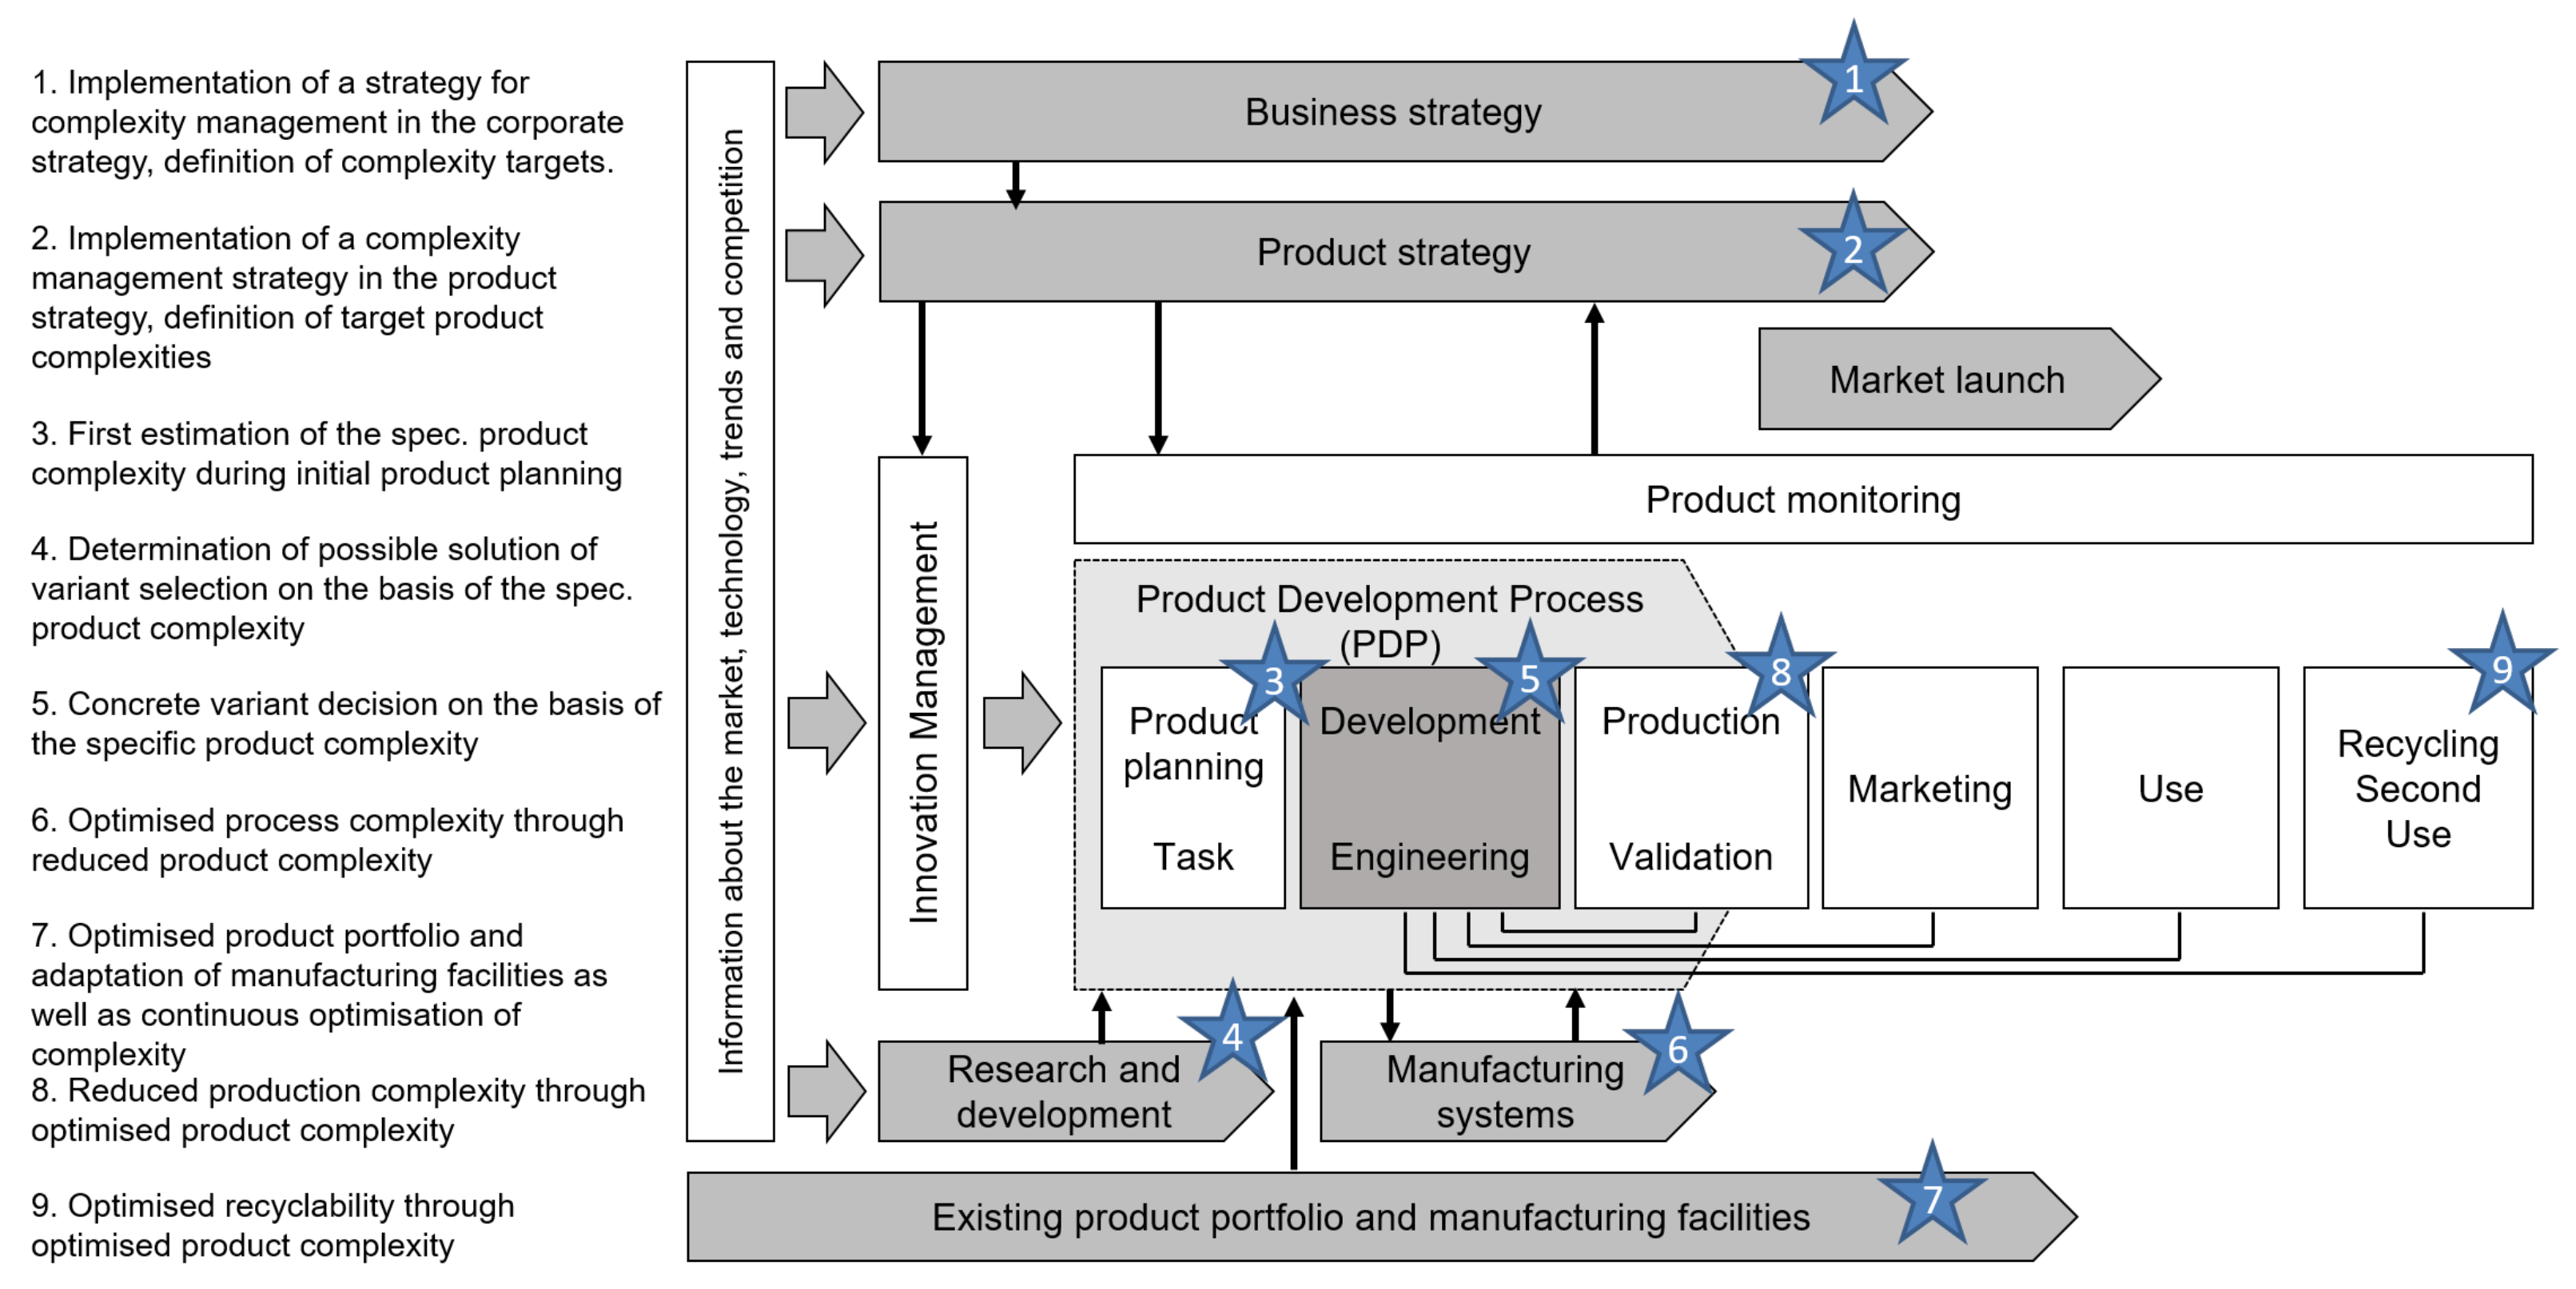
Here, the key figure for the specific product key figure can serve as a basis for decision making or general support at various points in the company processes and in the product development process. The product and product portfolio can, thus, be optimized along the product’s life cycle. Above all, a consideration of specific product complexity indicator in corporate and product strategy within the scope of complexity management is aimed at. For this purpose, the following procedure can serve as a basis for a targeted and efficient implementation of the evaluation method.
In addition to the extension of the method to related products or product families, the extension along the life cycle is possible. For example, a correlation between costs and complexity can be determined. There are various approaches with different levels of detail and effort. The following links and implementations are also conceivable:
Link with general cost valuation methods (such as average cost method [
32], production costs and comparison of sales prices);
Link with specific cost assessment methods (such as for example for cost-optimal interpretation of LIB according to
Tschech [
33]);
Linking with request tools [
34];
Connection with CAD/CAM/CAx;
Linking with DfX methods and approaches (e.g., [
35]);
Linking with simulation methods and approaches;
Automatic capture of complexity features from product documentation or manufacturing documents;
Implementation of algorithms (e.g., self-learning or genetic algorithms) for automatic optimization of complexity;
Connection with methods of quality management (e.g., Failure Mode and Effect Analysis (FMEA) [
36] or House of Quality (QFM) [
37]).
In addition, an extension by the influence of complexity on possible end-of-life strategies of the product is, of course, conceivable. For this purpose, the following aspects can be taken into account, for example, with regard to recycling.
To summarize, the developed methodology can be integrated at various stages of the Product Development Process (PDP). Some examples are provided in
Figure 9.


