Article

Designing a Multicriteria WebGIS-Based Pre-Diagnosis Tool for Indoor Radon Potential Assessment

1
Prometheus, Instituto Politécnico de Viana do Castelo, Rua da Escola Industrial e Comercial de Nun’Alvares, 4900-347 Viana do Castelo, Portugal
2
Escola Superior Agrária, Instituto Politécnico de Viana do Castelo, Rua da Escola Industrial e Comercial de Nun’Alvares, 4900-347 Viana do Castelo, Portugal
3
Escola Superior de Tecnologia e Gestão, Instituto Politécnico de Viana do Castelo, Rua da Escola Industrial e Comercial de Nun’Alvares, 4900-347 Viana do Castelo, Portugal
4
Construct-Lfc, Faculdade de Engenharia, Universidade do Porto, Rua Dr. Roberto Frias, s/n, 4200-465 Porto, Portugal
5
2AI—School of Technology, Instituto Politécnico do Cávado e do Ave, 4750-810 Barcelos, Portugal
6
ADiT-LAB, Instituto Politécnico de Viana do Castelo, Rua Escola Industrial e Comercial Nun’Álvares, 4900-347 Viana do Castelo, Portugal
7
IT—Instituto de Telecomunicações, Campus Universitário de Santiago, 3810-193 Aveiro, Portugal
*
Author to whom correspondence should be addressed.
Appl. Sci. 2022, 12(3), 1412; https://doi.org/10.3390/app12031412
Submission received: 15 December 2021 / Revised: 25 January 2022 / Accepted: 27 January 2022 / Published: 28 January 2022

Abstract

:
Radon (222Rn) is a well-known source of indoor air contamination since in its gaseous form it is a reported source of ionizing radiation that belongs to the group of rare gases. Radon occurs naturally in soils and rocks and results from the radioactive decay of its longer-lived progenitors, i.e., radium, uranium, and thorium. Radon releases itself from the soil and rocks, which mainly occurs in outdoor environments, not causing any kind of impact due to its fast dilution into the atmosphere. However, when this release occurs in confined and poorly ventilated indoor environments, this release can result in the accumulation of high concentrations of radon gas, being recognized by the World Health Organization (WHO) as the second cause of lung cancer, after smoking. Assessing the indoor radon concentration demands specific know-how involving the implementation of several time-consuming tasks that may include the following stages: (1) radon potential assessment; (2) short-term/long-term radon measurement; (3) laboratory data analysis and processing; and (4) technical reporting. Thus, during stage 1, the use of indirect methods to assess the radon occurrence potential, such as taking advantage of existent natural radiation maps (which have been made available by the uranium mineral prospecting campaigns performed since the early 1950s), is crucial to put forward an ICT (Information and Communication Technology) platform that opens up a straightforward approach for assessing indoor radon potential at an early stage, operating as a pre-diagnosis evaluation tool that is of great value for supporting decision making towards the transition to stage 2, which typically has increased costs due to the need for certified professionals to handle certified instruments for short-term/long-term radon measurement. As a pre-diagnosis tool, the methodology proposed in this article allows the assessment of the radon potential of a specific building through a WebGIS-based platform that adopts ICT and Internet technologies to display and analyze spatially related data, employing a multicriteria approach, including (a) gamma radiation maps, (b) built environment characteristics, and (c) occupancy profile, and thus helping to determine when the radon assessment process should proceed to stage 2, or, alternatively, by eliminating the need to perform additional actions.

1. Introduction

In order to assess indoor air quality (IAQ), low-cost IoT systems are emerging for straightforward and on-time monitoring. Recent advances in the design of IoT technologies for IAQ management can lead us to modern “cognitive buildings”, very much focused on the users and occupants, and hence contributing to the reduction in human exposure to most indoor pollutants. Based on that, the objective of this research is to present a methodology supporting the development of a WebGIS platform, which allows a first approximation to assess indoor radon exposure, a harmful indoor air pollutant, setting the focus on the occupant and the occupancy. Indoor air quality (IAQ) stands for the management of three distinct sources of air pollution: physical pollutants related to light, electromagnetic files, air temperature and relative humidity and noise; chemical pollutants, derived from carbon dioxide and carbon monoxide, volatile organic compounds (VOC), and some others, such as ozone, sulfur dioxide, nitrogen dioxide, formaldehyde, ammonia, ozone and radon; and biological pollutants, such as fungi, viruses, bacteria, among other factors [1,2,3]. The lack of IAQ leads to the so-called “sick buildings” [4], and according to the World Health Organization (WHO) literature on the subject, about 30% of the buildings made in the 1970s and the 1980s are suffering from this kind of syndrome [5]. A few steps in the right direction have been taken since then to prevent “sick buildings”, with some WHO-specific publications, namely the first edition of the “Air Quality Guidelines for Europe”, in 1987 [6], followed by the second edition in 2000, including a specific section describing all indoor air pollutants [7]. More recently, in 2005 [8], WHO has updated specific guidelines for IAQ promotion, and in 2009, it published new recommendations concerning public health protection from risks derived from indoor dampness and microbial growth [9]. In 2010, WHO specified the recommended figures for nine of the more frequent indoor air pollutants [10]. From all indoor air pollutants, radon is consensually considered one of the most critical to human health [11], given its radioactivity, which results from the uranium decay available in rocks, soils, and building materials [12,13,14]. Since it is considerably heavier than air, radon tends to be trapped indoors mainly in badly ventilated buildings [12,13,14]. It is reported that indoor radon concentration is particularly harmful in high energy-efficient buildings, very well insulated and airtight, since the lack of air renovation promotes higher indoor concentration [15,16]. The modern paradigm of the energy efficiency of buildings, favoring the use of airtight high-insulated windows, super-insulated roofs and façades, and high-performance climatization systems and devices, is leading to the production of ultra-airtight building shells and enclosures [17,18], disregarding the ventilation need for air renovation and indoor air quality (IAQ) promotion and improvement, either by natural or mechanical means [19,20,21].
The exposure to natural radiation associated with indoor radon levels (222Rn) has been an object of growing concern, especially since the first studies that correlated the effects of indoor radon with the occurrence of various diseases, including cancer, began to emerge [22,23,24,25]. In fact, in the decades of the 60s and 70s of the 20th century, several research studies related the exposure to high radon concentrations with lung cancer [26,27], primarily if related to other factors, such as tobacco consumption [28], or exposure to mineral dust [29], e.g., from the mining activity [30].
The relationship between the granite geological substrate and high indoor radon concentration is a piece of evidence that has been proved by many assessment studies carried out in situ, which also led to active research into the origins of the gas itself, which is strongly related to a specific set of nature granite/schist lithologies. Therefore, to infer indoor radon potential, the knowledge of the geological substrate of the place where the buildings are located is mandatory [31,32]. Based on the evidence, indoor radon assessment in buildings with foundations on susceptible types of soils became a widespread procedure, especially after the establishment of maximum admissible doses in the Directive 2013/59/Euratom. This directive focuses on reference values that are currently being transposed into legislation in force in several EU nations and thus pushing the citizen towards an increased radon-related literacy, and thus paving the way towards citizen science, i.e., the science that focuses on public participation, as well as broadening the scientific awareness of the public [33,34].
This need led to the organization of the data collected in a dispersed way and to carry out national campaigns to draw up radon maps. These maps, however, have suffered from several constraints, namely the long periods required for their execution, since the methodologies used for data collection are highly time consuming and costly, especially when they resort to the use of passive detectors, which require long measurement periods inside the buildings and a period of laboratory preparation to obtain the results. Thus, the use of other methodologies that allow a more expeditious assessment of the radon exposure and the potential for the occurrence of radon in concentrations that may be contraindicated for the users of the indoor spaces is an urgent need. This time, for example, using indirect and comparative methods, in which a relationship is established between other forms of radiation, such as β or γ, with the α radiation released in the radon decay process can be a possibility. This was the case presented and developed by the MARNA project, launched in Spain, and which, according to Mahou and Amigot (1997), seeks to draw up a highly detailed natural radiation map for the whole Spanish territory [35], and has been developed within the framework of the agreement established between the Spanish Nuclear Safety Council (CSN) and ENUSA.
With the results obtained and with the elaboration of the natural gamma radiation maps, Poncela et al. (2004) presented a relationship between gamma radiation and indoor radon levels in Spain [36], and more recently, Fernandez et al. (2017) presented the Spanish experience on the design of radon surveys based on the use of geogenic information [37], which follows on the previous work by Sainz-Fernandez and Fernandez-Villar (2014) who based the Spanish indoor radon mapping strategy also on natural radiation maps [38], whose use was justified for the development of a more expeditious tool to assess the level of radon exposure. This approach can be used as a decision support tool, preferably in the pre-construction design phase, for the adoption of passive mitigation measures, or in the case of already built assets, which guide to carry out an assessment analysis that confirms or rules out the need to implement active mitigation measures to minimize the radon exposure to occupants.
Thus, this article presents a straightforward preliminary methodology based on the use of natural gamma radiation as an approach for assessing indoor radon potential. This approach correlates gamma radiation to probable radon occurrences, insofar as radiometric surveys to quantify the natural gamma radiation have been carried out to a large extent all over the world, mainly in uranium mineral prospecting campaigns, being, therefore, available and with coverage on a national scale, or, in the case of large countries, on a regional scale. Based on that, the objective of this research is to present a methodology supporting the development of a WebGIS platform, which allows a first approximation to assess indoor radon exposure, placing the focus on the building occupant. The graphical approach enabled by the WebGis platform makes indoor radon potential assessment for a specific building location easy to be visualized by all interested citizens. The rest of this article is structured as follows: Section 2 presents a list of related works on the subject; Section 3 depicts the materials used, and the methodology assumed for this research; Section 4 presents a methodology to develop a WebGIS platform for indoor radon potential assessment; and in Section 5, the conclusions are synthesized.

2. Related Works

2.1. Framework

Uranium-238 (238U) is a naturally occurring radioactive element found in soils and rocks in different concentrations. The decay of 238U occurs through a series of shorter-lived radionuclides that can eventually produce Radium-226 (226Ra), which has a half-life of 1620 years, and which decays by alpha-particle emission directly to Radon-222 (222Rn), which has a half-life of 3.82 days. Other radon isotopes also can be formed naturally in these decay sequences. One of these isotopes, Radon-220 (220Rn), is formed by the decay of Radium-224 (224Ra), in the decay sequence of Thorium-232 (232Th), and has a half-life of 56 s, while Radon-219 (219Rn) has a half-life of 4 s, and is formed from the decay of Radium-223 (223Ra), in the decay sequence of Uranium-235 (235U) [39,40].
Despite having been discovered in 1900, it was only in the 50s of the 20th century that awareness of its potential as being hazardous to humans was realized, through the perception and recognition of the high levels of exposure of uranium miners [41]. This noble gas, formerly called emanation, was discovered a few years after radium, but because they are elements with such short half-life times, it was only recently possible to proceed with the characterization of radon compounds, even though there are definite indicators for the existence of such compounds. Since radon isotopes are all gases, they are normally released into the atmosphere and dispersed by air currents. As radon is relatively short lived, its applications are also very limited. For example, for medical applications, radon can be used as a radiation source. In this case, radon is placed inside small sealed glass tubes, and after its decay, the whole series of Po, Bi, and Pb-isotopes are formed and whose penetrating radiation is useful for therapy [42]. 222Rn has a half-life long enough to be used as a marker in hydrogeological studies, while the remaining isotopes have a half-life too short to be used as tracers in environmental investigations [39].
The occurrence of radon is directly related to the geological substrate, since all rocks contain some uranium, although some rock types only have very low contents [43,44]. Natural diagenetic processes cause the mechanical and chemical breakdown of rocks, releasing uranium compounds, which also become part of the soil. In other words, from this perspective, it is expected that the uranium content of a soil to be approximately the same as the rock that gave rise to it. However, some rock types have higher values for uranium concentration, such as light-colored volcanic rocks, granites, dark shales, phosphate sedimentary rocks, and all the metamorphic rocks derived from those mentioned above. This higher concentration of uranium will contribute, through its natural decay, to the occurrence of higher radon concentrations as well [45]. In a gaseous state, radon has much greater mobility than uranium or radium, which are fixed to solid matter, in rocks and soils, while radon can simply migrate to the pores and cracks of rocks and soils, and thus exiting outside. When this release takes place in the outdoor environment, the gas is immediately dispersed, not accumulating in a specific location, and therefore does not cause any problem. On the other hand, if this release occurs in a confined space, such as a building, the accumulation of radon indoor can reach levels that can become worrisome, especially if it is a space with human occupation [46].

2.2. Radon Occurrence and Concentration

The mobility of radon through different materials is a process highly influenced by several factors that affect the characteristics of the materials themselves. Among these properties, porosity, permeability, grain size, structural arrangement, radionuclide content, gas diffusion coefficient, and the weathering state of the materials can be highlighted, namely, the degree of cracking and fracturing [47]. Thus, it can be stated that radon transport is directly correlated with the occurrence of geodynamic, volcanic, and tectonic events, as those will contribute to the release of the gas towards the surface [48]. However, some studies, such as the one by George (1980), seem to indicate that radon found on the surface, and that it may eventually be found inside buildings, is of local origin, and some radon daughter is commonly occurring [49]. The author even mentions that in the measurements made of the radon contents from the soil surface to a depth of 10 m, the concentration is 40% lower than at the surface. The same author indicates that the meteorological parameters that most seem to influence the concentration and flux of radon are the wind speed, which largely contributes to its dispersion, while the surface temperature seems to affect the gas emanation. The high temperature enhances the emanation, while the low temperature reduces the gas release, especially if the most superficial layers of the soil freeze, limiting the gas flow as much as possible. This knowledge about radon gas movement becomes even more important when human exposure inside buildings to naturally occurring radioactive gases, such as radon, comes to be recognized as a health problem [7,10,50]. Radon is by far the largest single contribution to the dose of radiation received by the general population and may be a potential hazard to human health, as presented by Hewitt and Kelly (1990) [51]. It was precisely this assumption of public health hazard that led to the growth in the number of works on the assessment of indoor radon concentration.
The indoor radon concentration is influenced by the type of rock underlying the dwelling, double glazing, house type, floor level where measurements are taken, air circulation, building materials, floor type, and draught proofing [24]. This set of factors seems to be determinant for indoor radon concentration, as demonstrated by Casey et al. (2015), who presented the local geology, the abstraction of groundwater, and the constructive elements used as the main factors that affect indoor radon concentration [52]. The same authors add a factor, perhaps one of the first references to this aspect, which is related to the unconventional natural gas development projects, most likely related to the exploitation of shale gas by fracking methods. In other words, human activity can also enhance the release of radon gas, and thus contribute to an increased indoor radon potential. Since weather conditions influence radon concentration, seasonal variations are expected to occur in connection with seasons changing. Stojanovska et al. (2011) analyzed the variations in radon concentration over four successive three-month periods (winter, spring, summer, and autumn), with the results demonstrating statistically significant differences between indoor radon concentrations along seasons [53]. Alghamdi and Aleissa (2014) also stated that the results obtained in their survey were found to vary substantially due to seasons, among other factors [54].
All these aspects are important to characterize the source of indoor radon concentration, as it is through the identification of the sources that can be chosen and applied the most appropriate mitigation measures for each situation. Nero and Nazaroff (1984) confirmed this need, stating that the determination of the source requires knowledge of the generation of radon in source materials, its movement within materials by diffusion and convection, and the means of its entry into buildings [55]. For this reason, the authors attributed different orders of magnitude to different sources, directly related to the variability presented if originated from the soil, groundwater, or building materials. However, all the knowledge acquired about radon, its origin, sources, mobility, and concentration, only supports the understanding of the impacts that this gas presents, or may present, on human health. Studies on the impact of radon on human health multiplied early after their onset, mainly associated with potentially exposed workers, such as miners, who can spend all their working hours in confined environments with high radon concentrations. By analogy, it quickly became clear that the indoor radon concentration associated with buildings could/should be approached in the same way, as the concentration could also reach substantially high values in buildings, placing workers or residents exposed to high doses of radiation.

2.3. Radon Assessment

The combination of factors related to the occurrence of radon and the presence of people inside buildings led to the need to assess the concentration to which these occupants may be exposed, not least because, as confirmed by the work of Appleton and Miles (2010), significant variations may occur in indoor radon concentrations, which may be related to several factors, including the geology itself, since even within the same lithology, significant differences may occur [56]. For this reason, the construction of radon maps, where it is possible to observe the variation of indoor concentrations both between and within mapped geological boundaries, assumes particular importance.
For the preparation of maps that present information about the occurrence potential, several methodologies have been developed for the construction of radon maps. One of these methodologies, presented by Neznal et al. (2004), uses the Geogenic Radon Potential (GRP), where the GRP is a function of soil radon concentration and soil gas permeability [57]. Another index derived from geogenic information is the Geogenic Radon Hazard Index (GRHI), with their differences tending to be the type of geographic support and optimally as indoor radon predictors, as presented by Bossew et al. (2020) [58]. The same authors listed, as one of the main advantages of this index, the fact that it presents a high consistency across borders between regions with different data availability and radon survey policies, which has to date prevented the creation of a European map of geogenic radon. In any case, despite the lack of some cooperation and standardization of radon assessment methodologies on a more global scale, national scale works using these methodologies continue, and present conclusions leading to the development of prevention and protection policies for the citizens. For example, Petermann and Bossew (2021) present the mapping of the indoor radon hazard in Germany, based on the geogenic component, indicating the main implications for radon protection [59]. The authors consider as priority areas the cost-effectiveness of protection measures that allow finding most of the buildings exceeding the threshold concentration with a given number of resources, achieving an optimal reduction in, e.g., lung cancer incidence, also in areas outside radon priority areas, because hazardous indoor radon concentrations can be found in low-to-medium concentration areas as well.
Thus, the assessment has been fundamentally divided into two large groups, which, although they share a common objective, which is to assess radon levels to which people may be exposed, the purpose of its execution is quite different. In other words, in a first group, the assessment is carried out on a one-off basis, using different types of monitoring equipment, to quantify the levels of radon existing in a given building, or group of buildings, in a specific location, which only allow to obtain results and draw conclusions about that specific location. In this type of survey, in most cases, neither is the origin of radon analyzed, nor are the most significant factors for the occurrence of contraindicated values inside buildings, focusing more on the presentation of corrective measures to minimize the problem. On the other hand, the second group focuses on multi-location quantification, covering large territorial areas, often (preferably) covering specific areas on a national or regional scale, using passive type detectors, which are then processed in the laboratory, and the data obtained are compiled and analyzed. It is normally this type of survey that is behind the elaboration of radon maps on a national scale. However, as it is easy to understand, this type of action entails some disadvantages, namely those related to the time required for data collection, as the process involves the distribution of a very large number of detectors and their subsequent collection after the measurement period, and the cost associated with the detectors themselves, distribution and collection logistics, and also the laboratory work to obtain the data. As previously mentioned, Petermann and Bossew (2021) stated that one of the priorities that must be taken into account in mapping and assessment the work is that the cost-efficiency relation must be effective, so the use of more expeditious methodologies must be taken into consideration [59].

2.4. Recent Developments

There are several proposals for the use of other ways of measuring radon levels, namely using active detectors, which can even be integrated into IoT systems, which in real time allows the analysis of the evolution of indoor radon concentration and its reaction, for example, to the airing of spaces, forced ventilation, seasonality, or even daily variations. For example, Lopes et al. (2019), within the scope of the RnMonitor project, developed a WebGIS-based platform for the expeditious in situ deployment of IoT edge devices and effective radon exposure management [60]. This project arose, according to the authors, because the available equipment was not designed for radon gas monitoring and was not present in the expedite strategy for radon assessment. Despite the potential for speeding up the process that these new methodologies present, it is still necessary to optimize the time and costs related to carrying out large-scale surveys, for example, on a national scale. Therefore, the use of existing data, such as the radiometric surveys carried out by the uranium mining industry all over the world, can allow the creation of easily accessible and inexpensive tools that can be used for the preparation of radon potential maps, ensuring that the relationship between the collected data is properly respected.
There are several approaches to the elaboration of radon maps, which can be used depending on the intended purpose of the map [61]. Of the various works available, there are several that point to the use of methodologies that extend towards predicting the potential for radon emanation, such as the work presented by Ielsch et al. (2002) [62]. These authors proposed a methodology based on the quantification of the radon emanation rate, starting from a precise characterization of the main geological site and pedological parameters that control the radon source and its transport to the soil/atmosphere interface. This methodology combines the cross-mapping analysis of these parameters into a geographic information system with a model of the vertical radon transport by diffusion in the soil. On the other hand, the elaboration of a detailed geogenic radon potential mapping based on field soil gas radon and soil gas permeability measurements, as presented by Szabó et al. (2014), but also by many other authors, seems to be the dominant methodology, and these maps are often the basis for the elaboration of radon maps [63]. However, if on the one hand, these maps provide reliable information for the locations where the control measurements were taken allowing the prediction with a high degree of reliability for the locations of high concentration, the same will no longer be entirely true for the locations where there is great variability in concentrations, or the soil concentration values are lower. However, even these lower values can lead to high indoor radon concentrations. Pasculli et al. (2014) presented a modeling methodology for the analysis of radon potential based on environmental geology and geographically weighted regression and concluded that, although the results are encouraging, there are several critical issues to be addressed [64], from which it can be inferred that these maps do not dispense the confirmation of information by traditional assessment methods.
As mentioned before, there are several methodologies used in the elaboration of radon maps, which are used for the most diverse purposes. As it has also been seen, the reliability of the information taken from these maps is greater the higher the number of measurements behind the map, and the more elaborate the analysis of the correlation between the various parameters that contribute to the occurrence of distinct radon emanation rates. As a first approach, it is possible to have an initial outline of the problem by drawing up a radon potential map, therefore enabling an expeditious analysis to gauge the real need of carrying out a rigorous assessment afterwards. A radon potential map can also be an adequate instrument to be used in a preliminary construction design phase for buildings, as a pre-diagnosis tool to support decision making concerning building-site implantation.

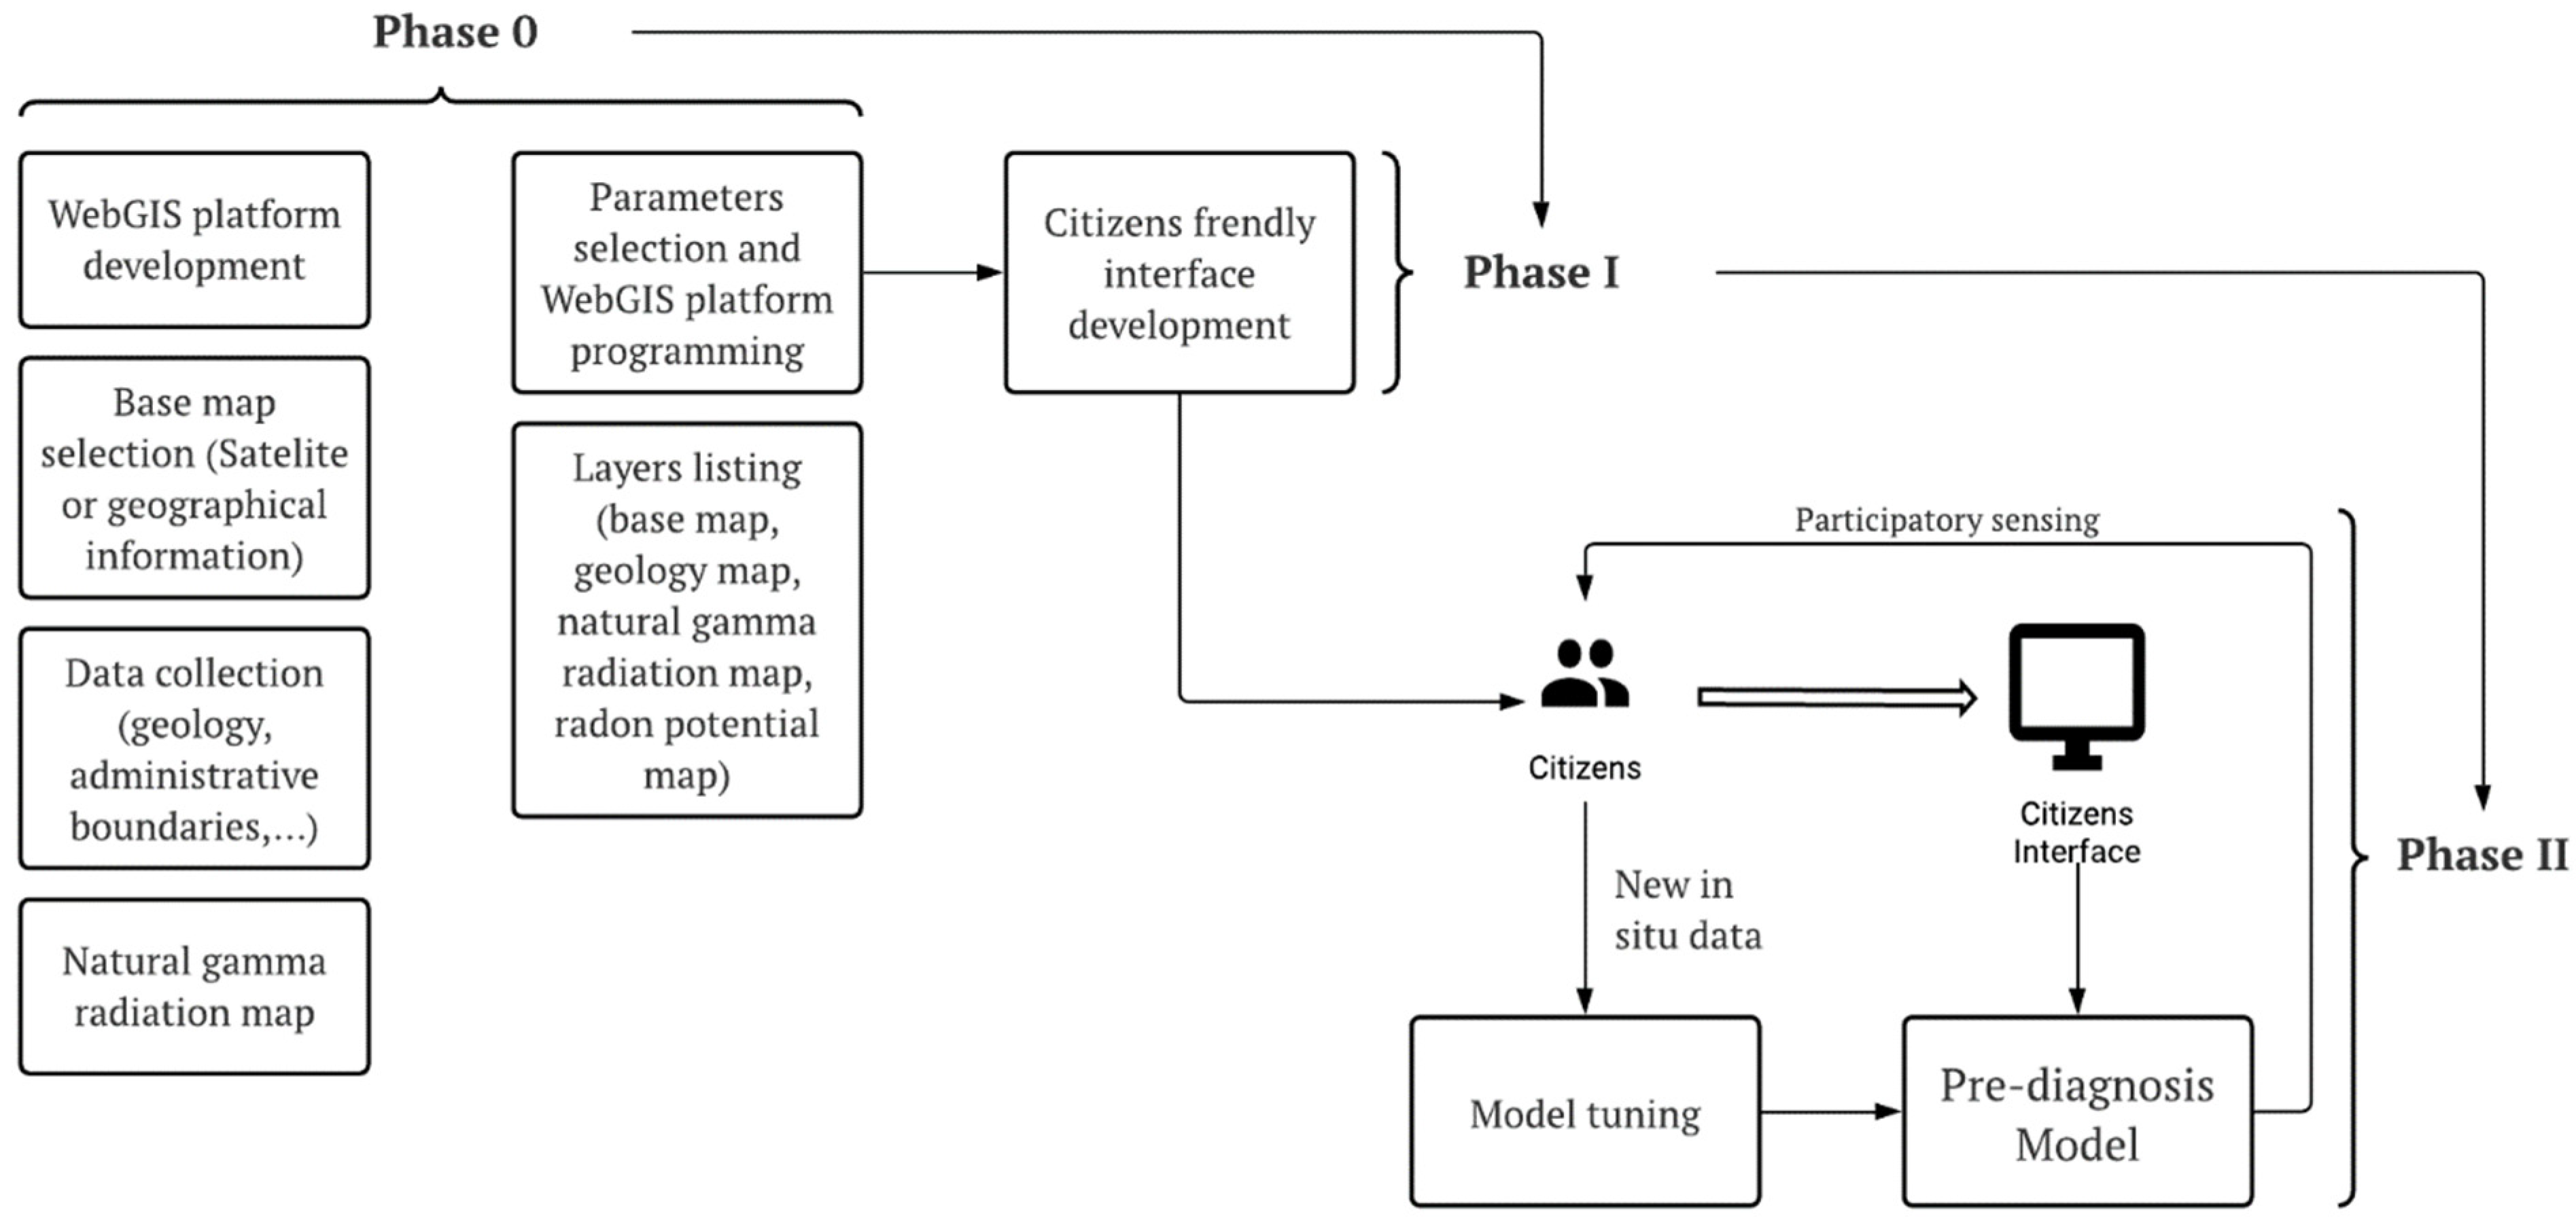
3. Materials and Methods

Natural radiation assessment programs date back to the 50s of the 20th century when campaigns for prospecting uranium minerals were intensified all over the world and were the first step that allowed obtaining in situ data for designing indoor radon potential maps. During the Cold War, the two political blocs were trying to discover, on their territory or those of their allies, reserves that would allow them to develop their nuclear industries, both from a military perspective for the development of weapons of mass destruction, but also from a perspective of energy production, as nuclear energy was taking its first steps and asserting itself as a sustainable and reliable alternative. These radiometric surveys, mostly airborne carried, allowed the coverage of large areas and lasted for tens of years, gathering large amounts of information, which were updated over the years through massive campaigns facilitating, therefore, the creation of indoor radon potential maps. Identically, these types of surveys were also carried out in places as diverse as Sudan, as presented by Sam et al. (1997) [65], in Spain, as presented by Suarez and Fernandez (1997) [32], in Iran, as presented by Saghatchi et al. (2008) [66], or in Jordan, as presented by Alomari et al. (2019) [67], just to mention a few examples, as it is possible to find many more references. However, the works that draw the most attention are those that somehow related gamma radiation levels to radon concentration levels, as they may be the necessary and sufficient foundation to validate a methodology that would change the cost and time required to carry out radon potential maps by traditional processes.
Based on this approach, the most straightforward methodology for designing indoor radon potential maps was perhaps the one adopted by MARNA project, developed into the framework of an agreement subscribed between the Spanish Nuclear Safety Council (CSN) and the National Uranium Exploitation Company (ENUSA, Selise Serchico, Spain) [36]. Under the scope of MARNA project, the authors used the gamma radiation values to estimate the radon emanation values, and concluded, when comparing with the measured values, that these present a good correlation [68]. A similar approach was followed in Slovenia, as presented by Andjelov and Brajnik (1996), who concluded in their study that soil radon concentrations are consistent with observed natural radiation levels [69]. In other words, it can be inferred that there is a correlation between them.
Sainz-Fernandez et al. (2014) go even further by presenting the Spanish indoor radon mapping strategy [38]. In this work, the authors justify this methodology by the fact that indoor radon mapping still represents a valuable tool for drawing a picture of the exposure of the public due to radon in a residential and labor context, while the information provided is also useful to facilitate the decision-making process by authorities and policymakers. In this way, the use of the existing information, even if it was developed for other purposes, is presented as a resource of great added value, which, on the one hand, speeds up the process of preparing radon potential maps, while on the other hand, it allows containing costs in the elaboration of these same maps, since it works on pre-existing information.
Inspired by the results obtained in the previously mentioned MARNA project, presented by Poncela et al. (2004), it is possible to point to the possibility of using natural gamma radiation maps to forecast indoor radon levels [36]. Based on that, Figure 1 describes the simplified methodology proposed for radon potential mapping by following the 3 phase methodology proposed in this article.
This methodology presents three phases, one of which is called Phase 0, a preparatory stage where the objectives of the map to be elaborated are defined, as well as which WebGIS platform to be used is chosen. It is assumed that at the beginning of a project of this nature, the geographic limits of the region to be analyzed are defined in advance, as well as the existence of the necessary data for the continuation of the work being confirmed. The information necessary for the elaboration of the platform is gathered and analyzed, namely the information that will serve as the base map, which can be a georeferenced satellite image or a georeferenced geographic map, which allows citizens to find the location for which they want to obtain information on the radon potential level. Additionally, in this phase, information is collected on geology, administrative boundaries, and any other available information that contributes, first, to increase the reliability of the results, and second, to contribute to the meeting of the real needs of users. Finally, still in this phase, and after obtaining the natural gamma radiation map of the region under analysis (or where the region under analysis falls), a detailed analysis is carried out, so that the criteria for the definition of radon potential is put forward. This question is of particular importance, as it will be based on this definition that the boundaries between the different radon potential areas will become more or less accurate. In other words, in the case of doubt, it is preferable to have a false positive, which is later confirmed with a traditional radon assessment, instead of having a false negative that leaves occupants exposed to an increased concentration in an unprotected and incautious scenario. The last operation of this phase is the compilation, analysis, and preparation of the platform, in which, after defining the order of the information layers (base map, geology map and natural gamma radiation map), the radon potential map is prepared. This construction of the map is based on the definition of boundaries between areas with different radon potentials and following the previously defined categories. For example, three radon potential categories can be chosen, such as being low, medium, or high, but an even larger one can be chosen in the more detailed subdivision, such as very low, low, medium, high, and very high. However, this division must be made according to the scale provided by the natural gamma radiation map and always in such a way to allow the radon assessment to lean towards the detection of false positives instead of false negatives. In Phase I, which can be considered the awareness and engagement phase, focusing on the implementation, the access of potential users to the platform and information is prepared, which must be made available in a perspective of pre-diagnosis assessment through a user-friendly interface, which can be accessed by anyone, even for those with shorter digital skills. This platform provides a website with information about radon so that the user can make an informed use, and where they can clarify doubts on the subject. It is an interactive tool that returns the level of geogenic radon potential at a given location to the citizen, including generic mitigation recommendations. In cases of high level of radon potential, the citizen is proposed to carry out the assessment in the building/compartment, presenting the contact details of entities that can carry out this assessment by experts. That is, it will provide the user with the recommendation defined in the radon potential categories, which must point to the need, or not, to technically assess the indoor radon concentration, also through a combination of other factors, namely the existence, or not, of permanent occupancy of the building. At this stage, the user is asked to register when they want to check the radon potential in a certain location. With this information, which is optional, the user will be able to receive project updates. Phase II corresponds to the development and implementation of the potential radon estimation model, with a focus on buildings. At this stage, a radon potential estimation model is made available for a specific region, which is in accordance with the request presented by the user, where sufficient data are available. Based on the results obtained, specific recommendations are presented for the mitigation of radon levels when exceeding the recommended dosage, calculated on the basis of information provided by the user, namely on the type of use of the space, permanence, frequency of this permanence, together with data referring to the building, such as the type of ventilation, and constructive and structural data. In this way, the platform can be used as a tool for the design of remodeling and construction of new buildings.

4. Results and Discussion

The proposed methodology allows the development of user-friendly tools that can be directly used by citizens, and, from a citizen’s scientific perspective, facilitates the communication of the hazards associated with radon exposure, and, at the same time, pushes the citizen towards an increased radon-related literacy by broadening the scientific awareness of the public opinion. The implementation of the proposed methodology allows the design of a pre-diagnosis radon potential model, as depicted in Figure 2, with the three following main features:
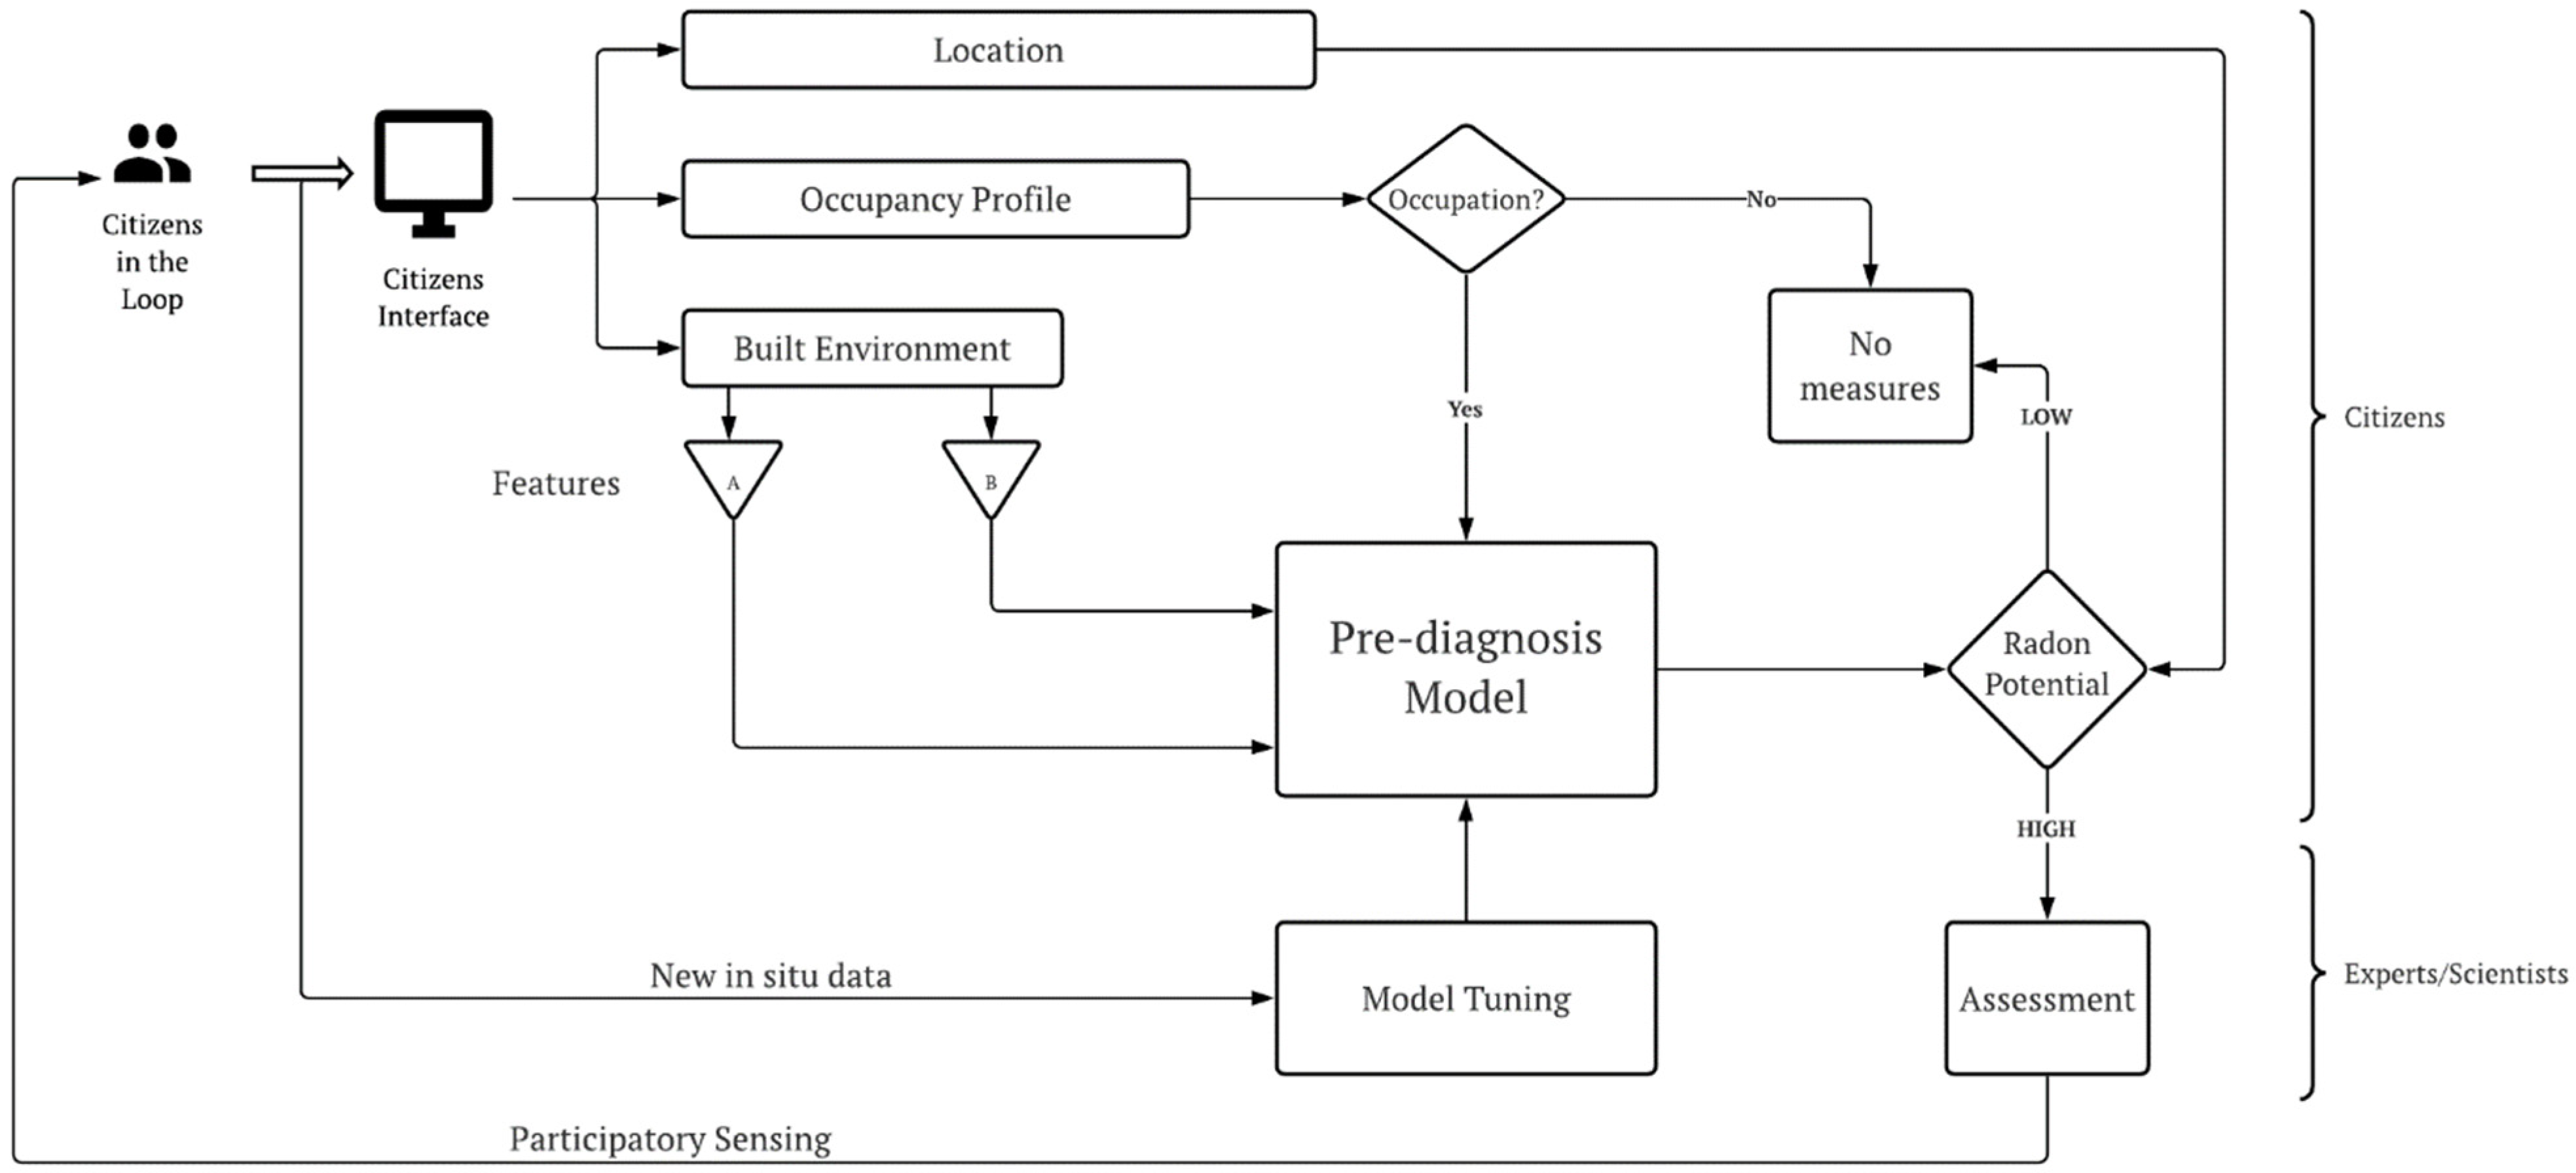
  • Decision-making tool: can be applied in a preliminary stage when projecting new buildings. Additionally, this tool can be helpful to assess the need of carrying out in situ experimental campaigns in existing buildings located in regions with high radon potential, or locations with medium radon potential, but where the combination of other factors can also justify in situ experimental campaigns for on-site radon measurements.
  • Pre-diagnosis assessment tool: by using radon potential maps as a starting point, but also by establishing the analysis of other relevant criteria, such as the indoor occupancy rates. The rate of occupation of indoor spaces is crucial to assess the need to implement remediation measures since these are only considered necessary when human occupancy is considered. The correlation between indoor radon concentration and the time spent indoors (exposure time) will define the daily exposure dose, and can also be easily determined, for example, using the methodology presented by Lopes et al. (2021) [70].
  • Radon literacy tool: by using a WebGIS-based platform designed to provide a prompt preliminary assessment to check the probability of the occurrence of high indoor radon concentrations, justifying, therefore, the adoption of measures, whether preventive or corrective, to maintain radon concentrations within the recommended threshold values.
As shown in the flowchart in Figure 2, users, through a user-friendly platform, are asked to provide throughout a WebGIS-based platform the necessary data so that the pre-diagnosis model can compute the indoor radon occurrence probability (qualitatively, though, for example, the indication of a LOW, MEDIUM or HIGH radon potential), which, together with information of the building construction characteristics and with the human occupancy profile, determines the radon potential level and advises on the procedure to be followed. That is, in the case when radon potential is estimated as LOW, the ICT platform informs the user that no further action needs to be taken, for example, testing in the case of existing buildings, or in the case of a new projected one, it may not be necessary to contemplate additional measures, no more than the recommendations already required by the legislation in force. Conversely, in cases when the user receives information indicating a HIGH potential level, the user is advised to carry out an assessment study to confirm the situation and to allow the adoption of preventive or corrective measures, depending on the stage in which the situation is. In the case in which the user receives information indicating a MEDIUM potential level, the counseling should be based on an assessment that allows for the dissipation of doubts and always towards the identification of false positives, trying to eliminate any probability of the occurrence of false negatives.
Based on the approach depicted in Figure 2, the radon potential evaluation was designed according to the architecture presented in Figure 3. This platform offers a very user-friendly interface that delivers the features previously described. The platform integrates gamma radiation data from the Portuguese National Energy and Geology Laboratory (LNEG) for assessing radon potential based on geographical location (https://geoportal.lneg.pt/mapa/?mapa=CartaRadiometrica, accessed on 20 September 2021). The PostgreSQL database stores historic radon measurements and the corresponding relevant building characteristics. The radon potential classification engine combines these data with the information about the building constructive parameters and occupation schedules provided by the user to estimate the radon potential level. The platform is designed to collect the radon measurements data from the users who follow the recommendation to assess in situ indoor radon concentrations. New in situ measurements and the corresponding building constructive parameters are stored in the database and will be used to tune the classification model.
Figure 4 shows a snapshot of the WebGIS platform built according to the model described in Figure 1, Figure 2 and Figure 3, and which is still under testing with differentiated users. The main dashboard presented in Figure 4a shows the friendly user interface, where users, even if without specialized knowledge on the subject, can search for a specific address, for example of their homes, or by zooming and clicking on a specific location in a map, or even, by entering the geographic coordinates of that location, to obtain information about the radon occurrence potential, as well as about the geological characteristics from that same location. The results regarding the potential for the occurrence of radon are presented in the format shown in Figure 4b, through qualitative information arranged in three levels of colors, respectively, for LOW potential, with the use of the green color; for MEDIUM potential, with the use of the yellow color; and HIGH potential, with the use of the red color. The result is presented as a smaller scale, the administrative-territorial division at a parish level. The maximum value registered at any point of the territory is assigned to the entire parish, thus enhancing false positives to the detriment of false negatives. As next steps in the development of this platform, constructive parameters are included in order to build the radon potential classification engine, such as the type of building materials used, architectural aspects (existence of pavement garret, total number of floors, existence of basements or walls laying directly on the geological massif, types of insulation, among others considered relevant), indoor spaces occupancy rate and the existence of ventilation systems in buildings, as a way to allow an assessment of the potential for the occurrence of indoor radon not attributable to geogenic parameters, and which as the main measure, or immediate action, will present the recommendation to measure the evaluation of the indoor radon concentration by specialists, who can confirm the potential of occurrence, or proceed with its screening.

5. Conclusions

Radon (222Rn) is a polluting gas that can be concentrated indoors affecting indoor air quality (IAQ), causing special concern in low ventilated buildings due to the negative impacts on human health. It is a reported source of ionizing radiation resulting from the radioactive decay of its longer-lived progenitors, i.e., radium, uranium, and thorium, occurring naturally in soils and rocks. In its gas form, radon releases itself from the soil and rocks, which mainly occurs in the outdoor environment, not causing any kind of impact due to its fast dilution into the atmosphere. However, when this release occurs in confined and poorly ventilated indoor environments, this release can result in the accumulation of high concentrations, being recognized by the World Health Organization (WHO) as the second cause of lung cancer, after tobacco smoking. Assessing the indoor radon concentration demands specific know-how involving the implementation of a set of time-consuming tasks that may include a set of sequential stages, which are the following: (1) radon potential assessment; (2) short-term/long-term radon measurement; (3) laboratory data analysis and processing; and (4) technical reporting. Radon-related studies are often limited by the lack of accurate data resulting from extensive indoor radon assessment campaigns, and by the imprecision of geologic data. If there is a straightforward correlation between the prevalence of some types of soil foundation, such as granite and shale soils, for instance, and high indoor radon concentration, the relationship between other types of soils and indoor radon concentration is still an issue that needs further investigation. Given the uncertainty, the use of an expeditious methodology for radon potential assessment (stage 1), by applying the graphical information represented on the natural gamma radiation maps, is crucial to put forward an ICT (Information and Communication Technology) platform that opens up a straightforward approach for assessing indoor radon potential at an early stage, by avoiding time-consuming and costly traditional mapping processes. The implemented ICT platform is designed to operate as a pre-diagnosis evaluation tool that is of great value for supporting decision making towards the transition to stage 2, which typically presents costs due to the need for certified professionals to handle certified instruments for short-term/long-term radon measurement. The ICT platform for radon potential assessment is a WebGIS-based platform to be used by citizens, which adopts ICT and Internet technologies to display and analyze spatially related data, through a multicriteria approach, by including: (a) gamma radiation maps; (b) built environment characteristics; and (c) occupancy profile, and thus helping to determine when the radon assessment process for a specific building should proceed to a short-term/long-term radon measurement (stage 2), or instead, by eliminating the need to perform additional actions since there is reduced risk concerning indoor radon exposure. In addition to being an important tool for indoor radon pre-diagnosis evaluation, the platform allows the implementation of a user-friendly WebGIS-based ICT tool for direct use by citizens, thus facilitating the communication of the hazard associated with radon exposure.

Author Contributions

Conceptualization, L.J.R.N., R.A., A.C., N.L., J.P.S. and S.I.L.; methodology, L.J.R.N., R.A., A.C., N.L., J.P.S. and S.I.L.; validation, L.J.R.N., R.A., A.C., N.L., J.P.S. and S.I.L.; formal analysis, L.J.R.N., R.A., A.C., N.L., J.P.S. and S.I.L.; investigation, L.J.R.N., R.A., A.C., N.L., J.P.S. and S.I.L.; resources, L.J.R.N., R.A., A.C., N.L., J.P.S. and S.I.L.; data curation, L.J.R.N., R.A., A.C., N.L., J.P.S. and S.I.L.; writing—original draft preparation, L.J.R.N., R.A., A.C., N.L., J.P.S. and S.I.L.; writing—review and editing, L.J.R.N., R.A., A.C., N.L., J.P.S. and S.I.L.; visualization, L.J.R.N., R.A., A.C., N.L., J.P.S. and S.I.L.; supervision, L.J.R.N., A.C., N.L., J.P.S. and S.I.L. All authors have read and agreed to the published version of the manuscript.

Funding

This work is a result of the project TECH—Technology, Environment, Creativity and Health, Norte-01-0145-FEDER-000043, supported by North Portugal Regional Operational Program (NORTE 2020), under the PORTUGAL 2020 Partnership Agreement, through the European Regional Development Fund (ERDF). L.J.R.N. was supported by proMetheus, Research Unit on Energy, Materials and Environment for Sustainability—UIDP/05975/2020, funded by national funds through FCT—Fundação para a Ciência e Tecnologia. A.C. co-authored this work within the scope of the project proMetheus—Research Unit on Materials, Energy, and Environment for Sustainability, FCT Ref. UID/05975/2020, financed by national funds through the FCT/MCTES.

Institutional Review Board Statement

Not applicable.

Informed Consent Statement

Not applicable.

Data Availability Statement

The data presented in this study are available on per request to the corresponding author.

Acknowledgments

The authors declare no further acknowledgments.

Conflicts of Interest

The author declares no conflict of interest.

References

  1. De Magalhães Rios, J.L.; Boechat, J.L.; Gioda, A.; dos Santos, C.Y.; de Aquino Neto, F.R.; e Silva, J.R.L. Symptoms prevalence among office workers of a sealed versus a non-sealed building: Associations to indoor air quality. Environ. Int. 2009, 35, 1136–1141. [Google Scholar] [CrossRef] [PubMed]
  2. Gawande, S.; Tiwari, R.R.; Narayanan, P.; Bhadri, A. Indoor air quality and sick building syndrome: Are green buildings better than conventional buildings? Indian J. Occup. Environ. Med. 2020, 24, 30. [Google Scholar] [PubMed]
  3. Barros, P.; Curado, A.; Lopes, S.I. Internet of Things (IoT) Technologies for Managing Indoor Radon Risk Exposure: Applications, Opportunities, and Future Challenges. Appl. Sci. 2021, 11, 11064. [Google Scholar] [CrossRef]
  4. Gomzi, M.; Bobić, J. Sick building syndrome: Do we live and work in unhealthy environment? Period. Biol. 2009, 111, 79–84. [Google Scholar]
  5. Ghaffarianhoseini, A.; AlWaer, H.; Omrany, H.; Ghaffarianhoseini, A.; Alalouch, C.; Clements-Croome, D.; Tookey, J. Sick building syndrome: Are we doing enough? Archit. Sci. Rev. 2018, 61, 99–121. [Google Scholar] [CrossRef] [Green Version]
  6. World Health Organization. Air Quality Guidelines for Europe; WHO Regional Office for Europe: Copenhagen, Denmark, 1987; 426p. [Google Scholar]
  7. World Health Organization. Air Quality Guidelines for Europe; WHO Regional Office for Europe: Copenhagen, Denmark, 2000. [Google Scholar]
  8. World Health Organization. WHO Air Quality Guidelines Global Update 2005: Report on a Working Group Meeting, Bonn, Germany, 18–20 October 2005; World Health Organization Regional Office for Europe: Copenhagen, Denmark, 2005. [Google Scholar]
  9. Heseltine, E.; Rosen, J. WHO Guidelines for Indoor Air Quality: Dampness and Mould; World Health Organization Regional Office for Europe: Copenhagen, Denmark, 2009. [Google Scholar]
  10. World Health Organization. WHO Guidelines for Indoor Air Quality: Selected Pollutants; World Health Organization Regional Office for Europe: Copenhagen, Denmark, 2010. [Google Scholar]
  11. Scheberle, D. Radon and asbestos: A study of agenda setting and causal stories. Policy Stud. J. 1994, 22, 74–86. [Google Scholar] [CrossRef]
  12. Symonds, P.; Rees, D.; Daraktchieva, Z.; McColl, N.; Bradley, J.; Hamilton, I.; Davies, M. Home energy efficiency and radon: An observational study. Indoor Air 2019, 29, 854–864. [Google Scholar] [CrossRef]
  13. Yarmoshenko, I.V.; Onishchenko, A.D.; Malinovsky, G.P.; Vasilyev, A.V.; Nazarov, E.I.; Zhukovsky, M.V. Radon concentration in conventional and new energy efficient multi-storey apartment houses: Results of survey in four Russian cities. Sci. Rep. 2020, 10, 18136. [Google Scholar] [CrossRef]
  14. Zeeb, H.; Shannoun, F.; WHO. WHO Handbook on Indoor Radon: A Public Health Perspective; World Health Organization: Genova, Switzerland, 2009.
  15. Sterling, E.; Sterling, T.; McIntyre, D. New health hazards in sealed buildings. Am. Inst. Archit. J. 1983, 72, 5395351. [Google Scholar]
  16. Jones, A.P. Indoor air quality and health. Atmos. Environ. 1999, 33, 4535–4564. [Google Scholar] [CrossRef]
  17. Jafari, M.J.; Khajevandi, A.A.; Najarkola, S.A.M.; Yekaninejad, M.S.; Pourhoseingholi, M.A.; Omidi, L.; Kalantary, S. Association of sick building syndrome with indoor air parameters. Tanaffos 2015, 14, 55. [Google Scholar] [PubMed]
  18. Wells, E.M.; Berges, M.; Metcalf, M.; Kinsella, A.; Foreman, K.; Dearborn, D.G.; Greenberg, S. Indoor air quality and occupant comfort in homes with deep versus conventional energy efficiency renovations. Build. Environ. 2015, 93, 331–338. [Google Scholar] [CrossRef] [Green Version]
  19. Curado, A.; De Freitas, V. Influence of thermal insulation of facades on the performance of retrofitted social housing buildings in Southern European countries. Sustain. Cities Soc. 2019, 48, 101534. [Google Scholar] [CrossRef]
  20. Ramos, N.M.; Almeida, R.M.; Simões, M.L.; Delgado, J.M.; Pereira, P.F.; Curado, A.; Soares, S.; Fraga, S. Indoor hygrothermal conditions and quality of life in social housing: A comparison between two neighbourhoods. Sustain. Cities Soc. 2018, 38, 80–90. [Google Scholar] [CrossRef]
  21. Ramos, N.M.; Almeida, R.M.; Curado, A.; Pereira, P.F.; Manuel, S.; Maia, J. Airtightness and ventilation in a mild climate country rehabilitated social housing buildings—What users want and what they get. Build. Environ. 2015, 92, 97–110. [Google Scholar] [CrossRef]
  22. Al-Zoughool, M.; Krewski, D. Health effects of radon: A review of the literature. Int. J. Radiat. Biol. 2009, 85, 57–69. [Google Scholar] [CrossRef]
  23. Darby, S.; Hill, D.; Auvinen, A.; Barros-Dios, J.; Baysson, H.; Bochicchio, F.; Deo, H.; Falk, R.; Forastiere, F.; Hakama, M. Radon in homes and risk of lung cancer: Collaborative analysis of individual data from 13 European case-control studies. BMJ 2005, 330, 223. [Google Scholar] [CrossRef] [Green Version]
  24. Gunby, J.; Darby, S.; Miles, J.; Green, B.; Cox, D. Factors affecting indoor radon concentrations in the United Kingdom. Health Phys. 1993, 64, 2–12. [Google Scholar] [CrossRef]
  25. Darby, S.; Hill, D.; Deo, H.; Auvinen, A.; Barros-Dios, J.M.; Baysson, H.; Bochicchio, F.; Falk, R.; Farchi, S.; Figueiras, A. Residential radon and lung cancer—Detailed results of a collaborative analysis of individual data on 7148 persons with lung cancer and 14 208 persons without lung cancer from 13 epidemiologic studies in Europe. Scand. J. Work Environ. Health 2006, 32, 1–84. [Google Scholar]
  26. Alberg, A.J.; Brock, M.V.; Samet, J.M. Epidemiology of lung cancer: Looking to the future. J. Clin. Oncol. 2005, 23, 3175–3185. [Google Scholar] [CrossRef]
  27. Krewski, D.; Lubin, J.H.; Zielinski, J.M.; Alavanja, M.; Catalan, V.S.; William Field, R.; Klotz, J.B.; Létourneau, E.G.; Lynch, C.F.; Wilcox, H.B.; et al. A combined analysis of North American case-control studies of residential radon and lung cancer. J. Toxicol. Environ. Health Part A 2006, 69, 533–597. [Google Scholar] [CrossRef] [Green Version]
  28. Blot, W.J.; Xu, Z.-Y.; Boice, J.D.; Zhao, D.-Z.; Stone, B.J.; Sun, J.; Jing, L.-B.; Fraumeni, J.F. Indoor radon and lung cancer in China. JNCI J. Natl. Cancer Inst. 1990, 82, 1025–1030. [Google Scholar] [CrossRef] [PubMed]
  29. Whiteside, M.; Herndon, J.M. Coal fly ash aerosol: Risk factor for lung cancer. J. Adv. Med. Med. Res. 2018, 25, 1–10. [Google Scholar] [CrossRef] [Green Version]
  30. Darby, S.; Hill, D.; Doll, R. Radon: A likely carcinogen at all exposures. Ann. Oncol. 2001, 12, 1341–1351. [Google Scholar] [CrossRef] [PubMed]
  31. Sundal, A.; Henriksen, H.; Soldal, O.; Strand, T. The influence of geological factors on indoor radon concentrations in Norway. Sci. Total Environ. 2004, 328, 41–53. [Google Scholar] [CrossRef]
  32. Borgoni, R.; De Francesco, D.; De Bartolo, D.; Tzavidis, N. Hierarchical modeling of indoor radon concentration: How much do geology and building factors matter? J. Environ. Radioact. 2014, 138, 227–237. [Google Scholar] [CrossRef]
  33. Macq, H.; Tancoigne, É.; Strasser, B.J. From deliberation to production: Public participation in Science and Technology policies of the European Commission (1998–2019). Minerva 2020, 58, 489–512. [Google Scholar] [CrossRef]
  34. Kenens, J.; Van Oudheusden, M.; Yoshizawa, G.; Van Hoyweghen, I. Science by, with and for citizens: Rethinking ‘citizen science’ after the 2011 Fukushima disaster. Palgrave Commun. 2020, 6, 58. [Google Scholar] [CrossRef] [Green Version]
  35. Suarez Mahou, E.; Fernandez Amigot, J. Results and applications of the Marna project. Segur. Nucl. 1997, 4, 15–22. [Google Scholar]
  36. Poncela, L.Q.; Fernández, P.; Arozamena, J.G.; Sainz, C.; Fernández, J.; Mahou, E.S.; Matarranz, J.M.; Cascón, M. Natural gamma radiation map (MARNA) and indoor radon levels in Spain. Environ. Int. 2004, 29, 1091–1096. [Google Scholar] [CrossRef]
  37. Fernández, C.S.; Poncela, L.Q.; Villar, A.F.; Merino, I.F.; Gutierrez-Villanueva, J.L.; González, S.C.; López, L.Q.; López, J.Q.; Fernández, E.; Tejerina, J.R. Spanish experience on the design of radon surveys based on the use of geogenic information. J. Environ. Radioact. 2017, 166, 390–397. [Google Scholar] [CrossRef] [PubMed] [Green Version]
  38. Sainz-Fernandez, C.; Fernandez-Villar, A.; Fuente-Merino, I.; Gutierrez-Villanueva, J.; Martin-Matarranz, J.; Garcia-Talavera, M.; Casal-Ordas, S.; Quindós-Poncela, L. The Spanish indoor radon mapping strategy. Radiat. Prot. Dosim. 2014, 162, 58–62. [Google Scholar] [CrossRef] [PubMed]
  39. Cecil, L.D.; Green, J.R. Radon-222. Environmental Tracers in Subsurface Hydrology; Springer: Berlin/Heidelberg, Germany, 2000; pp. 175–194. [Google Scholar]
  40. Domingos, F.P.; Sêco, S.L.; Pereira, A.J. Thoron and radon exhalation and emanation from granitic rocks outcropping in the Central Iberian Zone (Portugal). Environ. Earth Sci. 2021, 80, 1–18. [Google Scholar] [CrossRef]
  41. Wilkening, M. Radon in the Environment; Elsevier: Amsterdam, The Netherlands, 1990. [Google Scholar]
  42. Weigel, F. Radon. Chem. Ztg 1978, 102, 287–299. [Google Scholar]
  43. Sêco, S.L.; Domingos, F.P.; Pereira, A.J.; Duarte, L.V. Estimation of the radon production potential in sedimentary rocks: A case study in the Lower and Middle Jurassic of the Lusitanian Basin (Portugal). J. Environ. Radioact. 2020, 220, 106272. [Google Scholar] [CrossRef]
  44. Domingos, F.; Pereira, A. Implications of alteration processes on radon emanation, radon production rate and W-Sn exploration in the Panasqueira ore district. Sci. Total Environ. 2018, 622, 825–840. [Google Scholar] [CrossRef]
  45. Otton, J.K. The Geology of Radon; Government Printing Office: Washington, DC, USA, 1992.
  46. Louro, A.; Peralta, L.; Soares, S.; Pereira, A.; Cunha, G.; Belchior, A.; Ferreira, L.; Monteiro Gil, O.; Louro, H.; Pinto, P. Human exposure to indoor radon: A survey in the region of Guarda, Portugal. Radiat. Prot. Dosim. 2013, 154, 237–244. [Google Scholar] [CrossRef]
  47. Imme, G.; Catalano, R.; Mangano, G.; Morelli, D. Radon exhalation measurements for environmental and geophysics study. Radiat. Phys. Chem. 2014, 95, 349–351. [Google Scholar] [CrossRef]
  48. Silva, A.S.; Dinis, M.d.L.; Pereira, A. Indoor radon levels in thermal spas and the compliance with the European BSS directive: A Portuguese case study. In Occupational and Environmental Safety and Health II; Springer: Berlin/Heidelberg, Germany, 2020; pp. 163–171. [Google Scholar]
  49. George, A. Environmental Radon and Radon Daughters; IAEA: Vienna, Austria, 1980. [Google Scholar]
  50. World Health Organization. Evolution of WHO Air Quality Guidelines: Past, Present and Future; WHO: Genova, Switzerland, 2017. [Google Scholar]
  51. Hewitt, C.; Kelly, M. Environmental radon: A brief review. Environ. Technol. 1990, 11, 387–392. [Google Scholar] [CrossRef]
  52. Casey, J.A.; Ogburn, E.L.; Rasmussen, S.G.; Irving, J.K.; Pollak, J.; Locke, P.A.; Schwartz, B.S. Predictors of indoor radon concentrations in Pennsylvania, 1989–2013. Environ. Health Perspect. 2015, 123, 1130–1137. [Google Scholar] [CrossRef]
  53. Stojanovska, Z.; Januseski, J.; Bossew, P.; Zunic, Z.S.; Tollefsen, T.; Ristova, M. Seasonal indoor radon concentration in FYR of Macedonia. Radiat. Meas. 2011, 46, 602–610. [Google Scholar] [CrossRef]
  54. Alghamdi, A.S.; Aleissa, K.A. Influences on indoor radon concentrations in Riyadh, Saudi Arabia. Radiat. Meas. 2014, 62, 35–40. [Google Scholar] [CrossRef]
  55. Nero, A.V.; Nazaroff, W. Characterising the source of radon indoors. Radiat. Prot. Dosim. 1984, 7, 23–39. [Google Scholar] [CrossRef]
  56. Appleton, J.; Miles, J. A statistical evaluation of the geogenic controls on indoor radon concentrations and radon risk. J. Environ. Radioact. 2010, 101, 799–803. [Google Scholar] [CrossRef]
  57. Neznal, M.; Neznal, M.; Matolin, M.; Barnet, I.; Miksova, J. The New Method for Assessing the Radon Risk of Building Sites; Czech Geological Survey Prague: Prague, Czech Republic, 2004. [Google Scholar]
  58. Bossew, P.; Cinelli, G.; Ciotoli, G.; Crowley, Q.G.; De Cort, M.; Elío Medina, J.; Gruber, V.; Petermann, E.; Tollefsen, T. Development of a geogenic radon hazard index—Concept, history, experiences. Int. J. Environ. Res. Public Health 2020, 17, 4134. [Google Scholar] [CrossRef]
  59. Petermann, E.; Bossew, P. Mapping indoor radon hazard in Germany: The geogenic component. Sci. Total Environ. 2021, 780, 146601. [Google Scholar] [CrossRef]
  60. Lopes, S.I.; Moreira, P.M.; Cruz, A.M.; Martins, P.; Pereira, F.; Curado, A. RnMonitor: A WebGIS-based platform for expedite in situ deployment of IoT edge devices and effective Radon Risk Management. In Proceedings of the 2019 IEEE International Smart Cities Conference (ISC2), Casablanca, Morocco, 14–17 October 2019. [Google Scholar]
  61. Gruber, V.; Baumann, S.; Alber, O.; Laubbichler, C.; Bossew, P.; Petermann, E.; Ciotoli, G.; Pereira, A.; Domingos, F.; Tondeur, F. Comparison of radon mapping methods for the delineation of radon priority areas—An exercise. J. Eur. Radon Assoc. 2021, 2. [Google Scholar] [CrossRef]
  62. Ielsch, G.; Ferry, C.; Tymen, G.; Robe, M. Study of a predictive methodology for quantification and mapping of the radon-222 exhalation rate. J. Environ. Radioact. 2002, 63, 15–33. [Google Scholar] [CrossRef]
  63. Szabó, K.Z.; Jordan, G.; Horváth, Á.; Szabó, C. Mapping the geogenic radon potential: Methodology and spatial analysis for central Hungary. J. Environ. Radioact. 2014, 129, 107–120. [Google Scholar] [CrossRef]
  64. Pasculli, A.; Palermi, S.; Sarra, A.; Piacentini, T.; Miccadei, E. A modelling methodology for the analysis of radon potential based on environmental geology and geographically weighted regression. Environ. Model. Softw. 2014, 54, 165–181. [Google Scholar] [CrossRef]
  65. Sam, A.K.; Ahmed, M.; El Khangi, F.; El Nigumi, Y.; Holm, E. Assessment of terrestrial gamma radiation in Sudan. Radiat. Prot. Dosim. 1997, 71, 141–145. [Google Scholar] [CrossRef]
  66. Saghatchi, F.; Salouti, M.; Eslami, A. Assessment of annual effective dose due to natural gamma radiation in Zanjan (Iran). Radiat. Prot. Dosim. 2008, 132, 346–349. [Google Scholar] [CrossRef] [PubMed]
  67. Alomari, A.H.; Saleh, M.A.; Hashim, S.; Alsayaheen, A. Investigation of natural gamma radiation dose rate (GDR) levels and its relationship with soil type and underlying geological formations in Jordan. J. Afr. Earth Sci. 2019, 155, 32–42. [Google Scholar] [CrossRef]
  68. Quindós, L.; Fernández, P.; Sainz, C.; Fuente, I.; Nicolás, J.; Quindós, L.; Arteche, J. Indoor radon in a Spanish region with different gamma exposure levels. J. Environ. Radioact. 2008, 99, 1544–1547. [Google Scholar] [CrossRef]
  69. Andjelov, M.; Brajnik, D. Map of natural radioactivity and radon emanation in Slovenia. Environ. Int. 1996, 22, 799–804. [Google Scholar] [CrossRef]
  70. Lopes, S.I.; Nunes, L.J.; Curado, A. Designing an Indoor Radon Risk Exposure Indicator (IRREI): An Evaluation Tool for Risk Management and Communication in the IoT Age. Int. J. Environ. Res. Public Health 2021, 18, 7907. [Google Scholar] [CrossRef]
Figure 1. Flowchart of the methodology for radon potential mapping.
Applsci 12 01412 g001
Figure 2. Implementation of a pre-diagnosis tool for indoor radon potential assessment.
Applsci 12 01412 g002
Figure 3. Radon potential evaluation platform designed by using a high-level architecture.
Applsci 12 01412 g003
Figure 4. WebGIS RnHealth platform, which presents (a) the user-friendly interface for entering data on the location (available in Phase I of the project); and (b) the radon potential display interface, with the indication of qualitative information about the radon potential.
Applsci 12 01412 g004
Publisher’s Note: MDPI stays neutral with regard to jurisdictional claims in published maps and institutional affiliations.

