Article

SDA-Vis: A Visualization System for Student Dropout Analysis Based on Counterfactual Exploration

by
Germain Garcia-Zanabria
1,*,
Daniel A. Gutierrez-Pachas
1,
Guillermo Camara-Chavez
1,2,
Jorge Poco
1,3 and
Erick Gomez-Nieto
1
1
Department of Computer Science, Universidad Católica San Pablo, Arequipa 04001, Peru
2
Computer Science Department, Federal University of Ouro Preto, Ouro Preto 35400-000, Brazil
3
School of Applied Mathematics, Getulio Vargas Foundation, Rio de Janeiro 22250-900, Brazil
*
Author to whom correspondence should be addressed.
Appl. Sci. 2022, 12(12), 5785; https://doi.org/10.3390/app12125785
Submission received: 3 May 2022 / Revised: 26 May 2022 / Accepted: 1 June 2022 / Published: 7 June 2022
(This article belongs to the Special Issue Data Science, Statistics and Visualization)

Abstract

:
High and persistent dropout rates represent one of the biggest challenges for improving the efficiency of the educational system, particularly in underdeveloped countries. A range of features influence college dropouts, with some belonging to the educational field and others to non-educational fields. Understanding the interplay of these variables to identify a student as a potential dropout could help decision makers interpret the situation and decide what they should do next to reduce student dropout rates based on corrective actions. This paper presents SDA-Vis, a visualization system that supports counterfactual explanations for student dropout dynamics, considering various academic, social, and economic variables. In contrast to conventional systems, our approach provides information about feature-perturbed versions of a student using counterfactual explanations. SDA-Vis comprises a set of linked views that allow users to identify variables alteration to chance predefined students situations. This involves perturbing the variables of a dropout student to achieve synthetic non-dropout students. SDA-Vis has been developed under the guidance and supervision of domain experts, in line with some analytical objectives. We demonstrate the usefulness of SDA-Vis through case studies run in collaboration with domain experts, using a real data set from a Latin American university. The analysis reveals the effectiveness of SDA-Vis in identifying students at risk of dropping out and proposes corrective actions, even for particular cases that have not been shown to be at risk with the traditional tools that experts use.

1. Introduction

Education is a crucial variable determining the level of inequality in a society, and policymakers usually justify higher education spending as a highly effective tool for reducing income inequality [1]. However, given the low graduation rates, the existence of some phenomena that directly affect the efficiency of the education system is evident. The deficiency of the educational system could be the result of the two phenomena of retention and evasion. Retention is extension beyond the expected duration of the course, while evasion is when the student drops out before the final year of an educational course in which they have enrolled. According to the Organization for Economic Cooperation and Development (OECD), in recent years, European dropout rates were somewhere in the range between 30 % and a half, while in the United States the dropout rate for undergraduate study was 40 % . Among Latin American countries, Brazil’s dropout rates surpassed 54 % , Costa Rica’s 50 % , Colombia’s 40 % , and Peru’s 38 % [2]. This situation worsened with the onset of the COVID-19 pandemic, which also particularly highlighted economic inequality.
According to domain experts, the interruption of studies is a long-standing problem and is “multi-causal and not only economic”, since it is also attributable to family, vocational, and academic demands. Research in this area has commonly focused on identifying who [3] will leave college and when [4,5]. In general, these techniques allow the identification of the association between different patterns and student dropouts. Several studies have considered improving the sensitivity of the predictive model by using different information such as historical academic factors [6,7,8,9], socioeconomic factors [3,10], curricular design [11], scholarships [7], and the residence and origin of the student [10]. However, although these studies could identify dropout patterns, they did not help decision makers decide what they should do next in order to prevent dropouts. In this sense, it is necessary to implement methodologies that allow the effects of different actions on a student or group to be explored. For example, if preventing a university student’s dropping out requires changing, e.g., the GPA on mandatory courses, the model is potentially biased.
In this context, counterfactual explanations provide alternatives for various actions by showing feature-perturbed versions of the same instance [12,13]. The objective of the counterfactual analysis is to answer the question: How does one obtain an alternative or desirable prediction by altering the data just a little bit? [14]. For instance, for a dropout student in the data set and in contrast to a machine learning model based on the real values, counterfactual explanations provide synthetic sample recommendations for what to do to achieve a required goal (preventing student dropout). Broadly speaking, counterfactual explanations attempt to pass a student from the dropout space to the non-dropout space (Figure 1) by changing some of the values of the real feature vector.
Let us illustrate this with an intuitive example with a student dropout application. Imagine a decision maker analyzing a student’s characteristics. Unfortunately, this student is at risk of dropping out of the university. Now, the decision maker would like to know why. Specifically, the user would like to know what should be different for the student, to reduce the risk of dropping out. A possible explanation might be that the student would have been a non-dropout if the student had obtained 8.5 (0–10 scale) as a grade for mandatory courses and had reduced absenteeism (CF1–CF3). In other words, counterfactual explanations provide “what-if” explanations of the model output [13].
Counterfactual explanations are highly popular, as they are intuitive and user-friendly [12,15]. However, an interactive visual interface is necessary for the general public who do not have prior knowledge of machine learning models. In this work, we present SDA-Vis, a visualization system to support counterfactual explanations and student dropout dynamics, considering various academic, social, and economic variables. SDA-Vis comprises a set of linked views that provide information about feature-perturbed versions of a student or group of students, assisting users in the decision-making process by providing guidelines not only for prevention but also for corrective actions.
In summary, the major contributions of this work are:
  • A counterfactual-based analysis for finding recommendations using feature-perturbed feasible alternatives to avoid student dropouts.
  • A visual analytic system named SDA-Vis that supports the interactive exploration of student characteristics and counterfactuals to support the decision-making process in educational institutions.
  • A set of real-world case studies that demonstrate the usefulness and practicality of our approach to reducing student dropout rates.

2. Related Work

Studies on student dropouts are related to different areas. This section organizes previous studies into three major groups, in order to contextualize our approach.

2.1. Student Dropout Analysis

A common approach to analyzing student dropout is determining the importance of features for a particular model. In this vein, a new application of data mining called educational data mining (EDM) is an interdisciplinary research area in the educational field that uses different methods and techniques from machine learning, statistics, data mining, and data analysis to analyze data collected during teaching and learning [16,17,18,19,20,21]. A great deal of research on student dropout using EDM has centered on predicting student dropout using different machine learning models such as random forest [3,6,10], neural networks [3,7], support vector machines [3,6], deep learning [22,23], long short-term memory (LSTM) [24,25], generative adversarial networks (SC-GAN) [26], and logistic regression [3,8,27,28]. Many of these studies are designed to influence policy decisions and provide recommendations for interventions to prevent student dropouts [6,8,28]. For instance, Qiu et al. [28] aimed to help in designing better courses and improving learning effectiveness by answering the following questions. How can students be retained on a course? How can the completion rate of a course be estimated? Moreover, how do we evaluate the learning performance of different students?
Another important goal of these studies is not only to predict whether students will leave the university but also when they will leave [7,10]. Researchers have used machine learning techniques with success, but an area that has been gaining strength is survival analysis [29,30]. In this context, survival analysis is a set of statistical methods for longitudinal data analysis, for identifying students at risk of dropping out [9,31,32,33]. For instance, based on the semi-parametric proportional hazard Cox model, Juajibioy et al. [32] aimed to determine the factors that influence student dropout and to discover how long it takes for a student to drop out of university.
As discussed above, these methods aim to explore, analyze, discuss, and predict student dropouts by computing the importance of the characteristics of the environment (academic, social, and economic). However, do not offer alternatives of variables alteration to chance predefined student situation. In contrast, our approach enables the generation of synthetic instances based on real examples, to obtain the desired output.

2.2. Counterfactual Explanation

Counterfactual explanations aim to find changes to the original values that flip the model’s output. The literature on counterfactual explanations is extensively detailed, according to some surveys [34,35,36,37]. Wachter et al. [12] first proposed the concept of counterfactual explanations, proposing a framework to generate counterfactual explanations based on an optimization problem. In the same vein, Spangher et al. [38] proposed a tool that solves an optimization problem to recover counterfactual explanations that are actionable and globally optimal, with respect to a user-specified cost function.
Some counterfactual explanation methods are used in combination with other methods such as LIME and SHARP [39,40]. Furthermore, many different techniques apply feature perturbation to lead to the desired outcome [41,42,43,44]. Another direction of counterfactual application is counterfactual visual explanation, which is generated to explain the decision of a deep learning system by identifying the region of the image that would need to change to produce a specific output [45].
In addition to generating counterfactual explanations, our approach provides alternatives such as search engines and recommendation systems to reduce student dropouts using visualization. Furthermore, the user could introduce restrictions to find feasible options.

2.3. Visual Analytic

The need for model interpretability is increasingly important in this research. On this topic, many recent studies have been presented in various surveys [46,47,48]. For instance, Yuan et al. [46] give an overview of, and opportunities for, visual learning models. On the other hand, Hohman et al. [48] present a survey of the role of visual analytics in deep learning research, focusing on the five “w” questions and on “how” questions (why, who, what, how, when, and where).
There are various visual analytic tools that assist machine learning interpretation, e.g., VIS4ML [49], DiscriLens [50], The What-If Tool [51], explAIner [52], ExplainExplore [53], Manifold [54], and RuleMatrix [55].
In the visual counterfactual explanations context, Gomez et al. [56] proposed ViCE, a visual tool to generate counterfactual explanations to contextualize and evaluate model decisions. Cheng et al. [14] proposed DECE, which supports the exploratory analysis of model decisions by combining the strengths of counterfactual explanations at the instance and subgroup levels.
Although many works use visualization to answer the "w" questions, there are no tools that represent the what-if scenario in the context of student dropouts. The most closely related tool is PerformanceVis [57], which uses visualization to analyze student performance on a course.

3. Student Counterfactual Analysis

The core of SDA-Vis is the generation of non-dropout synthetic scenarios using counterfactuals with minor changes in the students’ features. Thus, this section details the analytical goals, the student attributes, and the mathematical and computational foundations used in this work.

3.1. Analytical Objectives

After regular meetings with professionals in different areas involved in university welfare, it became clear that they needed mechanisms to integrate different data types into the dropout analysis. In particular, during these meetings, they manifested their primary interest in a system to assist them in automatically recognizing features to guide their preventive/corrective actions. In contrast, the tool currently used gives only descriptive information, making it hard to analyze specific groups.
The analytical objectives of our interactive system are aimed at aiding professionals to better understand the reasons why students drop out, while simulating possible scenarios by setting different values for actionable features. In summary, the main objectives are as follows:
AO1—Individual and student group characteristics analysis. Identify how the characteristics of an instance or cluster affect the risk of dropout. Identify the values distribution of variables for dropout students.
AO2—Identify a group of students by indicators of similarity. Automatic dropout detection should provide an indicator or a set of indicators of how feasibly a dropout can be prevented. Such indicators must support decision-making and generate new specialized preventive actions over specific groups of students with similar features.
AO3—Find different scenarios that lead to dropout reduction in a set of students. Accessing an analysis of different scenarios of an individual or group of instances is a fundamental need. The user could compute and examine the various options and choose the best alternative, based on individual needs.
AO4—Customize and evaluate scenarios with feasibility and factibility metrics. Despite the existence of multiple scenarios, the scenarios do not always match the user’s needs. In many cases, users should guide the exploration based on their preferences/expertise, to evaluate the scenarios based on quantitative metrics (feasibility and simplicity).
AO5—Retrieving instances based on specific queries. It could be helpful for university policymakers to know how chance in a scenario could impact a group of students. Thus, it is crucial to group the students based on criteria guided by the analyst’s requirements.
AO6—Compare how the scenarios could impact different groups. Education authorities sometimes are interested in knowing whether the action for a particular group of students could have the same effect on another group. It is necessary to evaluate the impact of a specific intervention in a group to obtain scenarios leading to dropout reduction.

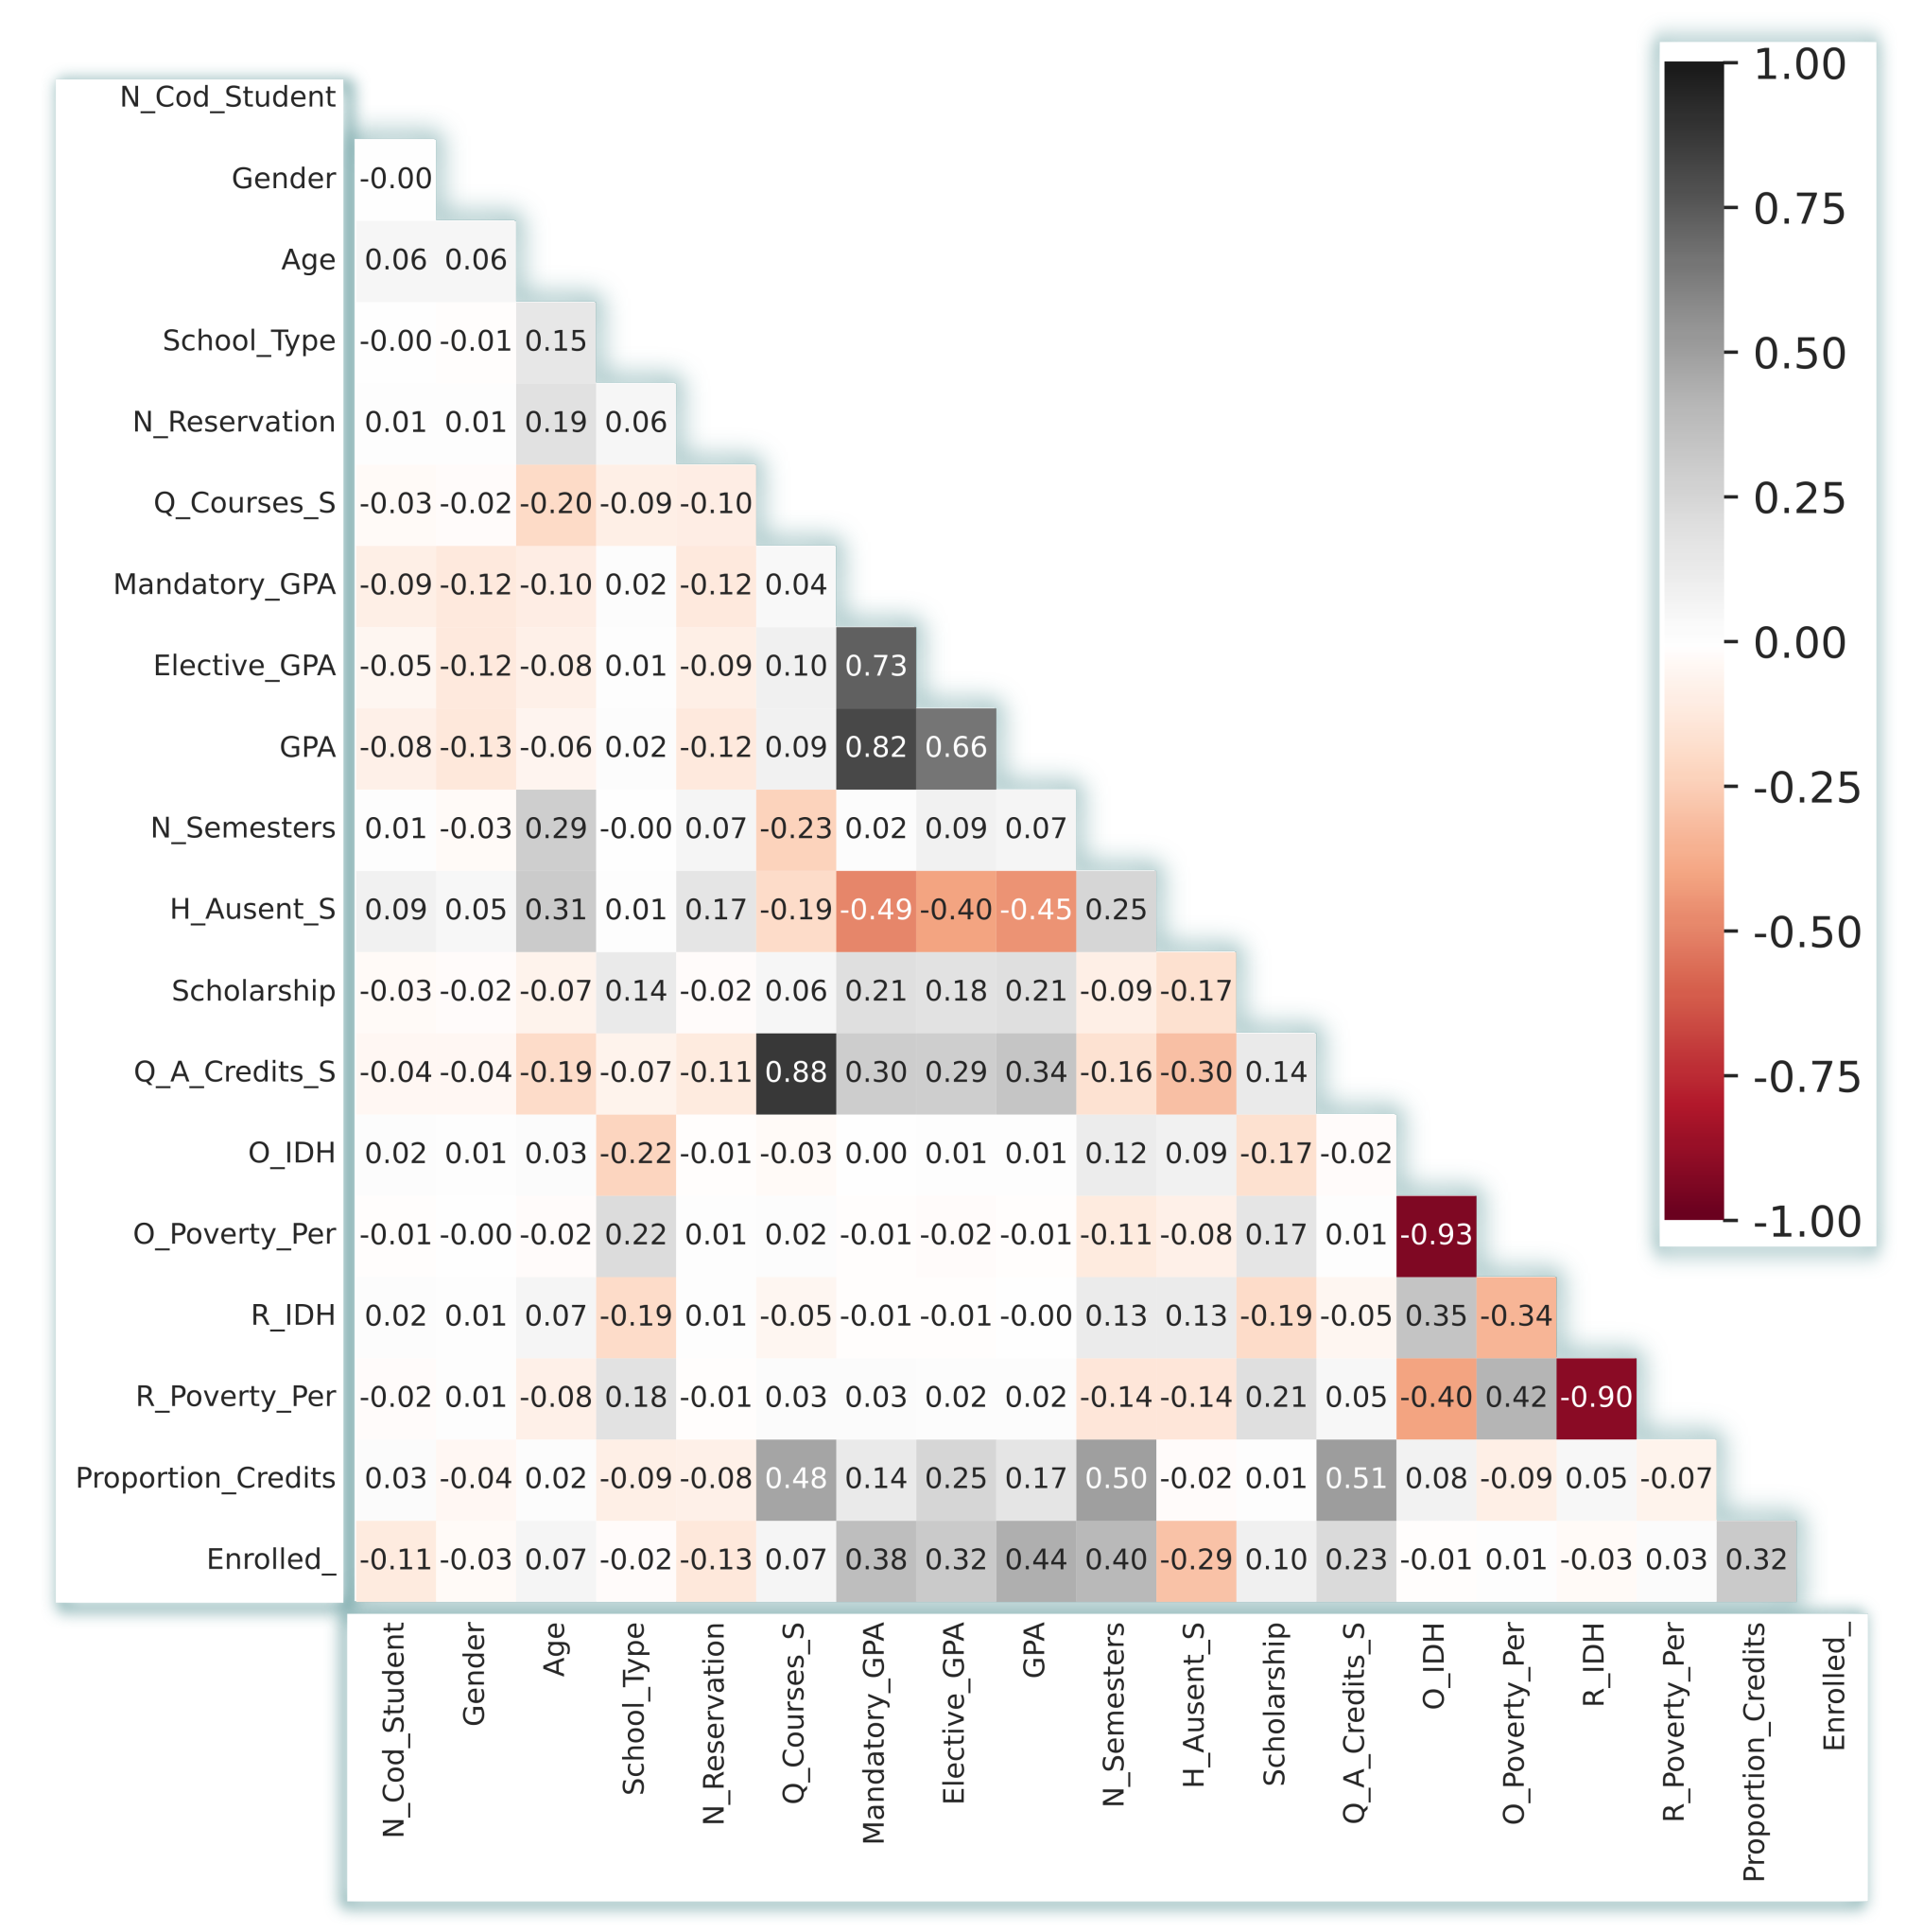
3.2. Data Set Description

We worked with features from over 11,000 students in 12 different Latin American university undergraduate programs, from the first semester of 1999 (1999-I) to the second semester of 2020 (2020-II). The data set was obtained by collaborating with the university welfare and IT departments. Experts in the IT department were also responsible for anonymizing the students’ information. Thus, we did not have access to the student’s name, identity card number, or any sensitive information related to student identification.
Before further detailing the mathematical and computational fundamentals, we first present the data set. The data set contained information on a student’s performance, such as grades, attendance, and results, together with demographic features such as residence and origin HDI (Human Development Index). We also gathered social information such as gender, scholarship, and marital status. Table 1 summarizes all these attributes. Moreover, Figure 2 shows the correlation matrix, from which it can be seen that there are strong negative correlations between the IDH and Poverty_Per variables, while there are strong positive correlations between Q_Courses_S and Q_A_Credits_S. The independent variable (Enrolled) has a poor correlation with demographic and socioeconomic variables such as Gender, Marital_S, O_IDH, R_IDH, and Poverty_Per variables. In contrast, the academic variables (GPA and Q_A_Credits_S) and time retention variable (N_Semesters) show a moderate correlation.

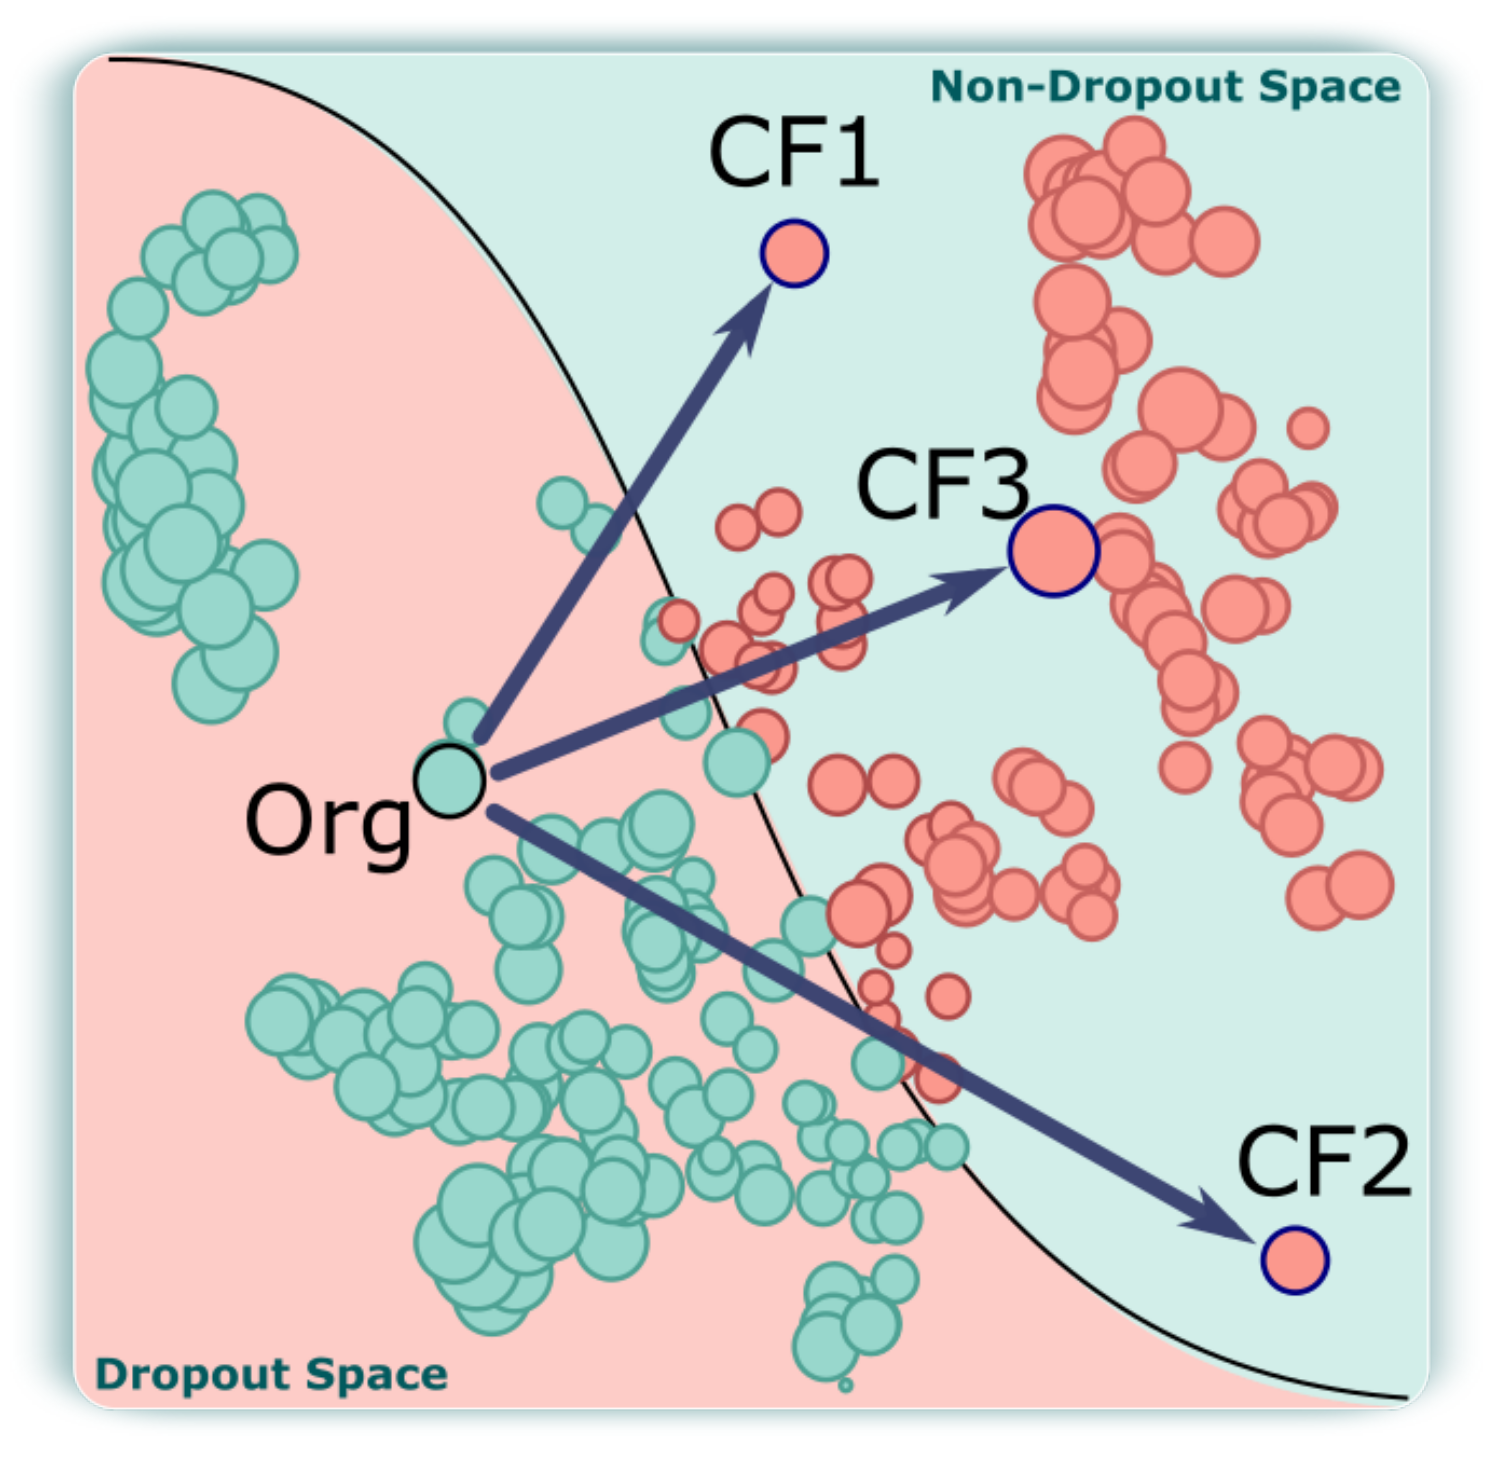
3.3. Counterfactual Explanation

A counterfactual explanation describes a causal situation in the “what-if” form. Broadly speaking, counterfactuals allow us to take action to cause a certain outcome. The action is an alteration in the features of the model to bring about the desired target response.
Let us consider a learning model f ( θ , x ) < τ , where f ( · ) is the decision function, θ is the parameter vector, x is the sample, and τ is the decision threshold. A counterfactual consists of a synthetic sample x = x + a based on the action a that achieves the outcome y ; thus, f ( θ , x ) τ . Since there are various ways to achieve the desired outcome, there can be multiple counterfactuals. These counterfactuals should balance the sparsity, diversity, and proximity. Sparsity is related to the number of features that need to be changed, diversity is the width of the range of the generated counterfactuals, and proximity relates to the similarity between the counterfactuals and the original instance.
The basic form of counterfactual explanation was proposed by Wachter et al. [12] as an optimization problem that minimized the distance between the counterfactual x and the original vector x:
a r g m i n x d i s t ( x , x ) subject to f ( x ) = y
Converting to a differentiable, unconstrained form:
a r g m i n x m a x λ λ ( f ( x ) y ) 2 + d i s t ( x , x )
The first term encourages the model’s output of the counterfactual to be close to the desired output. The second term forces the counterfactual to be relative to the original vector.
Although diversity increases the chance that at least one example will be actionable, balancing this with the proximity (feasibility) is essential due to the large features. In this work, we are concerned about diversity and closeness, and therefore we rely on DiCE (Diverse Counterfactual Explanation) [13], which is a variant of the form proposed by Wachter et al. [12].
DiCE balances the objective function incorporating terms that define Proximity and Diversity via Determinants Point Processes (or simply, DPP-Diversity). Proximity is calculated as i = 1 k dist ( x i , x ) k , where dist ( u , v ) is a distance function between the n-dimensional vectors u and v. On the other hand DPP-Diversity is the determinant of the kernel matrix, given the counterfactuals ( DPP - Diversity = det ( K ) ). The components of the matrix K, denoted by K i , j , are computed in terms of the distance function by K i , j = 1 + dist ( x i , x j ) 1 . Finally, DiCE proposes an optimization model that consists of determining k counterfactuals { x 1 , x 2 , , x k } that minimize the objective function:
i = 1 k ( f ( x i ) y i ) 2 k λ 1 · Proximity λ 2 · DPP - Diversity ,
where λ 1 and λ 2 are parameters associated with Proximity and DPP-Diversity, respectively. In our context, because of the computational cost and also considering experts’ recommendations, we calculated five counterfactuals for each student ( k = 5 ). DiCE guarantees that the synthetic elements of the counterfactuals are balanced between Proximity and DPP-Diversity.
To compute counterfactual antecedents, we relied on the DiCE technique. In addition to the positive aspects detailed previously, DiCE is a robust technique capable of finding multiple counterfactuals for any classifier. Moreover, the number and various other user preferences can be satisfied by the counterfactuals generated by DiCE. These features influenced our choice, since the user can introduce some data preferences to the counterfactual model. For instance, the user could limit the direction of variable values to increasing or decreasing values, to obtain the desired classification. Another important parameter of DiCE is the machine learning technique used to guide the student classification. For this purpose, we evaluated three methods with different accuracies: a neural network (84%), random forest (90%), and logistic regression (93%). Hence, we used logistic regression as a parameter of DiCE to find all the counterfactuals.

4. SDA-Vis: Visual Design and Overview

SDA-Vis is a specific counterfactual system that helps users analyze student dropouts based on explanations. This system allows users to identify the causes of dropouts and generate synthetic non-dropout options that could help to mitigate any factors that might create a dropout risk in a student.
Aiming to address the analytical objectives described in Section 3.1, we built SDA-Vis by combining some dedicated views on exploring student dropout patterns based on counterfactuals. Table 2 details the relations between the set of views (rows) and the analytical objectives (columns). These visual resources allow the analyst to filter and visualize the features of students and the dropout counterfactuals. In addition, SDA-Vis relies on interactive functionalities that allow significant insights to be extracted during the exploration process. The system’s resources, functionalities, and interaction overview were demonstrated in the video accompanying this manuscript as Supplementary Materials.
Figure 3 shows the SDA-Vis system and its components. The main resources are: Applsci 12 05785 i001 
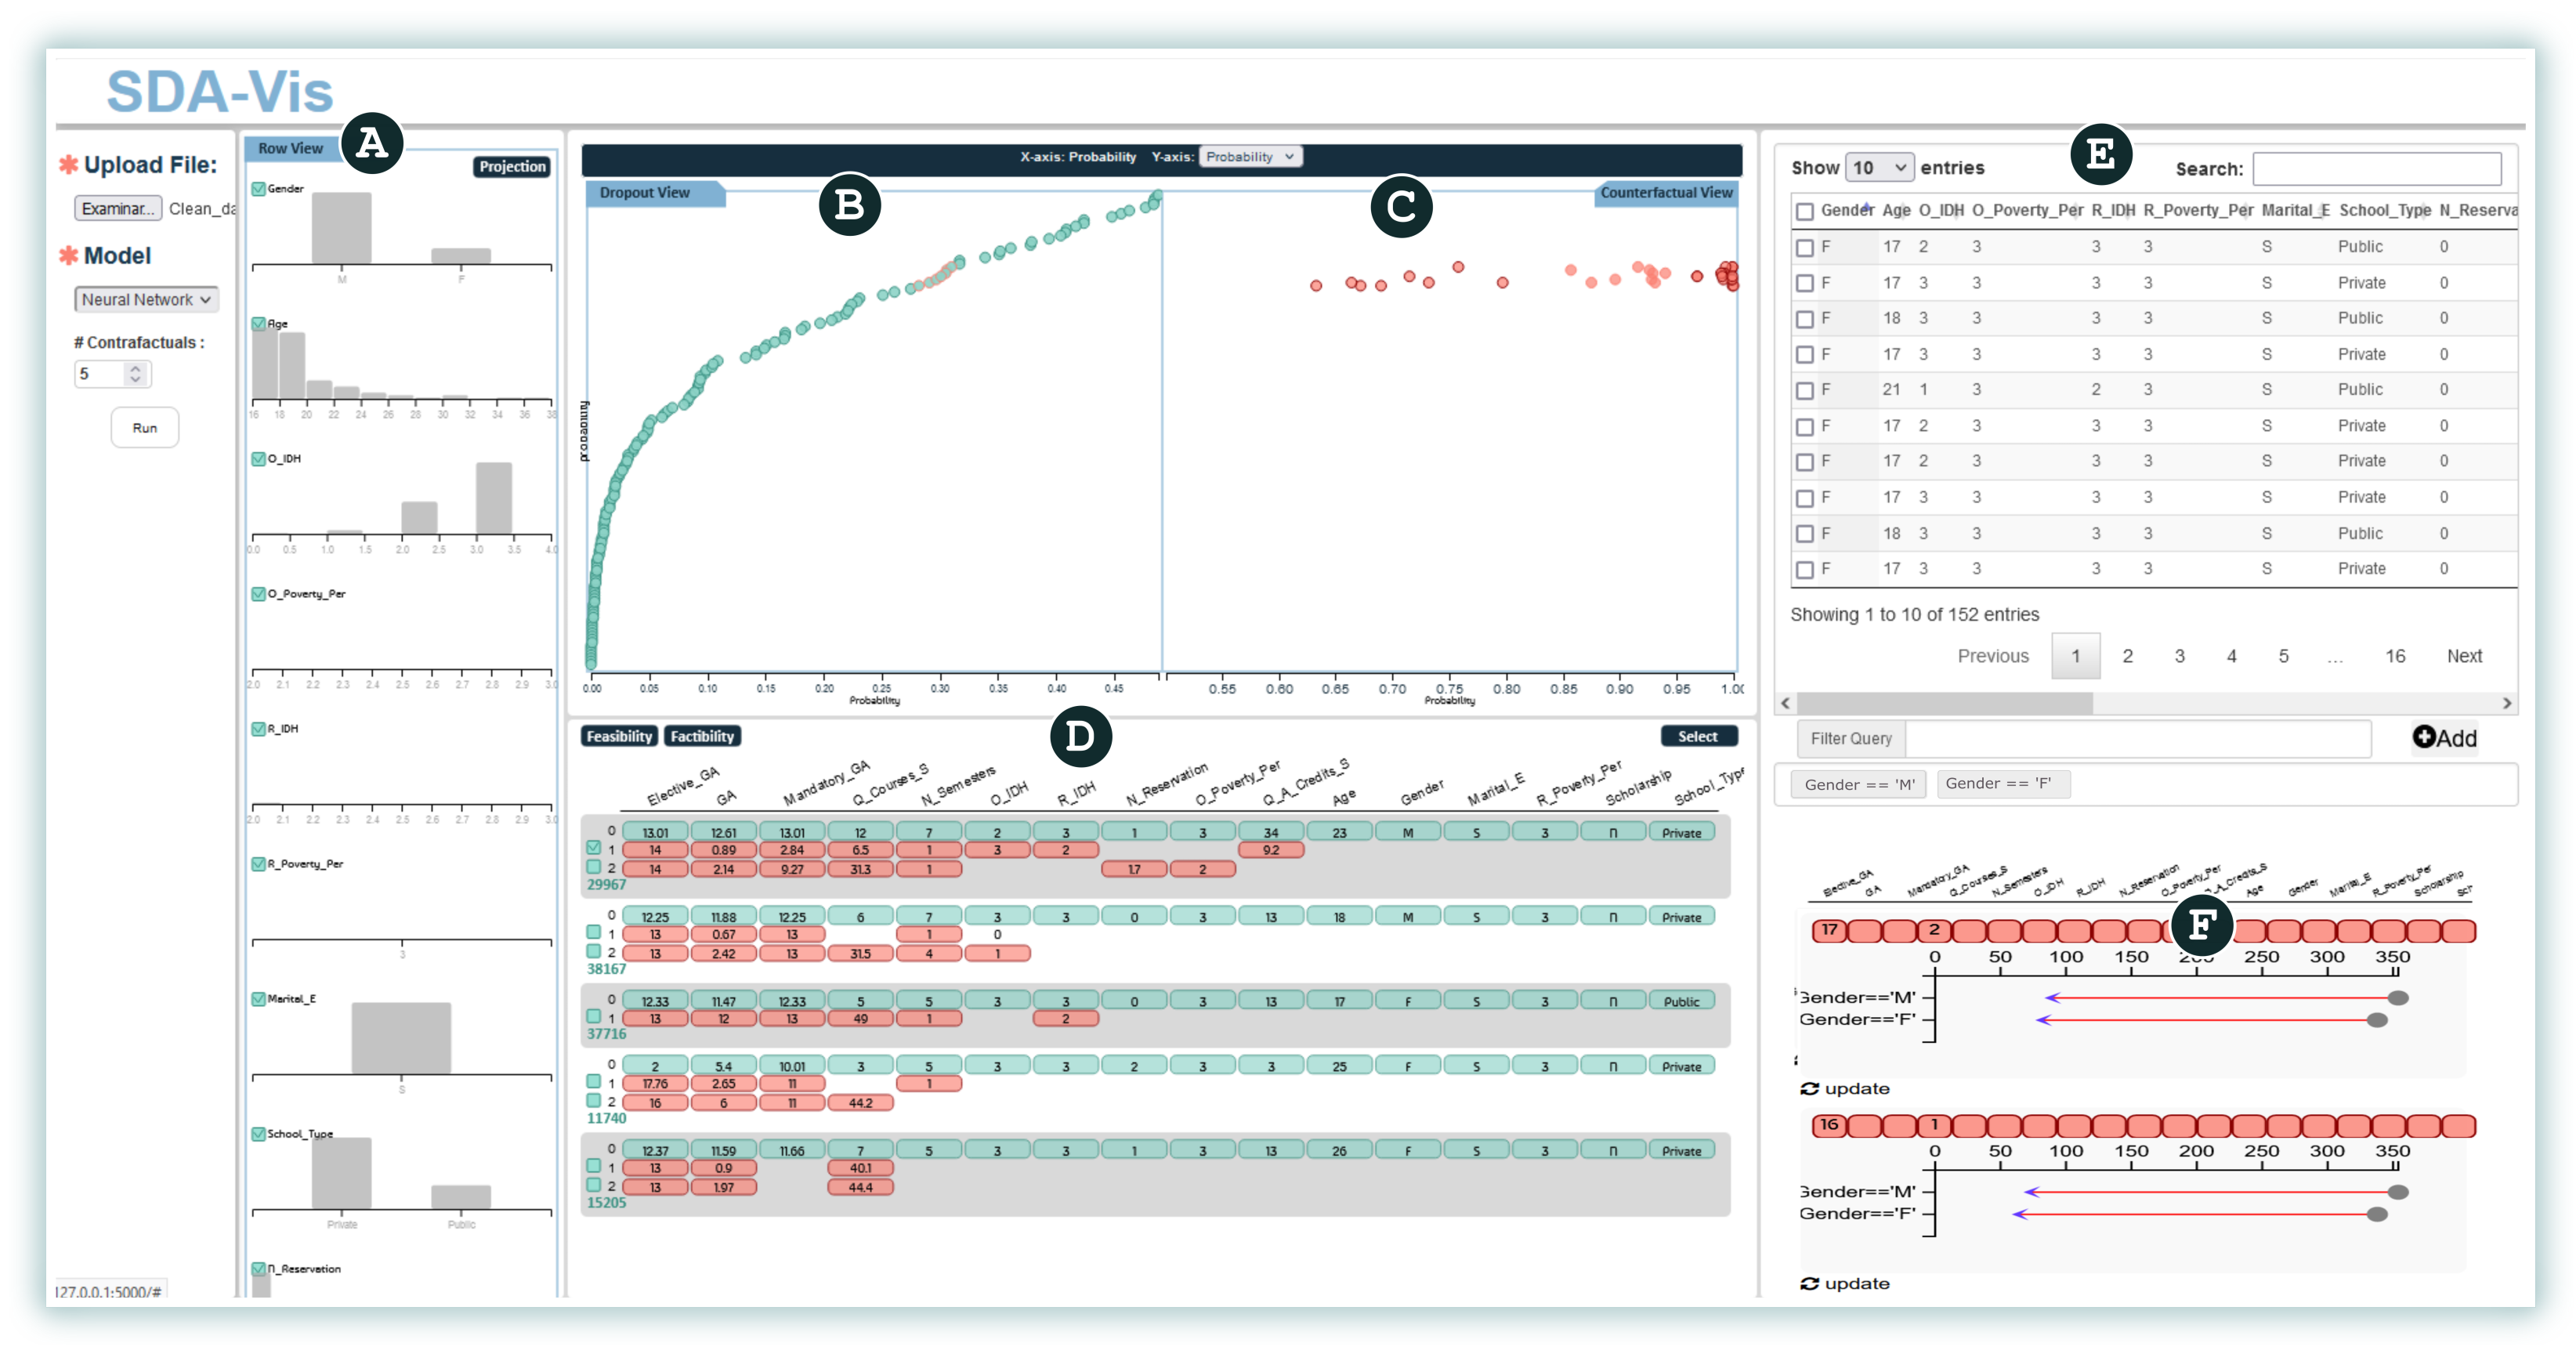
histograms to represent the distribution of students’ characteristics, Applsci 12 05785 i002 
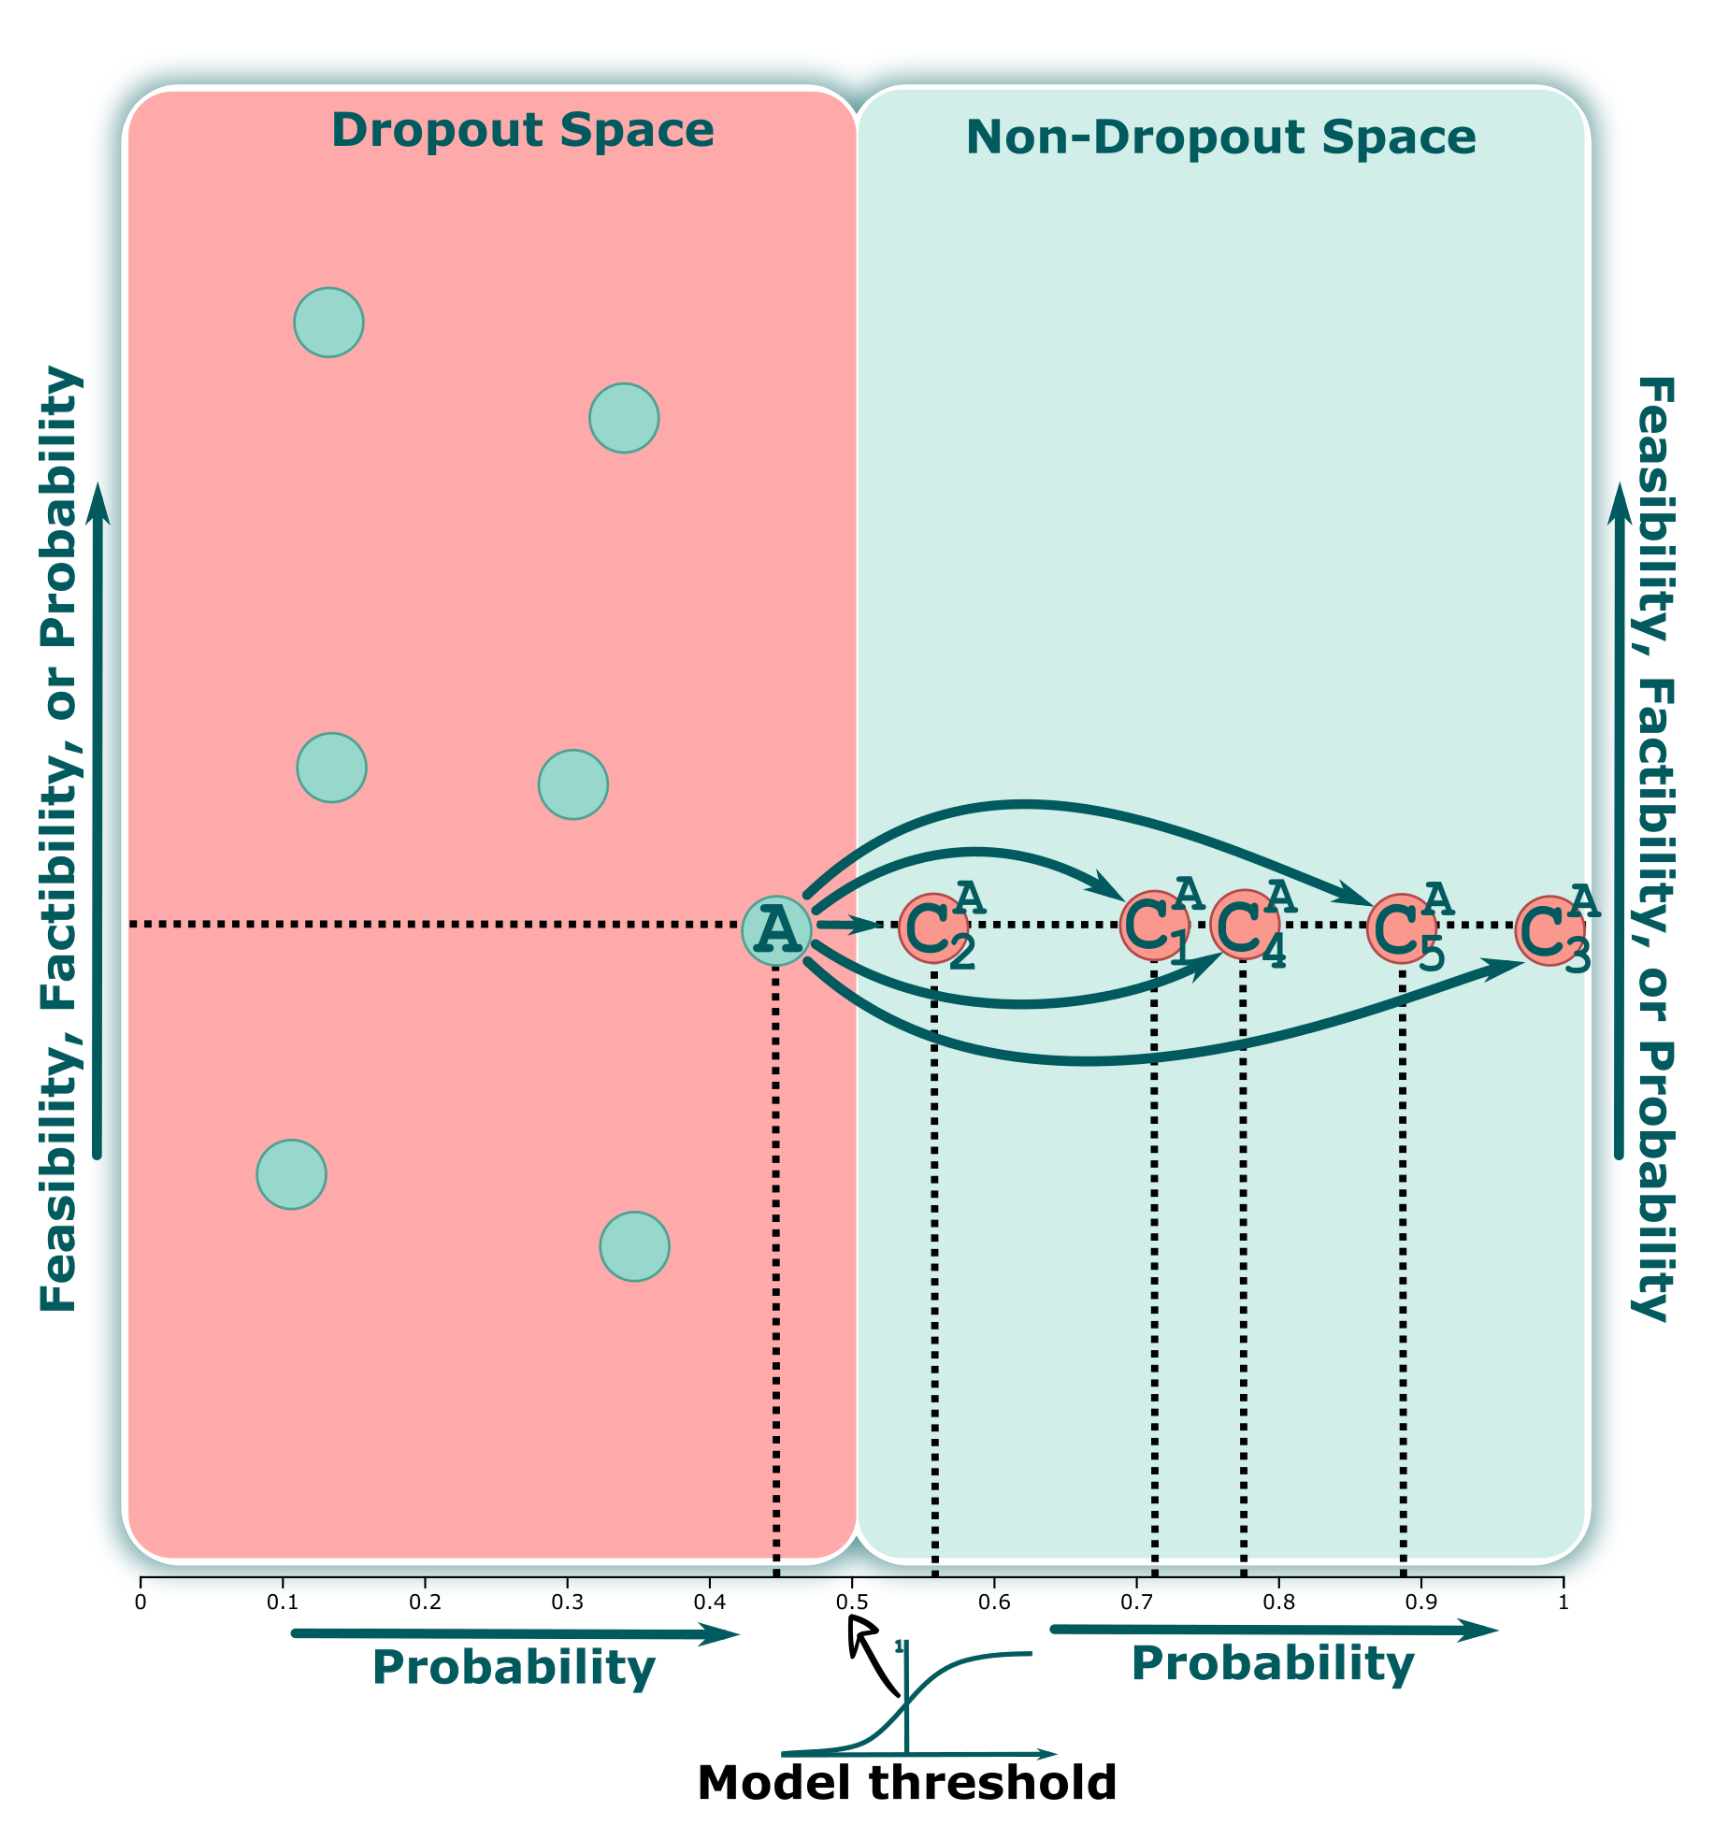
a projection to represent the probabilities for students based on the model threshold, Applsci 12 05785 i003 a projection to represent the counterfactuals and their probabilities, Applsci 12 05785 i004 counterfactual exploration to represent the synthetic values, Applsci 12 05785 i005 a table showing all real dropout students’ values, and Applsci 12 05785 i006 a visualization of the impact of some counterfactuals on a certain group of students.
Feature Distribution Bars view. Our first component, depicted in Figure 3 Applsci 12 05785 i001, summarizes the distribution of values for each feature from the predicted dropout students (AO1). Additionally, this view enables the analyst to select a subset of features to limit its use as the input for the remaining exploration process.
Dropout Analysis dual view. Exploring potential dropout students’ information to support decision-making is not a trivial task. Various patterns can be revealed by analyzing one student at a time, but also by analyzing groups. A major challenge is suggesting feasible solutions that enable educational institutions to support decision-making processes and reduce dropout rates. To fulfill a requirement, we propose a dual-view component to guide our analysis, described as follows:
+
Student Projection (SP) view. Once the features have been selected from the first view, potential dropout students are mapped into a 2D visual space, considering these variables. This view aims to explore the students’ information based on certain metrics. It is placed in the inner left region of our interface, as shown in Figure 3 Applsci 12 05785 i002. Additionally, this view enables the analyst to find a specific student or group of students by using different metrics on the y-axis or to select a subset by drawing different shapes in the design space. Analogously to traditional classification models, we can consider this space the “dropout region”, where all students are at risk of dropping out (AO2).
+
Counterfactual Projection (CP) view. One primary requirement for our work is to seek and propose different ways to avoid student dropouts. Therefore, we compute a set of counterfactuals for each student containing information on which attributes and values of one or more students should be changed in order to reduce their probabilities of becoming dropout students (AO3). Once a group of interest is selected in the SP view, our CP view displays all of the counterfactuals associated with this selection, as shown in Figure 3 Applsci 12 05785 i003. Furthermore, the analyst can freely choose a set of counterfactuals to inspect using the view described in the following subsection.
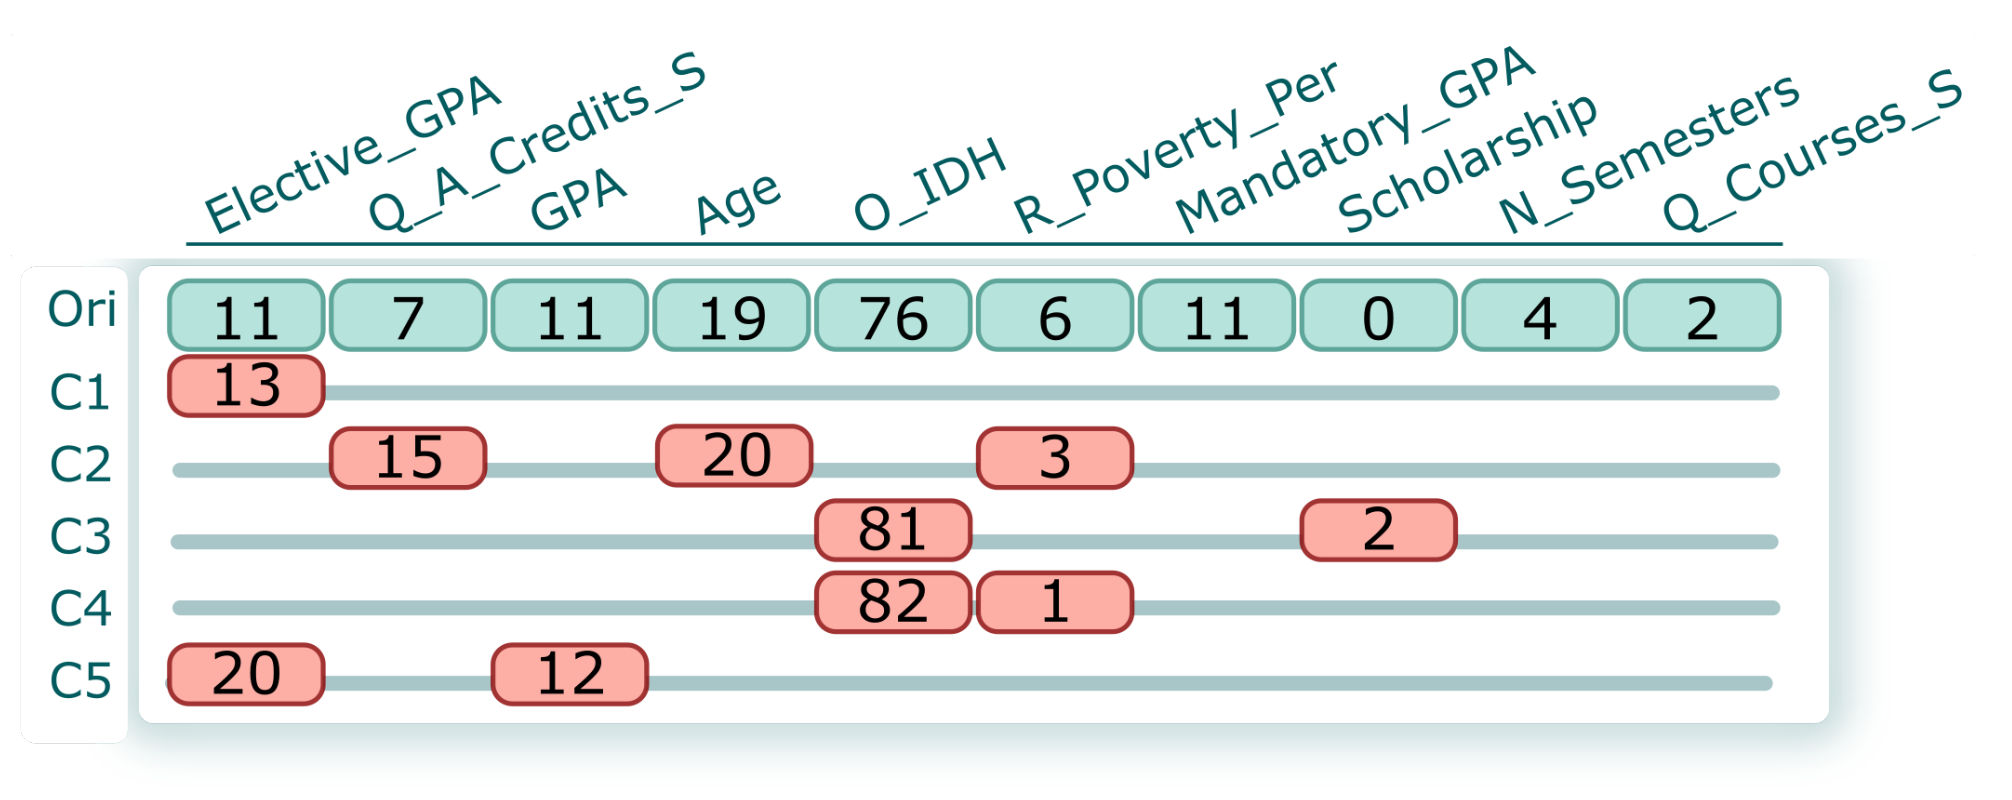
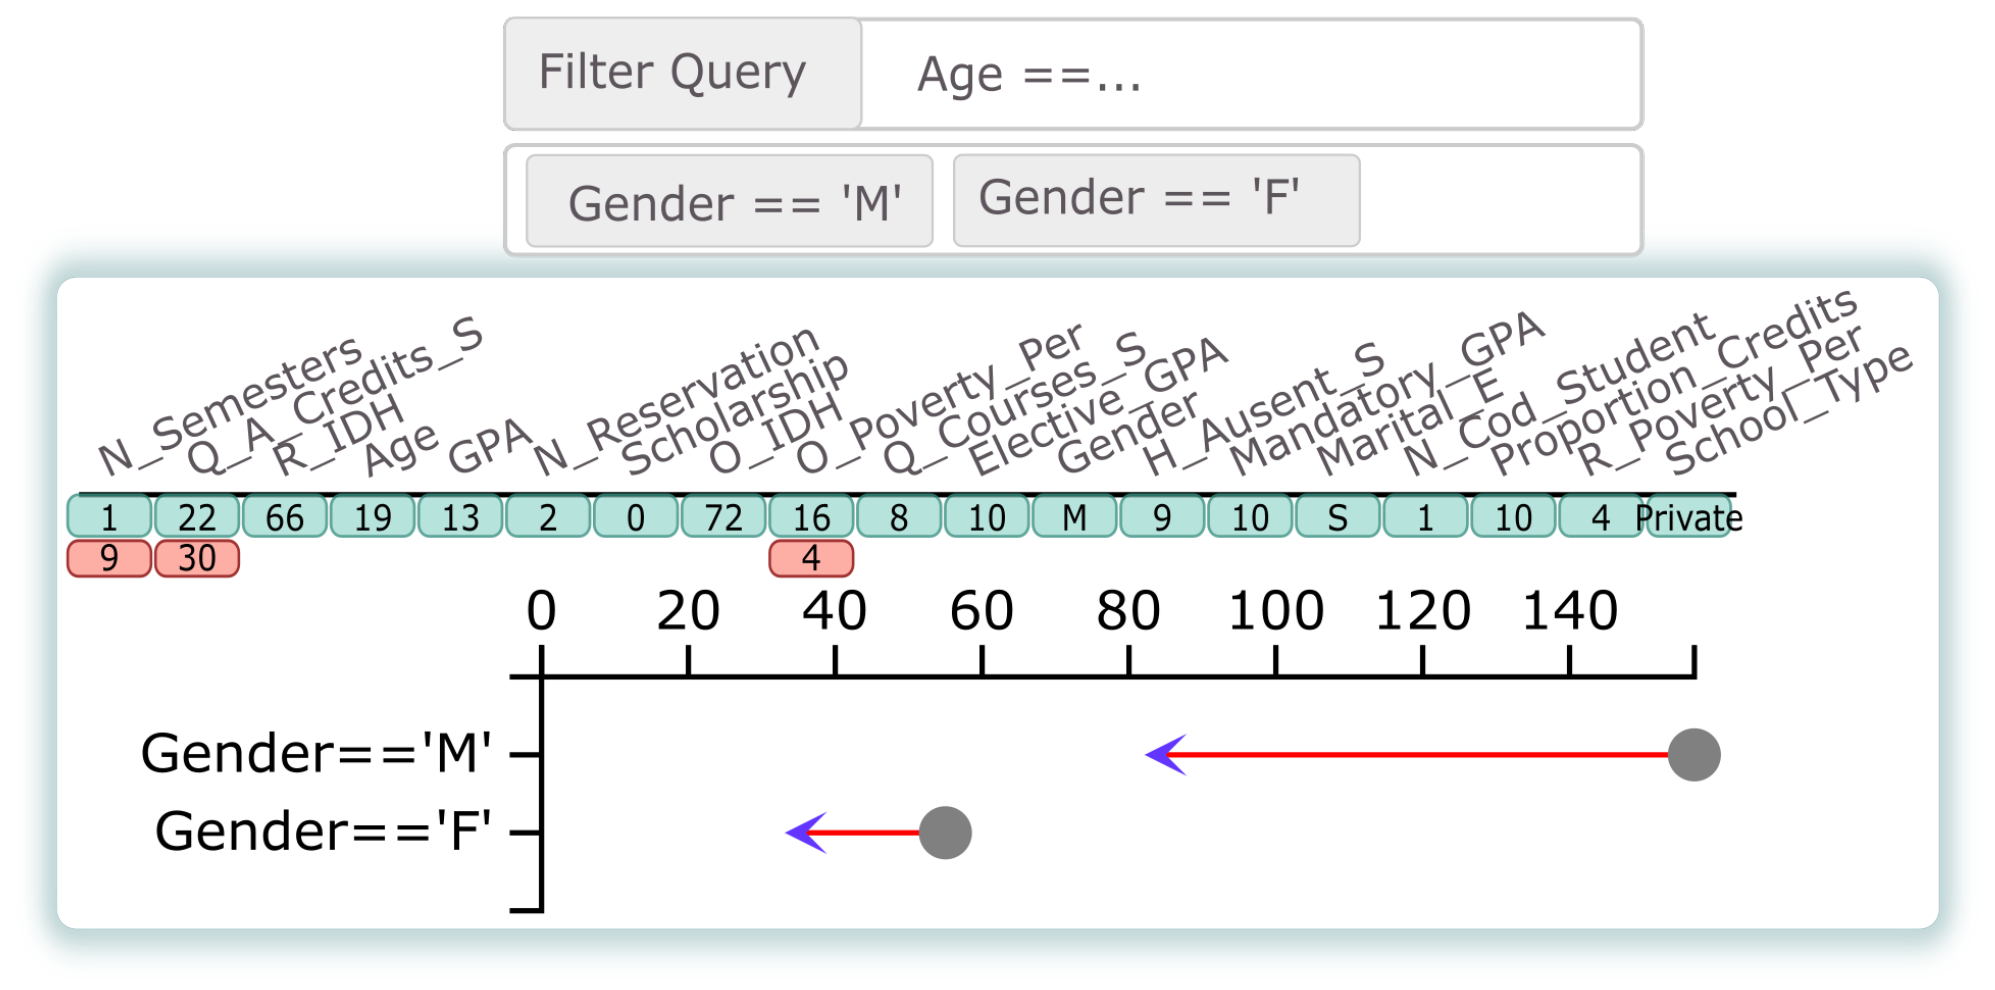
Both views may be considered complementary in this analysis. Additionally, we provide three different ways to map the data onto the design space. The first approach uses the probability that a student will be classified as a dropout. Figure 4 illustrates how this approach maps the possibilities. The left region represents the SP view, and the right is the CP view. They are divided by a line that represents the decision boundary (classification model threshold). For our purposes, we set this boundary by default at 0.5 and use the corresponding probability value for each student—resulting from the classification model employed—to assign a corresponding value on the horizontal axis. As can be seen, the SP view ranges from 0 to 0.49 (dropout students), and the CP view ranges from 0.5 to 1 (non-dropout students). For the vertical axis, the analyst can choose one of three different metrics, i.e., Feasibility (Fe), Factibility (Fa), and Probability (Pr), calculated as follows:
F e ( x ) = d ( x , x ) ,
F a ( x ) = m i n _ d ( x , Z ) ,
P r ( x ) = P r o b [ y = 1 ] = 1 1 + e y ,
where d is the Euclidean distance, m i n _ d is the minimal distance between a counterfactual ( x ) and original set of instances (Z), and P r o b is the probability. Feasibility indicates the Euclidean distance between the counterfactual and the original instance it is associated with. Factibility refers to the distance between the counterfactual and the nearest non-dropout student in the original space. Probability is defined by the model as the non-dropout probability membership of the student. For instance, we display a student labeled as “A” in the SP view (Figure 4) and their corresponding C 1 A to C 5 A counterfactuals in the CP view. Our second approach makes use of the y-axis scale of the SP view, while the x-axis is defined by the probability. We use this to offer the analyst a similarity-based data map based on different metrics and outliers, and multiple patterns. The analyst can alternate between different metrics on the y-axis by clicking on the combo-box buttons located at the top of each view. For instance, Figure 3 Applsci 12 05785 i002, Applsci 12 05785 i003 employ the probability on both axes.
Counterfactual Exploration view. Once a targeted subset of counterfactuals has been identified, it is necessary to explore in detail how these are composed. Our system implements a widget to understand clearly what the counterfactuals are saying. This view, depicted in Figure 3 Applsci 12 05785 i004, relies on a matrix representation comprising a set of blocks, with each block corresponding to a student and their counterfactuals. Figure 5 shows an example of a block. The first row (light-green background) displays the original values for each attribute. At the same time, the line (C1–C5) represents the computed counterfactual of a student. Note that we have included the value and highlighted (red background) the specific characteristic that the counterfactuals suggest modifying. For instance, the counterfactual C1 suggests supporting the student to improve the grade for Elective_GPA (GPA from elective courses) from 11 to 13 (0–20 scale). In contrast, C4 suggests that socioeconomic variables play an important role in avoiding dropout for a student. Therefore, C4 suggests increasing O_IDH (origin IDH) from 76% to 81% and reducing R_Poverty_Per (residence poverty percentage) from 6% to 1%. The students and their counterfactuals could be re-sorted based on previously calculated quantitative metrics (feasibility and factibility). This organization helps analysts select specific counterfactuals for further analysis and investigation (AO4).
Table view. This view, depicted in Figure 3 Applsci 12 05785 i005, shows the real values of the students. Each row corresponds to the students’ feature values. It is possible to filter interactively using the header of each column (using ascending and descending sorting). Furthermore, suppose the analyst needs to filter a group of students based on some conditions. In this case, it can be achieved by using a Filter query based on the DataFrame structure from Python’s pandas library (AO5).
Impact view. This view gives an overview of the impact of a counterfactual on a group of students (Figure 3 Applsci 12 05785 i006). Once the analysts have determined the group of students they want to analyze, it is possible to select some counterfactuals in the Counterfactual Exploration view and measure how these changes could influence each group. For this purpose, for a group of students, we change the values based on the counterfactual’s suggestion, and using the pre-trained model we compute how many of the students are no longer dropouts (AO6). For instance, in Figure 6, for two groups (female and male), the same counterfactual has a different impact. The gray dot shows the number of dropouts from that group, and the arrowhead represents the number of dropouts from that group after implementation of a counterfactual suggestion.

4.1. Visual Exploration Workflow

In this section, we showcase the cyclic workflow of SDA-Vis. Users first upload the data set, then the students’ features and distributions are used to guide the analysis. For this purpose, users employ the Feature Distribution Bars view Applsci 12 05785 i001. Once the users are familiar with the attributes, it is necessary for the analysis of potential dropout students to be mapped onto the SP view Applsci 12 05785 i002. Users could select a different set of students based on the indicators (e.g., probability, factibility, and feasibility). Once a group of interest is identified in the SP view, our CP view Applsci 12 05785 i003 displays all the counterfactuals associated with the previous selection. Users can freely choose a set of counterfactuals to inspect. For counterfactual inspection, the next step is to use the Counterfactual Exploration view Applsci 12 05785 i004, which shows the original values for each attribute. At the same time, the computed counterfactuals show only the values that need to be modified. The students and their counterfactuals could be re-sorted based on feasibility and factibility, to help users select specific counterfactuals for further analysis and investigation. Finally, the users could measure how the changes suggested by a selected counterfactual could influence some students using the Impact view Applsci 12 05785 i006, which shows the extent to which it could be possible to reduce the number of dropouts. For this purpose, it is necessary to select subsets of students for which the users can measure the impact. To choose the subsets, the users could use Table view Applsci 12 05785 i005, applying some filters.
If the resulting analysis does not meet the users’ needs, the users could select other counterfactuals from the Counterfactual Exploration view or start again from the Dropout Analysis dual view ( Applsci 12 05785 i002, and Applsci 12 05785 i003) to consider a new group of students/counterfactuals and obtain a further analysis.

4.2. Implementation Details

The implementation of the SDA-Vis system was based on the Flask web framework, with the back end running on Python and the front end on JavaScript. The data were preprocessed due to the computational cost of counterfactual computation. For computing the counterfactuals, we used the DiCE technique [13], with the implementation available on the framework at github.com/microsoft/DiCE (accessed on 31 May 2022). To compute the classification probability, we used different machine learning models (random forest, logistic regression, and decision tree) from the scikit-learn Python library [58]. The data cleaning and filtering were performed using the pandas and NumPy Python libraries. Finally, all visualization resources were developed based on the D3.js (d3js.org (accessed on 31 May 2022)) JavaScript library.

5. Case Studies

This section presents two case studies involving a real data set of university students’ characteristics, to assess SDA-Vis’s performance. The case studies were contrasted and validated by domain experts to show the usefulness of our approach.

5.1. Analyzing Counterfactuals on a Specific Group of Students

In this case study, an assistant in the welfare office wanted to find patterns and alternatives to avoid dropouts in some students. To improve the readability, we will name this assistant Expert_1. He has analyzed students before using different software, but not with a machine-learning-based system. The task is to explore some counterfactuals and how they could help in our scenario. Specifically, Expert_1 aims to use counterfactual explanations to address the following questions. (i) What are the main characteristics that should be improved to avoid dropping out of students? (ii) What role does the analyst’s expertise play?
To accomplish this analysis, Expert_1 used SDA-Vis’s visual components to select students from one of the most populous programs, Industrial Engineering. Industrial Engineering had about 2000 students, of which about 800 were classified as dropouts, and therefore SDA-Vis generated 4000 counterfactuals (5 for each student). Figure 7 Applsci 12 05785 i007 
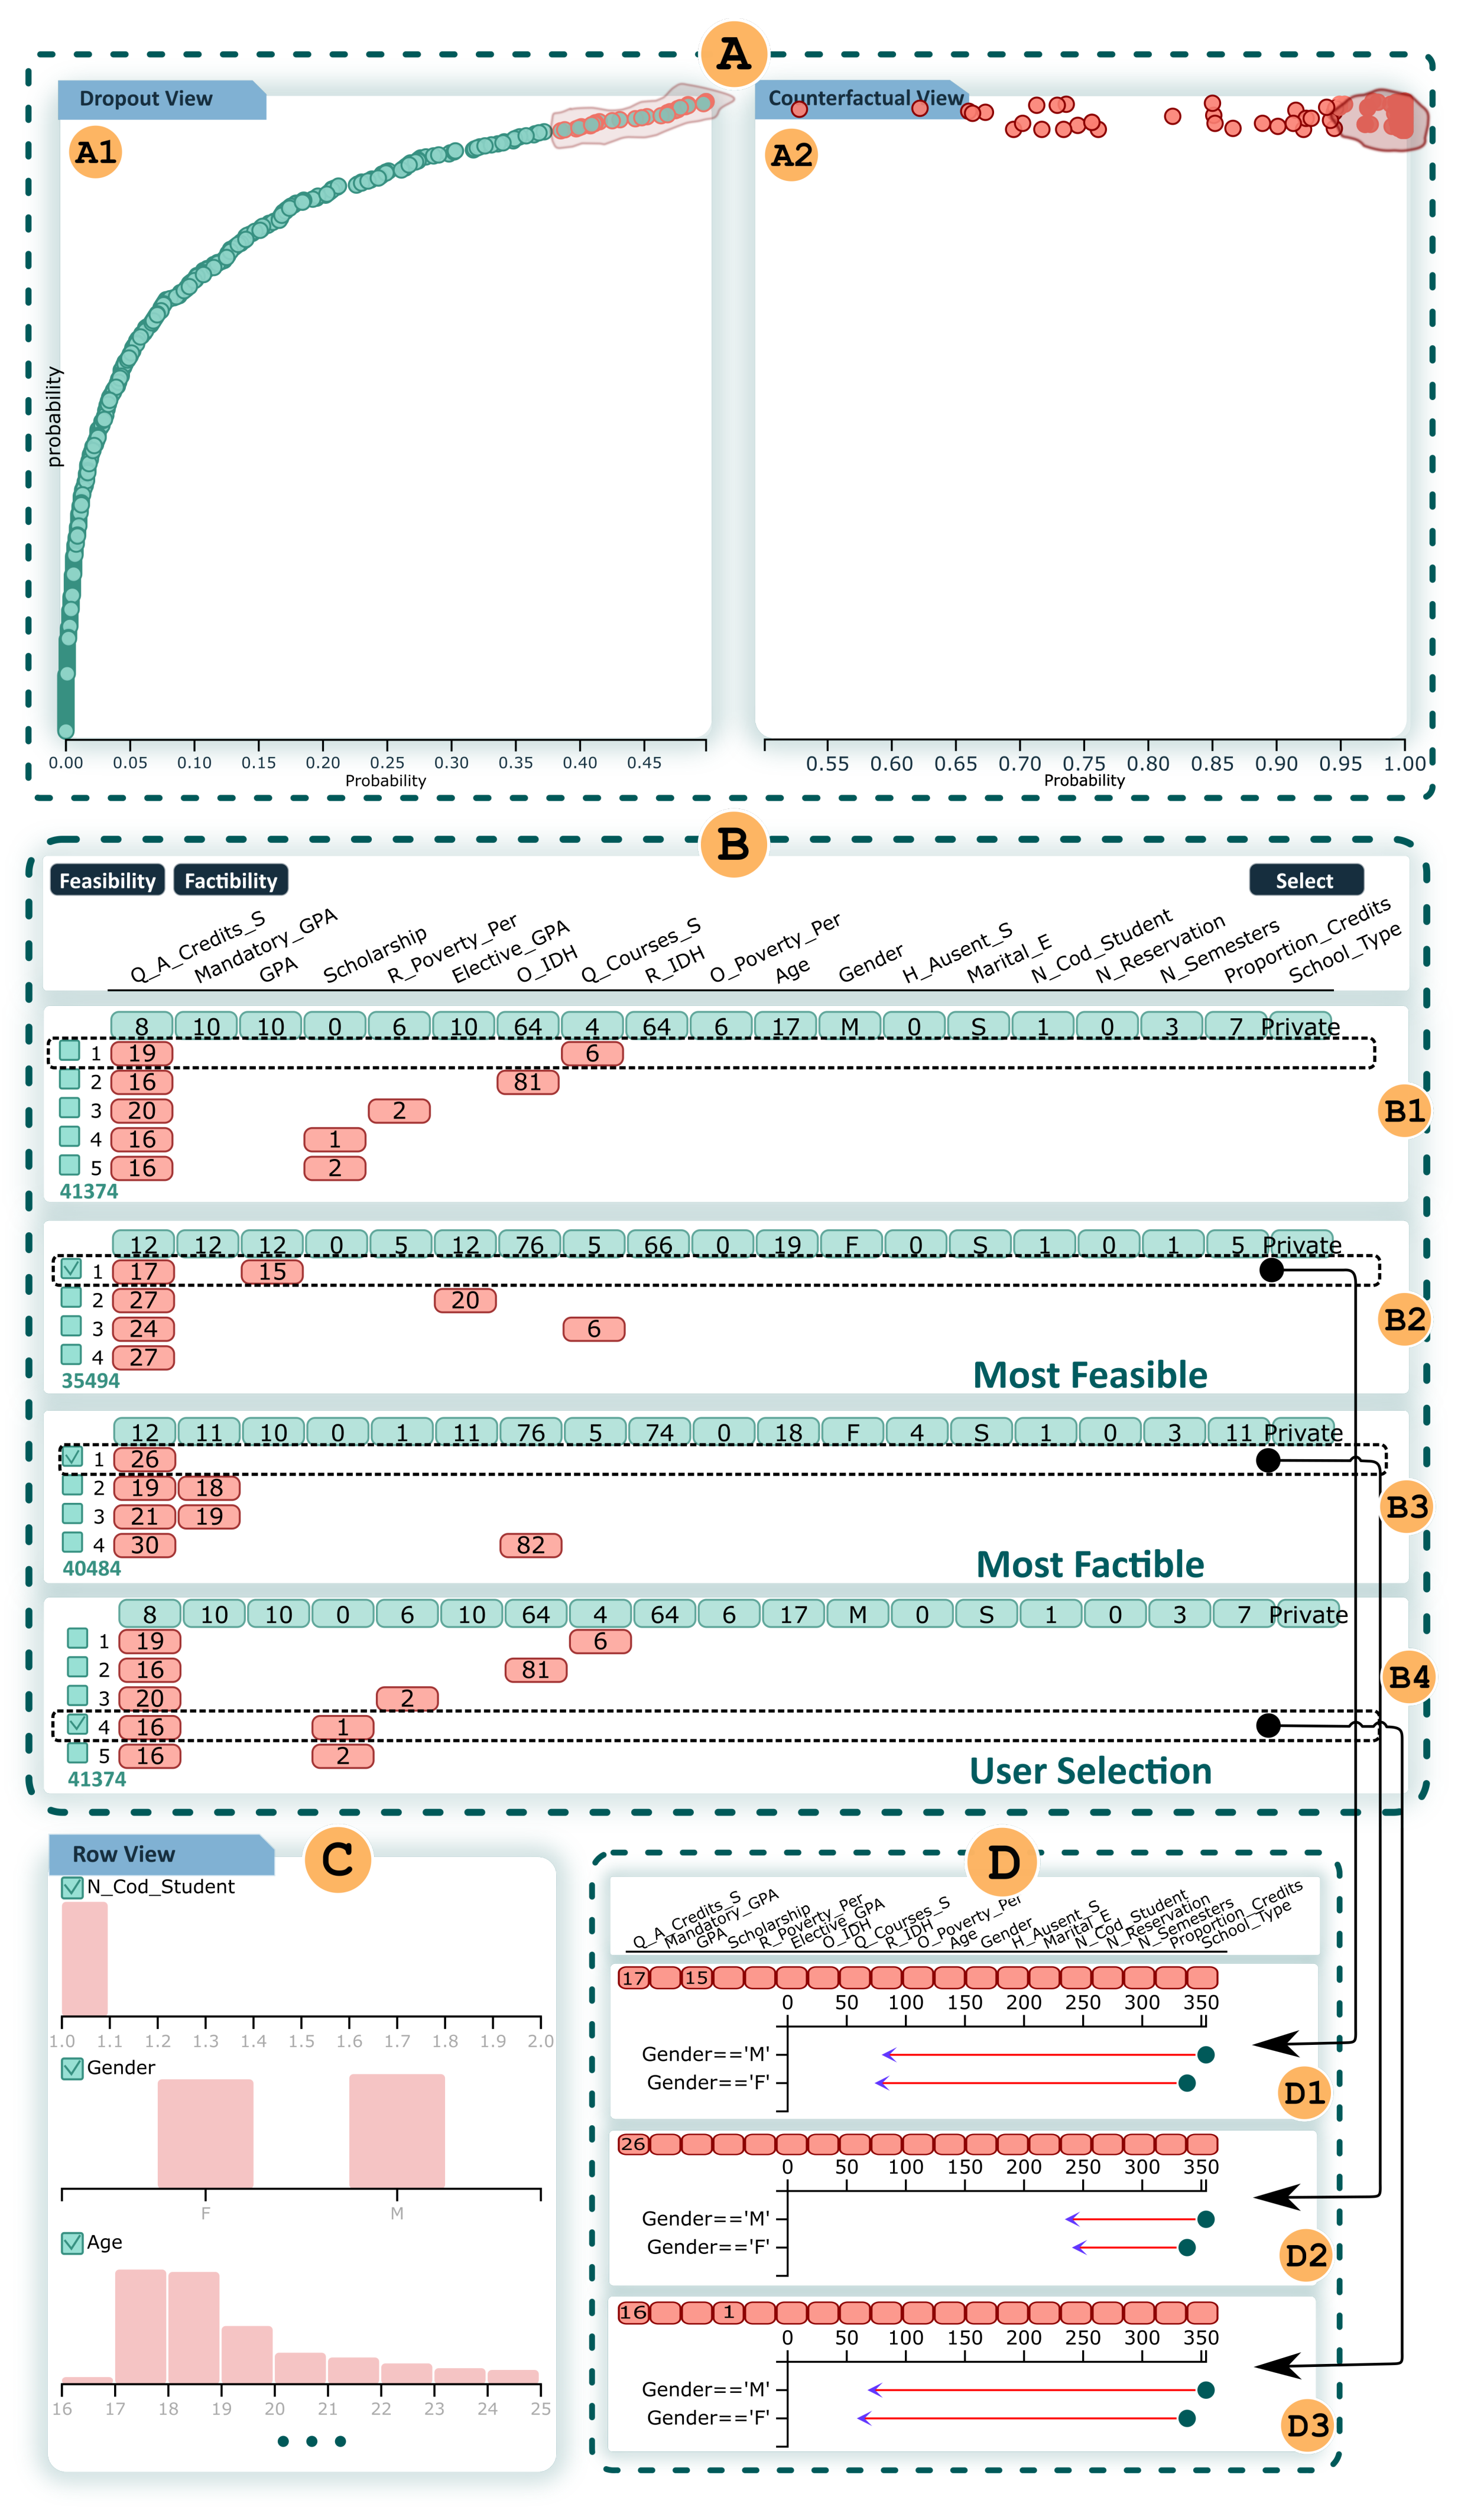
shows the Dropout Analysis dual view of the students and the counterfactuals involved in the analysis. Based on the default presentation of these views (Student Projection view and Counterfactual Projection view), Expert_1 redefined his analysis. He wanted to analyze the students near the threshold line (high probability) and to determine which variables should be improved to prevent dropouts. Using lasso selection, Expert_1 selected students with the highest probability of becoming non-dropouts (highlighted in Applsci 12 05785 i008), expecting that they would need fewer changes in their original values to become non-dropouts. This selection consisted of 30 students, all predicted as dropouts. Figure 7 Applsci 12 05785 i009 shows around 150 counterfactuals (5 for each student). However, Expert_1 noted that the counterfactuals are also sorted by their probabilities, and therefore his analysis focused on certain groups based on their probabilities. Analyzing the counterfactuals, Counterfactual Exploration view (Figure 7 Applsci 12 05785 i010) showed that the most relevant variables were linked to Q_A_Credits_S ( 96 % ), Mandatory_GPA ( 20 % ), GPA ( 14 % ), Scholarship ( 14 % ), R_Poverty_Per ( 10 % ), Elective_GPA ( 9 % ), O_HDI ( 9 % ), Q_Courses_S ( 7 % ), and so on. For instance, the first alternative for the first student (dashed line in Applsci 12 05785 i011) was to increase the number of approved credits per semester (from 8 to 19) and the quantity of lectures in one semester (from 4 to 6). In the same way, it is possible to analyze all the counterfactuals. However, analyzing each student’s counterfactuals individually is a tedious task, and using some organization based on metrics is a better alternative.
By simply clicking on the Feasible button, it is possible to re-sort the students and their counterfactuals based on their feasibility. Figure 7 Applsci 12 05785 i012 shows the student with the most feasible alternative, suggesting a change in Q_A_Credits_S from 12 to 17 and in GPA from 12 to 15. In the same vein, it is possible to consider counterfactuals based on Factibility, as shown in Applsci 12 05785 i013.
These alternatives made sense to Expert_1, but he wanted to take it one step further; he wanted to analyze how these counterfactuals could affect specific groups. Industrial Engineering is one of the few gender-balanced engineering programs, as can be seen in Applsci 12 05785 i014, and therefore Expert_1 was interested in selecting male and female groups. Expert_1 used the Table view, using the pandas queries (Gender = = “M” and Gender = = “F”). In these impact analyses, Expert_1 considered the most feasible and factible counterfactuals. He also selected one counterfactual based on his own expertise ( Applsci 12 05785 i019). The Impact view ( Applsci 12 05785 i015) shows the impact of each selected counterfactual. As shown in Table 3, the most feasible counterfactual ( Applsci 12 05785 i016) and its suggested changes achieved a reduction of 77.4 % for male dropouts, 79.3 % for female dropouts, and 78.3 % for total dropouts. In the same way, the most factible counterfactual ( Applsci 12 05785 i017) reduced male dropouts by 32.2 % , female dropouts by 26 % , and total dropouts by 29 % . Finally, Expert_1’s selected counterfactual ( Applsci 12 05785 i018) gave the best results, reducing dropouts by 79.9 % for males, 80.7 % for females, and 79.9 % for total dropouts.
After the analysis, Expert_1 concluded that the Q_A_Credits_S and GPA variables played an important role in Industrial Engineering (question (i)). Based on his experience, these variables could be improved by supporting students in their course selections for one semester. Expert_1 also concluded that SDA-Vis is useful for reducing dropout rates; for instance, it could be possible to reduce dropout students by 62.4 % (Table 3). Expert_1 also considered that the metrics were helpful in selecting and measuring the impact of the counterfactual automatically for a group of students. However, he also stressed the importance of user intervention in conducting the analysis (question (ii)).

5.2. Inter-Office Cooperation

The second case study shows how SDA-Vis can help identify specific patterns and issues in cases where some offices should take immediate action. More specifically, a domain expert wanted to demonstrate how particular patterns influence the university’s early semesters. Several studies show that early dropouts in university years is not conjectural. They are influenced by several factors such as internal factors related to the student, the lecturer, and academic tutors, and factors relating to the demographic of the student [59]. Internal factors such as perceptions of course difficulty and the motivational and persistence level are abstract and difficult to measure. However, it is possible to consider risk factors linked to demographics, barriers, and family conditions. In this vein, this case study aimed to analyze the counterfactuals of different careers during the first semester of university.
To perform this analysis, domain experts considered students in the first semesters of eight programs (four programs were not considered because they had fewer than five dropout students in the first semester). The initial intuition was to look at the counterfactuals’ most critical variables. Figure 8 shows various students and their counterfactuals obtained with SDA-Vis. The first column shows the Dropout Analysis dual view, while the second column presents their respective counterfactuals represented by the Counterfactual Exploration view. For each course, in the Dropout Analysis dual view, the domain expert selected the students and counterfactuals with the highest probability of becoming non-dropout (top right-hand corner of each projection). In contrast, the Counterfactual Exploration view revealed some synthetic alternatives; the variables were ordered based on their degree of influence (from left to right).
The relations between socioeconomic factors and counterfactuals were pronounced in the Counterfactual Exploration view. During the exploration of the most relevant characteristics, as well as some academic variables such as GPAs, there were some characteristics that were very relevant (highlighted in dotted boxes), such as Age (green), HDI (pinkish), Scholarship (orange), and Poverty (blue). Concerning Age, SDA-Vis suggests increasing some values, for instance, for the first student of Business management (from 18 to 20). The age range of full-time students enrolled in the university was 16–24. According to the experts, in some cases, youth is linked to decisions regarding pursuing academic choices. Therefore, these students need more encouragement from an academic tutor or suitable professional.
Regarding HDI and poverty (relating to the origin and the residence), these variables are directly related to the influence of parental economic support and social barriers. SDA-Vis suggested increasing HDI, reducing poverty, or both in most cases. According to the domain expert, good environmental factors (higher HDI and lower poverty) significantly decrease dropout risk, especially in the first semester. Finally, scholarships are related to the university’s financial support. SDA-Vis suggested that it is essential to support these students financially to avoid dropouts. In many cases, a balance exists between improving HDI and providing a scholarship. This means improving the HDI, reducing poverty, or providing a grant.
These analyses reinforce the conclusions that age has some significant influence on the dropout rate [59,60], that the economic environment in the community or area can mitigate or exacerbate the risk of dropping out [61,62], and that scholarships are essential, especially for students with low resources [63,64]. However, some counterfactuals are not actionable. It is impossible to immediately change a student’s socioeconomic conditions and age. This case study shows how SDA-Vis could also help to detect problems in some groups of students and alert offices in the university, e.g., social and psychology offices, allowing them to take different actions.

6. Domain Experts’ Validations

After participating in the case studies, the domain experts gave us some feedback regarding validation of the tool. The validation process was conducted by three domain experts who verified whether SDA-Vis fulfilled the analytical objectives defined in Section 3.1. This tester team had vast experience in university assistance, and its members had worked to detect students at risk of early dropout. First, the domain experts were trained to use the system, and then they were asked the following four questions:
  • Q1: Does the methodology of the SDA-Vis system help you to analyze and reduce dropouts?
  • Q2: Are the findings of the SDA-Vis system relevant?
  • Q3: Is the SDA-Vis system more suitable for dropout reduction than the system you use?
  • Q4: Is the SDA-Vis system easier to use than the current system?
For the domain experts, the counterfactual explanation model (Methodology—Q1) was deemed an exciting and promising alternative, allowing action to be taken. One of the experts said: The proposed system has enabled an excellent alternative solution to the challenges we face in our daily analysis. In our current study, we lack predictive models of attrition based on academic, social, and economic data.
To address Q2, the domain experts conducted some analytical tasks, and after their analysis we collected their impressions. One of the experts said: Our current analysis is based only on the semester grading of the courses (Academic Risk Alert—ARA). For instance, we analyze only students with grades lower than 5.75 (0–20 scale). I believe that the planning of actions for all students is essential. Moreover, the detection of specific problems could be necessary to assign an academic tutor to analyze the student’s educational, psychological, and social situation.
Domain experts were involved in SDA-Vis’s design, and they considered that the system does integrate dynamic and intuitive resources (Usability—Q3). The expert who prepared the reports stated: This system makes the analysis very dynamic and easy to interpret, even taking into account external variables. Recently, we implemented a dashboard based on QLIK (qlik.com (accessed on 31 May 2022)) that allows identifying the ARA students automatically. However, it is limited and hard to follow for many users (similar to Excel). Even worse, the analysis of external factors must be done manually based on our expertise.
Finally, the domain experts considered SDA-Vis a helpful system compared to the currently used tools (Usefulness—Q4). One of the experts stated: I consider SDA-Vis a beneficial analytical system, and it is far advanced compared to the methodologies we currently use. Our traditional tools are descriptive, while SDA-Vis gives us multiple interactive solutions. It could be essential for academic tutors, professors, and policy decision makers to apply corrective actions and decrease student dropout rates.
As detailed, we obtained positive feedback. In addition, the experts were quite enthusiastic about SDA-Vis, as it allowed them to identify, understand, and suggest solutions to take corrective actions.

7. Discussion and Limitations

We developed SDA-Vis considering the suggestions of the domain experts. We guided the design based on the analytical objectives detailed in Section 3.1. However, we identified some limitations and possibilities for future work during our construction process.
  • Automatic student performance prediction. We used a counterfactual explanation to generate synthetic solutions for a dropout student. However, the domain experts were also interested in automatically determining student performance. This analysis can improve the quality of feedback given to students [65]. In future work, we plan to address the analysis of secondary school grades in our research. Moreover, our approach could also design proper vocational orientation for a particular student.
  • Multiple Data Sources and Scenarios. Combining different types of information about students and their environments such as high school grades, parents’ educational level, socioeconomic level, distance to the university, and university infrastructure would be helpful for analyzing the whole scenario. Given the increasing number of initiatives by the university authorities to provide that information, an immediate direction for future work will be to combine different data sources to enrich the SDA-Vis system. Moreover, although this system was applied to the studied university, our approach could be extended to other universities, considering different data types and scenarios. The user can choose the model, data source, and scenario to improve academic performance, student retention, and curriculum design. Our approach could be versatile enough to be applied to different contexts such as loan analysis, crime reduction, and analysis of the spread of disease.
  • Global approach. SDA-Vis only used the counterfactual explanations to prevent student dropout. Although this satisfied the users’ requirements, we have discussed constructing a global student scenario analysis system. This could be used, for instance, to apply counterfactuals to improve the design structure of lectures, recommend courses to students, improve a professor’s performance, and calibrate the university’s fee. We are interested in tackling educational problems by using counterfactuals or other mathematical and computational mechanisms in a unique integrated analytical system, in future work.
  • Longitudinal analysis. Despite the experiments, case studies, and validation process we conducted with the university’s real data set, we consider that a longitudinal study of current students could be interesting, to address the system’s usefulness in reality. We are interested in applying SDA-Vis’s suggested actions to current students and analyzing the changes over time, in future analyses.

8. Conclusions

This paper introduced SDA-Vis, a visualization system tailored for student dropout data analysis. The proposed tool uses a counterfactual-based analysis to find feasible solutions and prevent student dropout. Enabling a counterfactual explanation analysis is an essential trait of SDA-Vis that is not available in the current versions of tools that domain experts use to analyze student dropout. The provided case studies showed the effectiveness of SDA-Vis in offering actions in different scenarios. Moreover, it can bring out phenomena that even specialists have not perceived. We presented SDA-Vis to domain experts, who gave positive feedback about the tool and the methodology. Finally, we showed that our proposal is a versatile and easy-to-use tool that can be applied directly in many education scenarios such as retention and course design.

Supplementary Materials

The following supporting information can be downloaded at: https://www.mdpi.com/article/10.3390/app12125785/s1, Video S1: SDA-Vis-video.

Author Contributions

Conceptualization, G.G.-Z. and E.G.-N.; methodology, G.C.-C., D.A.G.-P., E.G.-N. and J.P.; software, G.G.-Z. and E.G.-N.; validation, E.G.-N., J.P. and G.C.-C.; formal analysis, E.G.-N.; investigation, G.G.-Z., E.G.-N. and J.P.; data curation, G.G.-Z. and D.A.G.-P.; writing—original draft preparation, G.G.-Z., D.A.G.-P., G.C.-C., J.P. and E.G.-N.; writing—review and editing, E.G.-N. and J.P.; visualization, E.G.-N.; supervision, E.G.-N.; project administration, G.C.-C. All authors have read and agreed to the published version of the manuscript.

Funding

The authors acknowledge the financial support of the World Bank Concytec Project “Improvement and Expansion of Services of the National System of Science, Technology and Technological Innovation” 8682-PE, through its executive unit ProCiencia for the project “Data Science in Education: Analysis of large-scale data using computational methods to detect and prevent problems of violence and desertion in educational settings” (Grant 028-2019-FONDECYT-BM-INC.INV).

Institutional Review Board Statement

Not applicable.

Informed Consent Statement

Not applicable.

Data Availability Statement

Not applicable.

Conflicts of Interest

The authors declare no conflict of interest.

References

  1. Gregorio, J.D.; Lee, J.W. Education and income inequality: New evidence from cross-country data. Rev. Income Wealth 2002, 48, 395–416. [Google Scholar] [CrossRef]
  2. Asha, P.; Vandana, E.; Bhavana, E.; Shankar, K.R. Predicting University Dropout through Data Analysis. In Proceedings of the 4th International Conference on Trends in Electronics and Informatics (ICOEI)(48184), Tirunelveli, India, 15–17 June 2020; pp. 852–856. [Google Scholar]
  3. Solís, M.; Moreira, T.; Gonzalez, R.; Fernandez, T.; Hernandez, M. Perspectives to predict dropout in university students with machine learning. In Proceedings of the 2018 IEEE International Work Conference on Bioinspired Intelligence (IWOBI), San Carlos, Costa Rica, 18–20 July 2018; pp. 1–6. [Google Scholar]
  4. Pachas, D.A.G.; Garcia-Zanabria, G.; Cuadros-Vargas, A.J.; Camara-Chavez, G.; Poco, J.; Gomez-Nieto, E. A comparative study of WHO and WHEN prediction approaches for early identification of university students at dropout risk. In Proceedings of the 2021 XLVII Latin American Computing Conference (CLEI), Cartago, Costa Rica, 25–29 October 2021; pp. 1–10. [Google Scholar]
  5. Ameri, S.; Fard, M.J.; Chinnam, R.B.; Reddy, C.K. Survival analysis based framework for early prediction of student dropouts. In Proceedings of the 25th ACM International on Conference on Information and Knowledge Management, Indianapolis, IN, USA, 24–28 October 2016; pp. 903–912. [Google Scholar]
  6. Rovira, S.; Puertas, E.; Igual, L. Data-driven system to predict academic grades and dropout. PLoS ONE 2017, 12, 171–207. [Google Scholar] [CrossRef] [PubMed] [Green Version]
  7. Barbosa, A.; Santos, E.; Pordeus, J.P. A machine learning approach to identify and prioritize college students at risk of dropping out. In Brazilian Symposium on Computers in Education; Sociedade Brasileira de Computação: Recife, Brazil, 2017; pp. 1497–1506. [Google Scholar]
  8. Palmer, S. Modelling engineering student academic performance using academic analytics. IJEE 2013, 29, 132–138. [Google Scholar]
  9. Gitinabard, N.; Khoshnevisan, F.; Lynch, C.F.; Wang, E.Y. Your actions or your associates? Predicting certification and dropout in MOOCs with behavioral and social features. arXiv 2018, arXiv:1809.00052. [Google Scholar]
  10. Aulck, L.; Aras, R.; Li, L.; L’Heureux, C.; Lu, P.; West, J. STEM-ming the Tide: Predicting STEM attrition using student transcript data. arXiv 2017, arXiv:1708.09344. [Google Scholar]
  11. Gutierrez-Pachas, D.A.; Garcia-Zanabria, G.; Cuadros-Vargas, A.J.; Camara-Chavez, G.; Poco, J.; Gomez-Nieto, E. How Do Curricular Design Changes Impact Computer Science Programs?: A Case Study at San Pablo Catholic University in Peru. Educ. Sci. 2022, 12, 242. [Google Scholar] [CrossRef]
  12. Wachter, S.; Mittelstadt, B.; Russell, C. Counterfactual explanations without opening the black box: Automated decisions and the GDPR. Harv. JL Tech. 2017, 31, 841. [Google Scholar] [CrossRef] [Green Version]
  13. Mothilal, R.K.; Sharma, A.; Tan, C. Explaining machine learning classifiers through diverse counterfactual explanations. In Proceedings of the 2020 Conference on Fairness, Accountability and Transparency, Barcelona, Spain, 27–30 January 2020; pp. 607–617. [Google Scholar]
  14. Cheng, F.; Ming, Y.; Qu, H. DECE: Decision Explorer with Counterfactual Explanations for Machine Learning Models. IEEE Trans. Vis. Comput. Graph. 2020, 27, 1438–1447. [Google Scholar] [CrossRef] [PubMed]
  15. Molnar, C.; Casalicchio, G.; Bischl, B. Interpretable Machine Learning - A Brief History, State-of-the-Art and Challenges. In Proceedings of the Joint European Conference on Machine Learning and Knowledge Discovery in Databases, Ghent, Belgium, 14–18 September 2020. [Google Scholar]
  16. Zoric, A.B. Benefits of educational data mining. In Proceedings of the Economic and Social Development: Book of Proceedings, Split, Croatia, 19–20 September 2019; pp. 1–7. [Google Scholar]
  17. Ganesh, S.H.; Christy, A.J. Applications of educational data mining: A survey. In Proceedings of the 2015 International Conference on Innovations in Information, Embedded and Communication Systems (ICIIECS), Coimbatore, India, 19–20 March 2015; pp. 1–6. [Google Scholar]
  18. Da Fonseca Silveira, R.; Holanda, M.; de Carvalho Victorino, M.; Ladeira, M. Educational data mining: Analysis of drop out of engineering majors at the UnB-Brazil. In Proceedings of the 18th IEEE International Conference On Machine Learning And Applications (ICMLA), Boca Raton, FL, USA, 16–19 December 2019; pp. 259–262. [Google Scholar]
  19. De Baker, R.S.J.; Inventado, P.S. Chapter X: Educational Data Mining and Learning Analytics. Comput. Sci. 2014, 7, 1–16. [Google Scholar]
  20. Rigo, S.J.; Cazella, S.C.; Cambruzzi, W. Minerando Dados Educacionais com foco na evasão escolar: Oportunidades, desafios e necessidades. In Proceedings of the Anais do Workshop de Desafios da Computação Aplicada à Educação, Curitiba, Brazil, 17–18 July 2012; pp. 168–177. [Google Scholar]
  21. Agrusti, F.; Bonavolontà, G.; Mezzini, M. University Dropout Prediction through Educational Data Mining Techniques: A Systematic Review. Je-LKS 2019, 15, 161–182. [Google Scholar]
  22. Baranyi, M.; Nagy, M.; Molontay, R. Interpretable Deep Learning for University Dropout Prediction. In Proceedings of the 21st Annual Conference on Information Technology Education, Odesa, Ukraine, 13–19 September 2020; pp. 13–19. [Google Scholar]
  23. Agrusti, F.; Mezzini, M.; Bonavolontà, G. Deep learning approach for predicting university dropout: A case study at Roma Tre University. Je-LKS 2020, 16, 44–54. [Google Scholar]
  24. Brdesee, H.S.; Alsaggaf, W.; Aljohani, N.; Hassan, S.U. Predictive Model Using a Machine Learning Approach for Enhancing the Retention Rate of Students At-Risk. Int. J. Semant. Web Inf. Syst. (IJSWIS) 2022, 18, 1–21. [Google Scholar] [CrossRef]
  25. Waheed, H.; Hassan, S.U.; Aljohani, N.R.; Hardman, J.; Alelyani, S.; Nawaz, R. Predicting academic performance of students from VLE big data using deep learning models. Comput. Hum. Behav. 2020, 104, 106189. [Google Scholar] [CrossRef] [Green Version]
  26. Waheed, H.; Anas, M.; Hassan, S.U.; Aljohani, N.R.; Alelyani, S.; Edifor, E.E.; Nawaz, R. Balancing sequential data to predict students at-risk using adversarial networks. Comput. Electr. Eng. 2021, 93, 107274. [Google Scholar] [CrossRef]
  27. Zhang, L.; Rangwala, H. Early identification of at-risk students using iterative logistic regression. In International Conference on Artificial Intelligence in Education; Springer: Berlin/Heidelberg, Germany, 2018; pp. 613–626. [Google Scholar]
  28. Qiu, J.; Tang, J.; Liu, T.X.; Gong, J.; Zhang, C.; Zhang, Q.; Xue, Y. Modeling and predicting learning behavior in MOOCs. In Proceedings of the Ninth ACM International Conference on Web Search and Data Mining, San Francisco, CA, USA, 22–25 February 2016; pp. 93–102. [Google Scholar]
  29. Lee, E.T.; Wang, J. Statistical Methods for Survival Data Analysis; John Wiley & Sons: Hoboken, NJ, USA, 2003; Volume 476. [Google Scholar]
  30. Rebasa, P. Conceptos básicos del análisis de supervivencia. Cirugía Española 2005, 78, 222–230. [Google Scholar] [CrossRef]
  31. Chen, Y.; Johri, A.; Rangwala, H. Running out of stem: A comparative study across stem majors of college students at-risk of dropping out early. In Proceedings of the 8th International Conference on Learning Analytics and Knowledge, Sydney, NSW, Australia, 7–9 March 2018; pp. 270–279. [Google Scholar]
  32. Juajibioy, J.C. Study of university dropout reason based on survival model. OJS 2016, 6, 908–916. [Google Scholar] [CrossRef] [Green Version]
  33. Yang, D.; Sinha, T.; Adamson, D.; Rosé, C.P. Turn on, tune in, drop out: Anticipating student dropouts in massive open online courses. In Proceedings of the 2013 NIPS Data-Driven Education Workshop, Lake Tahoe, NV, USA, 9 December 2013; Volume 11, p. 14. [Google Scholar]
  34. Stepin, I.; Alonso, J.M.; Catala, A.; Pereira-Fariña, M. A survey of contrastive and counterfactual explanation generation methods for explainable artificial intelligence. IEEE Access 2021, 9, 11974–12001. [Google Scholar] [CrossRef]
  35. Artelt, A.; Hammer, B. On the computation of counterfactual explanations–A survey. arXiv 2019, arXiv:1911.07749. [Google Scholar]
  36. Kovalev, M.S.; Utkin, L.V. Counterfactual explanation of machine learning survival models. Informatica 2020, 32, 817–847. [Google Scholar] [CrossRef]
  37. Verma, S.; Dickerson, J.; Hines, K. Counterfactual Explanations for Machine Learning: A Review. arXiv 2020, arXiv:2010.10596. [Google Scholar]
  38. Spangher, A.; Ustun, B.; Liu, Y. Actionable recourse in linear classification. In Proceedings of the 5th Workshop on Fairness, Accountability and Transparency in Machine Learning, New York, NY, USA, 23–24 February 2018. [Google Scholar]
  39. Ramon, Y.; Martens, D.; Provost, F.; Evgeniou, T. Counterfactual explanation algorithms for behavioral and textual data. arXiv 2019, arXiv:1912.01819. [Google Scholar]
  40. White, A.; Garcez, A.d. Measurable counterfactual local explanations for any classifier. arXiv 2019, arXiv:1908.03020. [Google Scholar]
  41. Laugel, T.; Lesot, M.J.; Marsala, C.; Renard, X.; Detyniecki, M. Comparison-based inverse classification for interpretability in machine learning. In IPMU; Springer: Berlin/Heidelberg, Germany, 2018; pp. 100–111. [Google Scholar]
  42. Dhurandhar, A.; Chen, P.Y.; Luss, R.; Tu, C.C.; Ting, P.; Shanmugam, K.; Das, P. Explanations based on the missing: Towards contrastive explanations with pertinent negatives. In Proceedings of the Advances in Neural Information Processing Systems, Montreal, QC, Canada, 3–8 December 2018. [Google Scholar]
  43. Dhurandhar, A.; Pedapati, T.; Balakrishnan, A.; Chen, P.Y.; Shanmugam, K.; Puri, R. Model agnostic contrastive explanations for structured data. arXiv 2019, arXiv:1906.00117. [Google Scholar]
  44. Van Looveren, A.; Klaise, J. Interpretable counterfactual explanations guided by prototypes. arXiv 2019, arXiv:1907.02584. [Google Scholar]
  45. Goyal, Y.; Wu, Z.; Ernst, J.; Batra, D.; Parikh, D.; Lee, S. Counterfactual Visual Explanations. In Proceedings of the International Conference on Machine Learning, Long Beach, CA, USA, 9–15 June 2019; Volume 97, pp. 2376–2384. [Google Scholar]
  46. Yuan, J.; Chen, C.; Yang, W.; Liu, M.; Xia, J.; Liu, S. A survey of visual analytics techniques for machine learning. Comput. Vis. Media 2020, 7, 3–36. [Google Scholar] [CrossRef]
  47. Liu, S.; Wang, X.; Liu, M.; Zhu, J. Towards better analysis of machine learning models: A visual analytics perspective. Vis. Informatics 2017, 1, 48–56. [Google Scholar] [CrossRef]
  48. Hohman, F.; Kahng, M.; Pienta, R.; Chau, D.H. Visual analytics in deep learning: An interrogative survey for the next frontiers. IEEE Trans. Vis. Comput. Graph. 2018, 25, 2674–2693. [Google Scholar] [CrossRef]
  49. Sacha, D.; Kraus, M.; Keim, D.A.; Chen, M. Vis4ml: An ontology for visual analytics assisted machine learning. IEEE Trans. Vis. Comput. Graph. 2018, 25, 385–395. [Google Scholar] [CrossRef] [Green Version]
  50. Wang, Q.; Xu, Z.; Chen, Z.; Wang, Y.; Liu, S.; Qu, H. Visual analysis of discrimination in machine learning. IEEE Trans. Vis. Comput. Graph. 2020, 27, 1470–1480. [Google Scholar] [CrossRef]
  51. Wexler, J.; Pushkarna, M.; Bolukbasi, T.; Wattenberg, M.; Viégas, F.; Wilson, J. The what-if tool: Interactive probing of machine learning models. IEEE Trans. Vis. Comput. Graph. 2019, 26, 56–65. [Google Scholar] [CrossRef] [Green Version]
  52. Spinner, T.; Schlegel, U.; Schäfer, H.; El-Assady, M. explAIner: A visual analytics framework for interactive and explainable machine learning. IEEE Trans. Vis. Comput. Graph. 2019, 26, 1064–1074. [Google Scholar] [CrossRef] [PubMed] [Green Version]
  53. Collaris, D.; van Wijk, J.J. ExplainExplore: Visual exploration of machine learning explanations. In Proceedings of the 2020 IEEE Pacific Visualization Symposium (PacificVis), Tianjin, China, 3–5 June 2020; pp. 26–35. [Google Scholar]
  54. Zhang, J.; Wang, Y.; Molino, P.; Li, L.; Ebert, D.S. Manifold: A model-agnostic framework for interpretation and diagnosis of machine learning models. IEEE Trans. Vis. Comput. Graph. 2018, 25, 364–373. [Google Scholar] [CrossRef] [Green Version]
  55. Ming, Y.; Qu, H.; Bertini, E. Rulematrix: Visualizing and understanding classifiers with rules. IEEE Trans. Vis. Comput. Graph. 2018, 25, 342–352. [Google Scholar] [CrossRef] [PubMed] [Green Version]
  56. Gomez, O.; Holter, S.; Yuan, J.; Bertini, E. ViCE: Visual counterfactual explanations for machine learning models. In Proceedings of the 25th International Conference on Intelligent User Interfaces, Cagliari, Italy, 17–20 March 2020; pp. 531–535. [Google Scholar]
  57. Deng, H.; Wang, X.; Guo, Z.; Decker, A.; Duan, X.; Wang, C.; Ambrose, G.A.; Abbott, K. Performancevis: Visual analytics of student performance data from an introductory chemistry course. Vis. Informatics 2019, 3, 166–176. [Google Scholar] [CrossRef]
  58. Pedregosa, F.; Varoquaux, G.; Gramfort, A.; Michel, V.; Thirion, B.; Grisel, O.; Blondel, M.; Prettenhofer, P.; Weiss, R.; Dubourg, V.; et al. Scikit-learn: Machine Learning in Python. J. Mach. Learn. Res. 2011, 12, 2825–2830. [Google Scholar]
  59. Xenos, M.; Pierrakeas, C.; Pintelas, P. A survey on student dropout rates and dropout causes concerning the students in the Course of Informatics of the Hellenic Open University. Comput. Educ. 2002, 39, 361–377. [Google Scholar] [CrossRef]
  60. Pappas, I.O.; Giannakos, M.N.; Jaccheri, L. Investigating factors influencing students’ intention to dropout computer science studies. In Proceedings of the 2016 ACM Conference on Innovation and Technology in Computer Science Education, Arequipa, Peru, 11–13 July 2016; pp. 198–203. [Google Scholar]
  61. Lent, R.W.; Brown, S.D.; Hackett, G. Contextual supports and barriers to career choice: A social cognitive analysis. J. Couns. Psychol. 2000, 47, 36. [Google Scholar] [CrossRef]
  62. Reisberg, R.; Raelin, J.A.; Bailey, M.B.; Hamann, J.C.; Whitman, D.L.; Pendleton, L.K. The effect of contextual support in the first year on self-efficacy in undergraduate engineering programs. In Proceedings of the 2011 ASEE Annual Conference & Exposition, Vancouver, BC, Canada, 26–29 June 2011; pp. 22–1445. [Google Scholar]
  63. Bonaldo, L.; Pereira, L.N. Dropout: Demographic profile of Brazilian university students. Procedia-Soc. Behav. Sci. 2016, 228, 138–143. [Google Scholar] [CrossRef] [Green Version]
  64. Ononye, L.; Bong, S. The Study of the Effectiveness of Scholarship Grant Program on Low-Income Engineering Technology Students. J. STEM Educ. 2018, 18, 26–31. [Google Scholar]
  65. Sheshadri, A.; Gitinabard, N.; Lynch, C.F.; Barnes, T.; Heckman, S. Predicting student performance based on online study habits: A study of blended courses. arXiv 2019, arXiv:1904.07331. [Google Scholar]
Figure 1. Example of the concept of explanation antecedents. The representation shows the decision boundary of a classifier, where a green dot (in the dropout space of the boundary) named Org is affected by changes (represented by the arrows), creating counterfactual instances (red dots) named CF1, CF2, and CF3 in the non-dropout space of the boundary.
Applsci 12 05785 g001
Figure 2. Correlation matrix for variables presented in Table 1.
Applsci 12 05785 g002
Figure 3. SDA-Vis system: a set of linked visual resources enabling the exploration of dropout students’ information and their counterfactual explanations. Applsci 12 05785 i001 Feature Distribution Bars view, Applsci 12 05785 i002 Student Projection view, Applsci 12 05785 i003 Counterfactual Projection view, Applsci 12 05785 i004 Counterfactual Exploration view, Applsci 12 05785 i005 Table view, and Applsci 12 05785 i006 Impact view.
Applsci 12 05785 g003
Figure 4. Representation of students and their counterfactual projections in the probability space. The left side shows the students, while the right side shows the counterfactuals based on their probability of belonging to the non-dropout class. The classification model gives the probability.
Applsci 12 05785 g004
Figure 5. A block in the Counterfactual Exploration view, with the original values (row Ori) and five corresponding counterfactuals (rows C1 to C5). Based on this block, we have five options to keep the student in the college. For instance, in C1, it is enough to improve the elective GPA from 11 to 13 (0–20 scale) to avoid the student dropping out of the college.
Applsci 12 05785 g005
Figure 6. The impact view shows the impact of a counterfactual on two groups. For example, for male (M) students, the counterfactual reduces the dropout from 150 to 80 students (avoiding 70 dropouts), while for female students, around 20 dropouts are avoided.
Applsci 12 05785 g006
Figure 7. Analyzing counterfactual explanations for Industrial Engineering: Applsci 12 05785 i007 represents selection of students and their counterfactuals, respectively, Applsci 12 05785 i010 shows the counterfactuals, where Applsci 12 05785 i011 shows random counterfactuals, Applsci 12 05785 i012 shows the most feasible, Applsci 12 05785 i013 shows the most factible, and Applsci 12 05785 i019 shows the user-selected counterfactual. In addition, Applsci 12 05785 i014 shows the student distribution and Applsci 12 05785 i015 shows the impact of the selected counterfactuals (B2–B4).
Applsci 12 05785 g007
Figure 8. Summary of dropout students’ analysis for eight different programs in the first semester of the university. Some variables have a higher influence on their counterfactuals.
Applsci 12 05785 g008
Table 1. Description of the data attributes collected from every student at the studied university.
AttributeVariable
IDStudent ID
N_Cod_StudentNumber of enrollments at the university
GenderGender of student (male/female)
AgeAge of student (birth date)
O_IDHOrigin HDI
O_Poverty_PerOrigin percentage of poverty
R_IDHResidence HDI
R_Poverty_PerResidence percentage of poverty
Marital_SWhether the student is married or not
School_TypeSchool type (private or public)
N_ReservationAverage number of reservations per semester
Q_Courses_SNumber of lectures per semester.
Q_A_Credits_SNumber of passed credits
Mandatory_GPAAverage GPA of the mandatory lectures
Elective_GPAAverage GPA of elective lectures
GPAFinal GPA score
N_SemestersNumber of completed semesters
H_Ausent_SAverage absence rate per semester
scholarshipWhether the student has a scholarship or not
EnrolledThe student status (target) 1: Yes, 0: No
Table 2. Analytical objectives and their related visualization tools.
AO1AO2AO3AO4AO5AO6
Feature Distribution Bars view
Student Projection view
Counterfactual Projection view
Counterfactual Exploration view
Table view
Impact view
Table 3. Impact analysis of certain counterfactuals, suggested by the tool and selected by the expert.
Gender == ‘M‘Gender == ‘F‘Total
Most Feasible Applsci 12 05785 i016 77.4 % 79.3 % 78.3 %
Most Factible Applsci 12 05785 i017 32.2 % 26 % 29 %
User Selection Applsci 12 05785 i018 79.9 % 80.7 % 79.9 %
Average 63.2 % 62 % 62.4 %
Publisher’s Note: MDPI stays neutral with regard to jurisdictional claims in published maps and institutional affiliations.

