The Effect of Gold Nanorods Clustering on Near-Infrared Radiation Absorption


1
School of Mechanical and Manufacturing Engineering, University of New South Wales, Sydney, NSW 2052, Australia
2
Australian Nuclear Science and Technology Organization (ANSTO), Kirrawee DC, NSW 2234, Australia
3
Joint Institute for High Temperatures, Krasnokazarmennaya St., 111116 Moscow, Russia
4
Microdynamic Technologies Laboratory, University of Tyumen, Volodarsky St., 625003 Tyumen, Russia
*
Author to whom correspondence should be addressed.
Appl. Sci. 2018, 8(7), 1132; https://doi.org/10.3390/app8071132
Submission received: 21 May 2018
/
Revised: 3 July 2018
/
Accepted: 3 July 2018
/
Published: 12 July 2018
(This article belongs to the Special Issue Nanofluids and Their Applications)
Abstract
:Featured Application
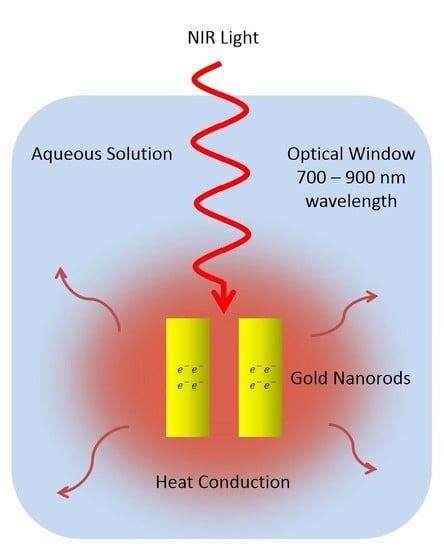
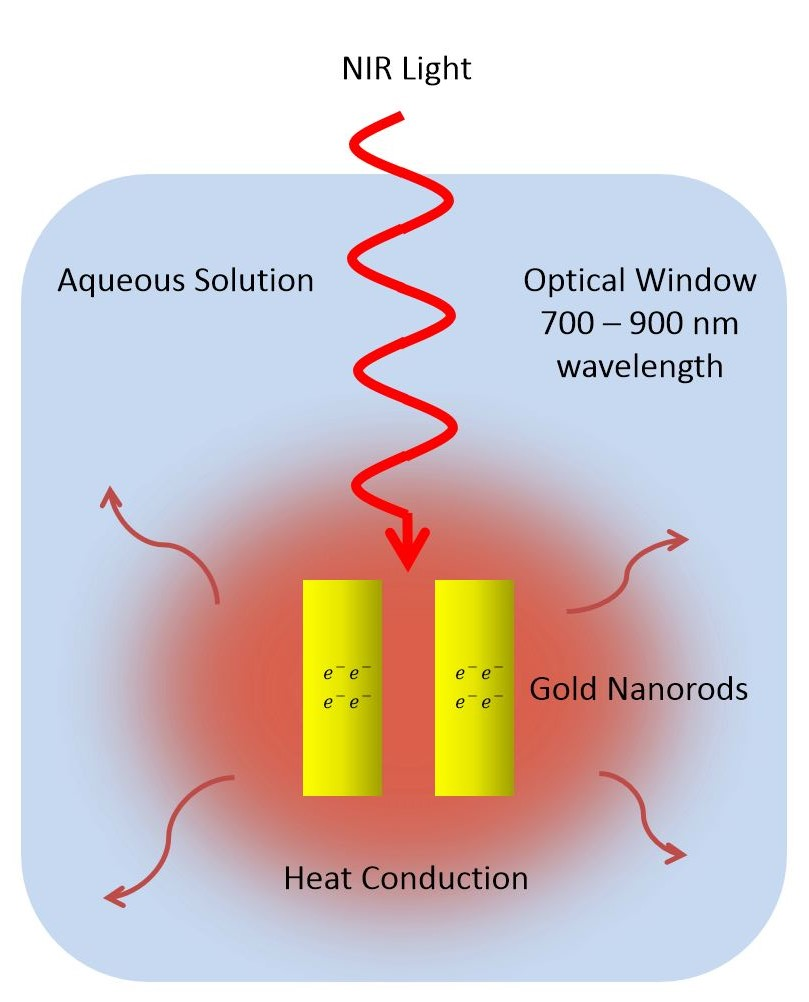
Hyperthermia treatment of tumors surrounded by healthy tissues can be enhanced using radiative heating of embedded gold nanoparticles (GNPs) due to their plasmonic resonance absorption in the so-called optical therapeutic window (700 nm to 900 nm wavelength).
Abstract
In this paper, the plasmonic resonant absorption of gold nanorods (GNRs) and GNR solutions was studied both numerically and experimentally. The heat generation in clustered GNR solutions with various concentrations was measured by exposing them to Near Infrared (NIR) light in experiment. Correspondingly, calculations based on the discrete-dipole approximation (DDA) revealed the same relationship between the maximum absorption efficiency and the nanorod orientation for the incident radiation. Additionally, both the plasmonic wavelength and the maximum absorption efficiency of a single nanorod were found to increase linearly with increasing aspect ratio (for a fixed nanorod volume). The wavelength of the surface plasmonic resonance (SPR) was found to change when the gold nanorods were closely spaced. Specifically, both a shift and a broadening of the resonance peak were attained when the distance between the nanorods was set to about 50 nm or less. The absorbance spectra of suspended nanorods at various volume fractions also showed that the plasmonic wavelength of the nanorods solution was at 780 ± 10 nm, which was in good agreement with the computational predictions for coupled side-by-side nanorods. When heated by NIR light, the rate of increase for both the temperature of solution and the absorbed light diminished when the volume fraction of suspended nanorods reached a value of . This matches with expectations for a partially clustered suspension of nanorods in water. Overall, this study reveals that particle clustering should be considered to accurately gauge the heat generation of the GNR hyperthermia treatments.
1. Introduction
The potential of nanoparticle hyperthermia therapy to treat cancerous cells has been widely investigated in the last decade [1,2,3,4,5,6]. The advantage of this approach is that particles can be conjugated to specific antibodies or targeting ligands which, in turn, penetrate leaky tumor blood vessels to selectively target cancerous cells [7,8,9]. Gold nanoparticles (GNPs) are good candidates for hyperthermia treatment because of their strong optical resonant absorption of near infrared (NIR) light in the so-called optical therapeutic window. When used in tandem, these two phenomena result in a relatively non-invasive method of selectively heating tumors while sparing healthy cells [10,11,12,13]. While there are possible strategies for hyperthermia therapy without gold nanoparticles [14,15], the design freedom afforded by bespoke particle morphology and the resultant control over optical makes GNPs worthy of further investigation and optimization for this application.
As the human skin tissues only weakly absorb light with wavelengths between 700 nm to 900 nm, NIR light optically penetrates biological tissues and reaches GNPs injected inside superficial tumors [16,17,18]. As the peak of this resonance, absorption can be tuned depending on the size and shape of GNPs [19], different types of GNPs including nanospheres, nanoshells and nanorods have been explored [6,10,20,21,22,23]. According to Jain, et al. [24], the calculated surface plasmonic resonance (SPR) absorption efficiency of gold nanorods was much higher than that of nanospheres and nanoshells. Additionally, the SPR of nanorods could be highly controllable by modifying their aspect ratio (AR defined as the ratio of the length to width of the rod, although high AR particles may be difficult to produce). Cai, et al. [25] explained that due to the complicated structure of nanoshells, manufacturing nanorods is easier than producing nanoshells. However, the effects of nanorod orientation and possible electromagnetic interaction between the closely spaced nanorods on the plasmonic absorption have not been quantitatively studied. Caswell, et al. [26], Nikoobakht, et al. [27] and Sun, et al. [28] have shown that the volume fraction of the solution can result in preferred orientation or self-assemblies of gold nanorods (GNR) but the previous studies did not analyze the effect of aggregation on the plasmonic resonance of GNR solutions. Jain and El-Sayed [29] found that the aggregation of gold nanorods caused a significant shift of the SPR wavelength of gold nanorod but this study did not present the effect of GNR aggregation on its absorption efficiency, the critical aspect of the hyperthermia.
Most existing investigations [26,27,28] examined the extinction spectra of GNRs and GNR solutions in isolation, but few reported the actual heat generation capability of these solutions to estimate a real potential for their intended application [30,31,32,33,34]. To fill this knowledge gap, the current study presents the absorption efficiency spectra and the plasmonic absorption resonance of GNR aggregations along with the corresponding effect of these aggregations on heat generation in GNR solutions of various concentrations. Clustering alone can shift the wavelength of the SPR from 700 nm to 1000 nm [35]. Since the heating ability of GNRs depends on their optical properties [36], and particle aggregation changes these properties, the heat generation potential of GNRs solutions can be significantly impacted by aggregates and self-assemblies [37,38]. Therefore, it is important to study both the optical properties of non-uniformly dispersed GNR solutions along with their resulting temperature increase. The present paper investigates this computationally and experimentally. The discrete dipole approximation (DDA) was used to calculate the optical properties of a single GNR and for GNR dimers with various gaps within the assemblies. In parallel, optical properties were measured from the transmission and reflection spectra of suspended nanorods at various volume fractions. Numerical predictions were compared with the experimental results to obtain a comprehensive understanding of the effects of nanorod orientation and possible aggregation. The temperature increase of solutions exposed to NIR light was also measured in laboratory experiments at various nanorod volume fractions to investigate the impact of the affected optical properties on the heat generation efficiency of GNR solutions.
2. Methods
2.1. Optical Experiment
This study focused on GNRs with nominal diameters of nm and axial lengths of nm, obtained from Sigma-Aldrich® (St. Louis, MO, USA), The AR and effective radius of these GNRs was around 3.8 and 8.9 nm. Thus, the plasmonic resonance of the GNR solution was designed to be 780 nm. Transmission electron microscopy (TEM) images of particles in the solution were obtained to verify that these particle dimensions were accurate. In addition, the size distribution of the samples was measured by using dynamic light scattering (DLS) technique [39], noting that DLS provides effective hydraulic diameters (in suspension). The optical and thermal experiments were performed for five volume fractions of GNRs and with pure water as a control. Transmittance and reflectance measurements of the samples were obtained with a Perkin Elmer® Lambda 1050 UV/Vis Spectrophotometer (Waltham, MA, USA) with an integrating sphere. The absorbance of the samples was calculated using the following equation [40]:
where A and T are the absorbance and measured transmittance of the samples, P is the light intensity the sample received and is the light intensity transmitted through the samples.
The volume of each sample was (3.5 mL). Table 1 illustrates the concentration and volume fraction of these samples. The concentration shown in Table 1 indicates the number of GNRs per milliliter. Thus, Sample A contained pure water while Sample F had a non-diluted GNR solution as-purchased from Sigma-Aldrich® (St. Louis, MO, USA) in which, according to the specification sheet provided by the manufacturer, each milliliter solution contained at least of gold. Using this specification, the concentration and volume fraction of Sample F corresponded to GNRs/mL and respectively. Samples B, C, D, and E were dilutions of Sample F to obtain the concentrations/volume fractions given in Table 1.
2.2. Thermal Experiment
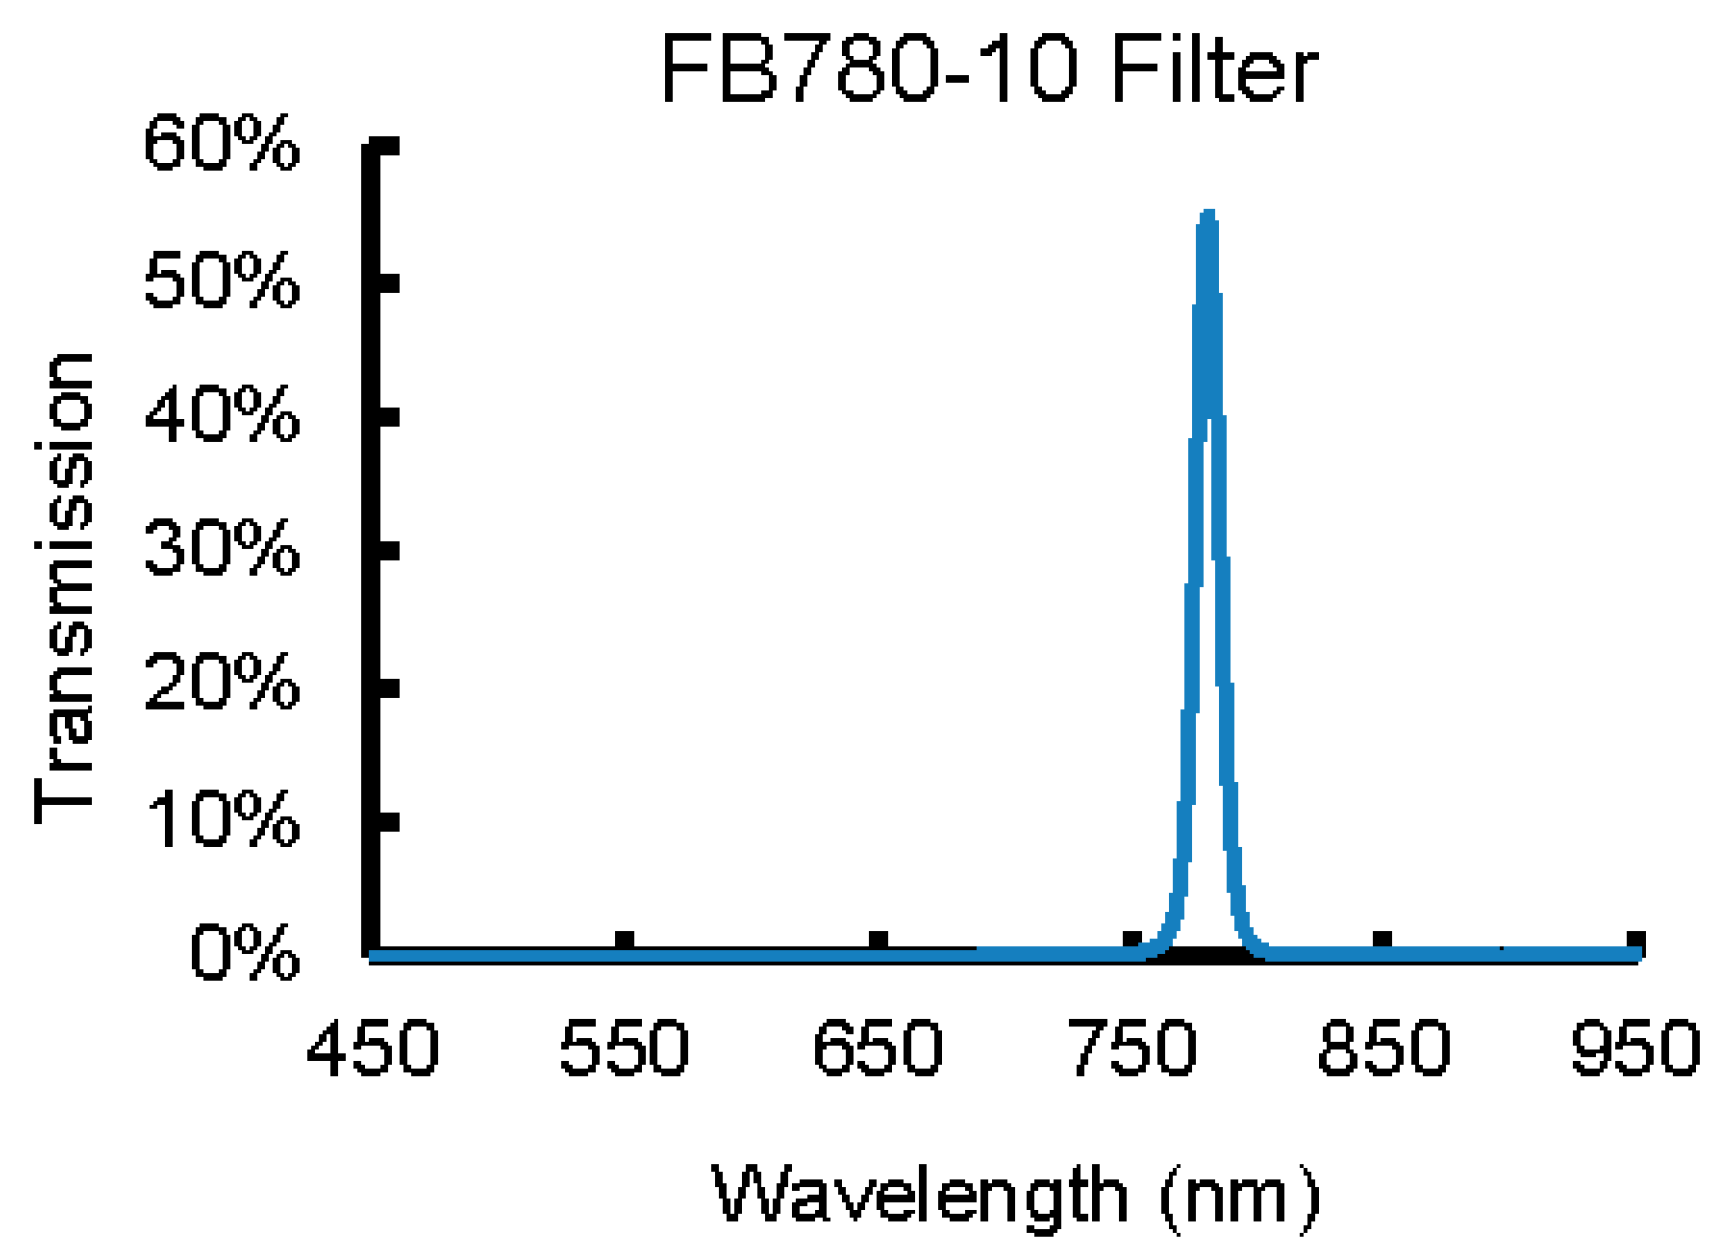
In the thermal experiment, Samples D, E and F were used because the temperature increase in the samples with low concentrations was found to be insignificant. A Hydrosun® 750 lamp (Müllheim, Germany) was used with a Thorlabs FB780-10 bandpass filter (Newton, NJ, USA) to heat the samples. The bandpass filter was applied to further limit the radiation from the lamp to that of the optical window of biological tissues. The specific light intensity of the Hydrosun® 750 lamp (Müllheim, Germany) was previously analyzed by present authors Dombrovsky, et al. [15]. It should be noted that the Hydrosun® 750 lamp (Müllheim, Germany) was applied in this experiment because it has been applied in biomedical treatments for mild hyperthermia cancer therapy [41]. The transmission of the FB780-10 filter is shown in Figure 1. As can be seen from this figure, the transmission of NIR light at 780 nm wavelength is over 55%. The diameter of the filter was 1 inch (25.4 mm), which was larger than the width of the sample containers, 10 mm.
The intensity of the radiation was calculated using the following equations:
where is the light intensity of the 750 lamp (Müllheim, Germany) at a wavelength [15], is the transmittance of the FB780-10 filter (refer to Figure 1). The value of and was also determined by the transmittance spectrum while represents the overall intensity transmitted through the filter from 770 nm to 790 nm wavelength.
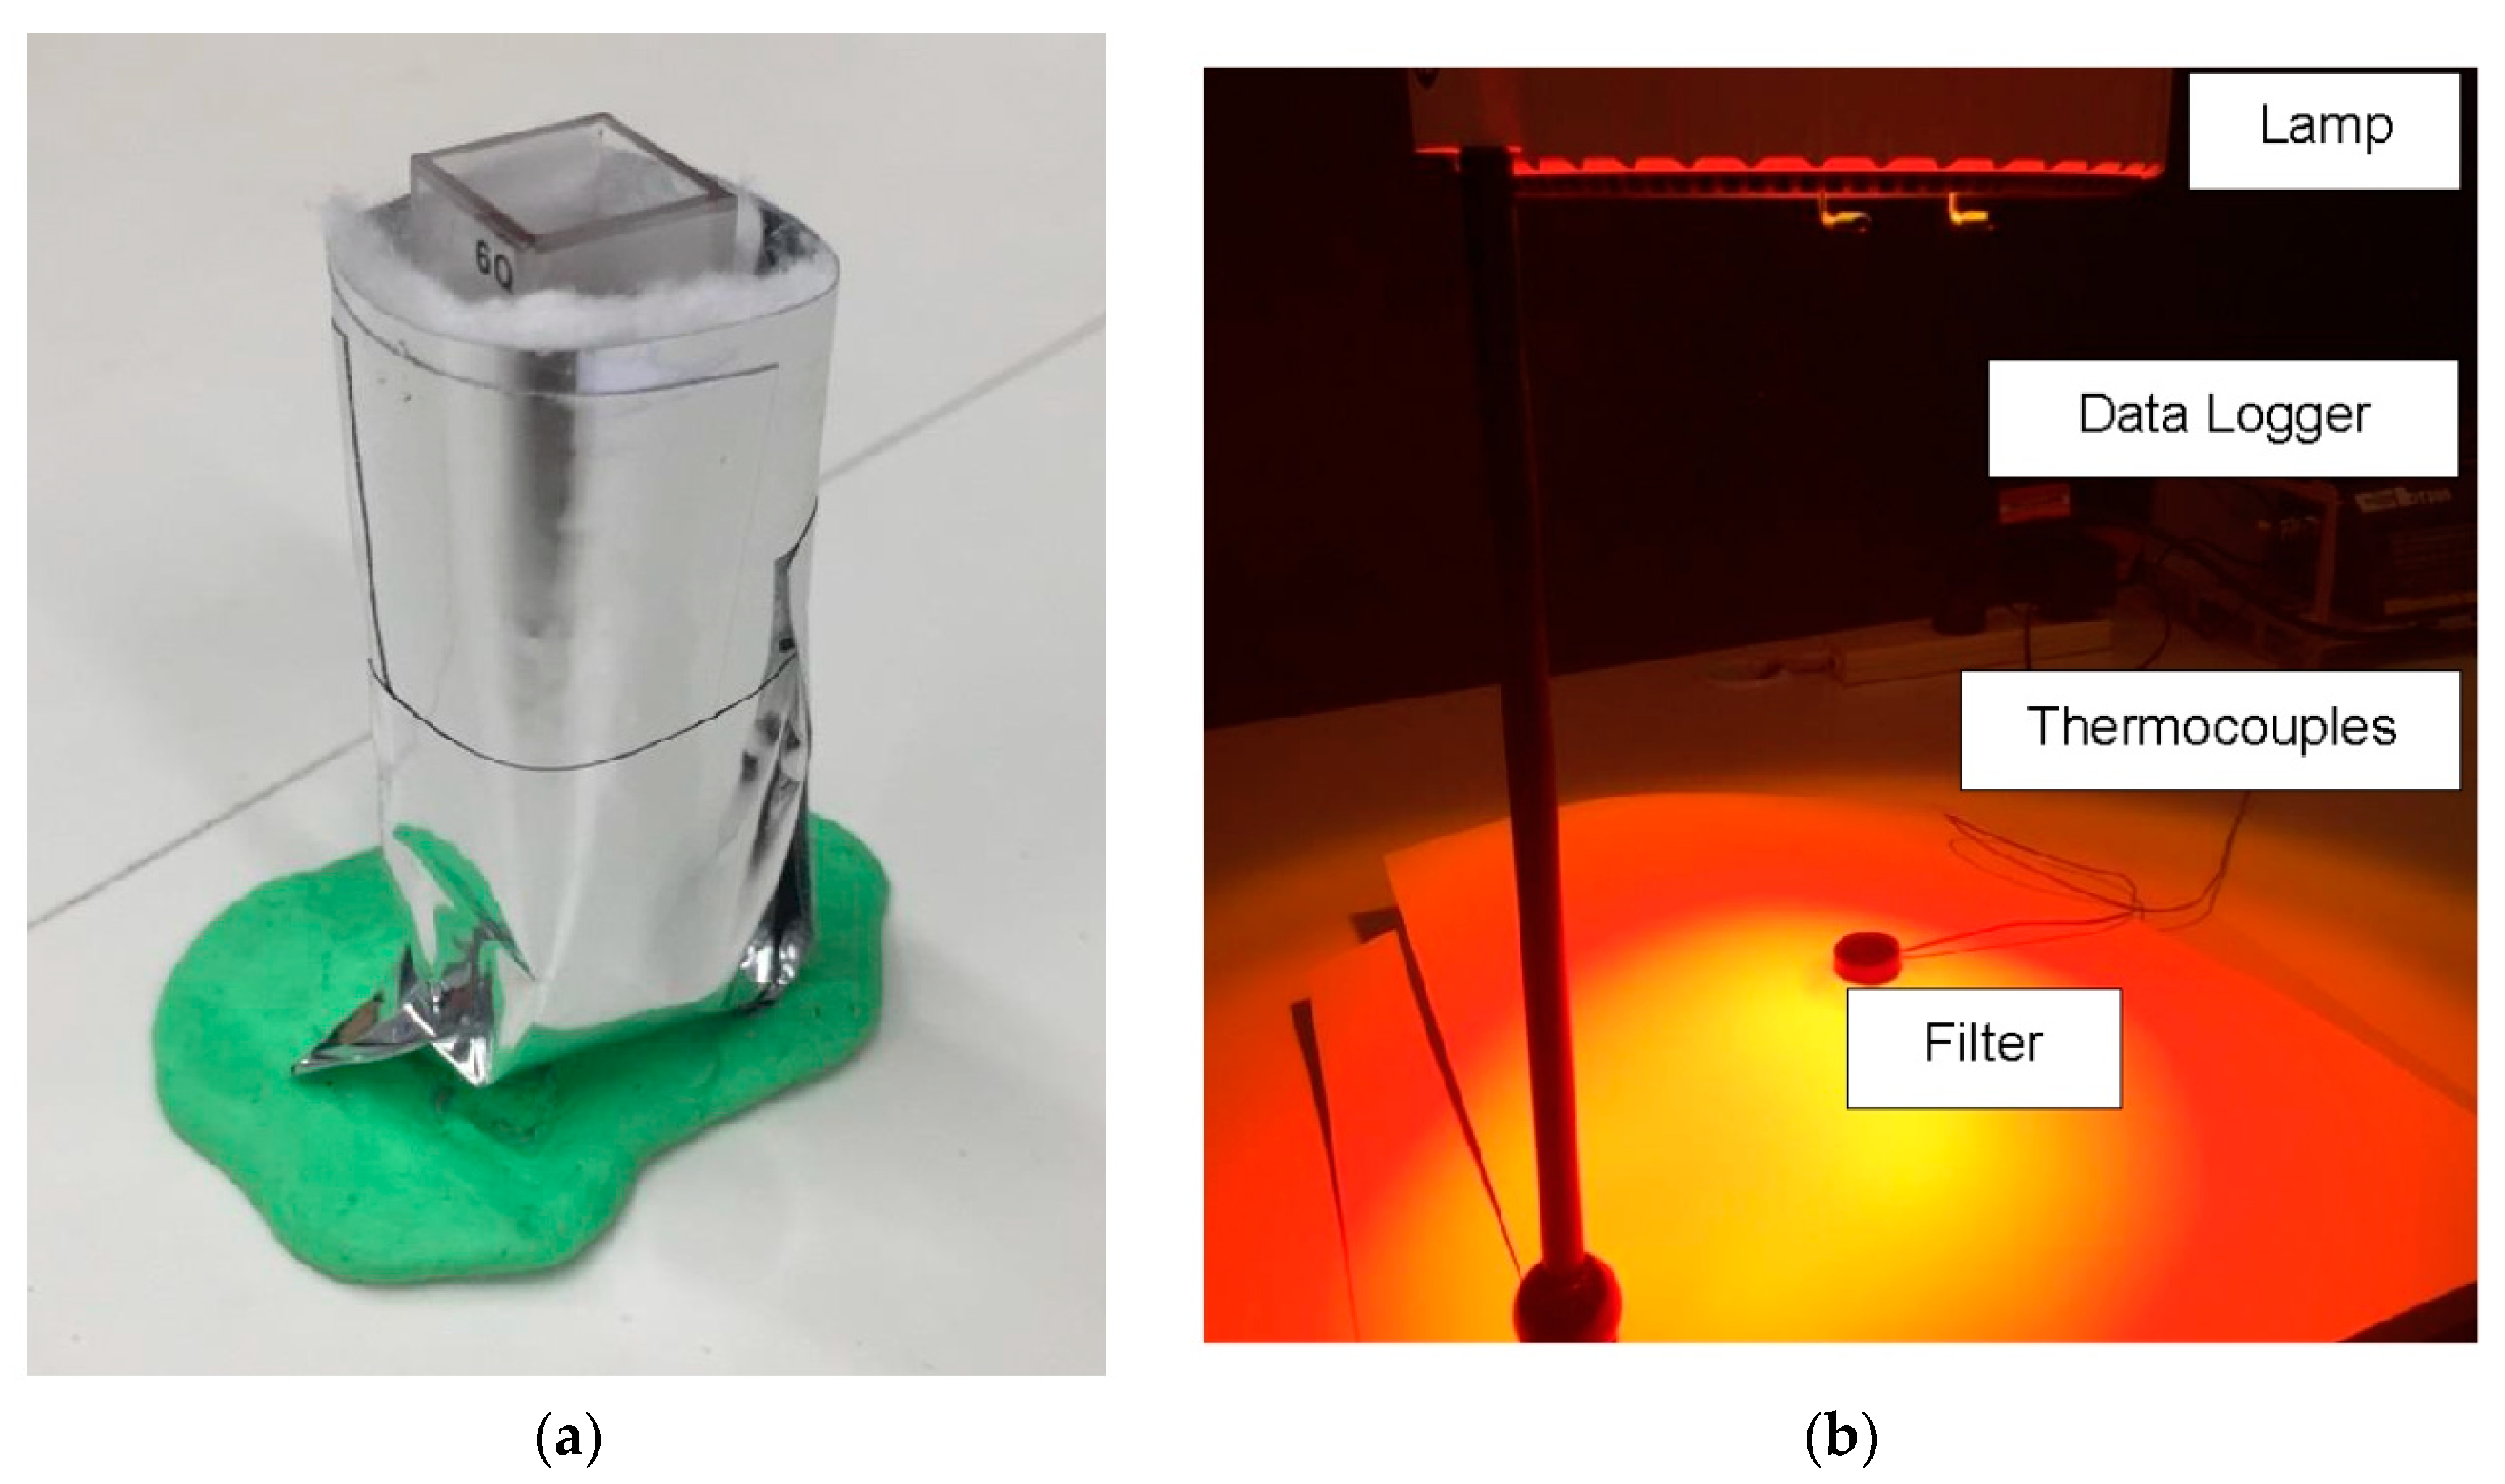
Figure 2 shows the set-up of the thermal experiment. As can be seen in Figure 2a, the sample was wrapped by Superwool® (Windsor, UK) insulation and reflective tape to limit heat loss and error of the experiment. As shown in Figure 2b, the surrounding area of the sample was not exposed to the light source to prevent heating from the sides. Thermocouples were applied to continuously measure local temperature at two locations inside the sample. The experimental data were captured by dataTaker® DT800 (Scoresby, VIC, Australia). The averaged value of temperature increase, at the measured locations after a 300 s of exposure to the filtered light, is presented in Table 2.
2.3. Numerical Methods
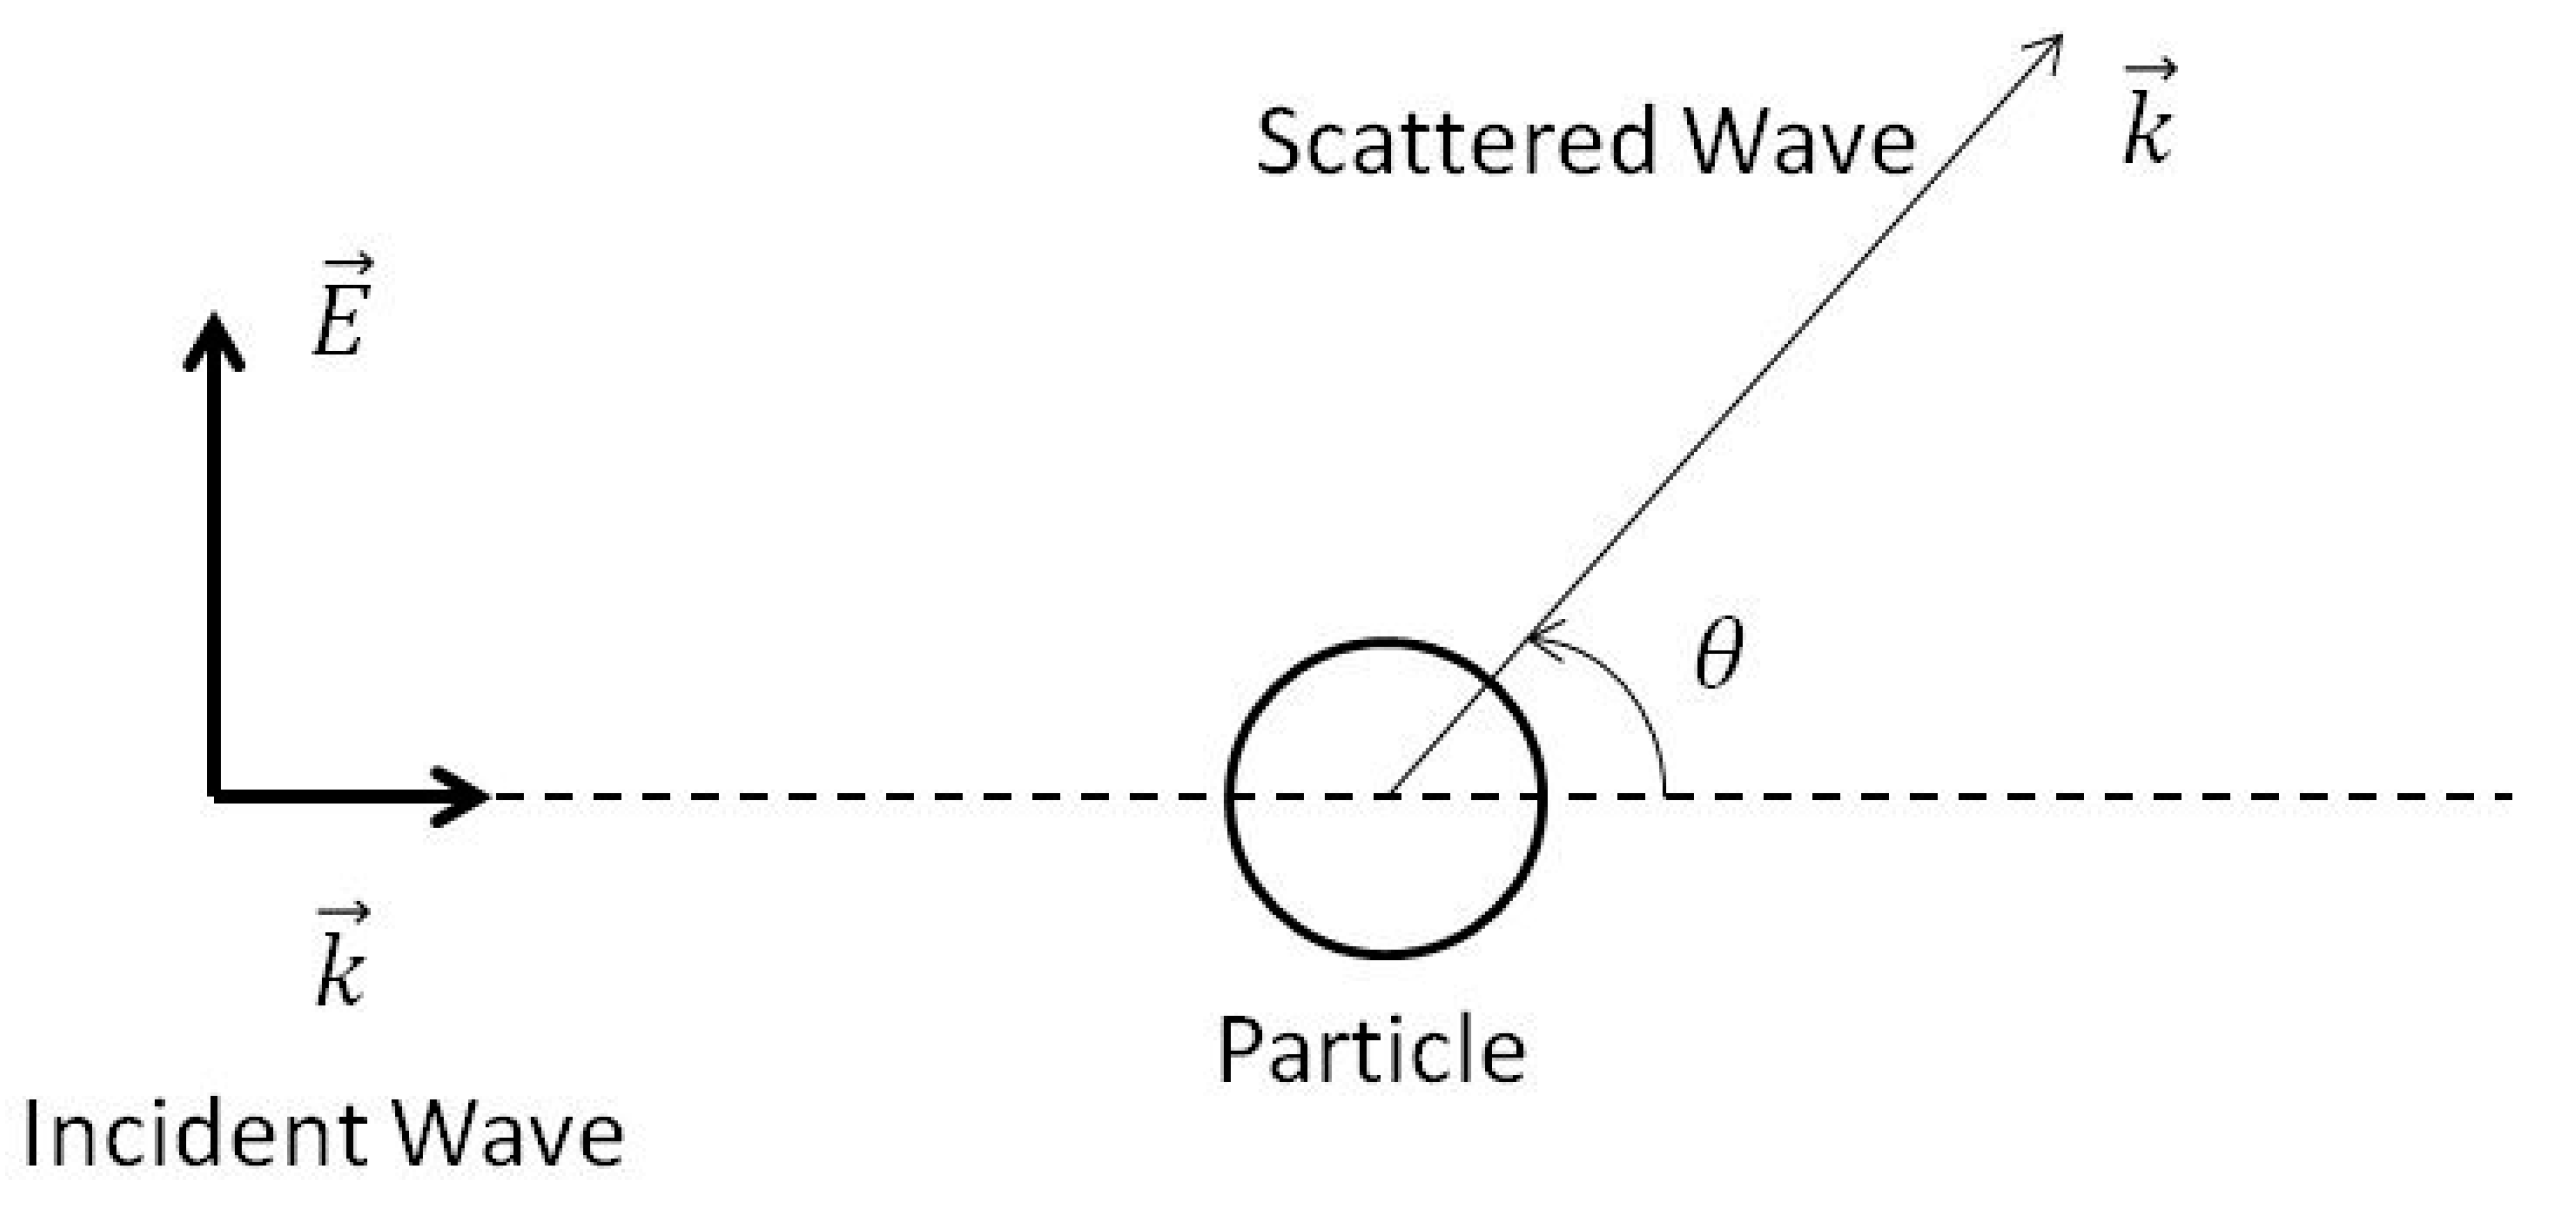
The discrete dipole approximation (DDA), introduced by DeVoe [42], has been considered as one of the most flexible and reliable methods for calculating the optical properties of particles with arbitrary geometries. In using this approximation, the target is replaced by an array of point dipoles (polarizable points). The electromagnetic scattering problem for an incident periodic wave interacting with this array of point dipoles is then solved essentially exactly. Figure 3 demonstrates the schematic of the scattering process of a single dipole with indicating the electric field of the incident light, propagating along the direction. In the current study, a DDA code named DDSCAT 7.3 [43] was applied to calculate the absorption and scattering efficiency GNRs. Draine and Flatau [44] developed and validated the DDSCAT code based on Mie theory. This code has been adopted and validated in several previous studies of gold nanoparticles and assemblies [24,45,46,47].
The amount of absorption and scattering is usually identified by the absorption and scattering coefficients and . The total amount of absorption and scattering is the extinction, which is expressed in the term of the extinction cross section . The dimensionless efficiency factors of these optical properties are commonly used as specified below:
The analytical expressions of the Mie theory for these efficiency factors and for other characteristics of absorption and anisotropic scattering can be found in several texts; e.g., [48,49,50,51,52].
It is important to note that the scattering problem is characterized by the so-called diffraction or size parameter:
where is the radius of a particle and is the wavelength of the incident light.
In DDSCAT, the arbitrary target consists of N dipoles with lattice spacing d.
The size of the target is characterized by the “effective radius” to calculate the arbitrary geometry.
Since the solutions used in this study are aqueous, the refractive index of water, 1.33 + 0i, was applied as the refractive index of the ambient at all wavelengths. The real and imaginary components of the bulk dielectric constant can be calculated using the refractive index of the bulk material:
where n is the index of refraction and k is the index of absorption.
McPeak, et al. [53] measured the values of the complex dielectric function of gold at various wavelengths using a thin film of gold. However, when the target dimension was smaller than the mean free path length of electrons in the bulk material, the limitations to electron collisions within the particle would change the dampening constant of conduction electrons. This would result in size-dependent dielectric constants which are different from the dielectric constants of the bulk material. To account for this, Vollmer and Kreibig [54] developed a model to modify the real and imaginary components of the dielectric constant based on size via an effective relaxation frequency, . This size effect needs to be considered to match the complex dielectric function measured by McPeak, et al. [53]. This is critical for the particles used in this paper, since the effective radius of the GNR was only 8.9 nm. Thus, the modified dielectric constant can be expressed as:
where is the frequency of the incident electromagnetic wave. According to Ordal, et al. [55], the value of bulk plasmon frequency is taken as 9.03 eV and the relaxation frequency of the bulk material, can be assume to be 0.072 eV. The effective relaxation frequency, , can be expressed as:
where the value of the Fermi velocity (equal to m/s) and represents the value of the surface scattering parameter, which was assumed to be 0.3 [56]. The effective mean free path , is taken to be equal to the length of GNR (e.g., nominally 38 nm in this case).
After the real and imaginary parts of the dielectric constant are modified for the size effect, the corresponding index of refraction and index of absorption can be calculated by the following equations:
It is important to note that Mie theory has been originally developed for a single particle in vacuum. Fortunately, all the relations can be easily modified to take into account the spectral index of refraction of a non-absorbing host medium [50,57]. This modification was used in all the calculations of the present paper.
3. Results and Discussion
3.1. Experimental Results
Figure 4a presents a characteristic TEM image of the GNRs used in this study. As can be seen from this image, most of the particles are single nanorods of dimensions near the manufacturer specifications, although several appear to have non-horizontal orientations relative to the detector. In addition, some GNR assemblies were also present. Figure 4b shows the dispersion averaged size (as a percentage) of GNR or GNR obtained from three DLS measurements. Significant deviation in sizes was obtained from repeated DLS analysis, which also indicates that some dynamic clustering may occur for small nanoparticles [58,59]. As can be seen from the size distribution shown in Figure 4b, the majority (~22%) of the detected structures had an effective hydraulic diameter around 55 nm. According to the other experimental studies [58,59], for a gold nanoparticle with a similar size, the discrepancy between the actual and DLS measured size was around 12 nm. Therefore, we concluded that the measured GNRs size appears to be as specified from Sigma-Aldrich® (St. Louis, MO, USA).
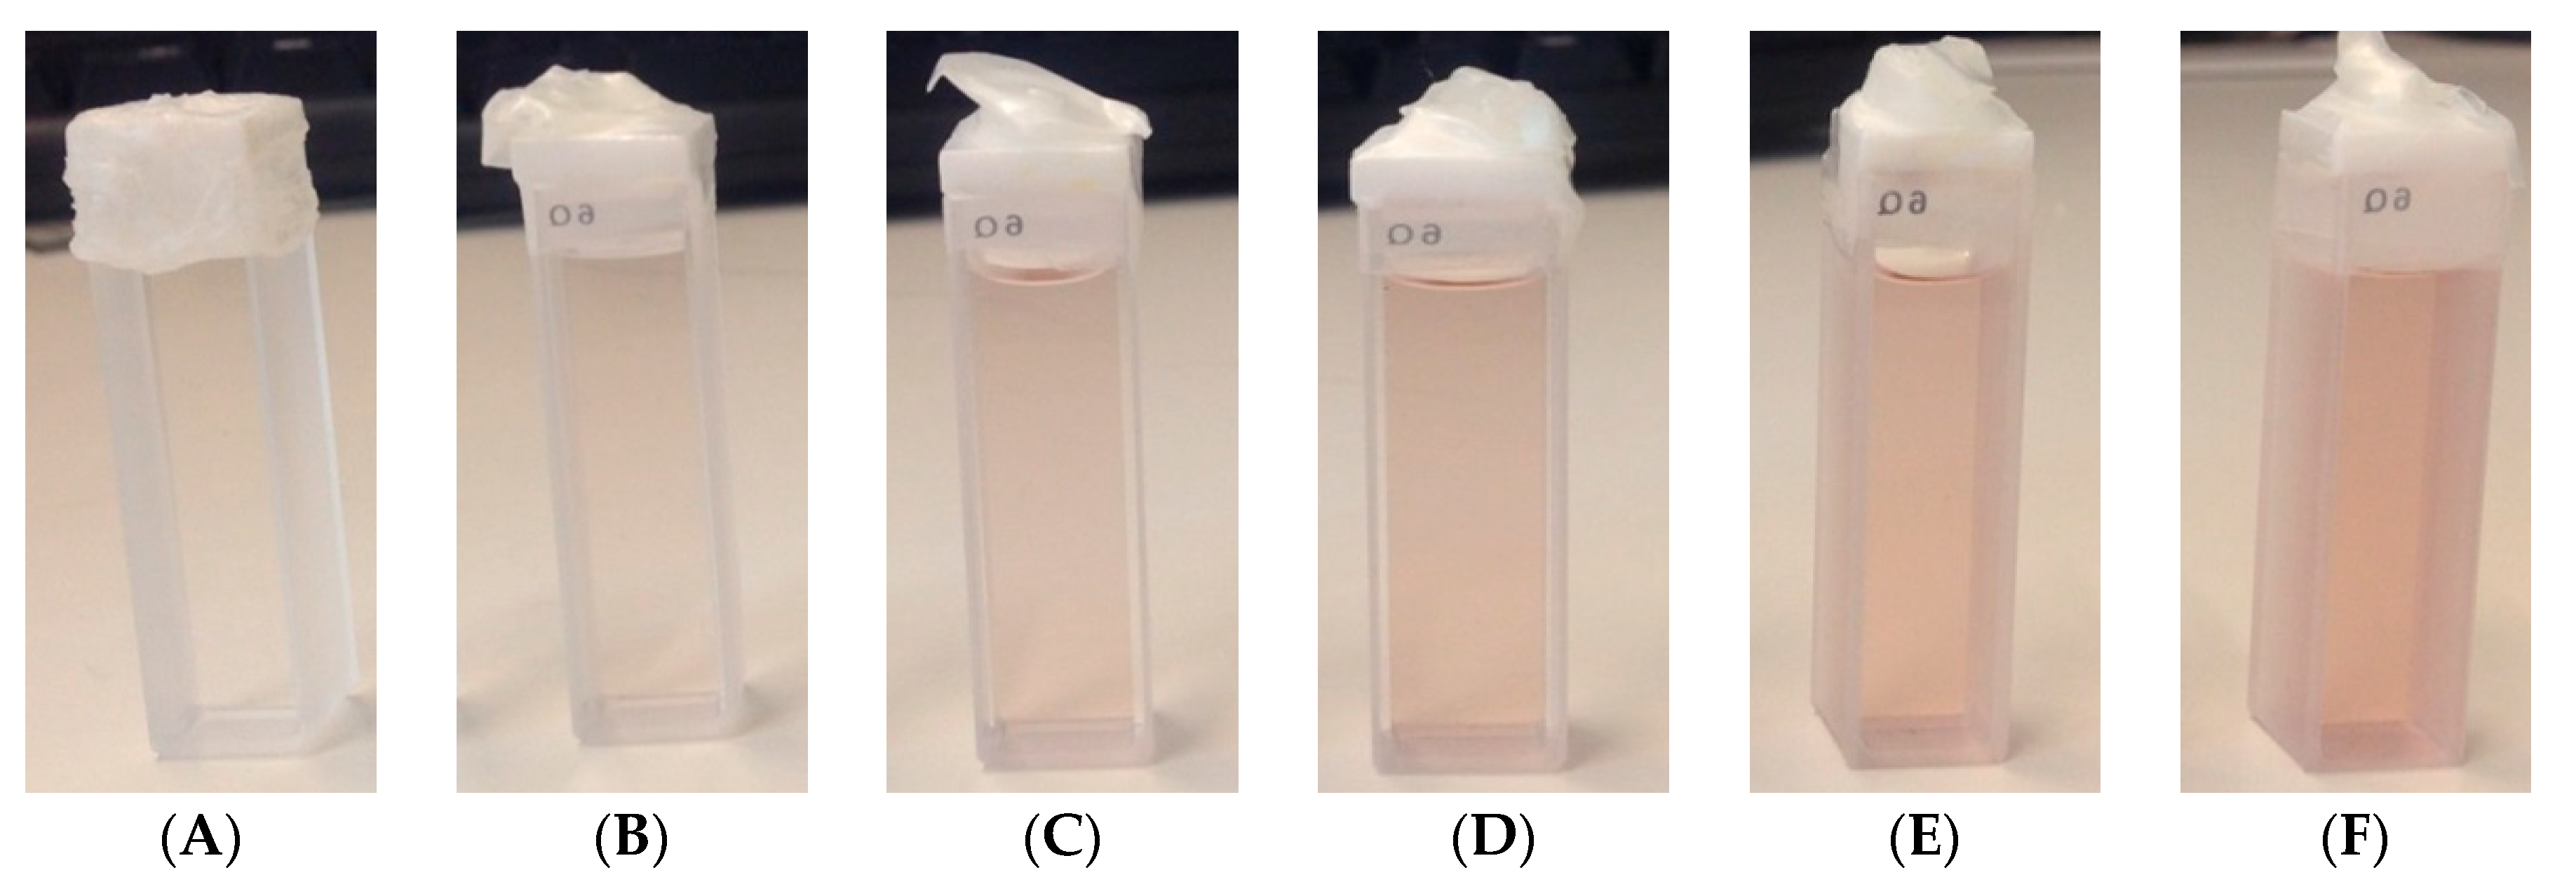
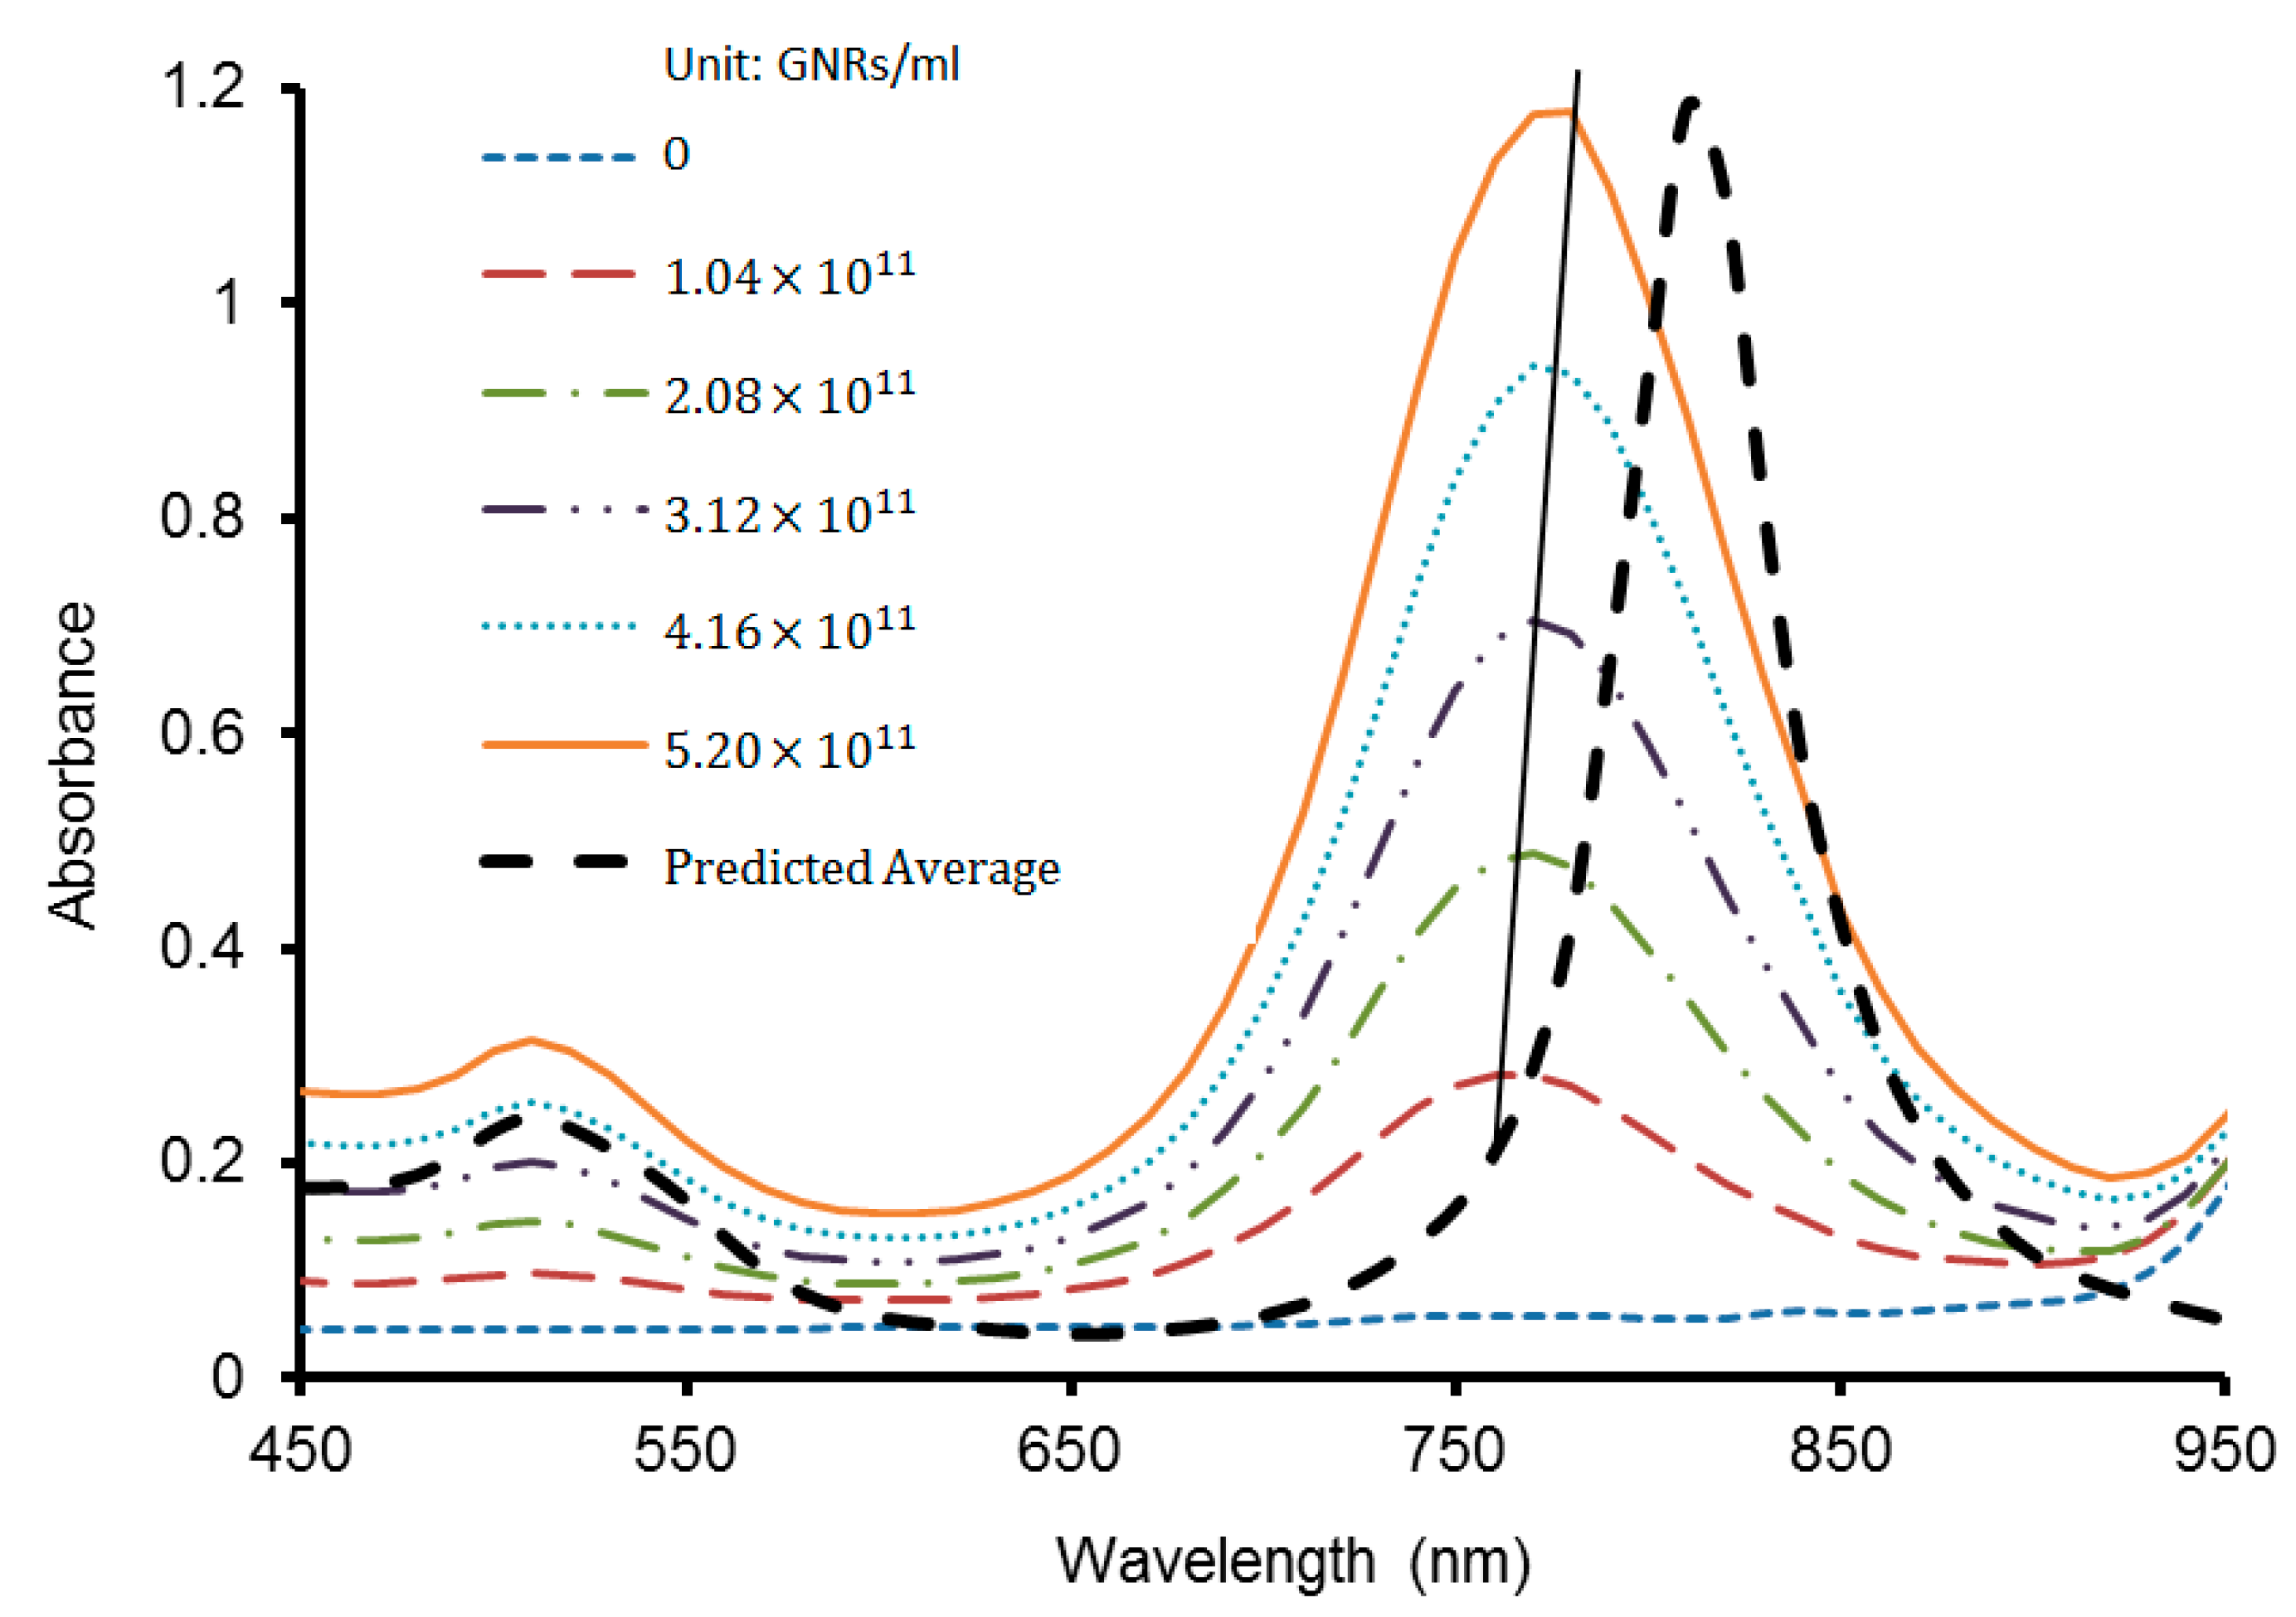
In Figure 5, from the left to the right, the samples were labelled A, B, C, D, E, and F. For gold nanorods the plasmonic absorption is characterized by two bands, corresponding to the oscillation of the free electrons along and perpendicular to their long axis [60,61]. The transverse mode shows a resonance at about 520 nm, which is co-incident with the plasmon resonance of spherical particles of the same diameter, while the resonance of the longitudinal mode is red-shifted and strongly depends on the AR of the nanorods. The presence of these two modes can be clearly observed in the results for the absorbance at 520 nm and 780 nm measured in the optical experiment and shown in Figure 6. The yellow solid line in Figure 6 indicates the maximum of absorbance depending on wavelength, which was slightly red-shifted. This red shift of the SPR occurred has been reported to be due to aggregation of nanoparticles [29,62]. Therefore, a slight red shift in the longitudinal SPR (see Figure 6) can be attributed to GNR aggregations, which showed an increasing (albeit diminishing return) trend with the GNR volume fraction. The difference in absorbance between Sample E and Sample D was 0.19, while the increase for Sample F was 0.16. These results suggested that for medical treatment an appropriate volume fraction of GNRs should be identified and applied to generate the necessary amount of heat with a minimum total injected mass of gold. Therefore, it is important to quantify the relationship between the capability of heat generation and the volume fraction of gold nanorods solutions.
For comparison, the numerically predicted absorbance averaged for different orientations of nanorods for the solution with the same volume fraction as in the sample F was also shown in Figure 6. The discrepancy between experimental and numerical results can be explained from the fact that in the numerical calculation, a single GNR in the size of exact 10 × 38 nm was analyzed. However, the width and length of the GNRs in the solution as specified by manufacturer, could vary by up to 10% of this size, thus the aspect ratio may not be exactly 3.8 and could vary from 3.36 to 4.33. As will be shown later, such a variation can cause a change in both absorption efficiency and the wavelength of the SPR. More specifically, for GNRs with AR of 3.36 and 4.33, the wavelength of SPR will be around 767 nm and 864 nm, respectively. The difference could also be caused by the aggregations of GNRs in the samples, which are clearly present in the dispersion as shown in Figure 4b.
The current study mainly focused on the shift of LSPR of GNR and aggregations and although DDA can underestimate the broadening of the absorption spectra, the method has been proved sufficiently accurate by previous research studies [24,63,64,65], for predicting the wavelength of longitudinal surface plasmonic resonance (LSPR). The light source applied in this work had a bandpass filter that only allowed light from 770 nm to 790 nm wavelength be transmitted, thus underestimated broadening from DDA would not significantly affect result of the temperature increase.
Table 2 shows the results of absorbance and temperature increase in the solutions of the optical and thermal experiments obtained at 780 nm wavelength. The averaged values of local temperature increases were recorded after a 300 s exposure to the filtered light source. The averaged results were obtained after three measurements of each sample. The measured temperature change of Sample A (pure water) was 0.05 K. Note that the Hydrosun® 750 (Müllheim, Germany) light source contains a water filter, so the remaining spectrum has minimal energy left for pure water absorption. As a baseline, however, 0.05 K has been deducted from the measured temperature increase of Samples D, E and F in Table 2. A correlation with the absorbed intensity measured in the optical experiment can be seen in Table 2. When the volume fraction of GNRs in the samples changed from to , both the absorption and heat generation showed obvious increases. In Sample E the absorbance increased by 12% causing temperature increase 0.25 K higher than in the solution with lower concentration, whereas in Sample F the absorbance increased by 16% causing a temperature increase 0.1 K higher than in Sample E. One possible reason of the insignificant increase of temperature in Sample F was that there was more light scattered by Sample F than by Sample E. The results of the optical and thermal experiments confirm that the heat generated in the solutions depends on the light energy, which could be potentially absorbed by the GNRs. As can be seen from Table 2, in Sample E the temperature increase was around 0.4 K, which was only 0.1 K lower than in the reference solution (Sample F). The GNRs solution with a volume fraction of was, therefore, the most appropriate solution in this case, because it could generate a similar amount of heat as the reference solution with less material, which was beneficial in terms of cost and possible toxicity. The expected temperature for hyperthermia was not reached because of the low intensity of the lamp utilized in the experiment. An alternative light source, such as a continuous wave (CW) NIR laser with adjustable intensity, can be applied to ensure a higher temperature increase, without exceeding the therapeutic intensity limit.
3.2. Numerical Predictions
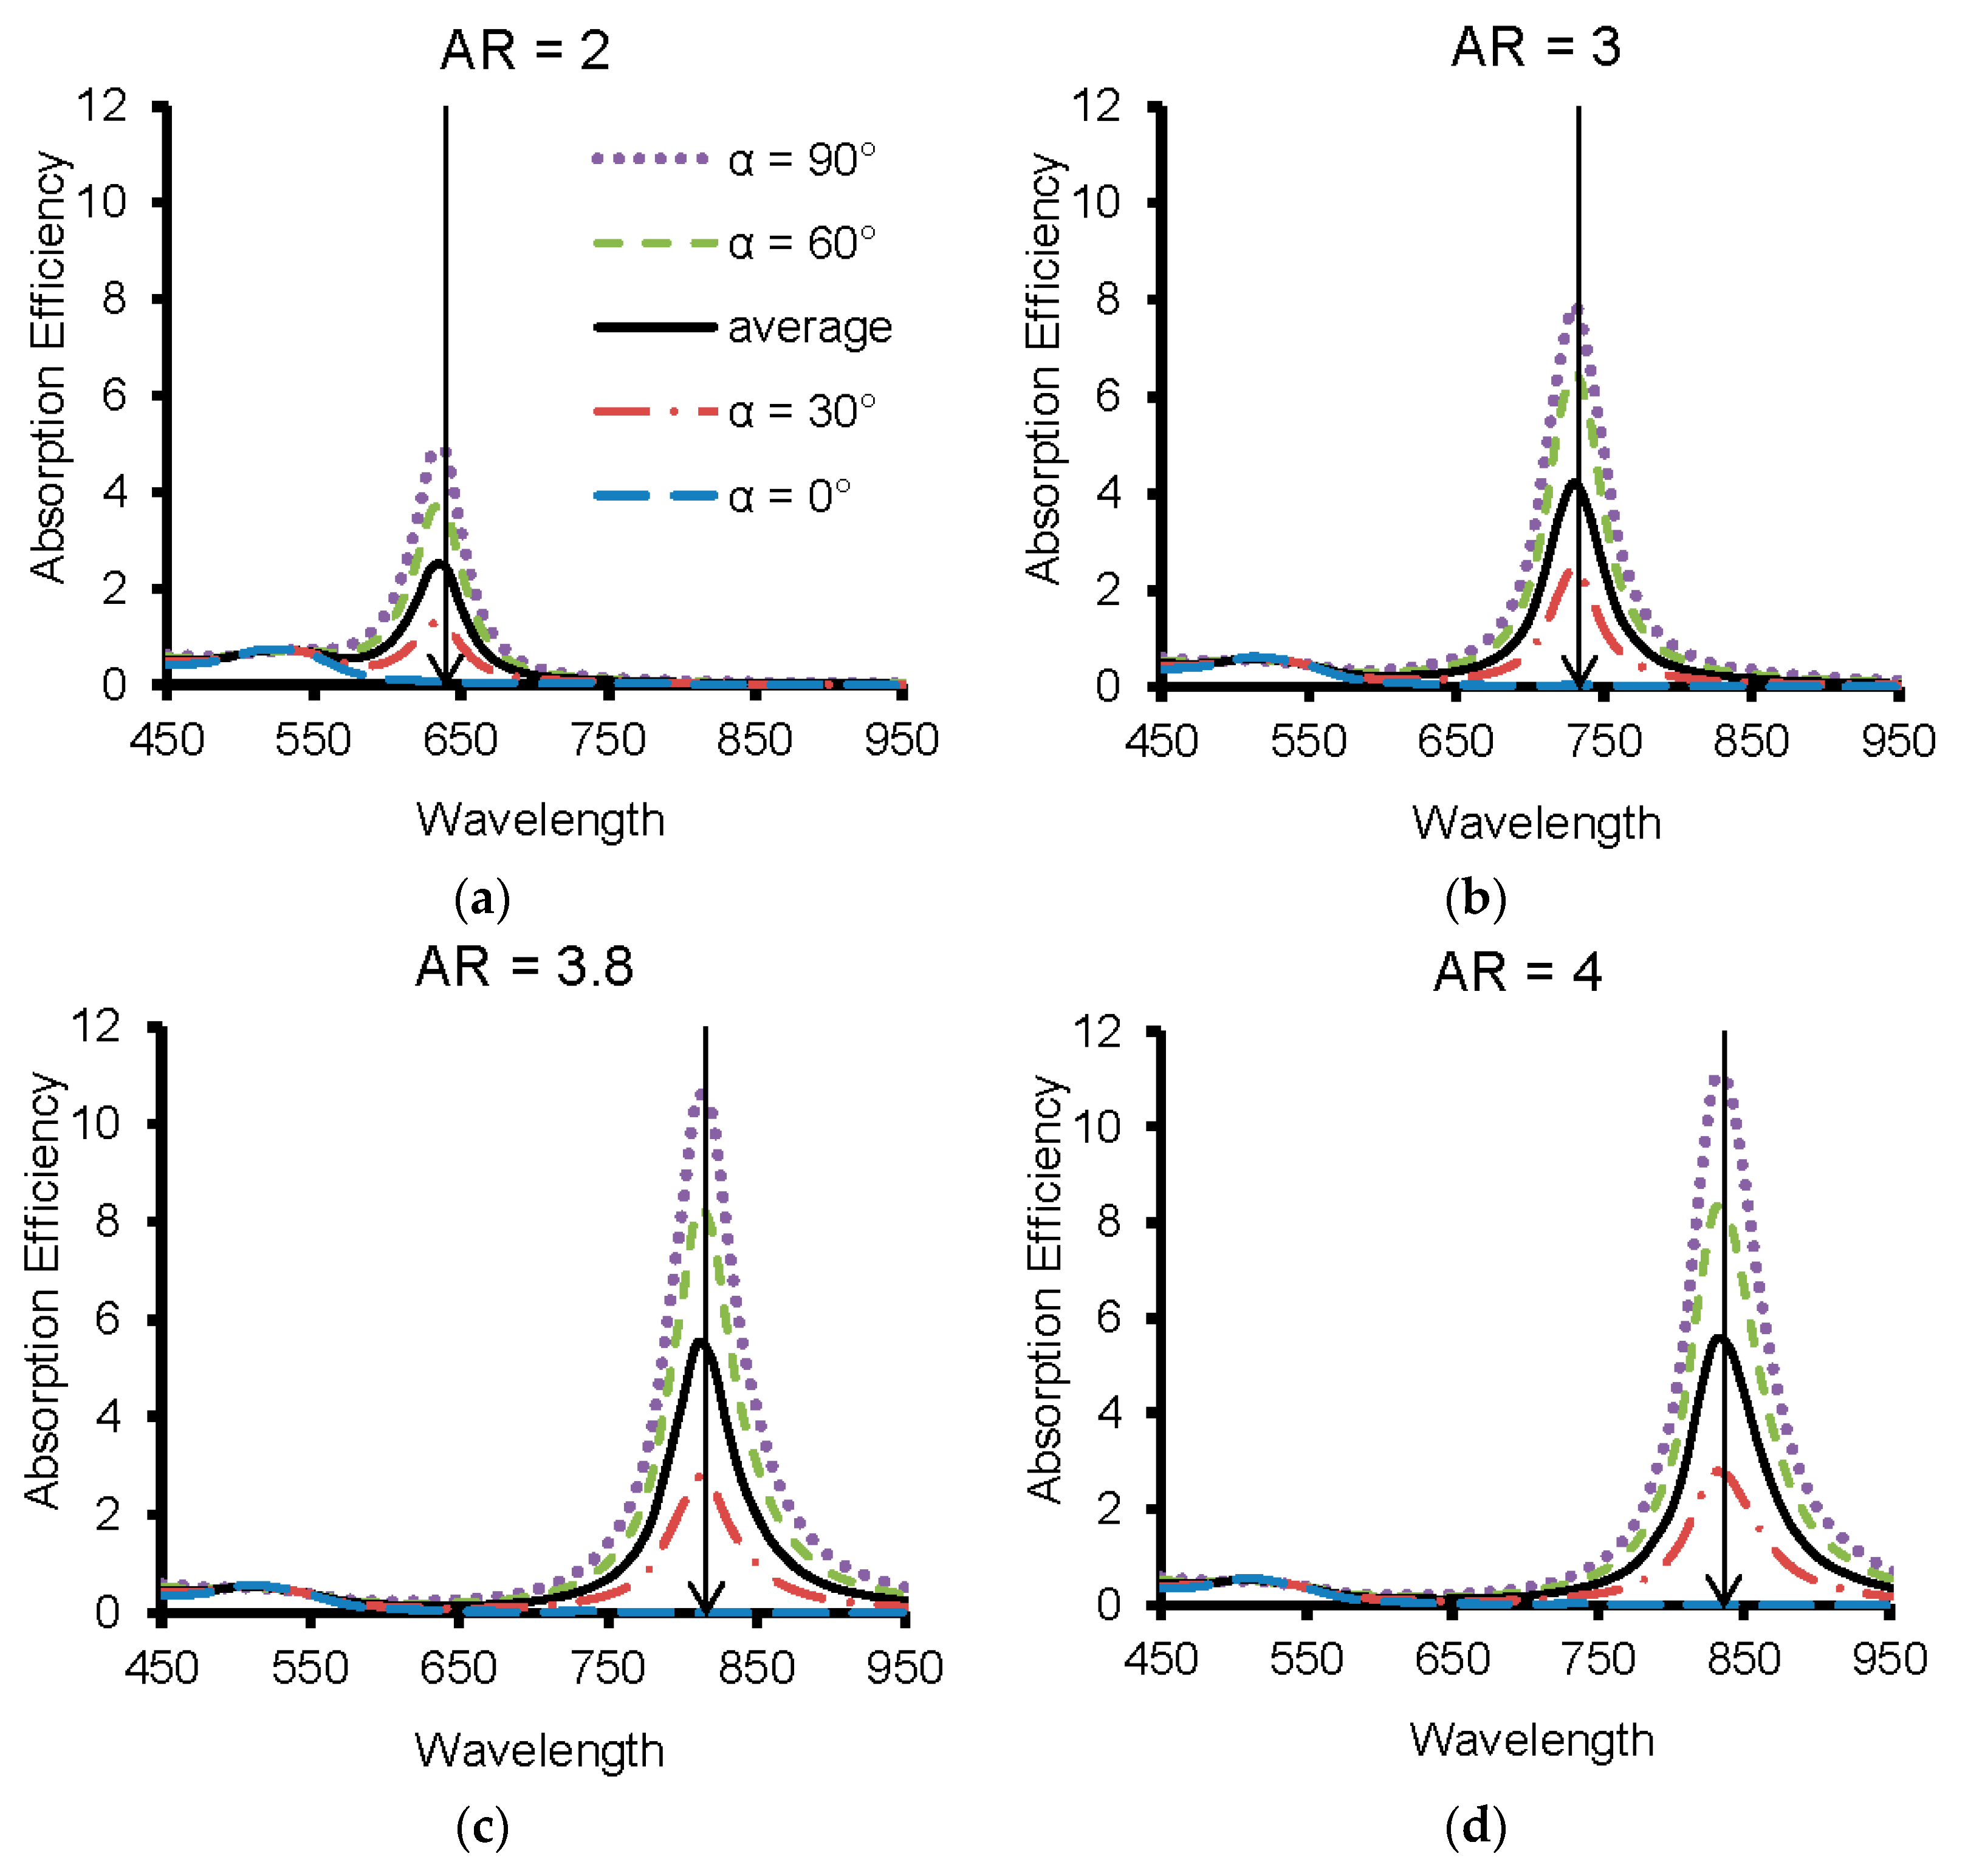
The discrete dipole approximation (DDA) was employed to calculate the optical properties of a single GNR for each particular shape and orientations and also GNR dimers. The optical properties of a single GNR highly depend on the angle () between its optical axis and the propagation direction of the light. Figure 7 presents the calculated absorption efficiency of a single GNR with various ARs at different orientations. The arrow in each figure indicates the longitudinal SPR of GNR. It is clearly shown in each figure that the wavelength LSPR did not vary with the direction of incident light. As can be seen from Figure 7c, the wavelength of the longitudinal SPR of a single GNR was around 800 nm and did not change with the angle. The wavelength of the transverse SPR was around 500 nm, which was same as the value obtained in the experiment. The solid curves in Figure 7 indicate the average absorption efficiency of GNR at different orientations. The highest absorption efficiency was achieved when the axis of GNR was perpendicular to the incident light. However, the absorption efficiency at the wavelength of longitudinal SPR was nearly 0, when the axis of GNR was parallel to the incident light. The magnitude of the transverse SPR was less than 1 so it was insignificant compared to the longitudinal SPR. Although the GNR showed high absorption efficiency at the wavelength of longitudinal SPR, the orientations of the GNRs suspended in water can cause the absorption efficiency vary from 12 to nearly 0. The spectral of GNRs shown in Figure 7a–c experience a clear red shift with the increase of aspect ratio. This red shift evidences that the SPR of a single GNR can be significantly affected by the shape of the nanoparticles.
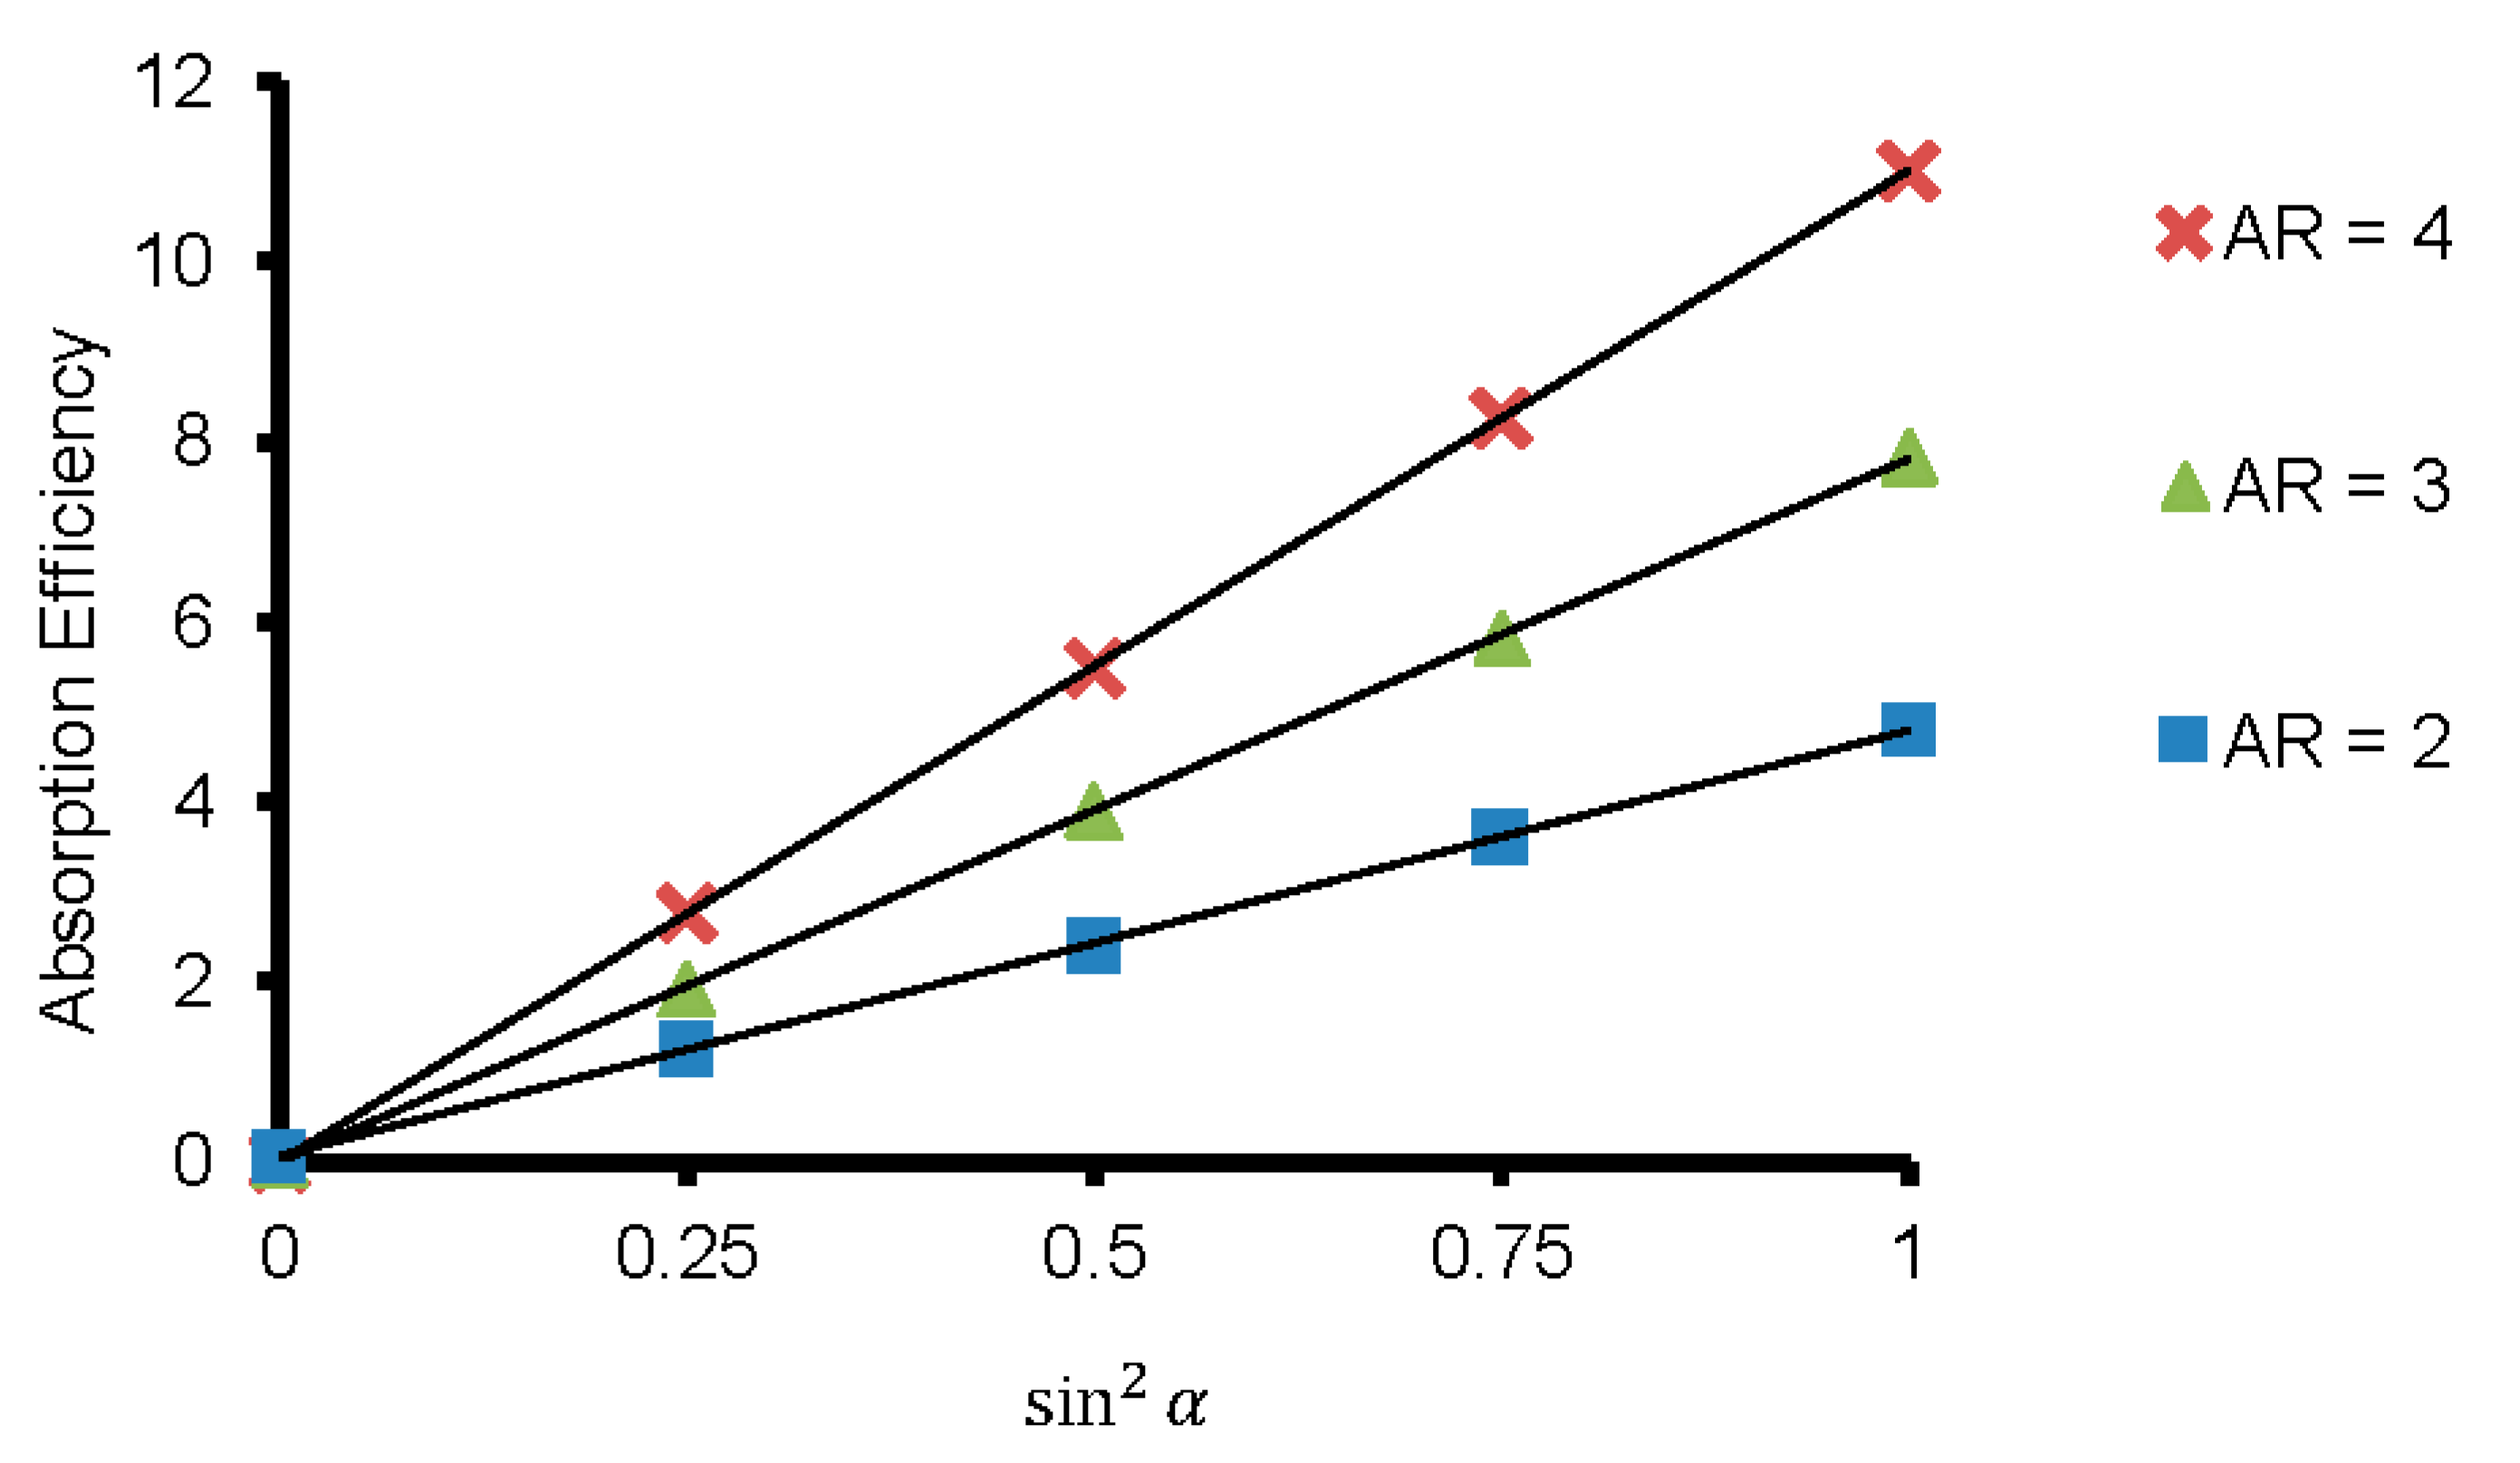
The absorption efficiency of GNRs (AR = 2, 3 and 4) for five different orientations at each plasmonic resonance wavelength is presented in Figure 8. The predictions indicate that optical properties of GNRs highly dependent on , which is the angle between its optical axis and the propagation direction of the light source. Figure 8 shows the linear relationship between the absorption efficiency and of the GNRs. More specifically, the highest absorption efficiency of an independent GNR occurred when the GNR was perpendicular to the propagation direction of the incident light. However, this also indicates that the absorption efficiency could be negligible if the optical axis of the GNR is parallel to the propagation direction of the light.
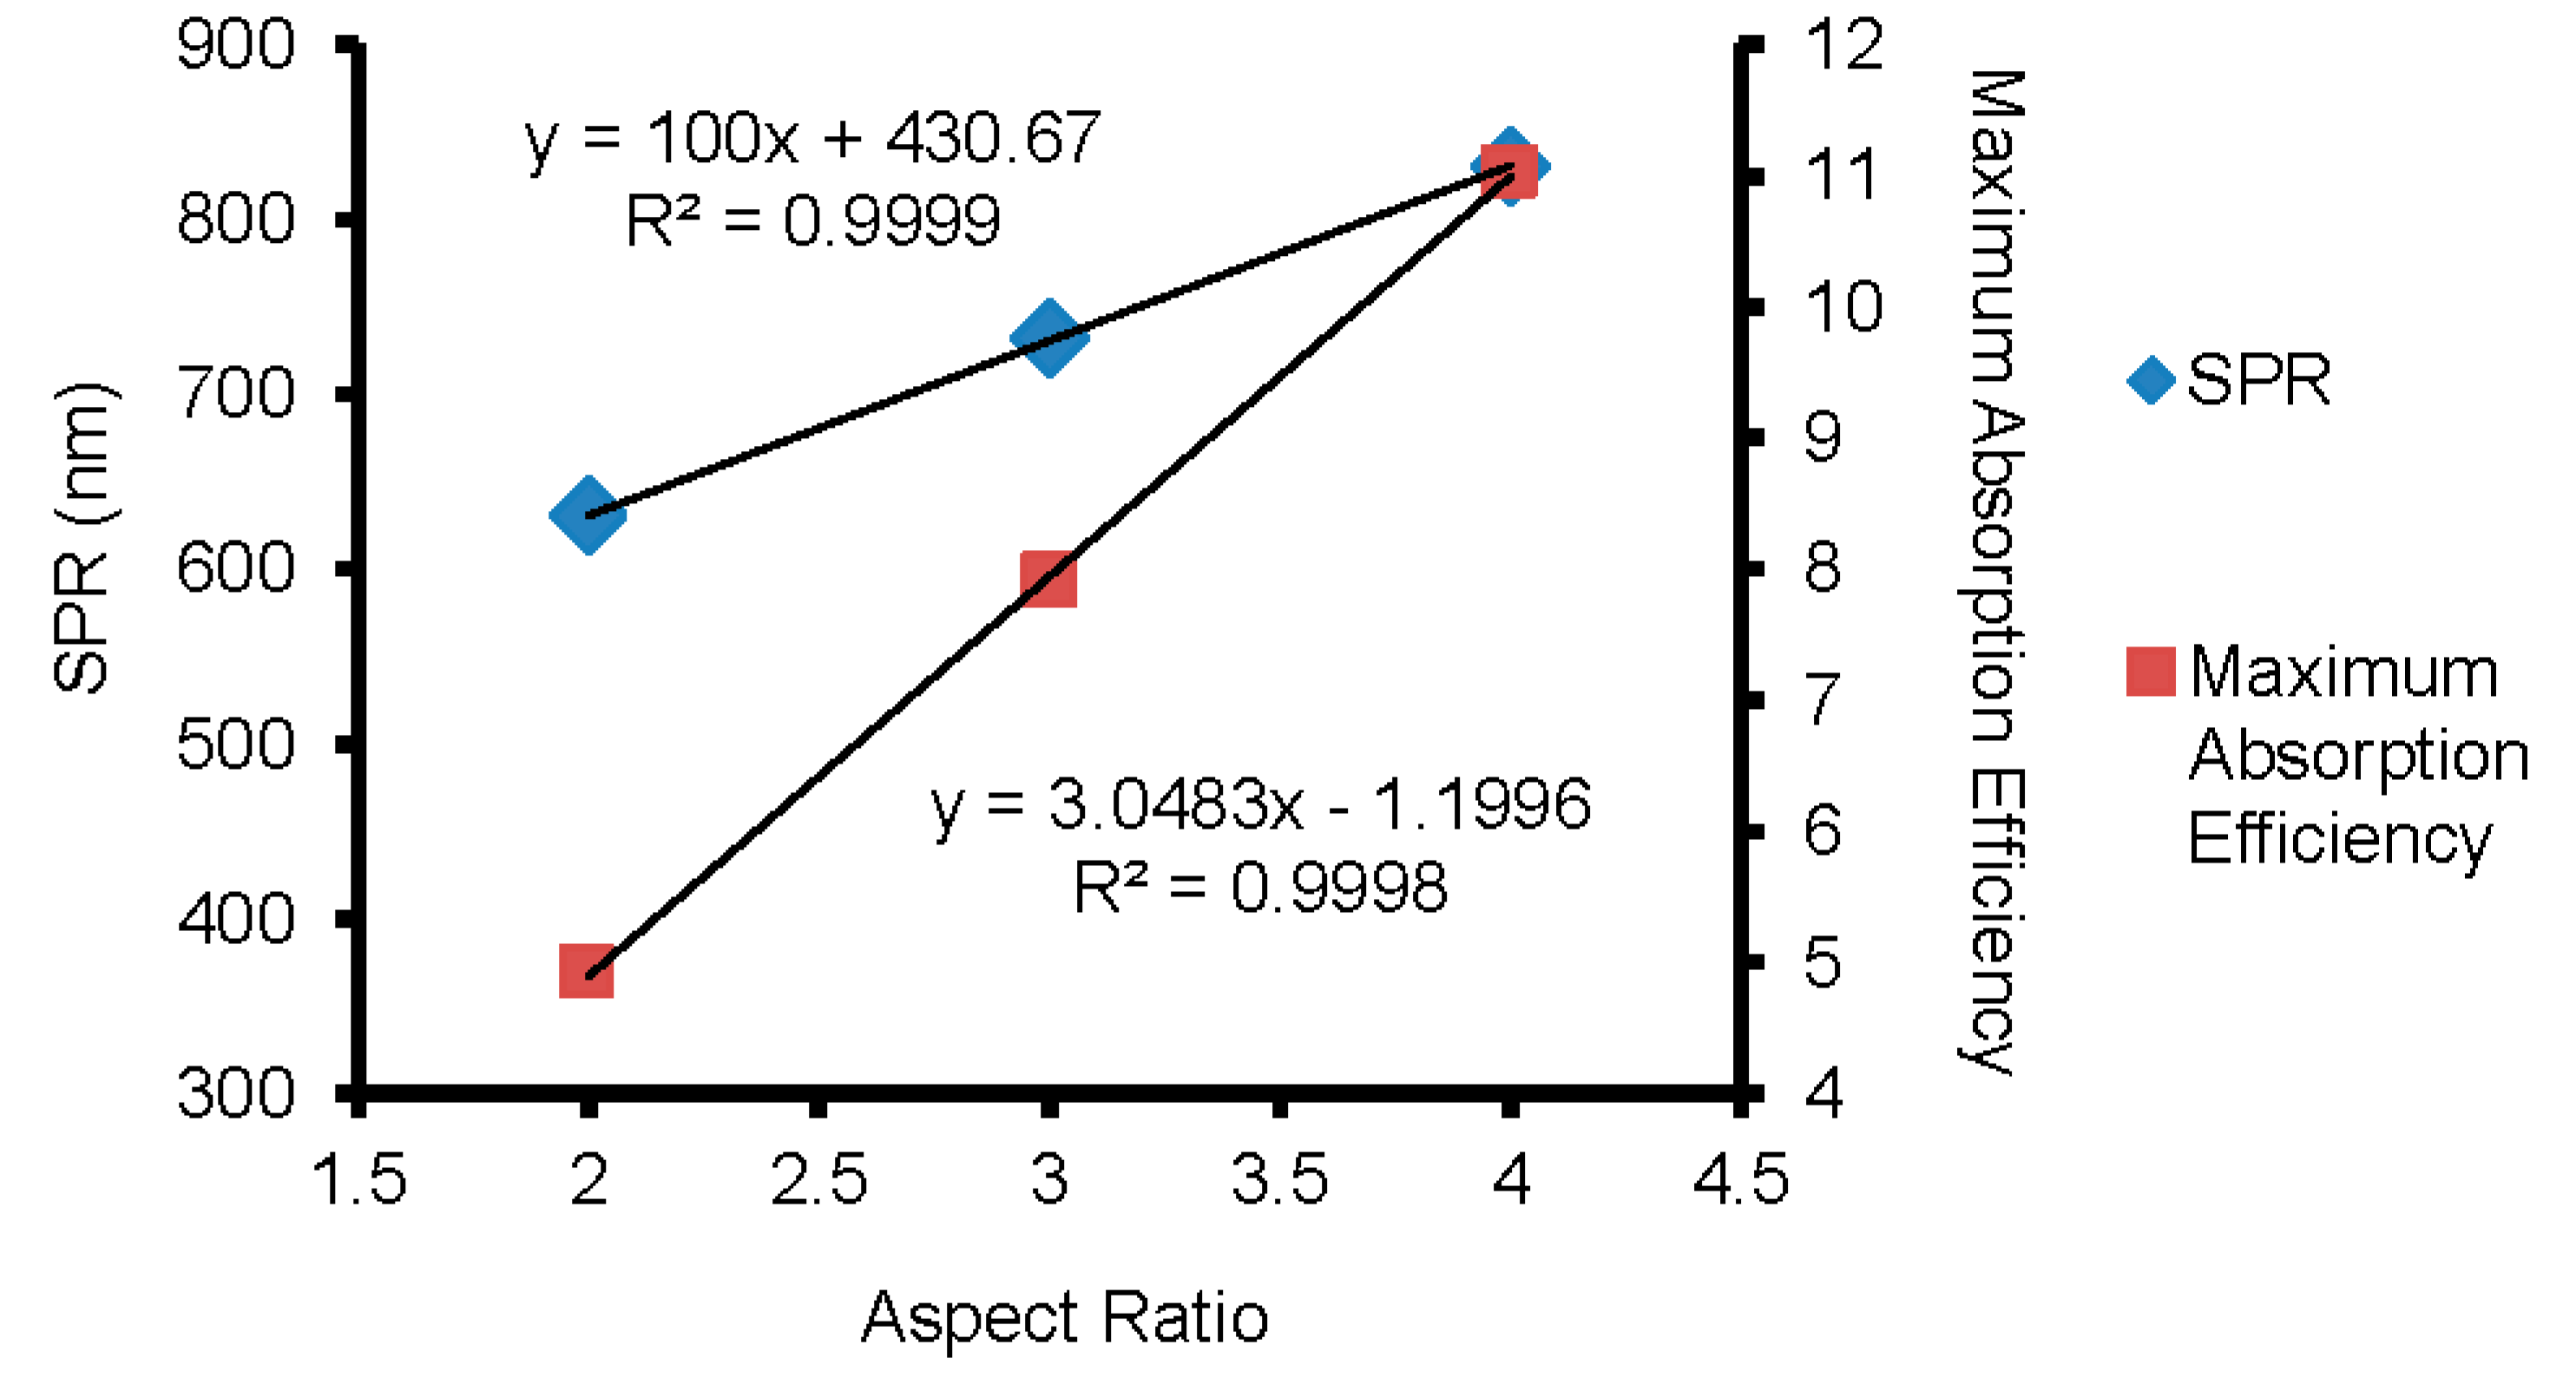
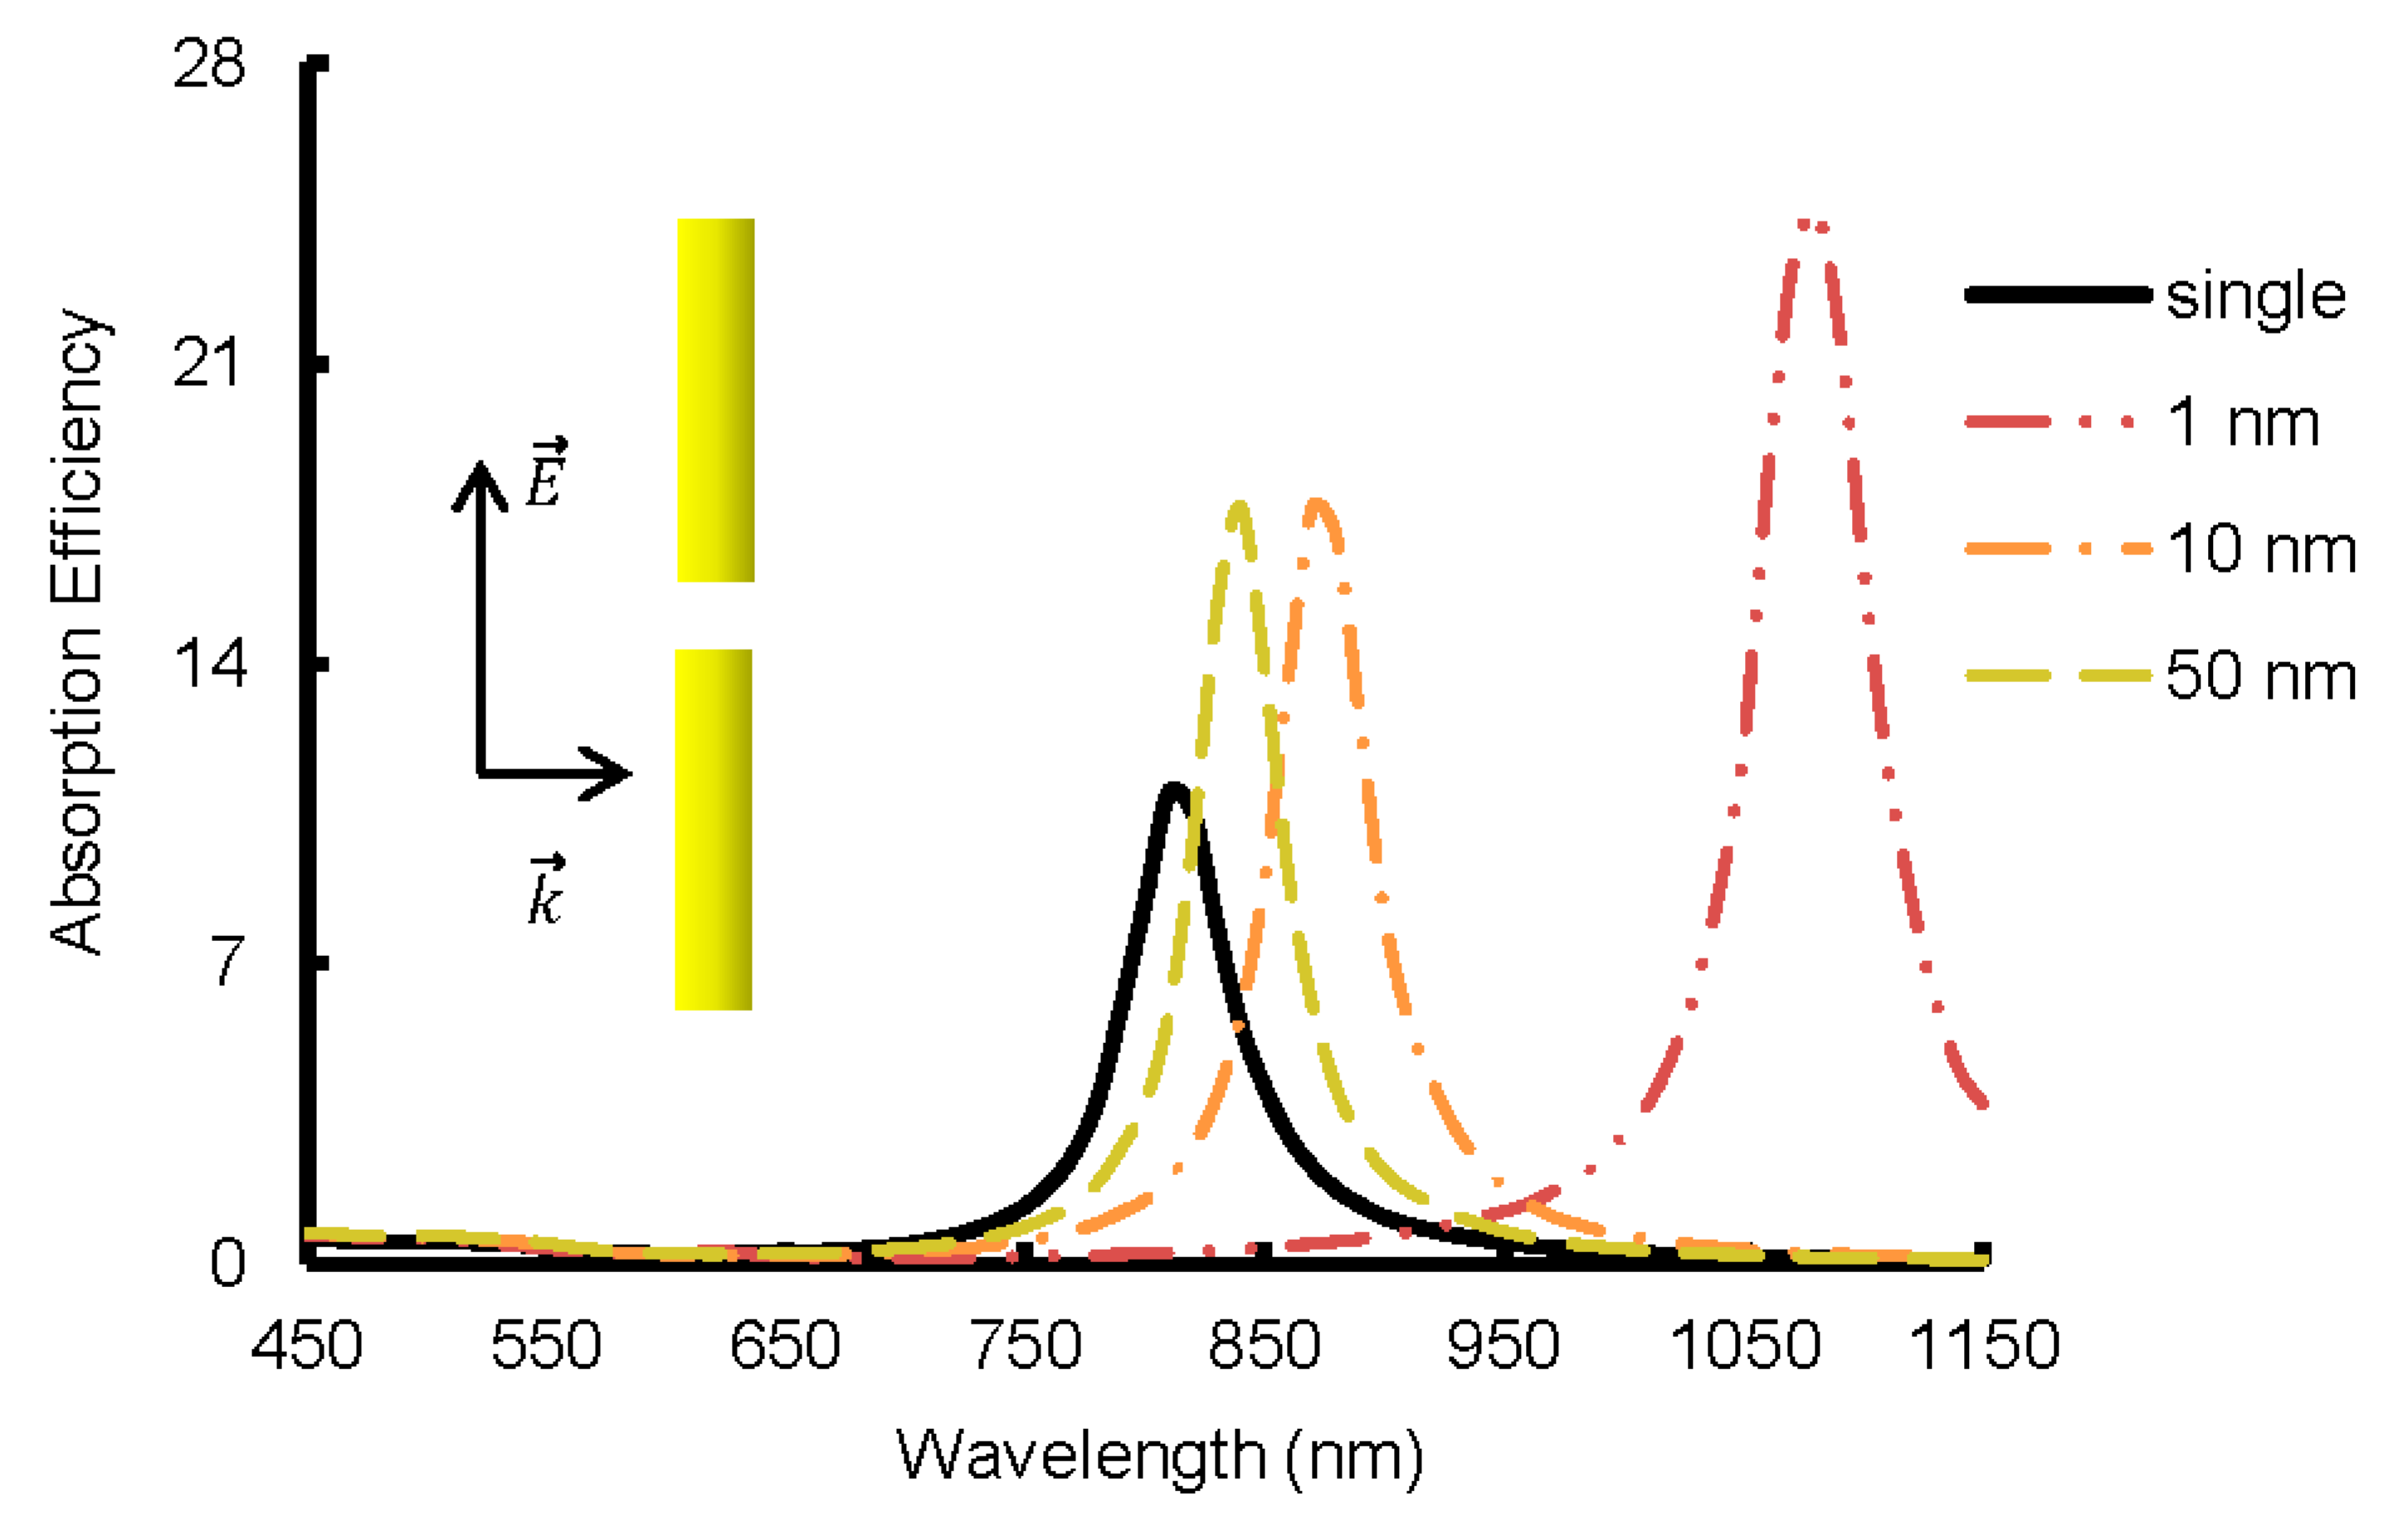
As can be seen in Figure 9, the wavelength of longitudinal SPR and the extinction efficiency at this wavelength increased linearly with the aspect ratio of the GNR. Results shown in Figure 9 were obtained for the perpendicular orientation of the GNR (), with the effective radius being fixed at 8.9 nm. The wavelength of the SPR for GNR with aspect ratio AR = 3.8 calculated from the linear equation shown in Figure 9 was 810 nm, which was the same as obtained from the DDA predictions shown in Figure 6. The plasmonic resonance of absorption efficiency also showed a linear relationship with the aspect ratio in Figure 9. It should be noted that the absorption efficiency presented by red marks in Figure 9 was obtained for each aspect ratio at correspondent SPR wavelength shown as blue marks in the same figure. The wavelength of the longitudinal SPR of GNR solutions, as measured in the optical experiment, was equal to 780 nm. While using the DDA method, the wavelength of longitudinal SPR of a single GNR was around 810 nm. This discrepancy results from the fact that the width and length of the GNRs in the solution could vary by up to 10% of this size, resulting in an aspect ratio that could vary from 3.36 to 4.33. The difference could also be caused by the aggregations of GNRs in the solutions. Clustering alone can shift the wavelength of the SPR from 700 nm to 1100 nm depending on the configuration, as demonstrated in Figure 10 and Figure 11.
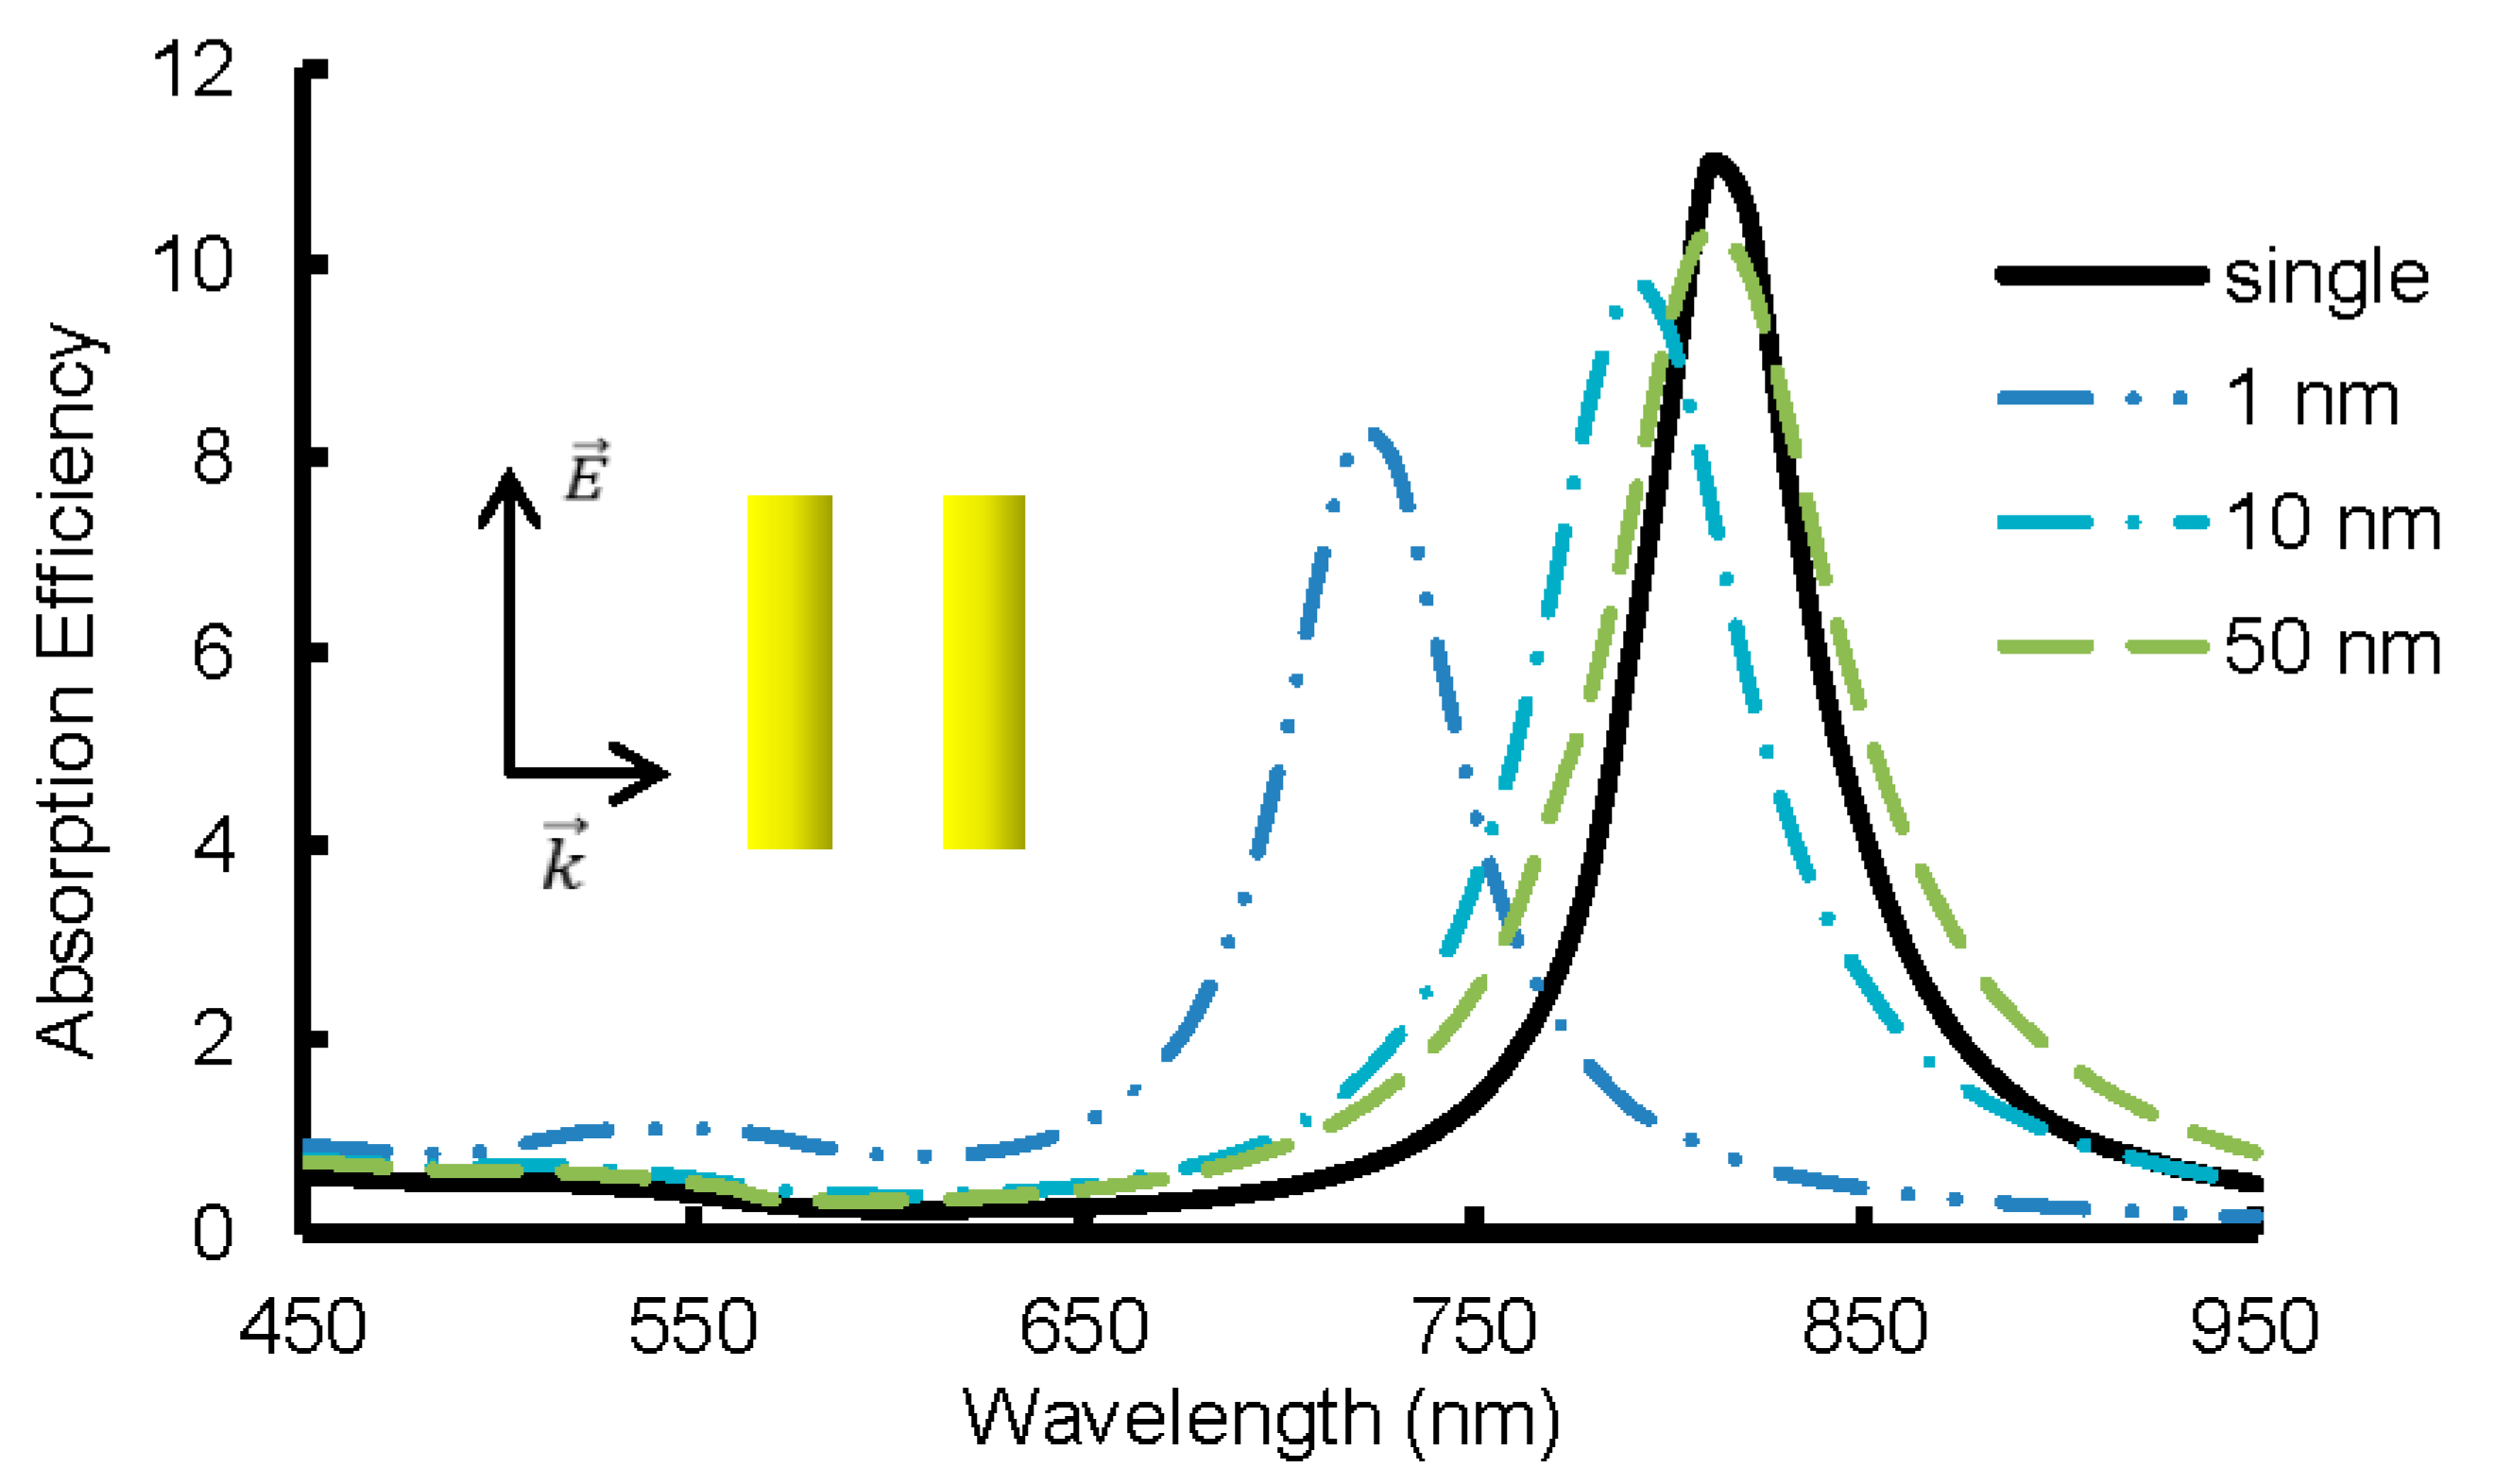
Figure 10 and Figure 11 present the shift in the wavelength of the SPR for two basic aggregation types, end-to-end and side-by-side, with various gaps between the nanorods. The distance between GNRs varied from 1 nm to 50 nm. As can be seen from both figures, the optical properties of the GNRs approach the fully dispersed case of a single GNR when the distance between two nanorods was increased up to 50 nm. As shown in Figure 10, the SPR of the end-to-end assembly experienced a red shift from 810 nm to over 1100 nm when the gap was 1 nm because this type of aggregation of GNRs effectively enlarged the value of aspect ratio of a single GNR, which was in agreement with results predicted by Jain and El-Sayed [29] and Sun, et al. [28]. Although the absorption efficiency of the end-to-end assembly with a small gap was significantly higher than a single independent GNR, the longitudinal SPR wavelength was around 1100 nm, which was not within the range of the optical tissue window. Therefore, the aspect ratio of either GNRs or GNRs aggregate should not be too large. For the side by side configuration shown in Figure 11, when the distance between GNRs was about 50 nm or less a blue shift and broadening of the resonance peak in the optical spectrum were obtained. The most significant shift was observed when the distance was smaller than 10 nm. The resulting blue shift when the gap was shorter than 50 nm can be attributed to an effective decrease of the aspect ratio when the side-by-side assembly was used.
By analyzing the experimental and numerical results shown in Figure 6, Figure 10, and Figure 11, it can be concluded that the GNRs in the samples preferentially formed numerous side-by-side assemblies because the longitudinal SPR measured in the experiment was around 770 nm wavelength. With the increase of the concentration, the GNRs also formed some end-to-end assemblies, providing a slight red shift of SPR in Figure 6.
4. Conclusions
Identifying the volume fraction and particle size of GNR solution is one of the most critical tasks when GNRs are used for hyperthermia applications. To gain insight into the most useful selection of GNR solutions, a systematic investigation of the optical properties and radiation efficiency of GNR solutions and aggregations was undertaken for different sizes and morphologies of GNRs. By comparing the results of the optical and thermal experiment, it was found that when irradiated by NIR light, the 10 × 38 nm GNR solution with a volume fraction of was effective because the temperature increase was similar to the temperature increase of the reference sample, with less material required. A linear relationship between the absorption efficiency and of a single gold nanorod was numerically obtained. Additionally, the plasmonic resonance wavelength and absorption efficiency of a gold nanorod both increased linearly with the aspect ratio of the nanorod. The spectra of end-to-end and side-by-side GNR assemblies were also investigated. These showed a shift and broadening of the resonance peak when the distance between the nanorods was 50 nm or less. Moreover, the SPR can shift significantly from 700 nm to over 1100 nm wavelength when the gap was smaller than 10 nm. The direction of this shift depends on the configuration. These results indicate that it may be possible to preferentially, and beneficially, control particle clustering in hyperthermia applications.
Author Contributions
X.G. performed the experiments and analyzed the data together with V.T.; G.H.Y., L.D. and R.T. conceived and designed the experiments; X.G. and V.T. wrote the paper.
Funding
“This research was funded by Instituto Nacional de Ecología y Cambio Climático (INECC) grant number [INECC/A1-009/2014]”.
Acknowledgments
This research is supported by the Australian Research Council (ARC Project ID DP150101065). We would like to thank Natasha Hjerrild for preparing the samples and providing equipment for the optical experiments. We also acknowledge the contributions of Nur Amalina Omar and Felipe Crisostomo for the assistance rendered in setting up the thermal experiments.
Conflicts of Interest
The authors declare no conflict of interest.
References
- Alves, A.F.; Mendo, S.G.; Ferreira, L.P.; Mendonça, M.H.; Ferreira, P.; Godinho, M.; Cruz, M.M.; Carvalho, M.D. Gelatine-assisted synthesis of magnetite nanoparticles for magnetic hyperthermia. J. Nanopart. Res. 2016, 18, 1–13. [Google Scholar] [CrossRef]
- Austin, L.A.; Mackey, M.A.; Dreaden, E.C.; El-Sayed, M.A. The optical, photothermal, and facile surface chemical properties of gold and silver nanoparticles in biodiagnostics, therapy, and drug delivery. Arch. Toxicol. 2014, 88, 1391–1417. [Google Scholar] [CrossRef] [PubMed]
- Bayazitoglu, Y.; Kheradmand, S.; Tullius, T.K. An overview of nanoparticle assisted laser therapy. Int. J. Heat Mass Transf. 2013, 67, 469–486. [Google Scholar] [CrossRef]
- Huang, X.; El-Sayed, M.A. Plasmonic photo-thermal therapy (pptt). Alex. J. Med. 2011, 47, 1–9. [Google Scholar] [CrossRef]
- Huang, X.; Jain, P.K.; El-Sayed, I.H.; El-Sayed, M.A. Plasmonic photothermal therapy (pptt) using gold nanoparticles. Lasers Med. Sci. 2008, 23, 217–228. [Google Scholar] [CrossRef] [PubMed]
- Melancon, M.P.; Lu, W.; Yang, Z.; Zhang, R.; Cheng, Z.; Elliot, A.M.; Stafford, J.; Olson, T.; Zhang, J.Z.; Li, C. In vitro and in vivo targeting of hollow gold nanoshells directed at epidermal growth factor receptor for photothermal ablation therapy. Mol. Cancer Ther. 2008, 7, 1730–1739. [Google Scholar] [CrossRef] [PubMed] [Green Version]
- O’Neal, D.P.; Hirsch, L.R.; Halas, N.J.; Payne, J.D.; West, J.L. Photo-thermal tumor ablation in mice using near infrared-absorbing nanoparticles. Cancer Lett. 2004, 209, 171–176. [Google Scholar] [CrossRef] [PubMed]
- Thovhogi, N.; Sibuyi, N.; Meyer, M.; Onani, M.; Madiehe, A. Targeted delivery using peptide-functionalised gold nanoparticles to white adipose tissues of obese rats. J. Nanopart. Res. 2015, 17, 112–120. [Google Scholar] [CrossRef]
- Wang, C.; Li, X.; Wang, Y.; Liu, Z.; Fu, L.; Hu, L. Enhancement of radiation effect and increase of apoptosis in lung cancer cells by thio-glucose-bound gold nanoparticles at megavoltage radiation energies. J. Nanopart. Res. 2013, 15, 1642–1654. [Google Scholar] [CrossRef]
- Huang, X.; El-Sayed, I.H.; Qian, W.; El-Sayed, M.A. Cancer cell imaging and photothermal therapy in the near-infrared region by using gold nanorods. J. Am. Chem. Soc. 2006, 128, 2115–2120. [Google Scholar] [CrossRef] [PubMed]
- Knight, D.A.; Nita, R.; Moore, M.; Zabetakis, D.; Khandelwal, M.; Martin, B.D.; Fontana, J.; Goldberg, E.; Funk, A.R.; Chang, E.L. Surface plasmon resonance promotion of homogeneous catalysis using a gold nanoparticle platform. J. Nanopart. Res. 2014, 16, 2400–2412. [Google Scholar] [CrossRef]
- Mackey, M.A.; Ali, M.R.; Austin, L.A.; Near, R.D.; El-Sayed, M.A. The most effective gold nanorod size for plasmonic photothermal therapy: Theory and in vitro experiments. J. Phys. Chem. B 2014, 118, 1319–1326. [Google Scholar] [CrossRef] [PubMed]
- Wang, J.; Dong, B.; Chen, B.; Jiang, Z.; Song, H. Selective photothermal therapy for breast cancer with targeting peptide modified gold nanorods. Dalton Trans. 2012, 41, 11134–11144. [Google Scholar] [CrossRef] [PubMed]
- Dombrovsky, L.A.; Timchenko, V.; Jackson, M. Indirect heating strategy for laser induced hyperthermia: An advanced thermal model. Int. J. Heat Mass Transf. 2012, 55, 4688–4700. [Google Scholar] [CrossRef]
- Dombrovsky, L.A.; Timchenko, V.; Pathak, C.; Piazena, H.; Müller, W.; Jackson, M. Radiative heating of superficial human tissues with the use of water-filtered infrared—A radiation: A computational modeling. Int. J. Heat Mass Transf. 2015, 85, 311–320. [Google Scholar] [CrossRef]
- Bashkatov, A.; Genina, E.; Kochubey, V.; Tuchin, V. Optical properties of human skin, subcutaneous and mucous tissues in the wavelength range from 400 to 2000 nm. J. Phys. D Appl. Phys. 2005, 38, 2543–2555. [Google Scholar] [CrossRef]
- Jacques, S.L. Corrigendum: Optical properties of biological tissues: A review. Phys. Med. Biol. 2013, 58, 5007–5008. [Google Scholar] [CrossRef]
- Maksimova, I.L.; Akchurin, G.G.; Khlebtsov, B.N.; Terentyuk, G.S.; Akchurin, G.G.; Ermolaev, I.A.; Skaptsov, A.A.; Soboleva, E.P.; Khlebtsov, N.G.; Tuchin, V.V. Near-infrared laser photothermal therapy of cancer by using gold nanoparticles: Computer simulations and experiment. Med. Laser Appl. 2007, 22, 199–206. [Google Scholar] [CrossRef]
- Lee, S.E.; Sasaki, D.Y.; Perroud, T.D.; Yoo, D.; Patel, K.D.; Lee, L.P. Biologically functional cationic phospholipid−gold nanoplasmonic carriers of RNA. J. Am. Chem. Soc. 2009, 131, 14066–14074. [Google Scholar] [CrossRef] [PubMed]
- Huang, X.; El-Sayed, M.A. Gold nanoparticles: Optical properties and implementations in cancer diagnosis and photothermal therapy. J. Adv. Res. 2010, 1, 13–28. [Google Scholar] [CrossRef]
- Huang, X.; Jain, P.K.; El-Sayed, I.H.; El-Sayed, M.A. Gold nanoparticles: Interesting optical properties and recent applications in cancer diagnostics and therapy. Nanomedicine 2007, 2, 681–693. [Google Scholar] [CrossRef] [PubMed]
- Huang, X.; Neretina, S.; El-Sayed, M.A. Gold nanorods: From synthesis and properties to biological and biomedical applications. Adv. Mater. 2009, 21, 4880–4910. [Google Scholar] [CrossRef] [PubMed]
- Loo, C.; Lowery, A.; Halas, N.; West, J.; Drezek, R. Immunotargeted nanoshells for integrated cancer imaging and therapy. Nano Lett. 2005, 5, 709–711. [Google Scholar] [CrossRef] [PubMed]
- Jain, P.K.; Eustis, S.; El-Sayed, M.A. Plasmon coupling in nanorod assemblies: Optical absorption, discrete dipole approximation simulation, and exciton-coupling model. J. Phys. Chem. B 2006, 110, 18243–18253. [Google Scholar] [CrossRef] [PubMed]
- Cai, W.; Gao, T.; Hong, H.; Sun, J. Applications of gold nanoparticles in cancer nanotechnology. Nanotechnol. Sci. Appl. 2008, 2008, 17–32. [Google Scholar] [CrossRef]
- Caswell, K.; Wilson, J.N.; Bunz, U.H.; Murphy, C.J. Preferential end-to-end assembly of gold nanorods by biotin-streptavidin connectors. J. Am. Chem. Soc. 2003, 125, 13914–13915. [Google Scholar] [CrossRef] [PubMed]
- Nikoobakht, B.; Wang, Z.; El-Sayed, M. Self-assembly of gold nanorods. J. Phys. Chem. B 2000, 104, 8635–8640. [Google Scholar] [CrossRef]
- Sun, Z.; Ni, W.; Yang, Z.; Kou, X.; Li, L.; Wang, J. Ph-controlled reversible assembly and disassembly of gold nanorods. Small 2008, 4, 1287–1292. [Google Scholar] [CrossRef] [PubMed]
- Jain, P.K.; El-Sayed, M.A. Surface plasmon coupling and its universal size scaling in metal nanostructures of complex geometry: Elongated particle pairs and nanosphere trimers. J. Phys. Chem. C 2008, 112, 4954–4960. [Google Scholar] [CrossRef]
- Kaneti, Y.V.; Chen, C.; Liu, M.; Wang, X.; Yang, J.L.; Taylor, R.A.; Jiang, X.; Yu, A. Carbon-coated gold nanorods: A facile route to biocompatible materials for photothermal applications. ACS Appl. Mater. Interfaces 2015, 7, 25658–25668. [Google Scholar] [CrossRef] [PubMed]
- Soni, S.; Tyagi, H.; Taylor, R.A.; Kumar, A. Role of optical coefficients and healthy tissue-sparing characteristics in gold nanorod-assisted thermal therapy. Int. J. Hyperth. 2013, 29, 87–97. [Google Scholar] [CrossRef] [PubMed]
- Soni, S.; Tyagi, H.; Taylor, R.A.; Kumar, A. Investigation on nanoparticle distribution for thermal ablation of a tumour subjected to nanoparticle assisted thermal therapy. J. Therm. Biol. 2014, 43, 70–80. [Google Scholar] [CrossRef] [PubMed]
- Soni, S.; Tyagi, H.; Taylor, R.A.; Kumar, A. The influence of tumour blood perfusion variability on thermal damage during nanoparticle-assisted thermal therapy. Int. J. Hyperth. 2015, 31, 615–625. [Google Scholar] [CrossRef] [PubMed]
- Taylor, R.A.; Wong, J.K.; Baek, S.; Hewakuruppu, Y.; Jiang, X.; Chen, C.; Gunawan, A. Nanoparticle-assisted heating utilizing a low-cost white light source. J. Nanotechnol. Eng. Med. 2013, 4, 040903. [Google Scholar] [CrossRef]
- Gu, X.; Timchenko, V.; Yeoh, G.H.; Dombrovsky, L.A.; Taylor, R.A. Heat Generation in Gold Nanorods Solutions Due to Absorption of Near-Infrared Radiation; ICHMT Digital Library Online; Begel House: Napoli, Italy, 2017. [Google Scholar]
- Lee, S.E.; Liu, G.L.; Kim, F.; Lee, L.P. Remote optical switch for localized and selective control of gene interference. Nano Lett. 2009, 9, 562–570. [Google Scholar] [CrossRef] [PubMed]
- Chen, Z.; Wang, Z.; Chen, X.; Xu, H.; Liu, J. Chitosan-capped gold nanoparticles for selective and colorimetric sensing of heparin. J. Nanopart. Res. 2013, 15, 1930–1939. [Google Scholar] [CrossRef] [PubMed]
- Pamies, R.; Cifre, J.G.H.; Espín, V.F.; Collado-González, M.; Baños, F.G.D.; de la Torre, J.G. Aggregation behavior of gold nanoparticles in saline aqueous media. J. Nanopart. Res. 2014, 16, 2376. [Google Scholar] [CrossRef]
- Umar, A.; Choi, S.-M. Aggregation behavior of oppositely charged gold nanorods in aqueous solution. J. Phys. Chem. C 2013, 117, 11738–11743. [Google Scholar] [CrossRef]
- Sambles, J. Polarized Light in Optics and Spectroscopy. J. Mod. Opt. 1991, 38, 1204–1205. [Google Scholar] [CrossRef]
- Zhang, M.; Kim, H.S.; Jin, T.; Moon, W.K. Near-infrared photothermal therapy using egfr-targeted gold nanoparticles increases autophagic cell death in breast cancer. J. Photochem. Photobiol. B Biol. 2017, 170, 58–64. [Google Scholar] [CrossRef] [PubMed]
- DeVoe, H. Optical properties of molecular aggregates. I. Classical model of electronic absorption and refraction. J. Chem. Phys. 1964, 41, 393–400. [Google Scholar] [CrossRef]
- Draine, B.T.; Flatau, P.J. User guide for the discrete dipole approximation code ddscat 7.3. arXiv, 2013; arXiv:1305.6497. [Google Scholar]
- Draine, B.T.; Flatau, P.J. Discrete-dipole approximation for scattering calculations. JOSA A 1994, 11, 1491–1499. [Google Scholar] [CrossRef]
- Lee, K.-S.; El-Sayed, M.A. Dependence of the enhanced optical scattering efficiency relative to that of absorption for gold metal nanorods on aspect ratio, size, end-cap shape, and medium refractive index. J. Phys. Chem. B 2005, 109, 20331–20338. [Google Scholar] [CrossRef] [PubMed]
- Pérez-Juste, J.; Pastoriza-Santos, I.; Liz-Marzán, L.M.; Mulvaney, P. Gold nanorods: Synthesis, characterization and applications. Coord. Chem. Rev. 2005, 249, 1870–1901. [Google Scholar] [CrossRef]
- Vartia, O.S.; Ylä-Oijala, P.; Markkanen, J.; Puupponen, S.; Seppälä, A.; Sihvola, A.; Ala-Nissila, T. On the applicability of discrete dipole approximation for plasmonic particles. J. Quant. Spectrosc. Radiat. Transf. 2016, 169, 23–35. [Google Scholar] [CrossRef]
- Bohren, C.F.; Huffman, D.R. Absorption and Scattering of Light by Small Particles; John Wiley & Sons: Weinheim, Germany, 2008. [Google Scholar]
- Dombrovsky, L.A. Radiation Heat Transfer in Disperse Systems; Begell House: New York, NY, USA, 1996. [Google Scholar]
- Dombrovsky, L.A.; Baillis, D. Thermal Radiation in Disperse Systems: An Engineering Approach; Begell House: New York, NY, USA, 2010. [Google Scholar]
- Mishchenko, M.I.; Travis, L.D.; Lacis, A.A. Multiple Scattering of Light by Particles: Radiative Transfer and Coherent Backscattering; Cambridge University Press: Cambridge, UK, 2006. [Google Scholar]
- Van de Hulst, H.C. Light Scattering by Small Particles; Wiley: New York, NY, USA, 1957. [Google Scholar]
- McPeak, K.M.; Jayanti, S.V.; Kress, S.J.; Meyer, S.; Iotti, S.; Rossinelli, A.; Norris, D.J. Plasmonic films can easily be better: Rules and recipes. ACS Photonics 2015, 2, 326–333. [Google Scholar] [CrossRef] [PubMed]
- Vollmer, M.; Kreibig, U. Optical Properties of Metal Clusters; Springer: Berlin/Heidelberg, Germany, 1995; Volume 25, pp. 13–201. [Google Scholar]
- Ordal, M.A.; Bell, R.J.; Alexander, R.W.; Long, L.L.; Querry, M.R. Optical properties of fourteen metals in the infrared and far infrared: Al, Co, Cu, Au, Fe, Pb, Mo, Ni, Pd, Pt, Ag, Ti, V, and W. Appl. Opt. 1985, 24, 4493–4499. [Google Scholar] [CrossRef] [PubMed]
- Novo, C.; Gomez, D.; Perez-Juste, J.; Zhang, Z.; Petrova, H.; Reismann, M.; Mulvaney, P.; Hartland, G.V. Contributions from radiation damping and surface scattering to the linewidth of the longitudinal plasmon band of gold nanorods: A single particle study. PCCP 2006, 8, 3540–3546. [Google Scholar] [CrossRef] [PubMed]
- Yang, P.; Gao, B.-C.; Wiscombe, W.J.; Mishchenko, M.I.; Platnick, S.E.; Huang, H.-L.; Baum, B.A.; Hu, Y.X.; Winker, D.M.; Tsay, S.-C. Inherent and apparent scattering properties of coated or uncoated spheres embedded in an absorbing host medium. Appl. Opt. 2002, 41, 2740–2759. [Google Scholar] [CrossRef] [PubMed]
- Hinterwirth, H.; Wiedmer, S.K.; Moilanen, M.; Lehner, A.; Allmaier, G.; Waitz, T.; Lindner, W.; Lämmerhofer, M. Comparative method evaluation for size and size-distribution analysis of gold nanoparticles. J. Sep. Sci. 2013, 36, 2952–2961. [Google Scholar] [CrossRef] [PubMed]
- Smirnov, E. Assemblies of Gold Nanoparticles at Liquid-Liquid Interfaces: From Liquid Optics to Electrocatalysis; Springer: Berlin/Heidelberg, Germany, 2018. [Google Scholar]
- Devaty, R.; Sievers, A. Possibility of observing quantum size effects in the electromagnetic absorption spectrum of small metal particles. Phys. Rev. B 1985, 32, 1951–1954. [Google Scholar] [CrossRef]
- Perenboom, J.A.A.J.; Wyder, P.; Meier, F. Electronic properties of small metallic particles. Phys. Rep. 1981, 78, 173–292. [Google Scholar] [CrossRef] [Green Version]
- Pissuwan, D.; Valenzuela, S.M.; Miller, C.M.; Killingsworth, M.C.; Cortie, M.B. Destruction and control of toxoplasmagondii tachyzoites using gold nanosphere/antibody conjugates. Small 2009, 5, 1030–1034. [Google Scholar] [CrossRef] [PubMed] [Green Version]
- Jain, P.K.; Lee, K.S.; El-Sayed, I.H.; El-Sayed, M.A. Calculated absorption and scattering properties of gold nanoparticles of different size, shape, and composition: Applications in biological imaging and biomedicine. J. Phys. Chem. B 2006, 110, 7238–7248. [Google Scholar] [CrossRef] [PubMed]
- Yurkin, M.A.; Hoekstra, A.G. The discrete dipole approximation: An overview and recent developments. J. Quant. Spectrosc. Radiat. Transf. 2007, 106, 558–589. [Google Scholar] [CrossRef] [Green Version]
- Hewakuruppu, Y.L.; Dombrovsky, L.A.; Chen, C.; Timchenko, V.; Jiang, X.; Baek, S.; Taylor, R.A. Plasmonic “pump–probe” method to study semi-transparent nanofluids. Appl. Opt. 2013, 52, 6041–6050. [Google Scholar] [CrossRef] [PubMed]
Figure 1.
Transmission of the 780 nm bandpass filter.

Figure 2.
(a) The GNR solution sample was wrapped by insulation and reflective material and (b) Equipment set-up of the thermal experiment.
Figure 2.
(a) The GNR solution sample was wrapped by insulation and reflective material and (b) Equipment set-up of the thermal experiment.

Figure 3.
Schematic of the scattering process of a spherical particle.

Figure 4.
(a) Transmission electron microscopy (TEM) and (b) dynamic light scattering (DLS) measurements of the GNRs, with an original concentration of GNRs/mL.
Figure 4.
(a) Transmission electron microscopy (TEM) and (b) dynamic light scattering (DLS) measurements of the GNRs, with an original concentration of GNRs/mL.

Figure 5.
GNR solutions of various concentrations (refer to Table 1). (A) 0 GNRs/mL, (B) GNRs/mL, (C) GNRs/mL, (D) GNRs/mL, (E) GNRs/mL and (F) GNRs/mL.
Figure 5.
GNR solutions of various concentrations (refer to Table 1). (A) 0 GNRs/mL, (B) GNRs/mL, (C) GNRs/mL, (D) GNRs/mL, (E) GNRs/mL and (F) GNRs/mL.

Figure 6.
Measured absorbance of GNR solutions with various concentrations (see Table 1).
Figure 6.
Measured absorbance of GNR solutions with various concentrations (see Table 1).

Figure 7.
Spectral dependency of absorption efficiency of a single GNR with different aspect ratios (AR), (a) AR = 2, (b) AR = 3, (c) AR = 3.8 and (d) AR = 4.
Figure 7.
Spectral dependency of absorption efficiency of a single GNR with different aspect ratios (AR), (a) AR = 2, (b) AR = 3, (c) AR = 3.8 and (d) AR = 4.

Figure 8.
The linear relationship between the absorption efficiency and the orientation.

Figure 9.
Linear increase of the wavelength of longitudinal surface plasmonic resonance (SPR) and of maximum absorption efficiency with aspect ratio.
Figure 9.
Linear increase of the wavelength of longitudinal surface plasmonic resonance (SPR) and of maximum absorption efficiency with aspect ratio.

Figure 10.
Absorption efficiency of end-to-end assembly with various gaps.

Figure 11.
Absorption efficiency of side-by-side assembly with various gaps.


Table 1.
Description of gold nanorods (GNRs) solution samples with various volume fractions.
| Sample | Concentration (GNRs/mL) | Volume Fraction |
|---|---|---|
| A | 0 | 0 |
| B | ||
| C | ||
| D | ||
| E | ||
| F |
Table 2.
Results from optical and thermal experiments obtained at 780 nm wavelength [35].
Table 2.
Results from optical and thermal experiments obtained at 780 nm wavelength [35].
| Sample | Absorbance | Temperature Increase (K) | Error of Temperature Measurements (K) |
|---|---|---|---|
| D | 0.61 | 0.2 | +0.015 |
| E | 0.80 | 0.4 | −0.014 |
| F | 0.96 | 0.5 | −0.013 |
© 2018 by the authors. Licensee MDPI, Basel, Switzerland. This article is an open access article distributed under the terms and conditions of the Creative Commons Attribution (CC BY) license (http://creativecommons.org/licenses/by/4.0/).
Share and Cite
MDPI and ACS Style
Gu, X.; Timchenko, V.; Heng Yeoh, G.; Dombrovsky, L.; Taylor, R. The Effect of Gold Nanorods Clustering on Near-Infrared Radiation Absorption. Appl. Sci. 2018, 8, 1132. https://doi.org/10.3390/app8071132
AMA Style
Gu X, Timchenko V, Heng Yeoh G, Dombrovsky L, Taylor R. The Effect of Gold Nanorods Clustering on Near-Infrared Radiation Absorption. Applied Sciences. 2018; 8(7):1132. https://doi.org/10.3390/app8071132
Chicago/Turabian StyleGu, Xi, Victoria Timchenko, Guan Heng Yeoh, Leonid Dombrovsky, and Robert Taylor. 2018. "The Effect of Gold Nanorods Clustering on Near-Infrared Radiation Absorption" Applied Sciences 8, no. 7: 1132. https://doi.org/10.3390/app8071132
Note that from the first issue of 2016, this journal uses article numbers instead of page numbers. See further details here.