Molecular Specific and Sensitive Detection of Pyrazinamide and Its Metabolite Pyrazinoic Acid by Means of Surface Enhanced Raman Spectroscopy Employing In Situ Prepared Colloids

 and
and 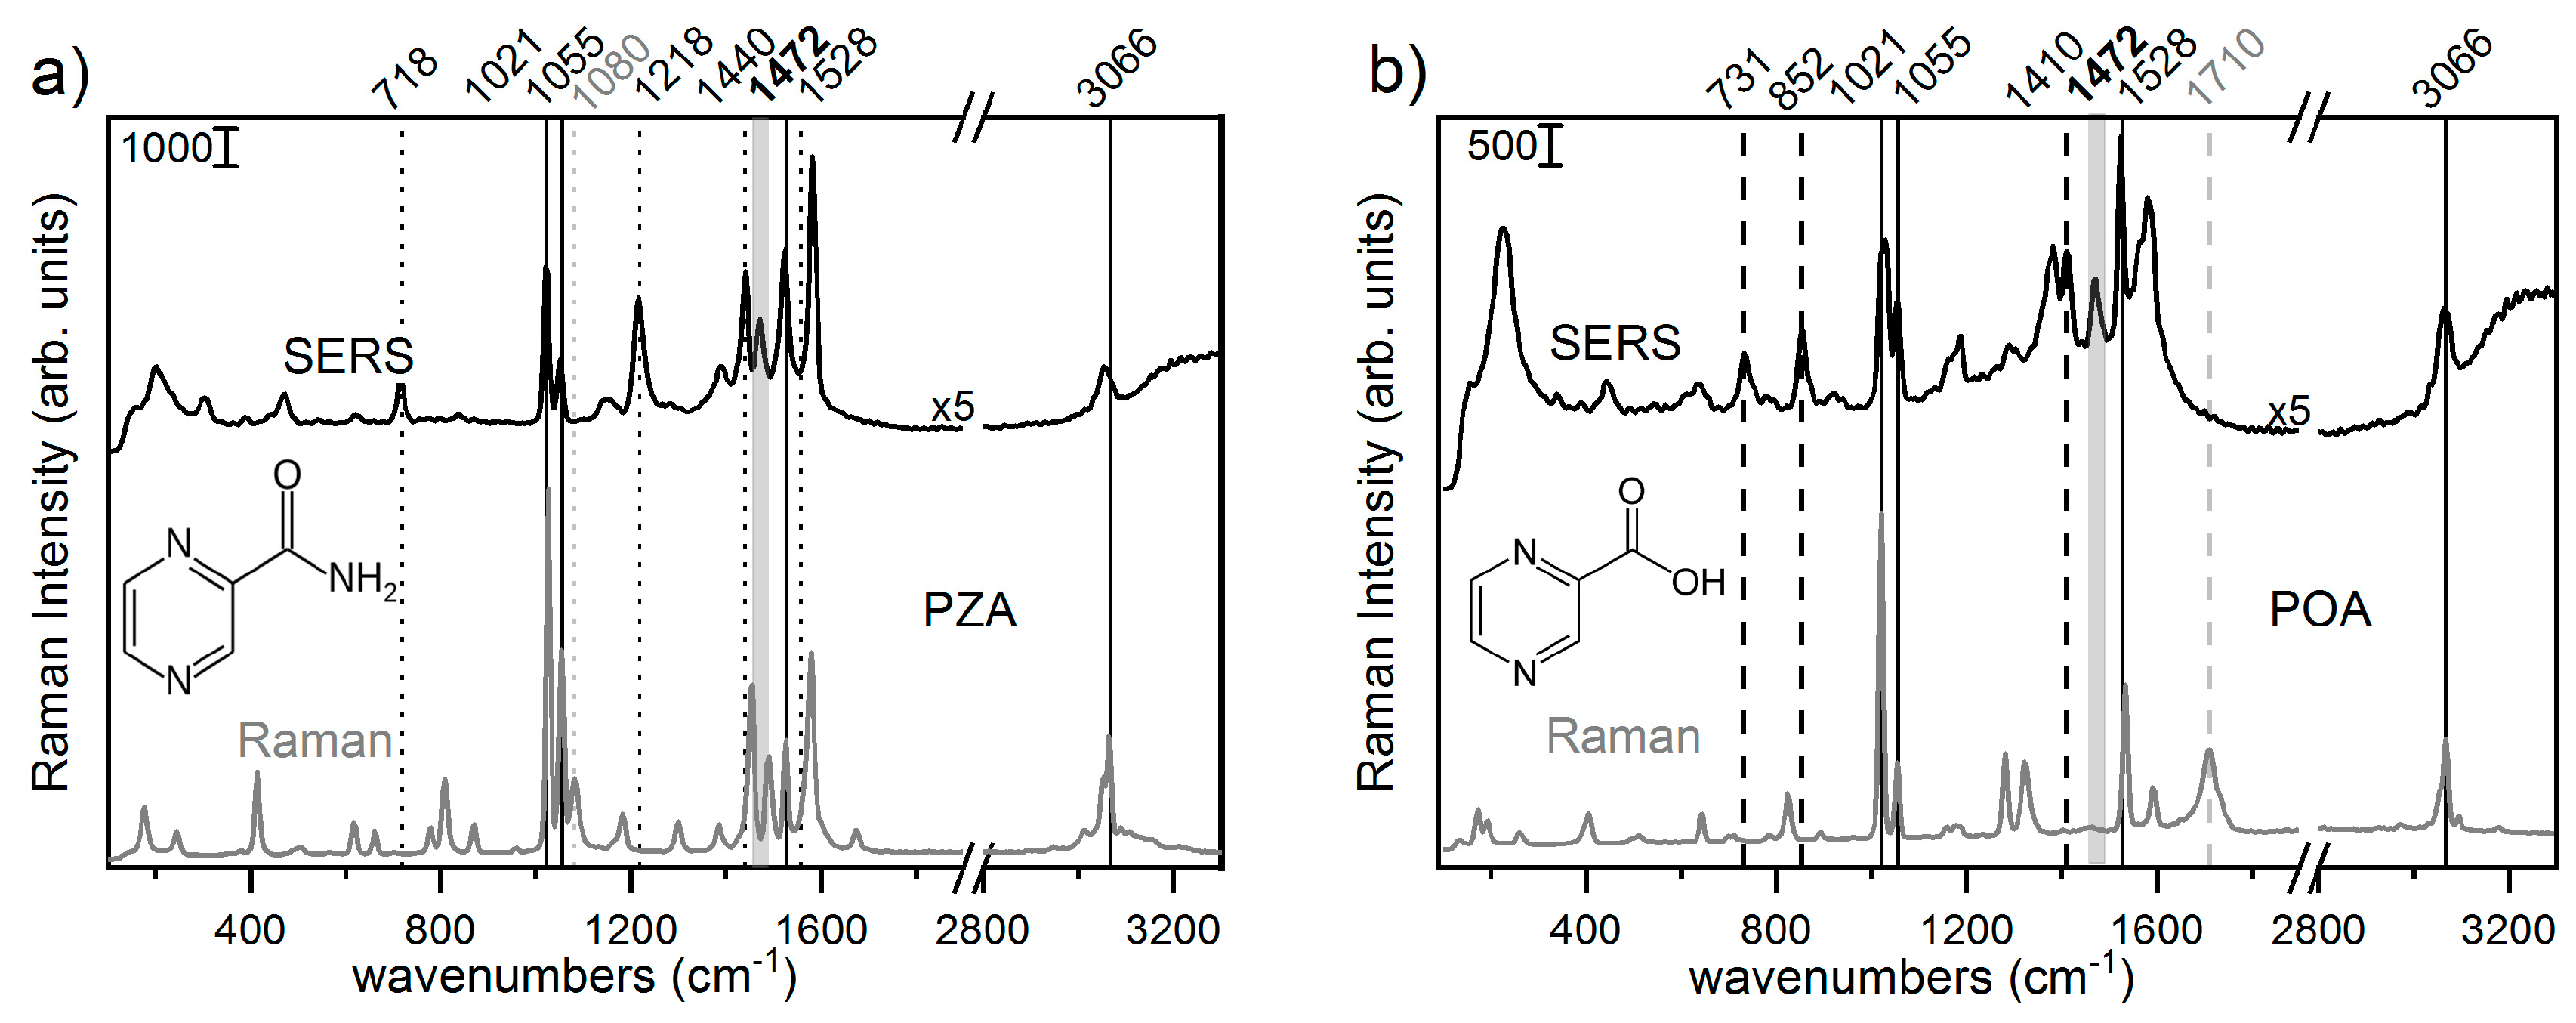
Abstract
:Featured Application
Abstract
1. Introduction
2. Materials and Methods
2.1. Materials and Samples
2.2. Microfluidic Flow Cell
2.3. Batch Synthesis of the Nanoparticles—h-AgNPs
2.4. In Situ Synthesized Nanoparticles—y-AgNPs
2.5. Instrumentation and Measurements
2.6. Data Analysis
3. Results
3.1. PZA and POA: Spectral Characterization
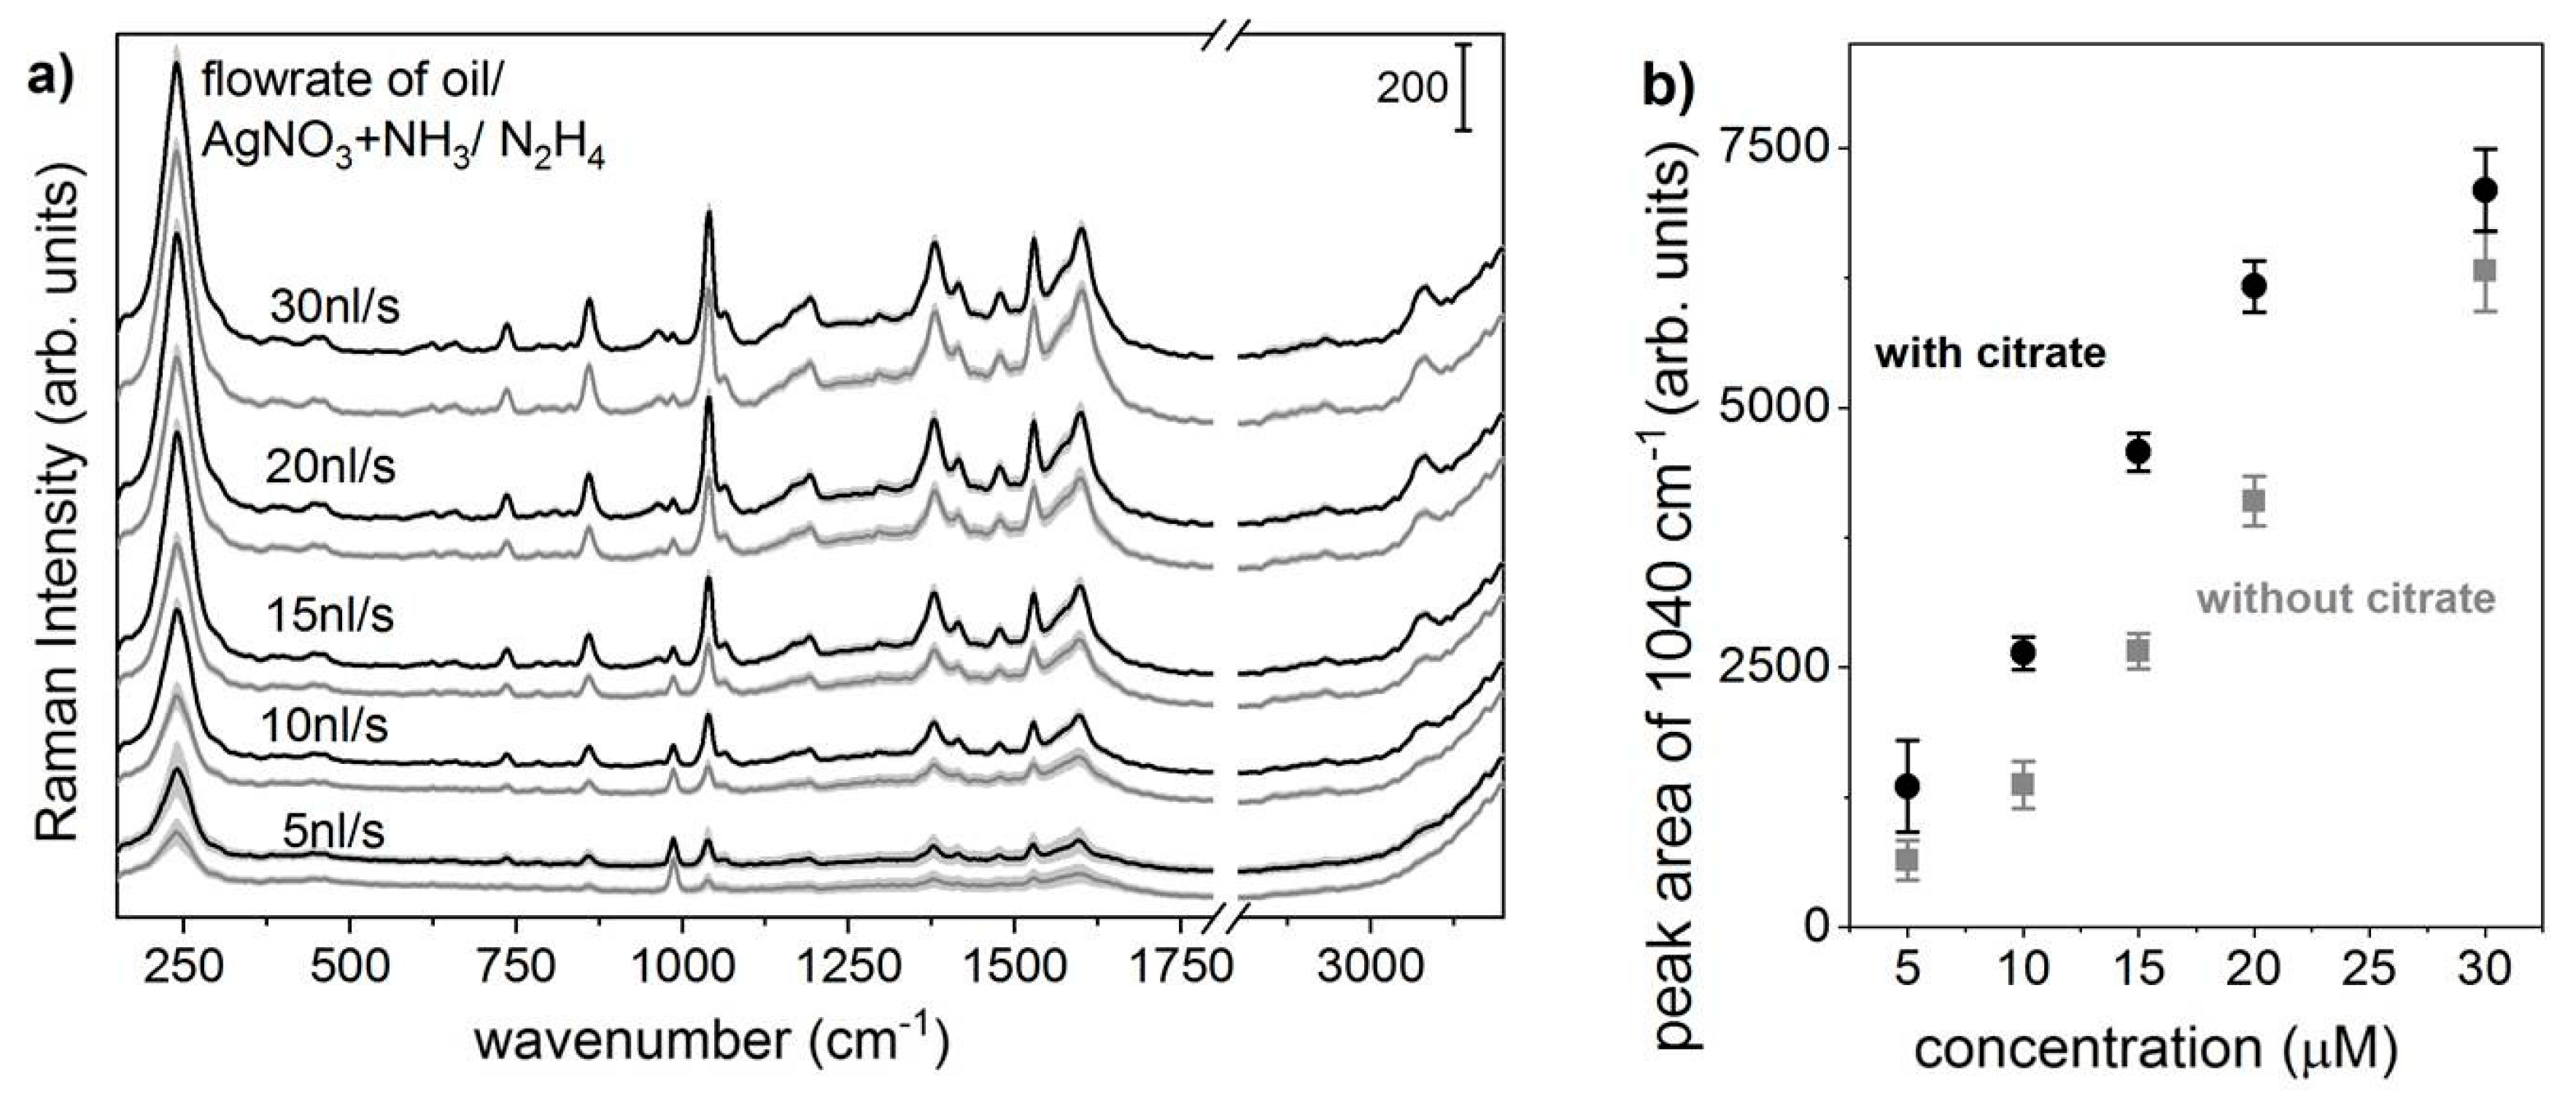
3.2. Optimization of the SERS Measurement Conditions
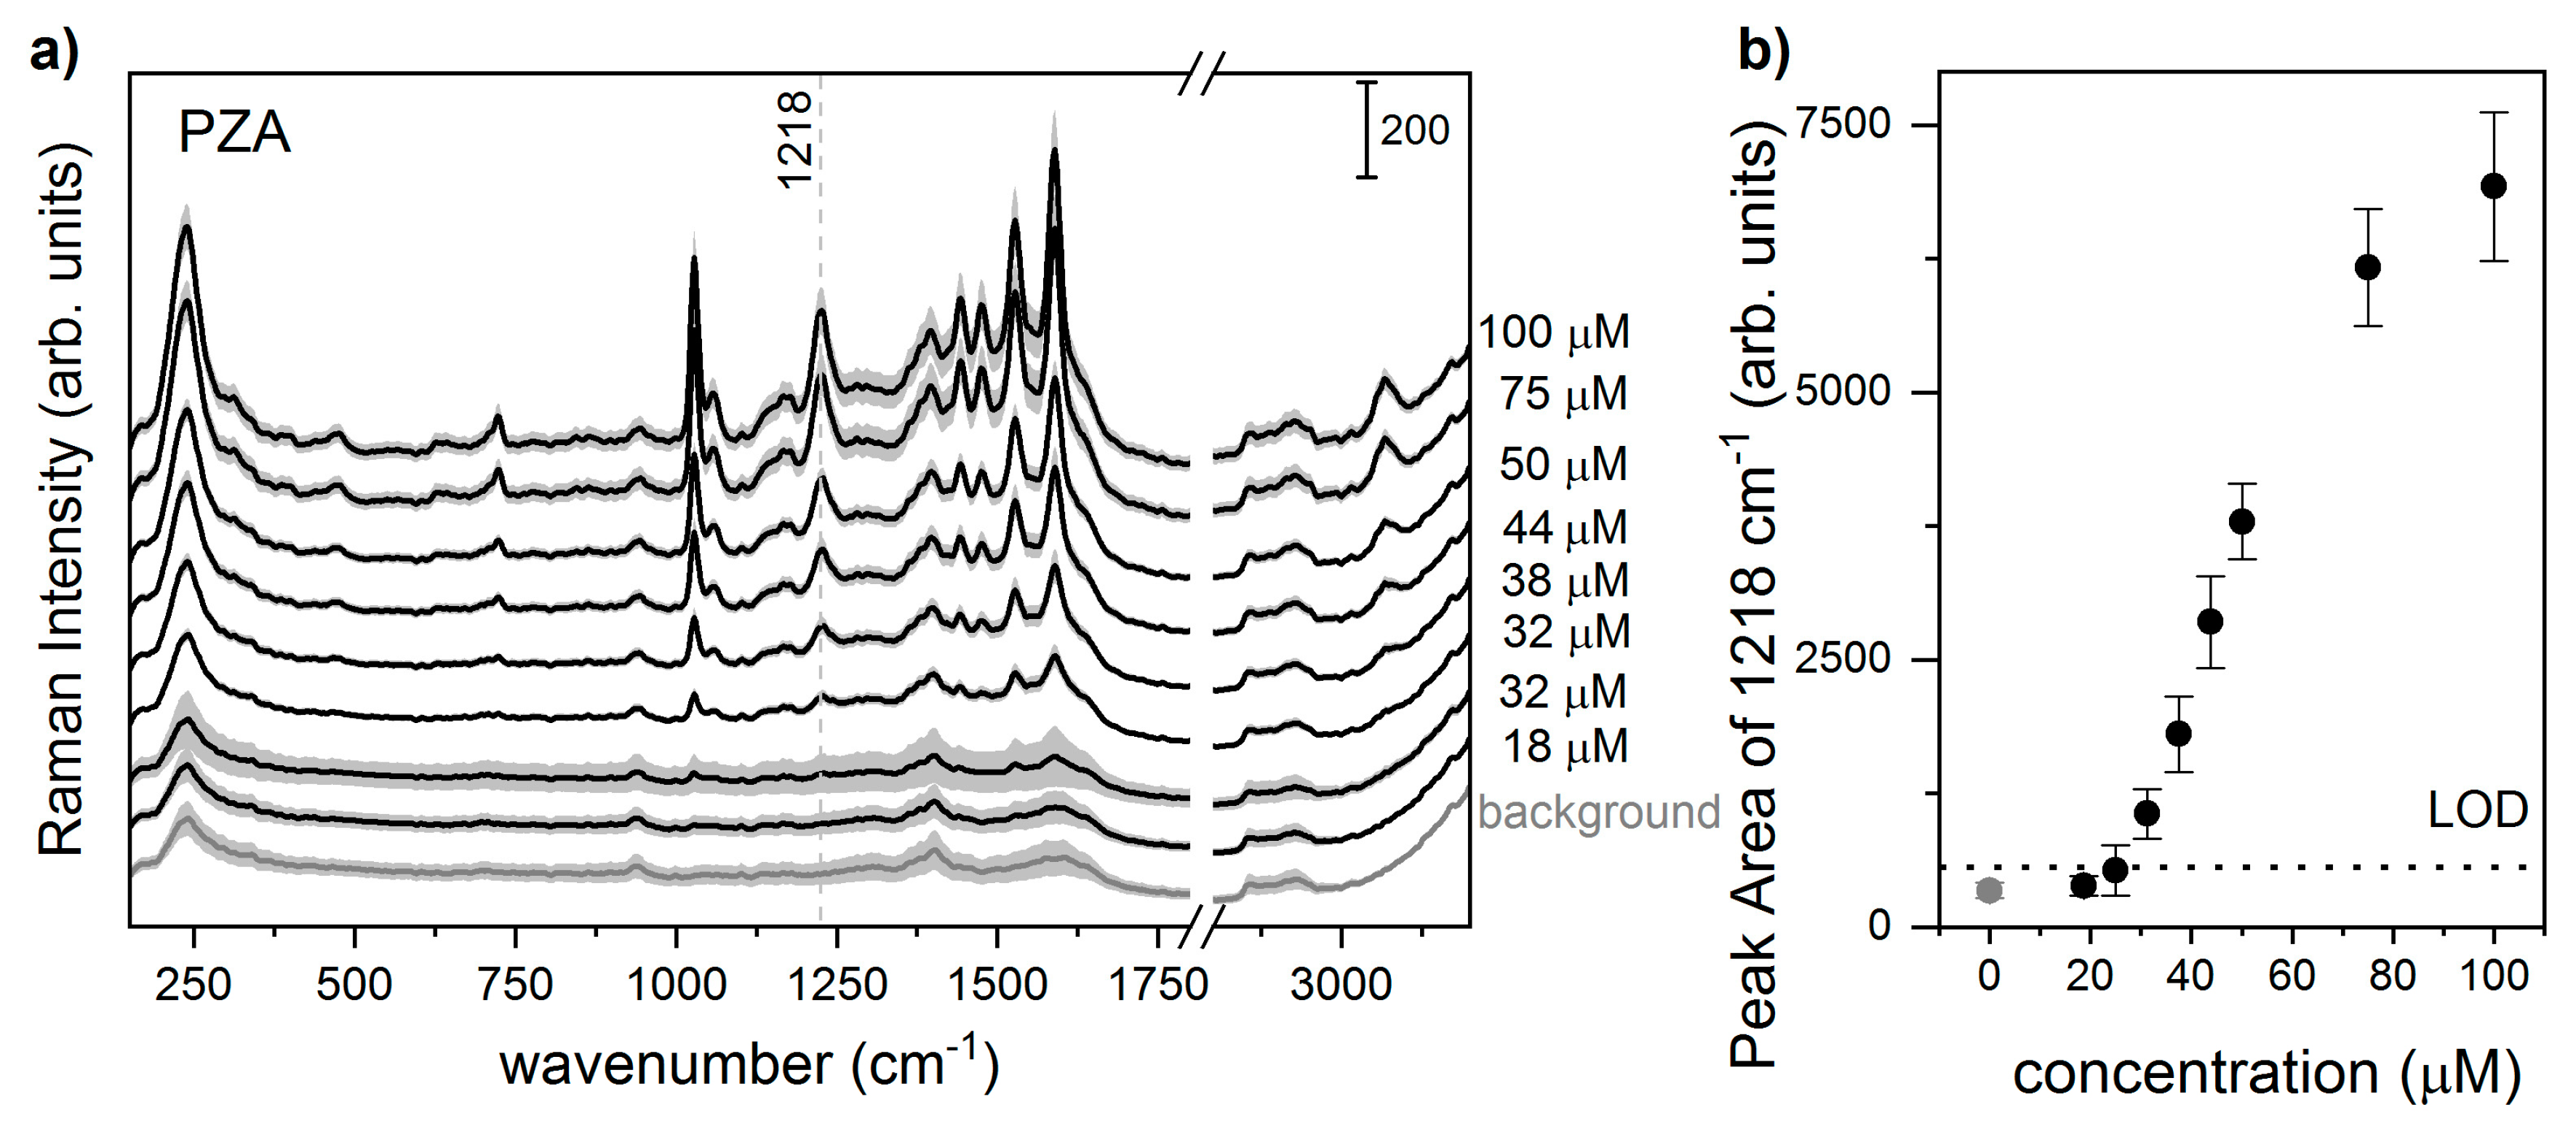
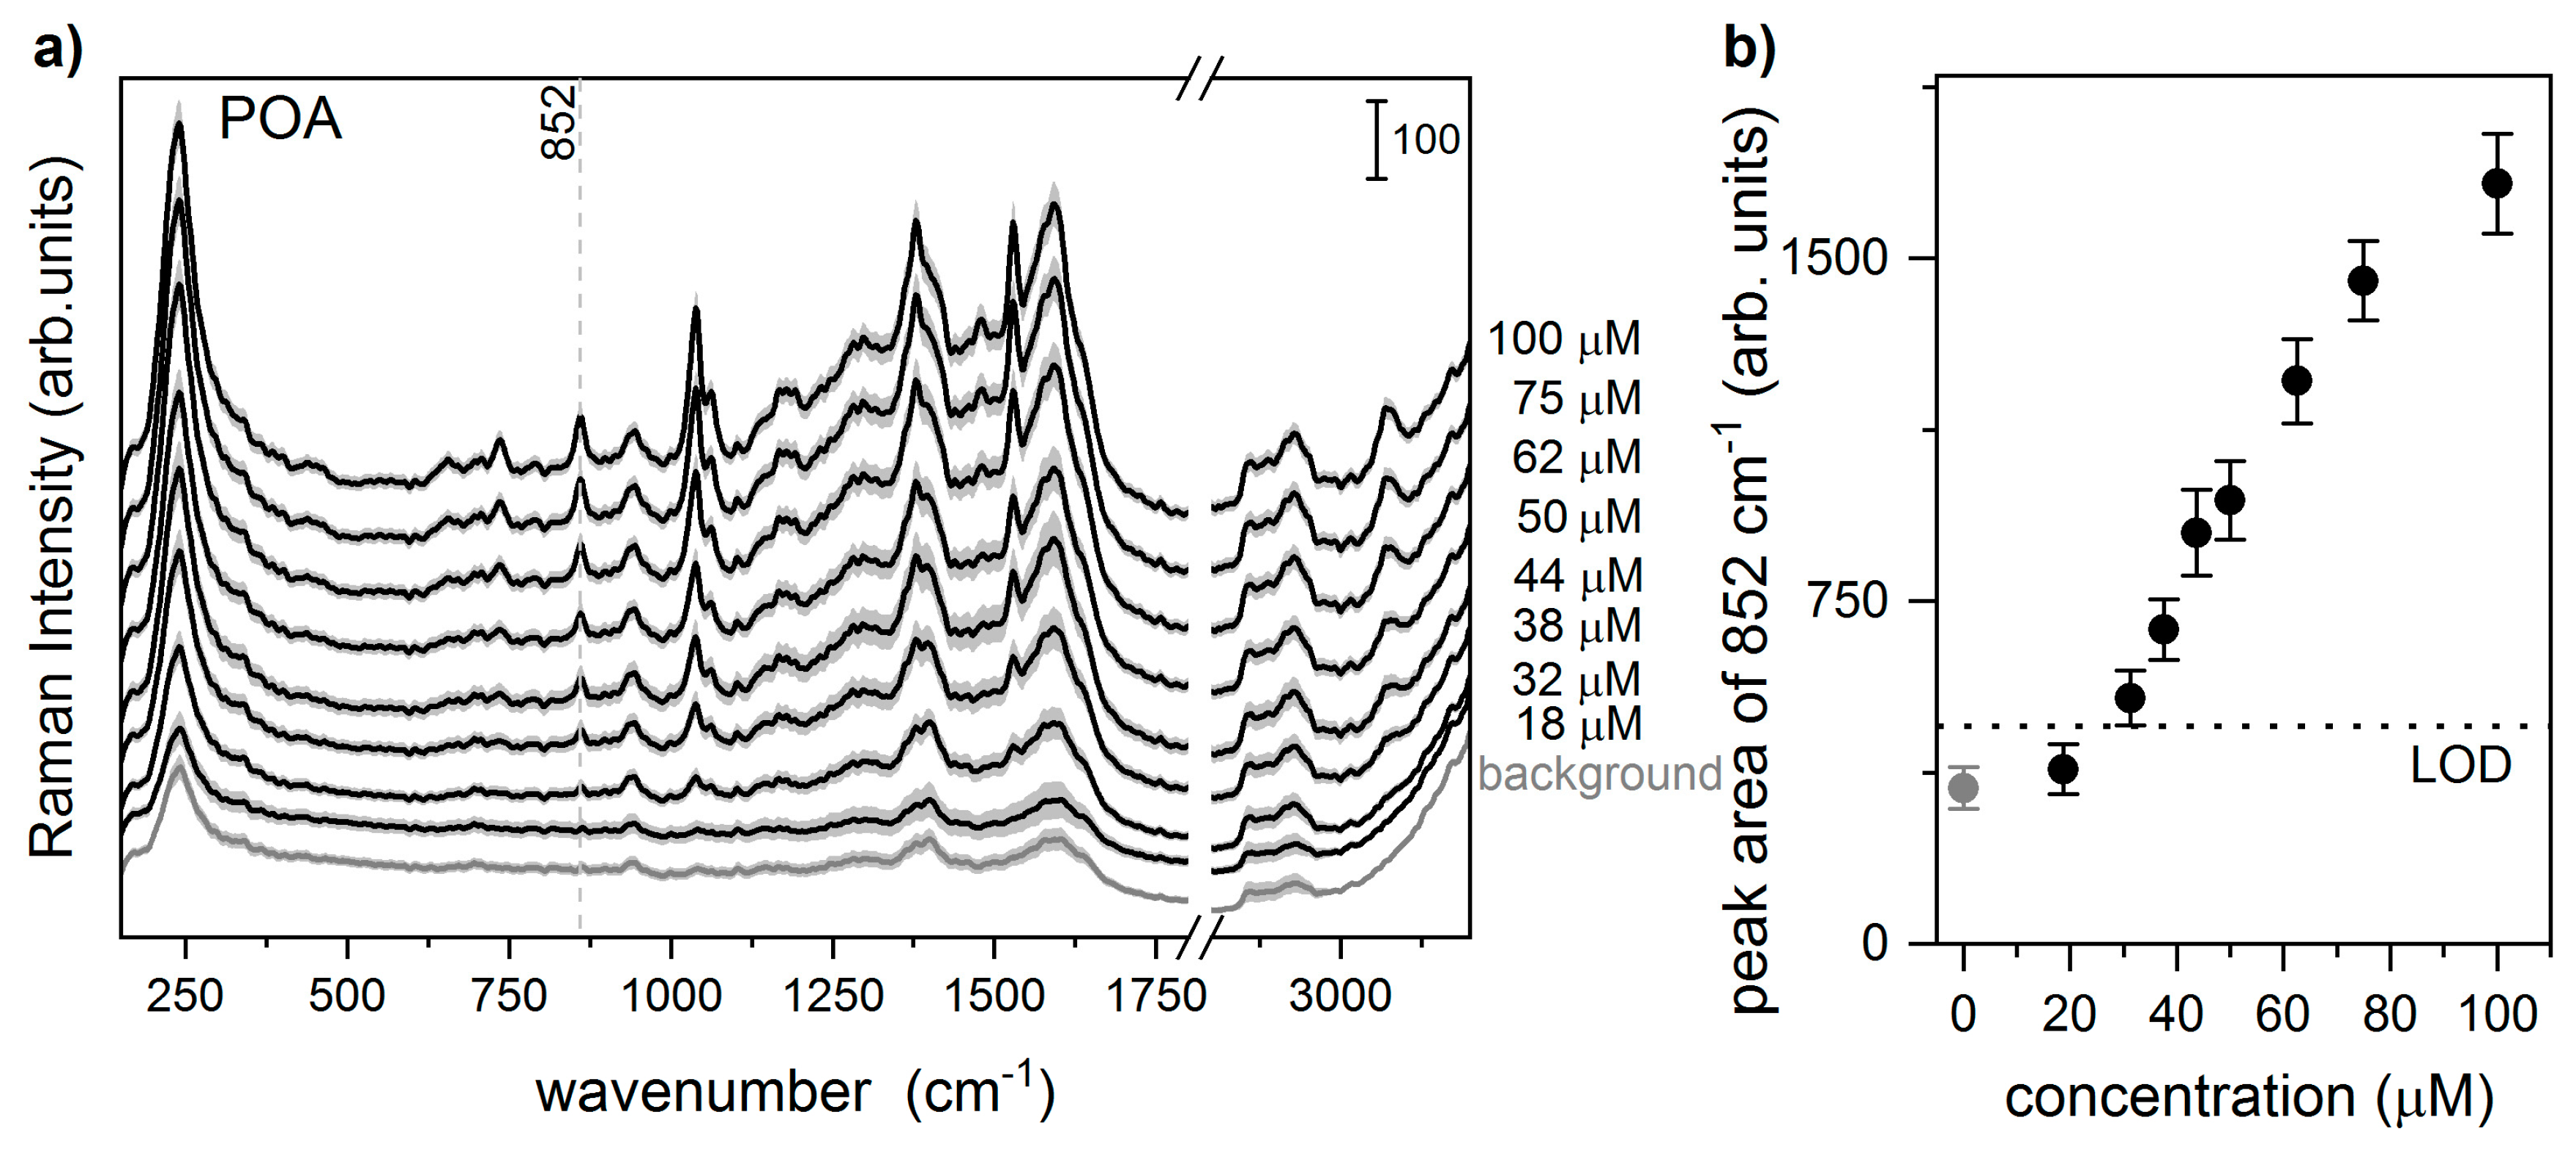
3.3. Quantitative Detection of PZA and POA Applying the LoC-SERS Device
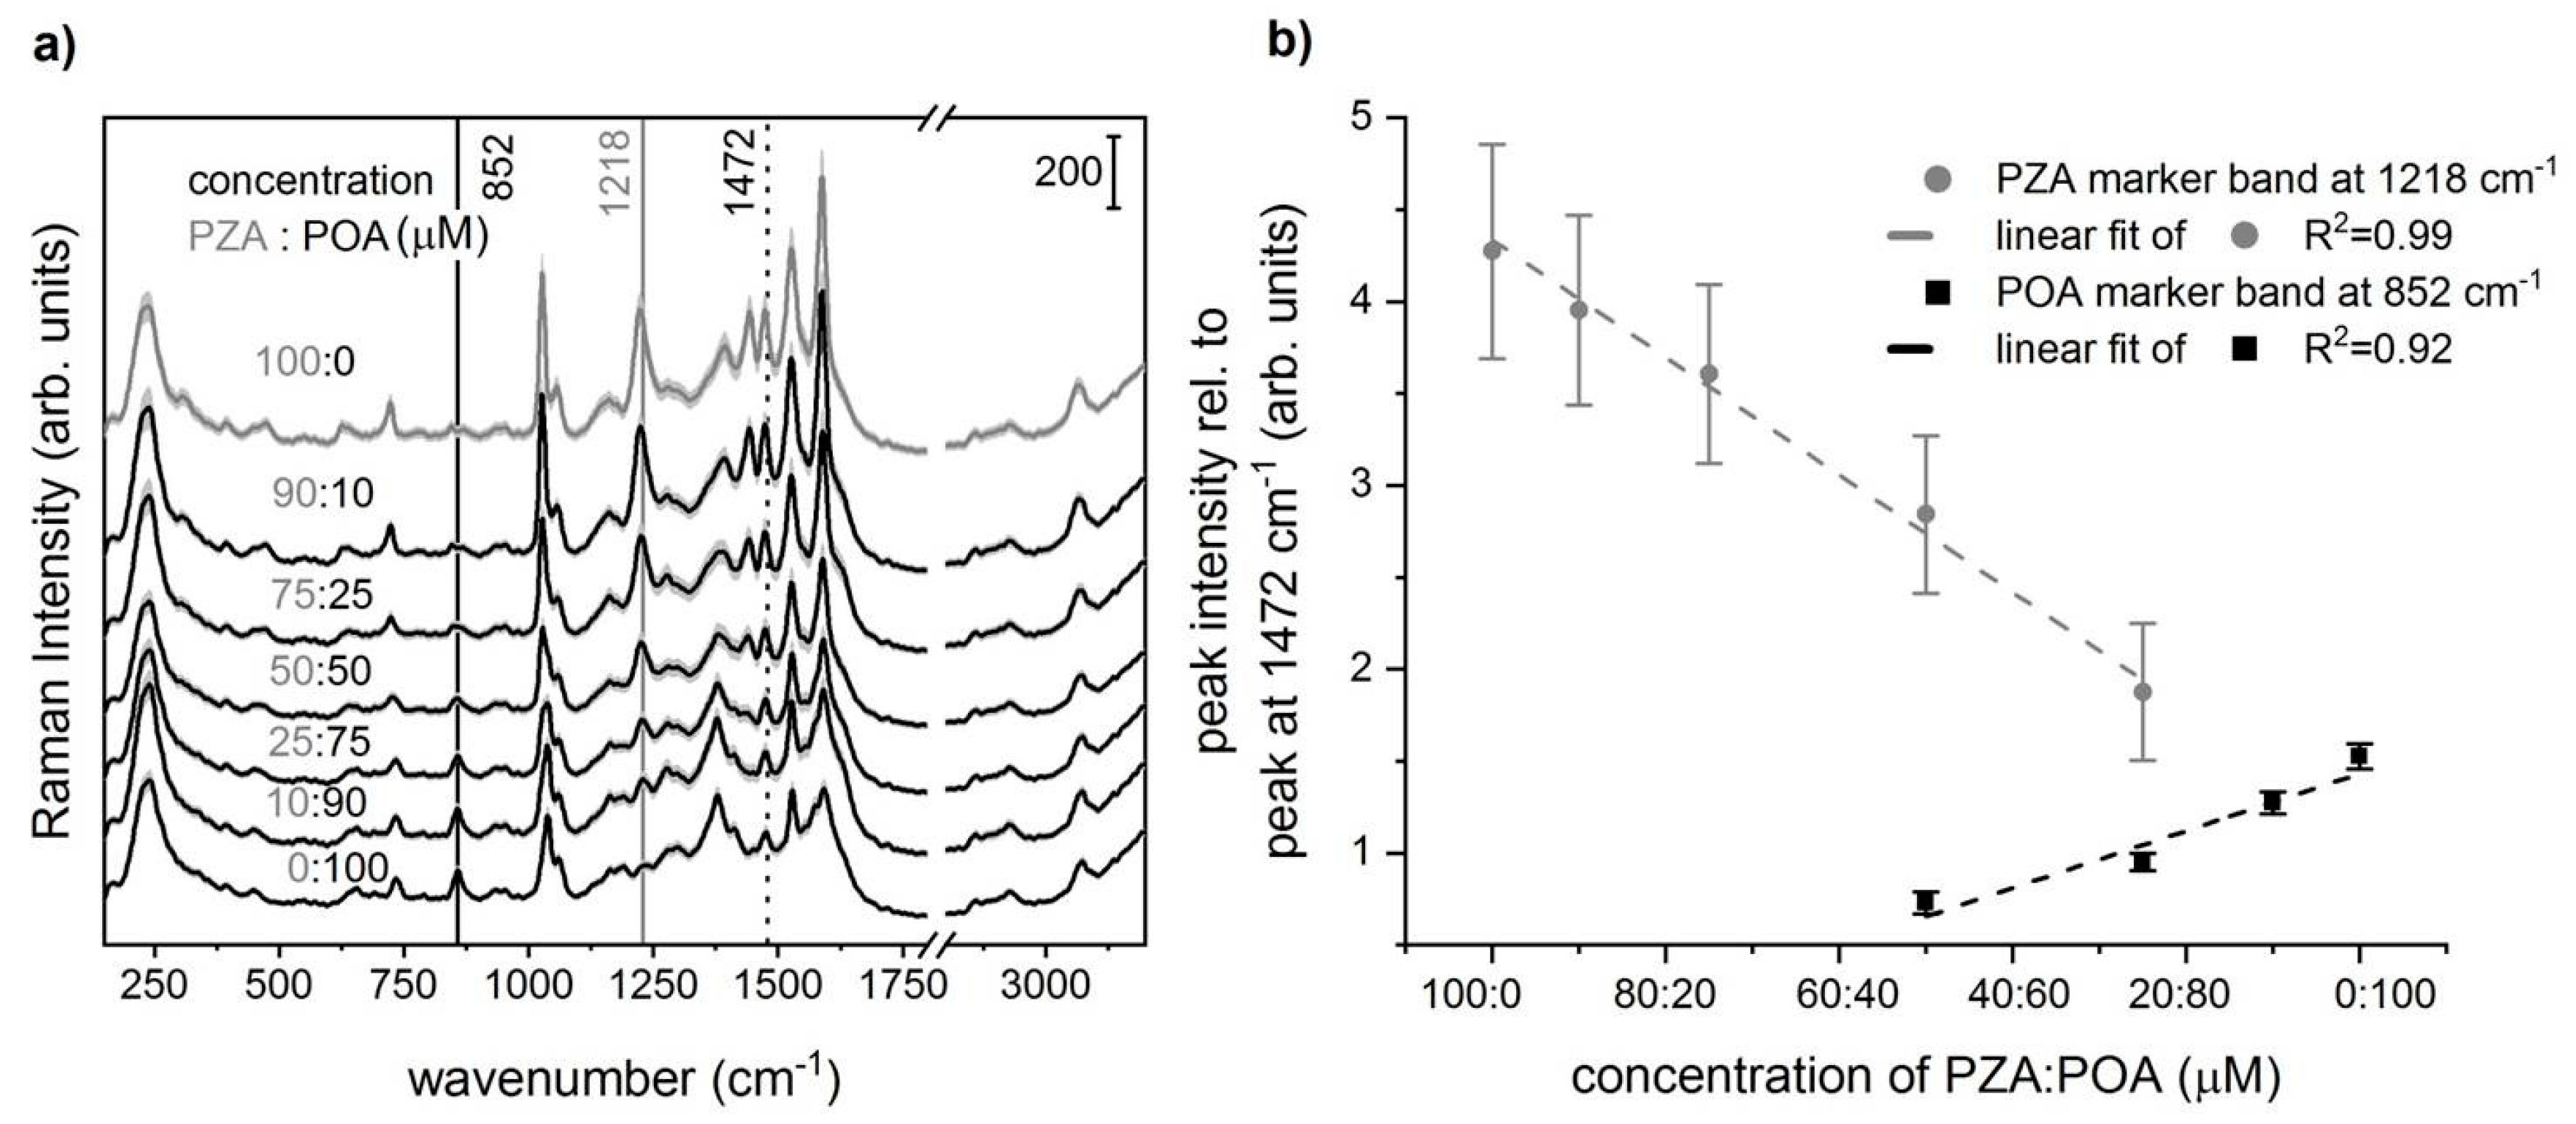
3.4. Simultaneous Detection of PZA and POA in Aqueous Solution
4. Discussion
Supplementary Materials
Author Contributions
Funding
Conflicts of Interest
References
- Global Tuberculosis Report 2018; World Health Organization: Geneva, Switzerland, 2018.
- Corbett, E.L.; Watt, C.J.; Walker, N.; Maher, D.; Williams, B.G.; Raviglione, M.C.; Dye, C. The growing burden of tuberculosis: Global trends and interactions with the hiv epidemic. Arch. Internal Med. 2003, 163, 1009–1021. [Google Scholar] [CrossRef] [PubMed]
- Raviglione, M.C.; Gupta, R.; Dye, C.M.; Espinal, M.A. The burden of drug-resistant tuberculosis and mechanisms for its control. Ann. N.Y. Acad. Sci. 2001, 953b, 88–97. [Google Scholar] [CrossRef] [PubMed]
- Somoskovi, A.; Kodmon, C.; Lantos, A.; Bartfai, Z.; Tamasi, L.; Fuzy, J.; Magyar, P. Comparison of recoveries of mycobacterium tuberculosis using the automated bactec mgit 960 system, the bactec 460 tb system, and lowenstein-jensen medium. J. Clin. Microbiol. 2000, 38, 2395–2397. [Google Scholar] [PubMed]
- Roggenkamp, A.; Hornef, M.W.; Masch, A.; Aigner, B.; Autenrieth, I.B.; Heesemann, J. Comparison of mb/bact and bactec 460 tb systems for recovery of mycobacteria in a routine diagnostic laboratory. J. Clin. Microbiol. 1999, 37, 3711–3712. [Google Scholar] [PubMed]
- Hillemann, D.; Richter, E.; Rusch-Gerdes, S. Use of the bactec mycobacteria growth indicator tube 960 automated system for recovery of mycobacteria from 9,558 extrapulmonary specimens, including urine samples. J. Clin. Microbiol. 2006, 44, 4014–4017. [Google Scholar] [CrossRef]
- Marttila, H.J.; Marjamaki, M.; Viljanen, M.K.; Soini, H. Performance of bactec 960 mycobacteria growth indicator tube in the susceptibility testing of genetically characterized mycobacterium tuberculosis isolates. Eur. J. Clin. Microbiol. Infect. Dis. 2003, 22, 757–759. [Google Scholar] [CrossRef]
- Bemer, P.; Palicova, F.; Rusch-Gerdes, S.; Drugeon, H.B.; Pfyffer, G.E. Multicenter evaluation of fully automated bactec mycobacteria growth indicator tube 960 system for susceptibility testing of mycobacterium tuberculosis. J. Clin. Microbiol. 2002, 40, 150–154. [Google Scholar] [CrossRef]
- Reis, R.S.; Neves, I.; Lourenco, S.L.S.; Fonseca, L.S.; Lourenco, M.C.S. Comparison of flow cytometric and alamar blue tests with the proportional method for testing susceptibility of mycobacterium tuberculosis to rifampin and isoniazid. J. Clin. Microbiol. 2004, 42, 2247–2248. [Google Scholar] [CrossRef]
- Chauca, J.A.; Palomino, J.C.; Guerra, H. Evaluation of the accuracy of the microplate alamar blue assay for rapid detection of mdr-tb in peru. Int. J. Tuberc. Lung Dis. 2007, 11, 820–822. [Google Scholar]
- Kohli, A.; Bashir, G.; Fatima, A.; Jan, A.; Wani, N.-U.-D.; Ahmad, J. Rapid drug-susceptibility testing of mycobacterium tuberculosis clinical isolates to first-line antitubercular drugs by nitrate reductase assay: A comparison with proportion method. Int. J. Mycobacteriol. 2016, 5, 469–474. [Google Scholar] [CrossRef]
- Van Deun, A.; Aung, K.J.M.; Bola, V.; Lebeke, R.; Hossain, M.A.; de Rijk, W.B.; Rigouts, L.; Gumusboga, A.; Torrea, G.; de Jong, B.C. Rifampin drug resistance tests for tuberculosis: Challenging the gold standard. J. Clin. Microbiol. 2013, 51, 2633–2640. [Google Scholar] [CrossRef]
- Caviedes, L.; Lee, T.S.; Gilman, R.H.; Sheen, P.; Spellman, E.; Lee, E.H.; Berg, D.E.; Montenegro-James, S.; Tuberculosis Working Grp, P. Rapid, efficient detection and drug susceptibility testing of mycobacterium tuberculosis in sputum by microscopic observation of broth cultures. J. Clin. Microbiol. 2000, 38, 1203–1208. [Google Scholar] [PubMed]
- Park, W.G.; Bishai, W.R.; Chaisson, R.E.; Dorman, S.E. Performance of the microscopic observation drug susceptibility assay in drug susceptibility testing for mycobacterium tuberculosis. J. Clin. Microbiol. 2002, 40, 4750–4752. [Google Scholar] [CrossRef] [PubMed]
- Moore, D.A.J.; Mendoza, D.; Gilman, R.H.; Evans, C.A.W.; Delgado, M.G.H.; Guerra, J.; Caviedes, L.; Vargas, D.; Ticona, E.; Ortiz, J.; et al. Microscopic observation drug susceptibility assay, a rapid, reliable diagnostic test for multidrug-resistant tuberculosis suitable for use in resource-poor settings. J. Clin. Microbiol. 2004, 42, 4432–4437. [Google Scholar] [CrossRef] [PubMed]
- Sloan, D.J.; Lewis, J.M. Management of multidrug-resistant tb: Novel treatments and their expansion to low resource settings. Trans. R. Soc. Trop. Med. Hyg. 2016, 110, 163–172. [Google Scholar] [CrossRef] [PubMed]
- Zhang, Y.; Mitchison, D. The curious characteristics of pyrazinamide: A review. Int. J. Tuberc. Lung Dis. 2003, 7, 6–21. [Google Scholar]
- Sengstake, S.; Bergval, I.L.; Schuitema, A.R.; de Beer, J.L.; Phelan, J.; de Zwaan, R.; Clark, T.G.; van Soolingen, D.; Anthony, R.M. Pyrazinamide resistance-conferring mutations in pnca and the transmission of multidrug resistant tb in georgia. BMC Infect. Dis. 2017, 17, 491. [Google Scholar] [CrossRef]
- Global Tuberculosis Report 2016; World Health Organization: Geneva, Switzerland, 2016.
- Yadon, A.N.; Maharaj, K.; Adamson, J.H.; Lai, Y.-P.; Sacchettini, J.C.; Ioerger, T.R.; Rubin, E.J.; Pym, A.S. A comprehensive characterization of pnca polymorphisms that confer resistance to pyrazinamide. Nat. Commun. 2017, 8, 588. [Google Scholar] [CrossRef]
- Allana, S.; Shashkina, E.; Mathema, B.; Bablishvili, N.; Tukvadze, N.; Shah, N.S.; Kempker, R.R.; Blumberg, H.M.; Moodley, P.; Mlisana, K.; et al. Pnca gene mutations associated with pyrazinamide resistance in drug-resistant tuberculosis, south africa and georgia. Emerg. Infect. Dis. 2017, 23, 491–495. [Google Scholar] [CrossRef]
- Mitchison, D.A. The action of antituberculosis drugs in short-course chemotherapy. Tubercle 1985, 66, 219–225. [Google Scholar] [CrossRef]
- Chang, K.C.; Yew, W.W.; Zhang, Y. Pyrazinamide susceptibility testing in mycobacterium tuberculosis: A systematic review with meta-analyses. Antimicrob. Agents Chemother. 2011, 55, 4499–4505. [Google Scholar] [CrossRef] [PubMed]
- Zimic, M.; Loli, S.; Gilman, R.H.; Gutierrez, A.; Fuentes, P.; Cotrina, M.; Kirwan, D.; Sheen, P. A new approach for pyrazinamide susceptibility testing in mycobacterium tuberculosis. Microb. Drug Resist. 2012, 18, 372–375. [Google Scholar] [CrossRef] [PubMed]
- Heifets, L.; Lindholm-Levy, P. Pyrazinamide sterilizing activity in vitro against semidormant mycobacterium tuberculosis bacterial populations. Am. Rev. Respir. Dis. 1992, 145, 1223–1225. [Google Scholar] [CrossRef] [PubMed]
- Zhang, Y.; Wade, M.M.; Scorpio, A.; Zhang, H.; Sun, Z.H. Mode of action of pyrazinamide: Disruption of mycobacterium tuberculosis membrane transport and energetics by pyrazinoic acid. J. Antimicrob. Chemother. 2003, 52, 790–795. [Google Scholar] [CrossRef]
- Alcántara, R.; Fuentes, P.; Antiparra, R.; Santos, M.; Gilman, R.H.; Kirwan, D.E.; Zimic, M.; Sheen, P. MODS-wayne, a Colorimetric Adaptation of the Microscopic-Observation Drug Susceptibility (MODS) Assay for Detection of Mycobacterium tuberculosis Pyrazinamide Resistance from Sputum Samples. J. Clin. Microbiol. 2019, 57, e01162-18. [Google Scholar] [CrossRef]
- Wayne, L.G. Simple pyrazinamidase and urease tests for routine identification of mycobacteria. Am. Rev. Respir. Dis. 1974, 109, 147–151. [Google Scholar] [PubMed]
- Lacroix, C.; Langlois, B.; Menager, S.; Lafont, O. Concomitant microdetermination of serum pyrazinamide and pyrazinoic acid by liquid-chromatography. Ann. Biol. Clin. 1987, 45, 297–299. [Google Scholar]
- Lacroix, C.; Poncet, P.; Laine, G.; Guyonnaud, C.; Ray, M.; Menager, S.; Lafont, O. Microdetermination of pyrazinamide and its metabolites (2-pyrazinoic acid, 5-hydroxypyrazinoic acid, 5-hydroxypyrazinamide and pyrazinuric acid) in plasma and urine by liquid-chromatography. J. Chromatogr. Biomed. Appl. 1987, 422, 217–225. [Google Scholar] [CrossRef]
- Shah, P.A.; Sharma, P.; Shah, J.V.; Sanyal, M.; Shrivastav, P.S. An improved lc-ms/ms method for the simultaneous determination of pyrazinamide, pyrazinoic acid and 5-hydroxy pyrazinoic acid in human plasma for a pharmacokinetic study. J. Chromatogr. B 2016, 1017, 52–61. [Google Scholar] [CrossRef]
- Schlücker, S. Surface-enhanced raman spectroscopy: Concepts and chemical applications. Angew. Chem. Int. Edit. 2014, 53, 4756–4795. [Google Scholar] [CrossRef]
- Jahn, I.J.; Zukovskaja, O.; Zheng, X.S.; Weber, K.; Bocklitz, T.W.; Cialla-May, D.; Popp, J. Surface-enhanced raman spectroscopy and microfluidic platforms: Challenges, solutions and potential applications. Analyst 2017, 142, 1022–1047. [Google Scholar] [CrossRef] [PubMed]
- Bonifacio, A.; Cervo, S.; Sergo, V. Label-free surface-enhanced raman spectroscopy of biofluids: Fundamental aspects and diagnostic applications. Anal Bioanal. Chem. 2015, 407, 8265–8277. [Google Scholar] [CrossRef] [PubMed]
- Hidi, I.J.; Jahn, M.; Weber, K.; Bocklitz, T.; Pletz, M.W.; Cialla-May, D.; Popp, J. Lab-on-a-chip-surface enhanced raman scattering combined with the standard addition method: Toward the quantification of nitroxoline in spiked human urine samples. Anal. Chem. 2016, 88, 9173–9180. [Google Scholar] [CrossRef] [PubMed]
- Kalkar, A.K.; Bhosekar, N.M.; Kshirsagar, S.T. Polarized raman and infrared-spectra of pyrazinamide. Spectrochim. Acta Part A Mol. Biomol. Spectrosc. 1989, 45, 635–641. [Google Scholar] [CrossRef]
- Gunasekaran, S.; Ponnambalam, U.; Muthu, S.; Ponnusamy, S. Vibrational and normal coordinate analysis of pyrazinamide. Asian J. Chem. 2004, 16, 1513–1518. [Google Scholar]
- Chis, V.; Pirnau, A.; Jurca, T.; Vasilescu, M.; Simon, S.; Cozar, O.; David, L. Experimental and dft study of pyrazinamide. Chem. Phys. 2005, 316, 153–163. [Google Scholar] [CrossRef]
- Wang, Y.; Li, Y.S.; Wu, J.; Zhang, Z.X.; An, D.Q. Surface-enhanced raman spectra of some anti-tubercle bacillus drugs. Spectrochim. Acta Part A Mol. Biomol. Spectrosc. 2000, 56, 2637–2644. [Google Scholar] [CrossRef]
- Baldwin, J.A.; Vlckova, B.; Andrews, M.P.; Butler, I.S. Surface-enhanced raman scattering of mercaptopyridines and pyrazinamide incorporated in silver colloid adsorbate films. Langmuir 1997, 13, 3744–3751. [Google Scholar] [CrossRef]
- Castro, J.L.; Montanez, M.A.; Otero, J.C.; Marcos, J.I. Enhanced raman-scattering from pyrazinoic acid on silver and gold sols. Spectrosc. Lett. 1993, 26, 237–244. [Google Scholar] [CrossRef]
- März, A.; Ackermann, K.R.; Malsch, D.; Bocklitz, T.; Henkel, T.; Popp, J. Towards a quantitative sers approach—online monitoring of analytes in a microfluidic system with isotope-edited internal standards. J. Biophotonics 2009, 2, 232–242. [Google Scholar] [CrossRef]
- Song, H.; Tice, J.D.; Ismagilov, R.F. A microfluidic system for controlling reaction networks in time. Angew. Chem. Int. Edit. 2003, 42, 768–772. [Google Scholar] [CrossRef] [PubMed]
- Henkel, T.; Bermig, T.; Kielpinski, M.; Grodrian, A.; Metze, J.; Köhler, J.M. Chip modules for generation and manipulation of fluid segments for micro serial flow processes. Chem. Eng. J. 2004, 101, 439–445. [Google Scholar] [CrossRef]
- Zhang, D.M.; Xie, Y.; Deb, S.K.; Davison, V.J.; Ben-Amotz, D. Isotope edited internal standard method for quantitative surface-enhanced raman spectroscopy. Anal. Chem. 2005, 77, 3563–3569. [Google Scholar] [CrossRef] [PubMed]
- Leopold, N.; Lendl, B. A new method for fast preparation of highly surface-enhanced raman scattering (sers) active silver colloids at room temperature by reduction of silver nitrate with hydroxylamine hydrochloride. J. Phys. Chem. B 2003, 107, 5723–5727. [Google Scholar] [CrossRef]
- Dugandžić, V.; Hidi, I.J.; Weber, K.; Cialla-May, D.; Popp, J. In situ hydrazine reduced silver colloid synthesis—Enhancing sers reproducibility. Anal. Chim. Acta 2016, 946, 73–79. [Google Scholar] [CrossRef] [PubMed]
- R Core Team. R: A Language and Environment for Statistical Computing; R Foundation for Statistical Computing: Vienna, Austria, 2014; Available online: http://www.R-project.org (accessed on 20 June 2019).
- Ryan, C.G.; Clayton, E.; Griffin, W.L.; Sie, S.H.; Cousens, D.R. Snip, a statistics-sensitive background treatment for the quantitative-analysis of pixe spectra in geoscience applications. Nucl. Instrum. Methods B 1988, 34, 396–402. [Google Scholar] [CrossRef]
- März, A.; Bocklitz, T.; Popp, J. Online-calibration for reliable and robust lab-on-a-chip surface enhanced raman spectroscopy measurement in a liquid/liquid segmented flow. Anal Chem. 2011, 83, 8337–8340. [Google Scholar] [CrossRef]
- Moskovits, M.; Suh, J.S. Surface selection-rules for surface-enhanced raman-spectroscopy—Calculations and application to the surface-enhanced raman-spectrum of phthalazine on silver. J. Phys. Chem. 1984, 88, 5526–5530. [Google Scholar] [CrossRef]
- Mühlig, A.; Cialla-May, D.; Popp, J. Fundamental sers investigation of pyridine and its derivates as a function of functional groups, their substitution position, and their interaction with silver nanoparticles. J. Phys. Chem. C 2017, 121, 2323–2332. [Google Scholar] [CrossRef]
- Arenas, J.F.; Castro, J.L.; Otero, J.C.; Marcos, J.I. Surface-enhanced raman spectra of pyrazinecarboxamide and pyrazinecarbonitrile on silver sols. J. Raman Spectrosc. 1992, 23, 249–252. [Google Scholar] [CrossRef]
- Lee, P.C.; Meisel, D. Adsorption and surface-enhanced raman of dyes on silver and gold sols. J. Phys. Chem. 1982, 86, 3391–3395. [Google Scholar] [CrossRef]
- Gao, R.; Choi, N.; Chang, S.-I.; Lee, E.K.; Choo, J. Real-time analysis of diaquat dibromide monohydrate in water with a sers-based integrated microdroplet sensor. Nanoscale 2014, 6, 8781–8786. [Google Scholar] [CrossRef] [PubMed]
- Meinzen, C.; Proaño, A.; Gilman, R.H.; Caviedes, L.; Coronel, J.; Zimic, M.; Sheen, P. A quantitative adaptation of the wayne test for pyrazinamide resistance. Tuberculosis 2016, 99, 41–46. [Google Scholar] [CrossRef] [PubMed]


© 2019 by the authors. Licensee MDPI, Basel, Switzerland. This article is an open access article distributed under the terms and conditions of the Creative Commons Attribution (CC BY) license (http://creativecommons.org/licenses/by/4.0/).
Share and Cite
Muehlig, A.; Jahn, I.J.; Heidler, J.; Jahn, M.; Weber, K.; Sheen, P.; Zimic, M.; Cialla-May, D.; Popp, J. Molecular Specific and Sensitive Detection of Pyrazinamide and Its Metabolite Pyrazinoic Acid by Means of Surface Enhanced Raman Spectroscopy Employing In Situ Prepared Colloids. Appl. Sci. 2019, 9, 2511. https://doi.org/10.3390/app9122511
Muehlig A, Jahn IJ, Heidler J, Jahn M, Weber K, Sheen P, Zimic M, Cialla-May D, Popp J. Molecular Specific and Sensitive Detection of Pyrazinamide and Its Metabolite Pyrazinoic Acid by Means of Surface Enhanced Raman Spectroscopy Employing In Situ Prepared Colloids. Applied Sciences. 2019; 9(12):2511. https://doi.org/10.3390/app9122511
Chicago/Turabian StyleMuehlig, Anna, Izabella J. Jahn, Jan Heidler, Martin Jahn, Karina Weber, Patricia Sheen, Mirko Zimic, Dana Cialla-May, and Juergen Popp. 2019. "Molecular Specific and Sensitive Detection of Pyrazinamide and Its Metabolite Pyrazinoic Acid by Means of Surface Enhanced Raman Spectroscopy Employing In Situ Prepared Colloids" Applied Sciences 9, no. 12: 2511. https://doi.org/10.3390/app9122511