

Unraveling the Life History of Past Populations through Hypercementosis: Insights into Cementum Apposition Patterns and Possible Etiologies Using Micro-CT and Confocal Microscopy
 , , , , , and
Abstract
:Simple Summary
Abstract
1. Introduction
2. Materials and Methods
2.1. Sample
2.2. Multi-Method Analysis: Visual Inspection, Microtomography, and Confocal Microscopy
2.2.1. Visual Examination
2.2.2. X-ray Microtomography
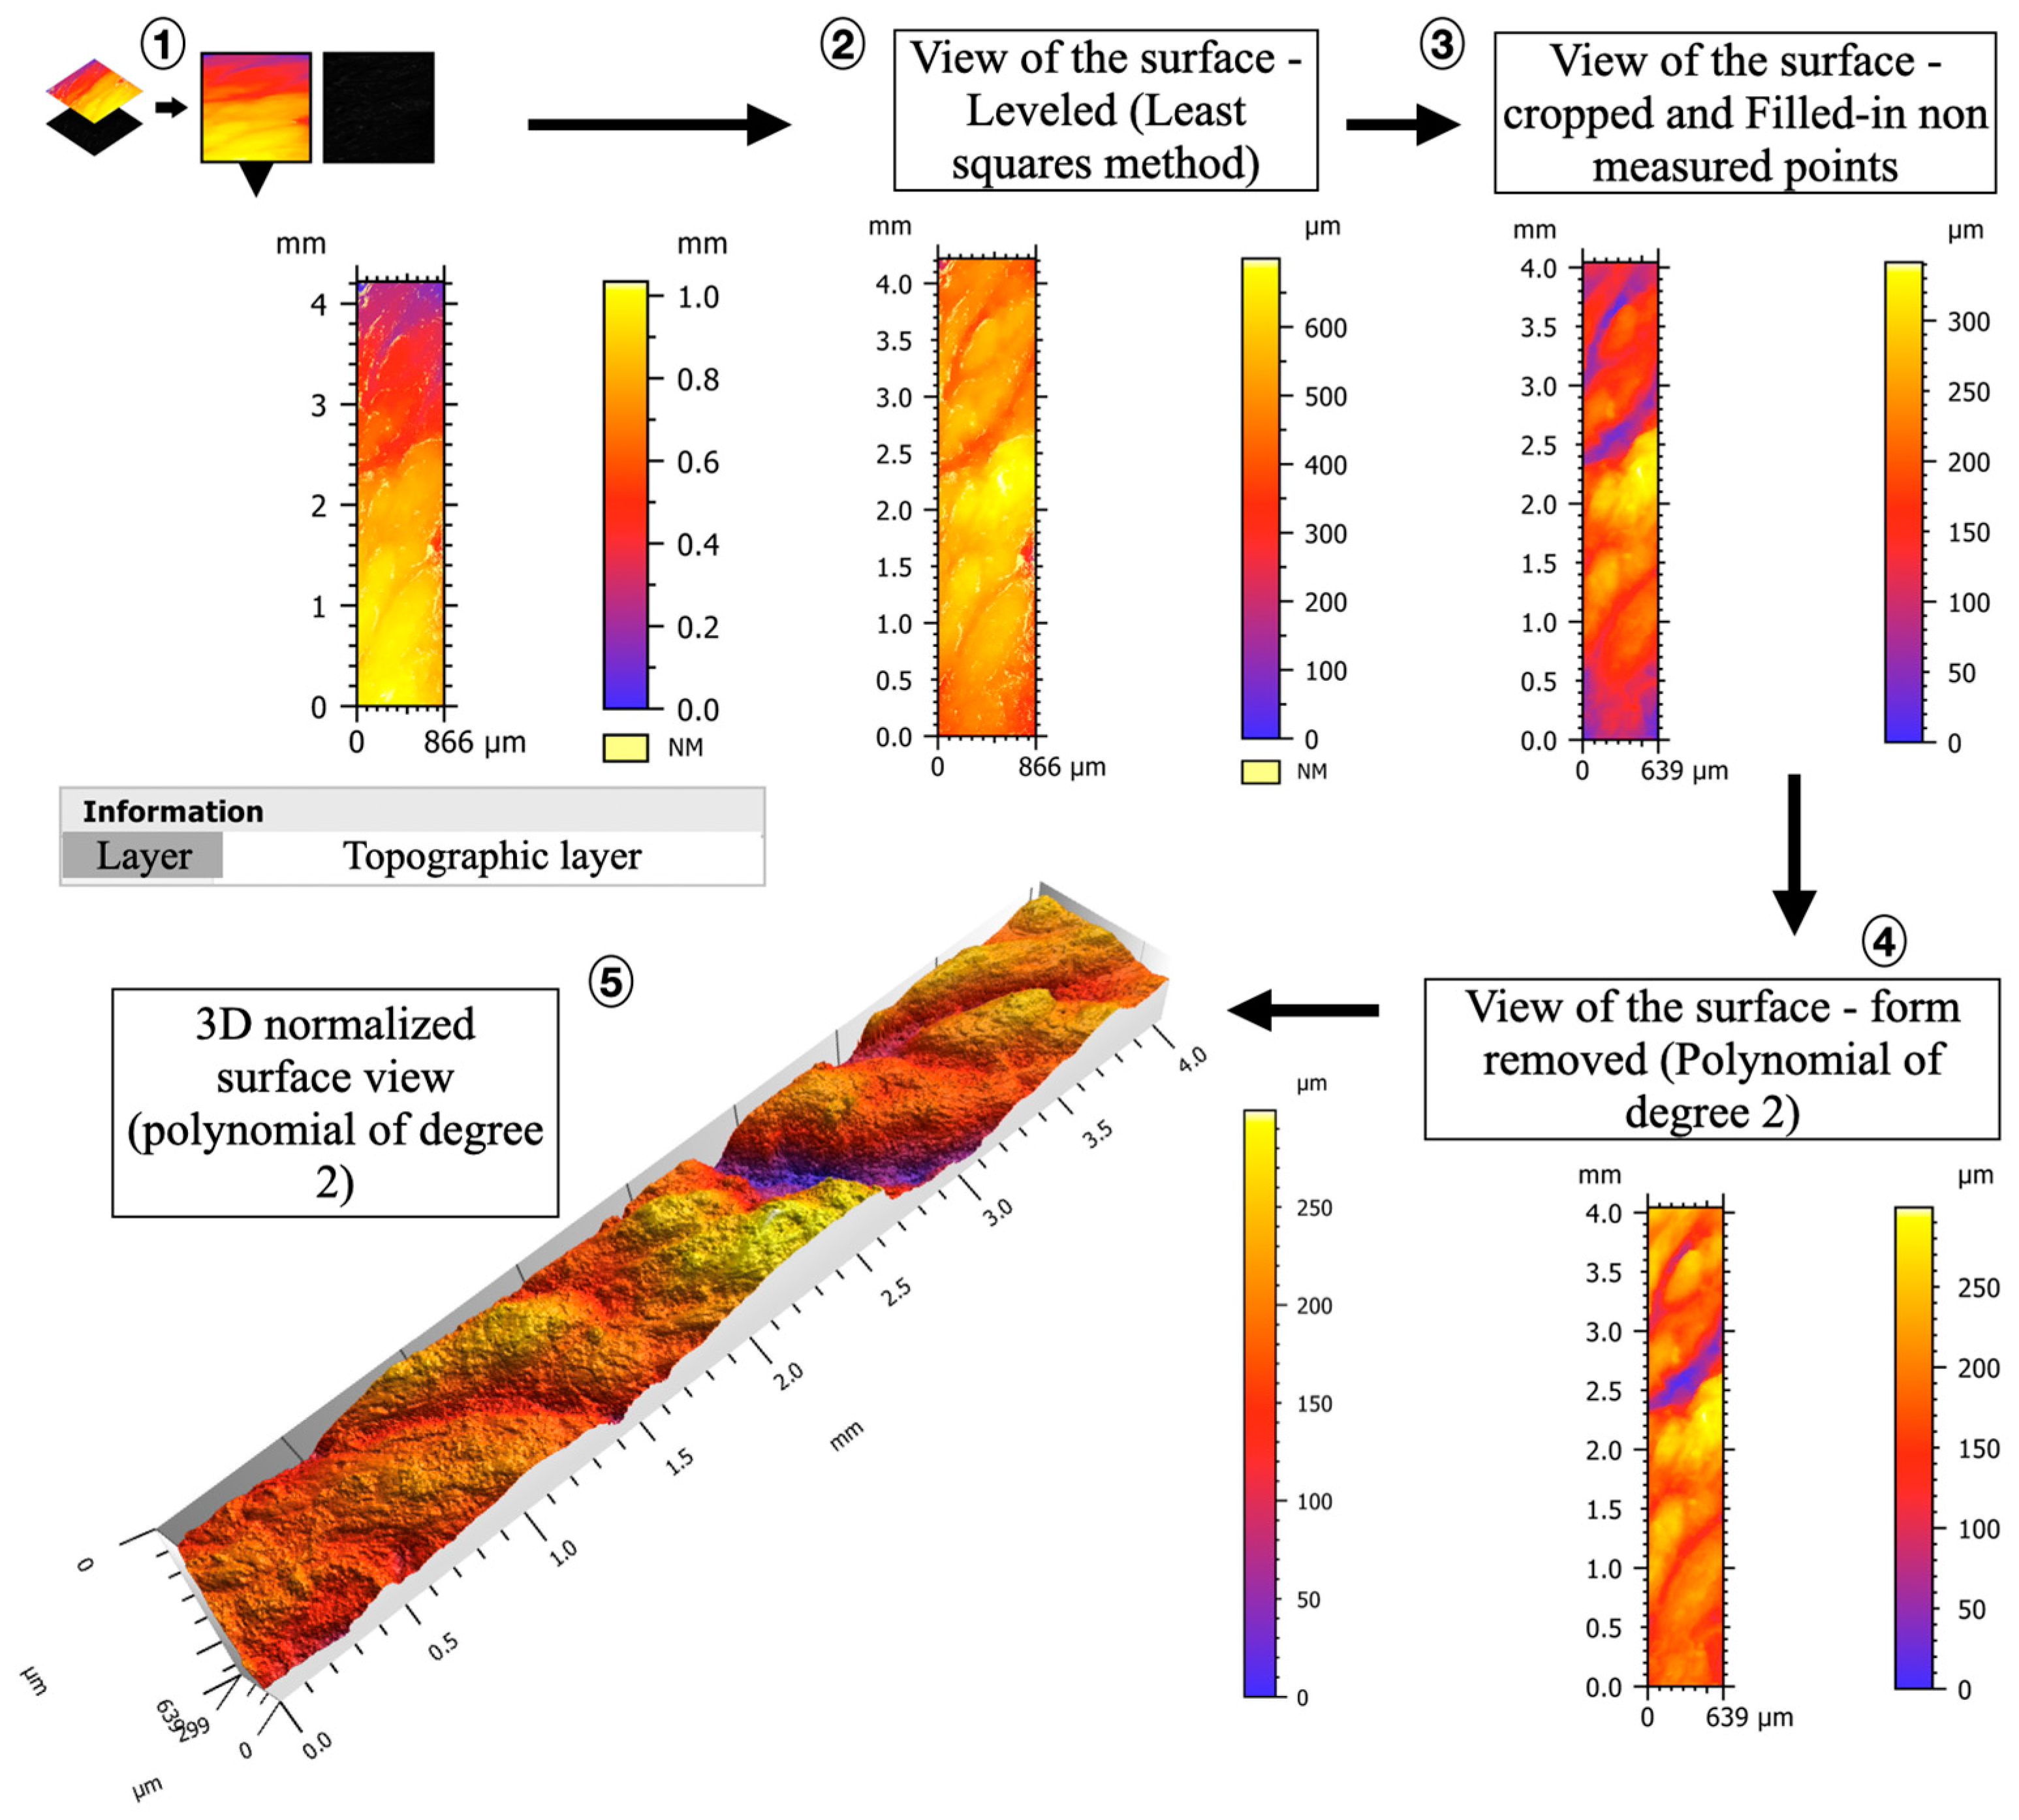
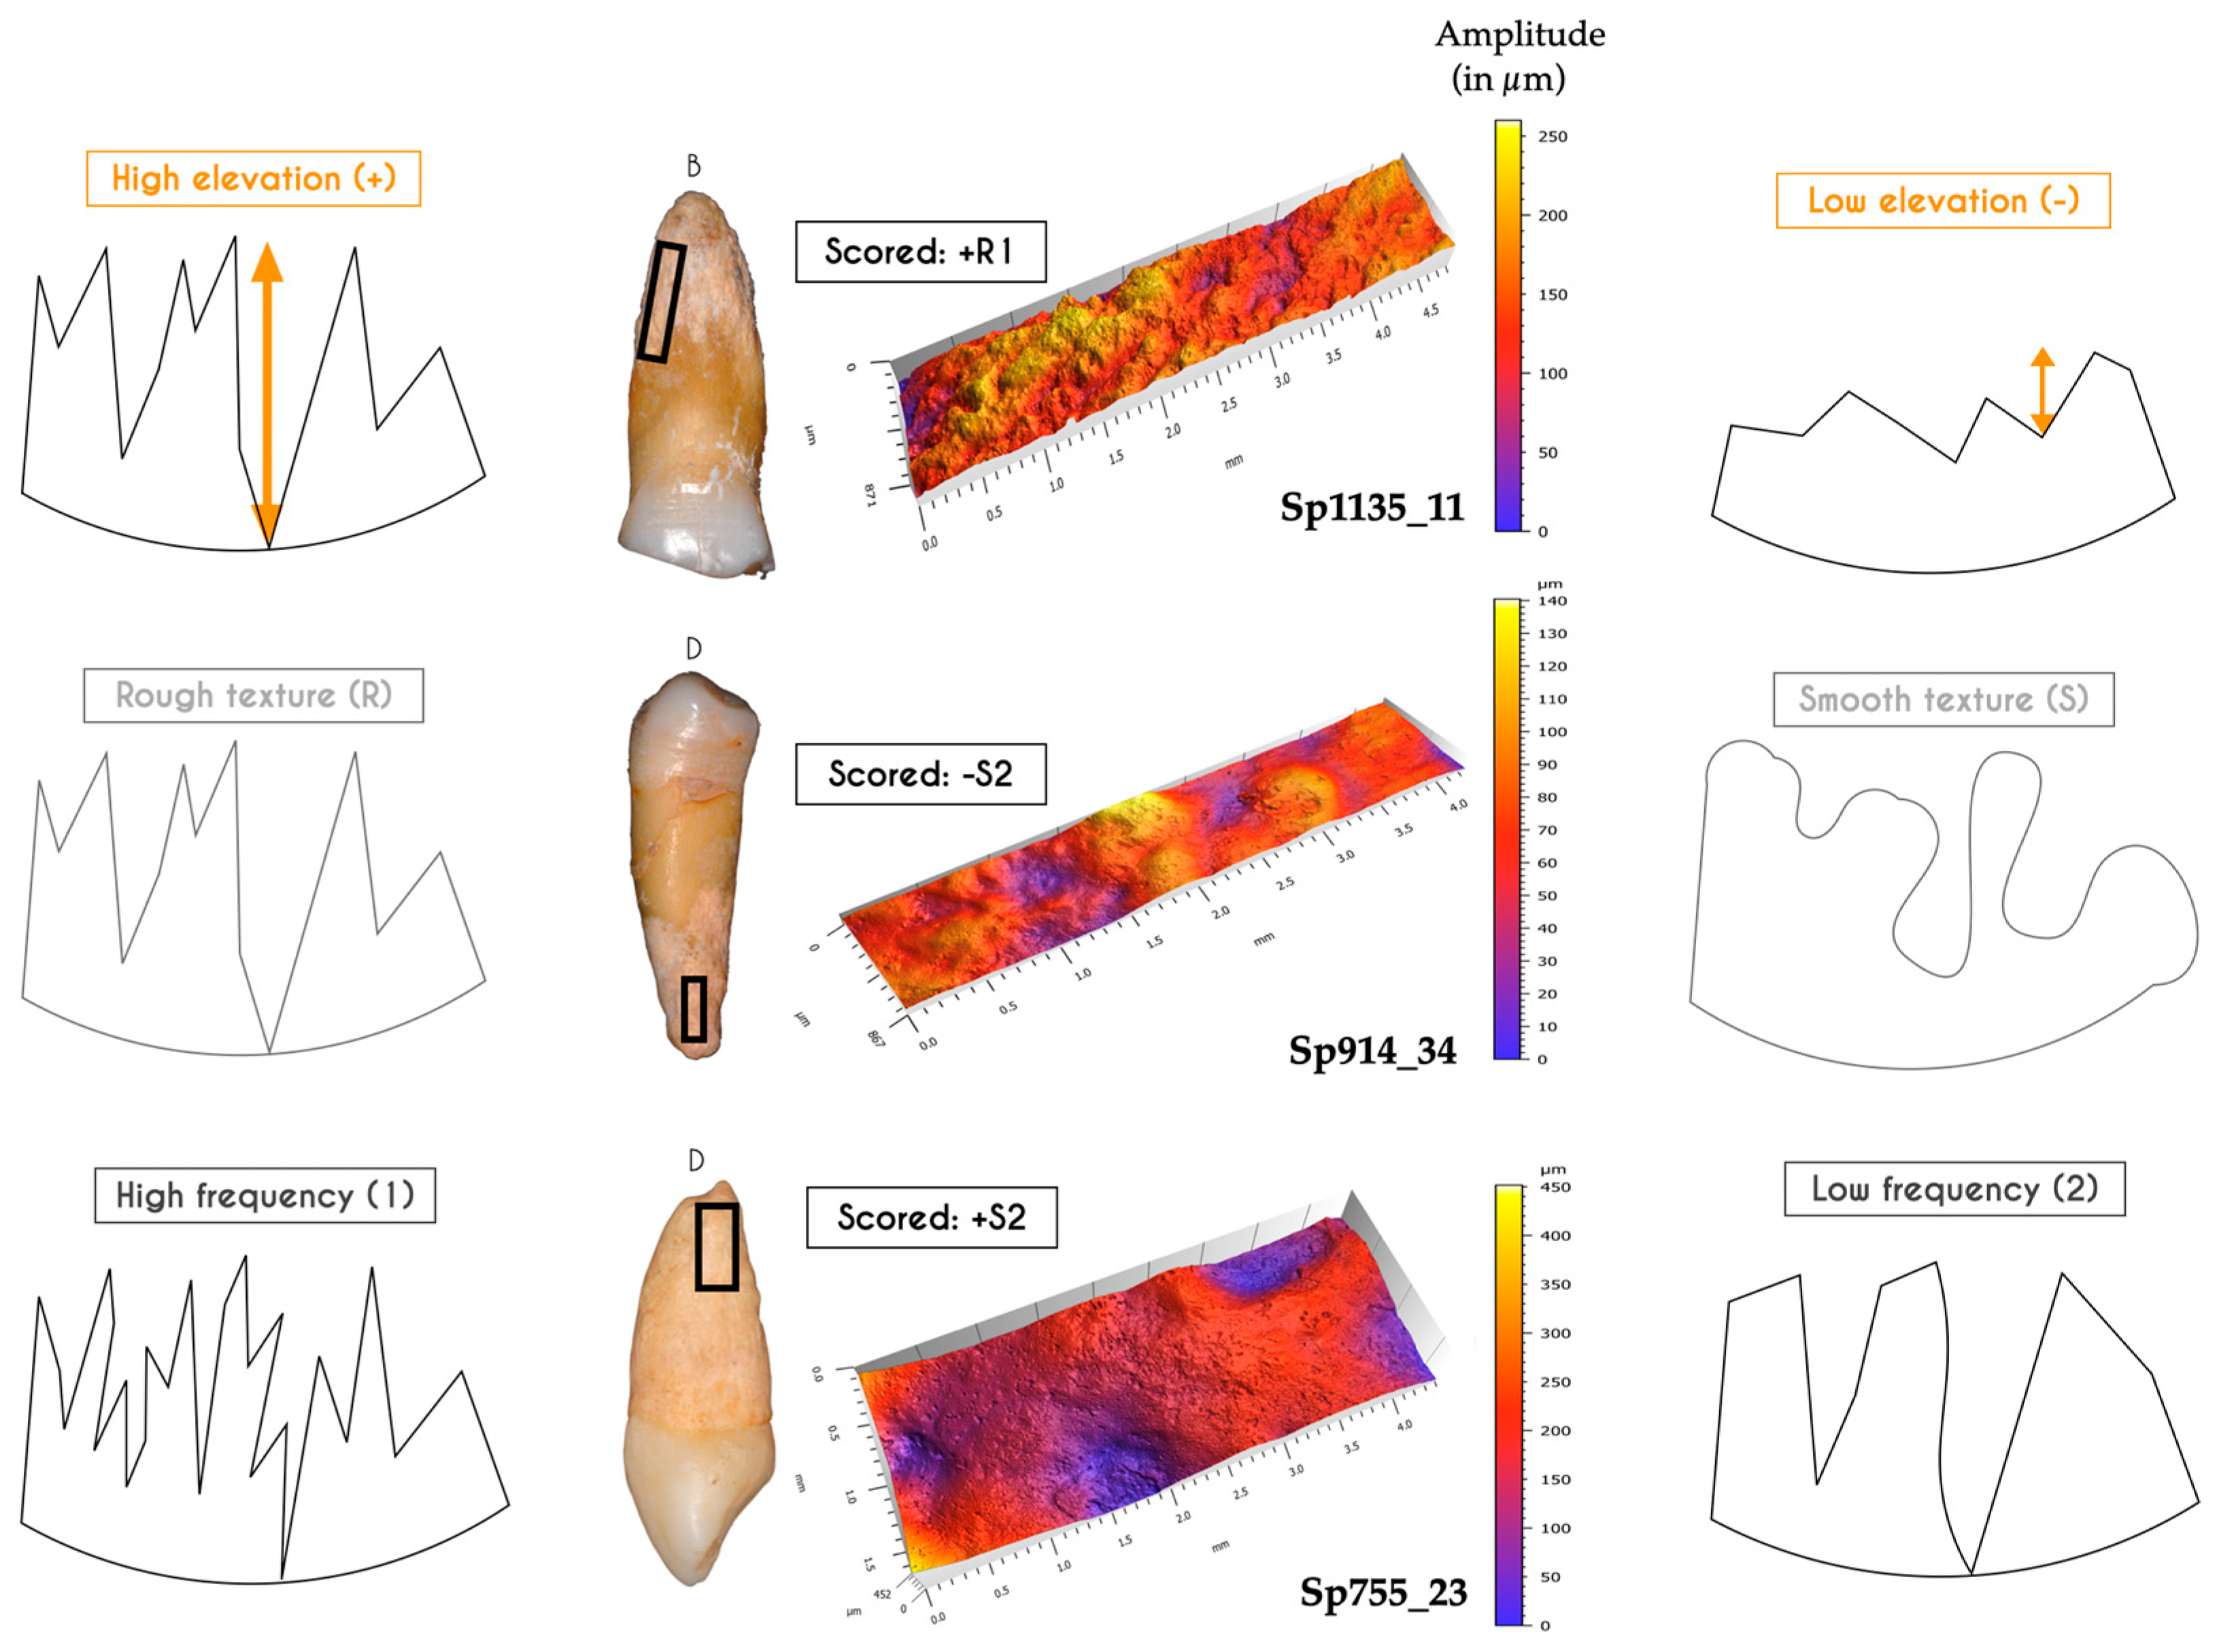
2.2.3. Confocal Microscopy
2.3. Statistical Analyses
3. Results
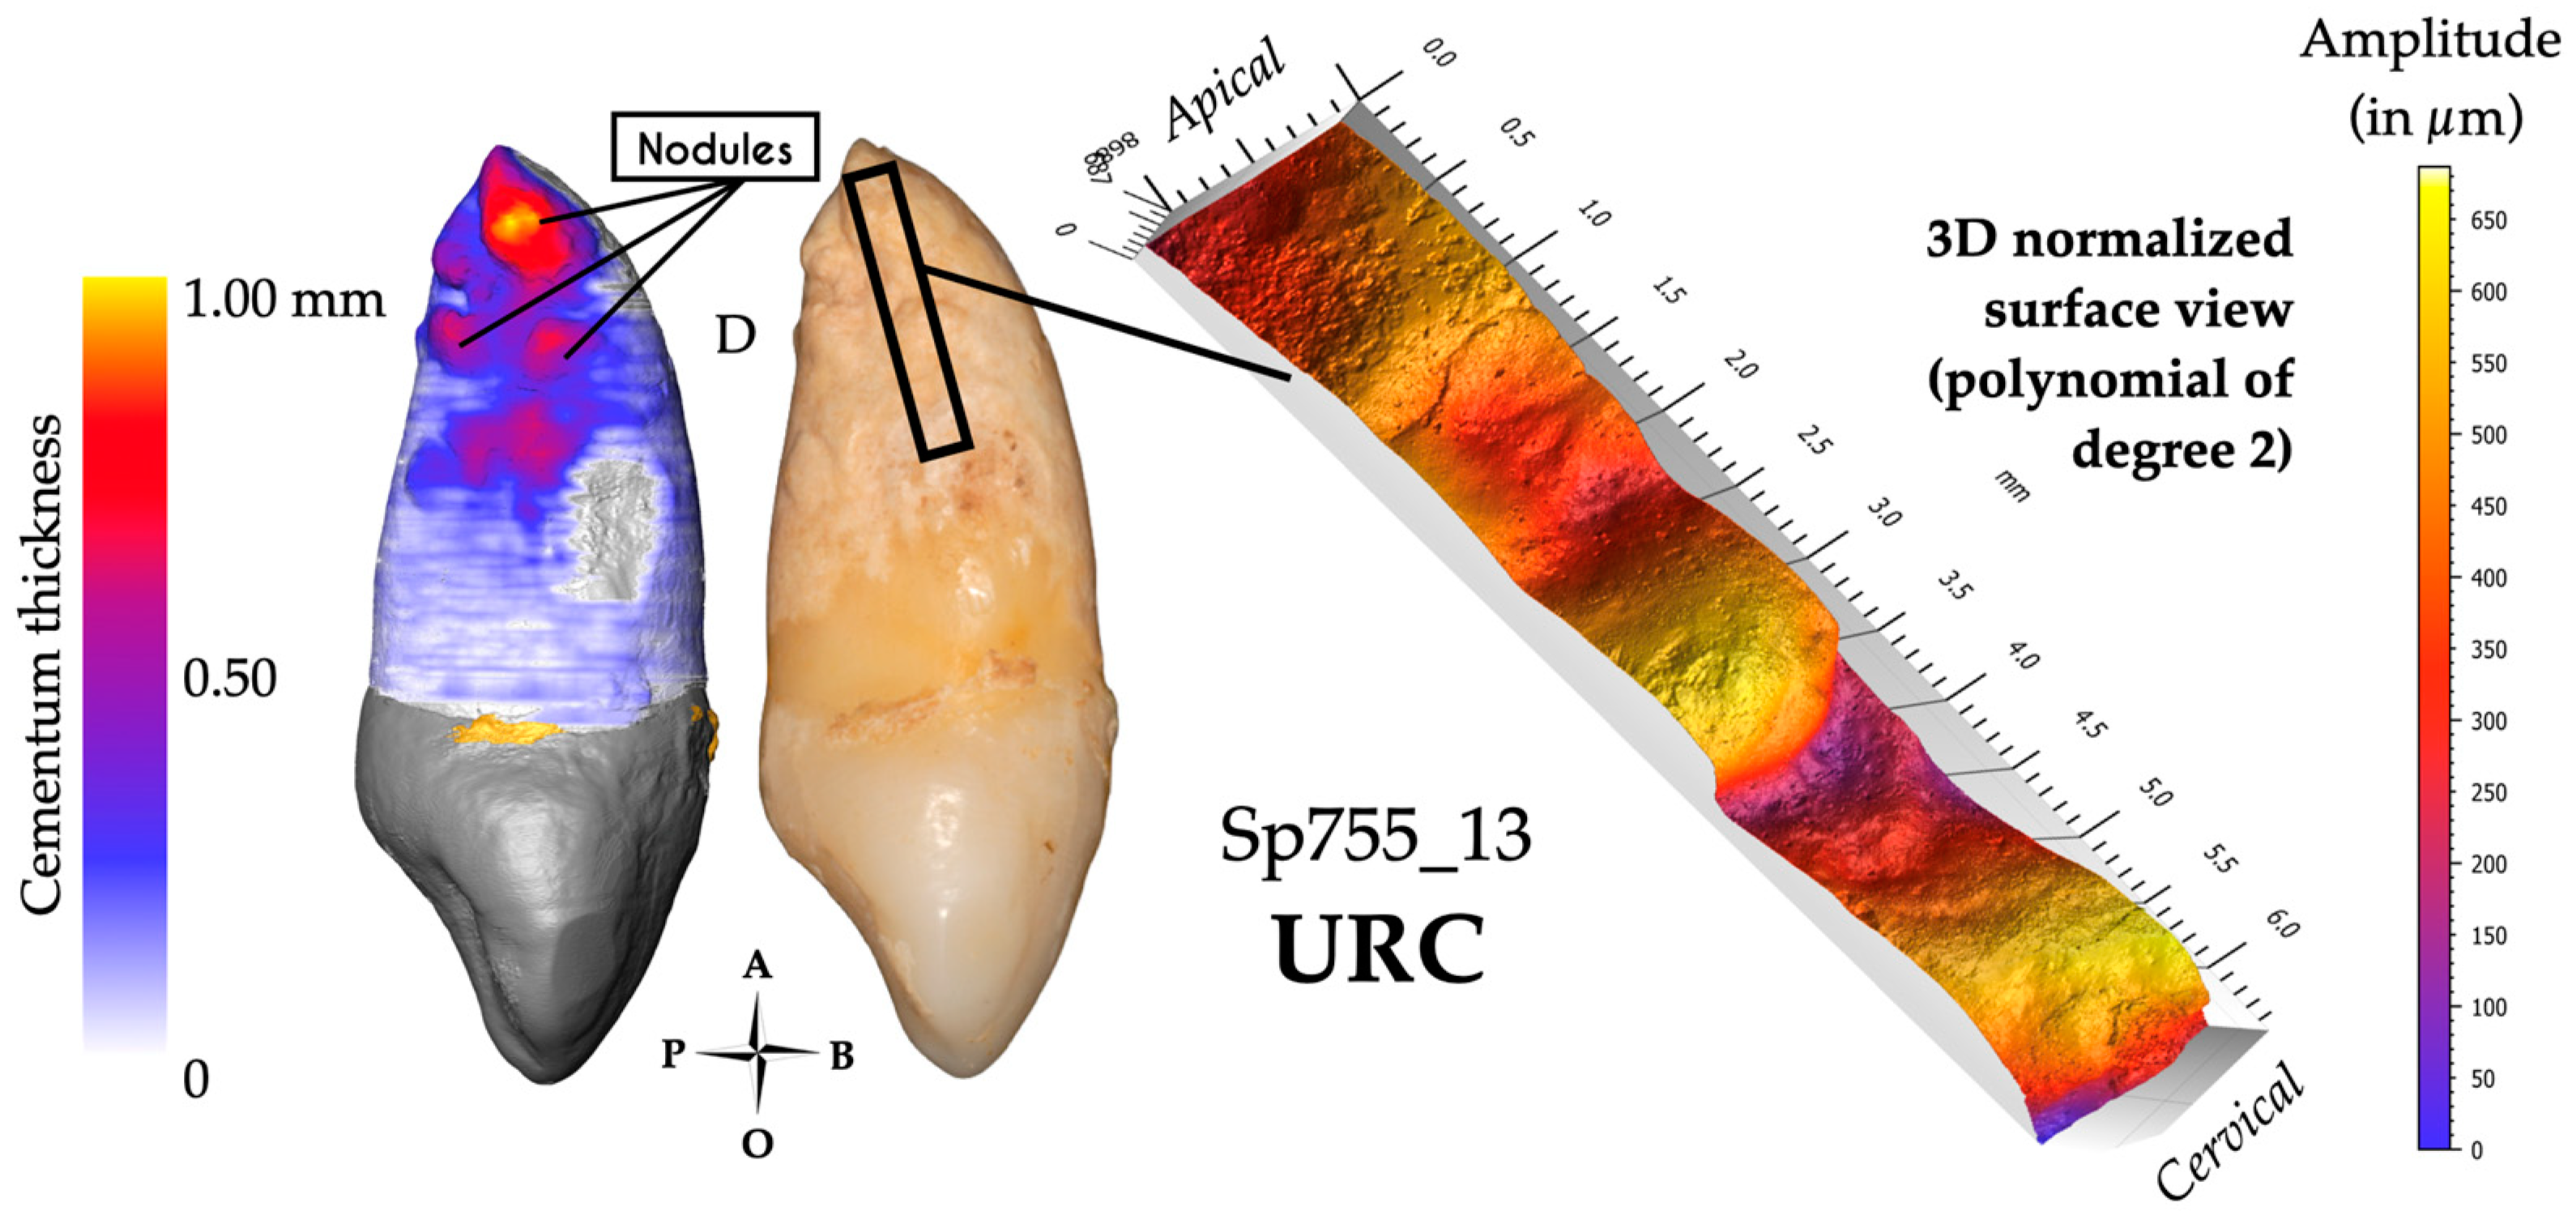
3.1. Impacted Teeth
3.1.1. Visual Examination
3.1.2. Microtomography and 3D Thickness Maps
3.1.3. Confocal Microscopy and 3D Topography Maps

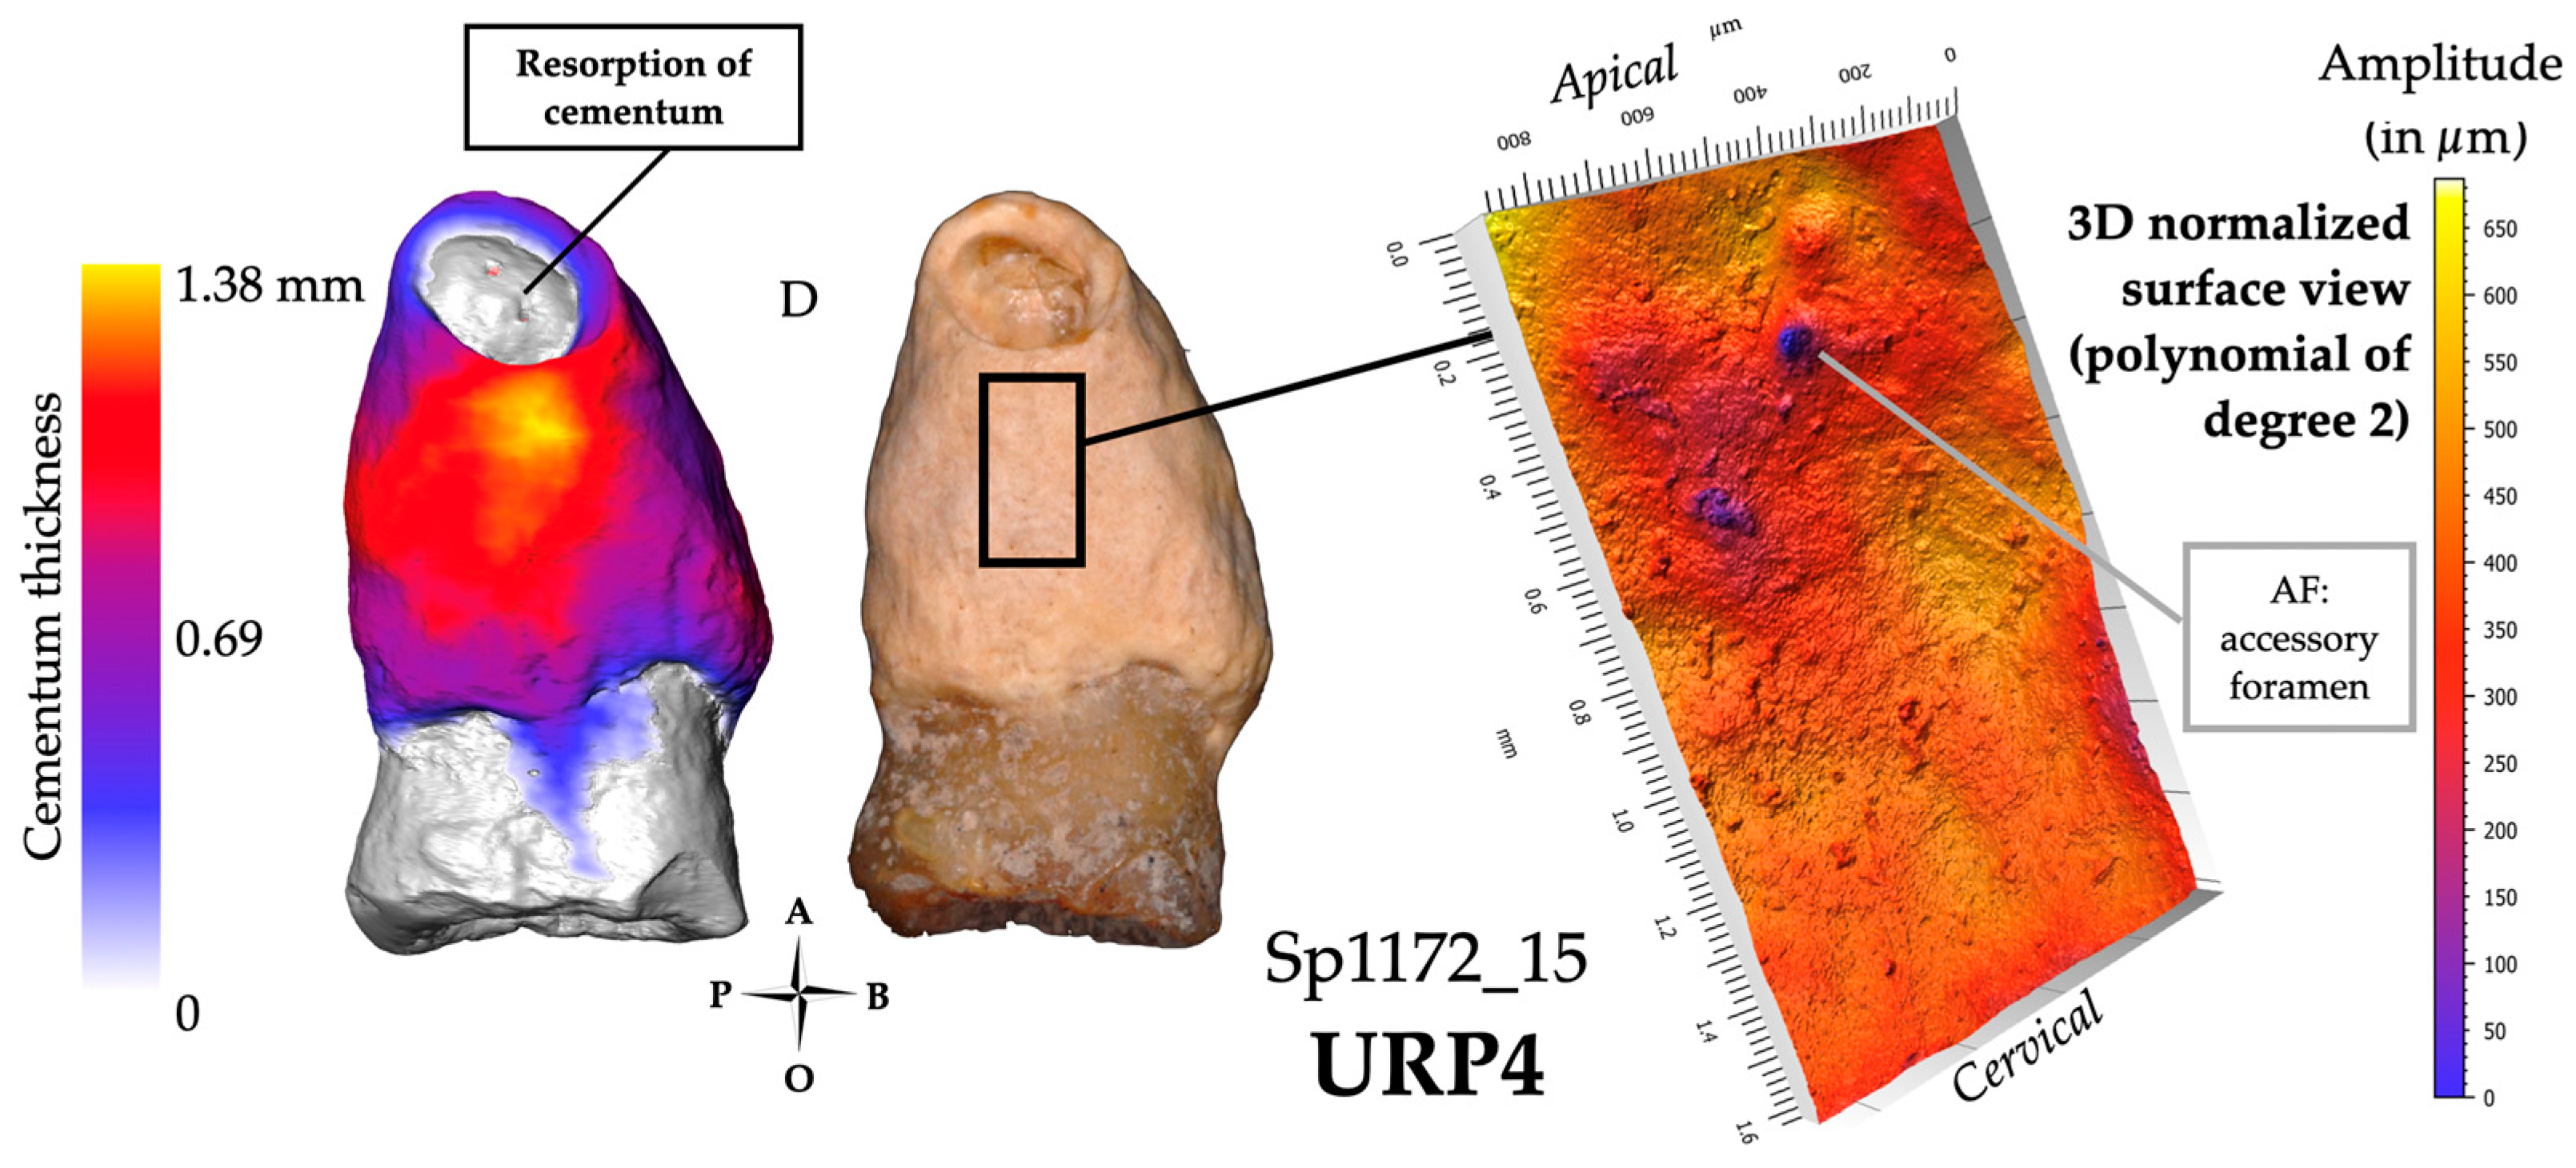
3.2. Infected Teeth
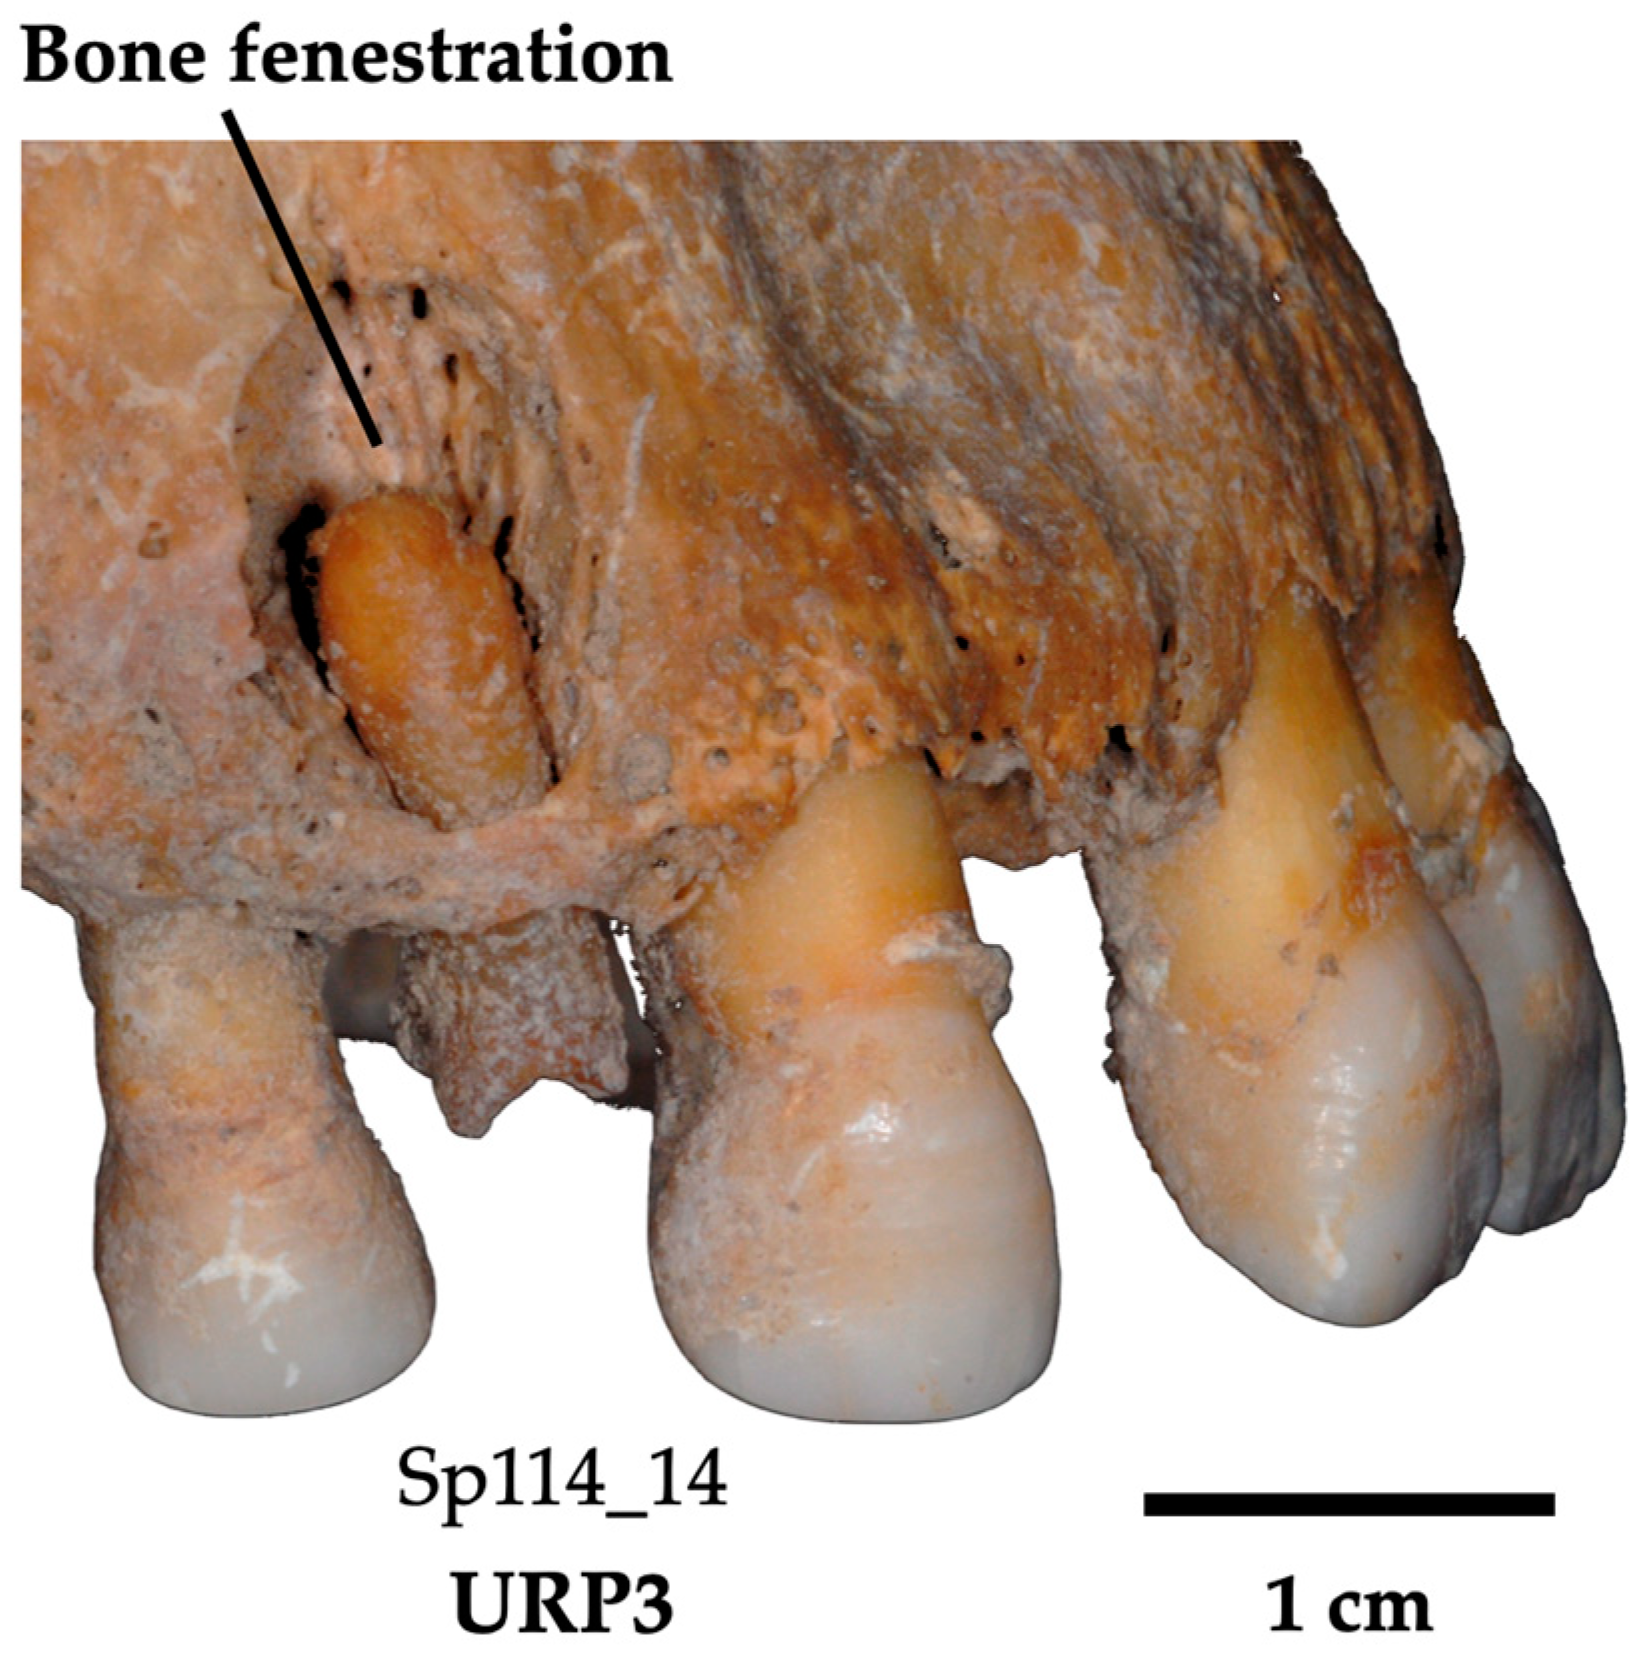
3.2.1. Visual Examination
3.2.2. Microtomography and 3D Thickness Maps
3.2.3. Confocal Microscopy and 3D Topography Maps

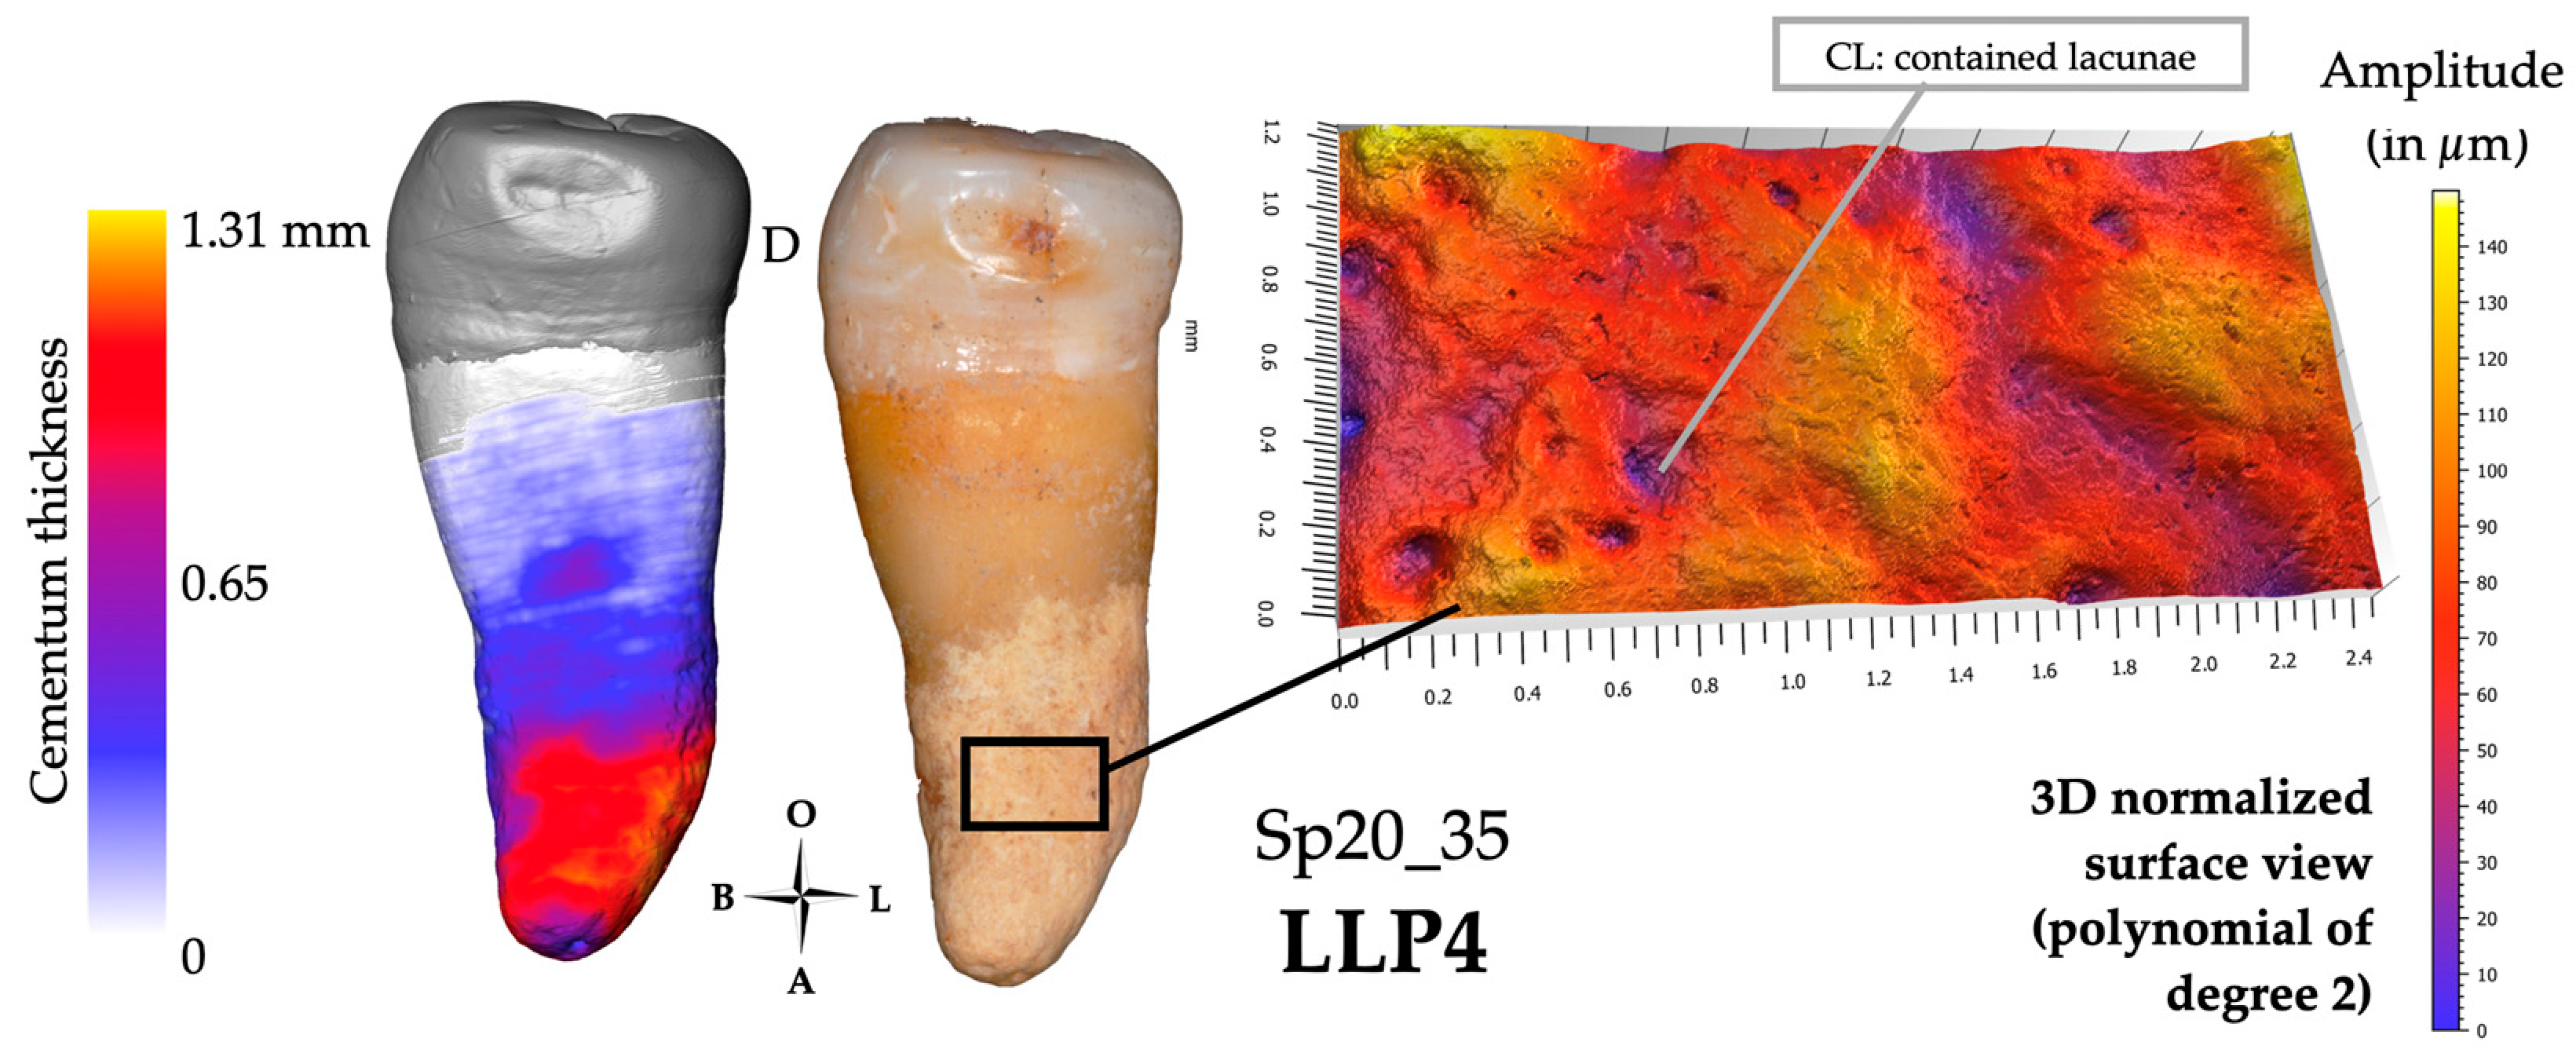
3.3. Hypofunctional Teeth
3.3.1. Visual Examination
3.3.2. Microtomography and 3D Thickness Maps
3.3.3. Confocal Microscopy and 3D Topography Maps

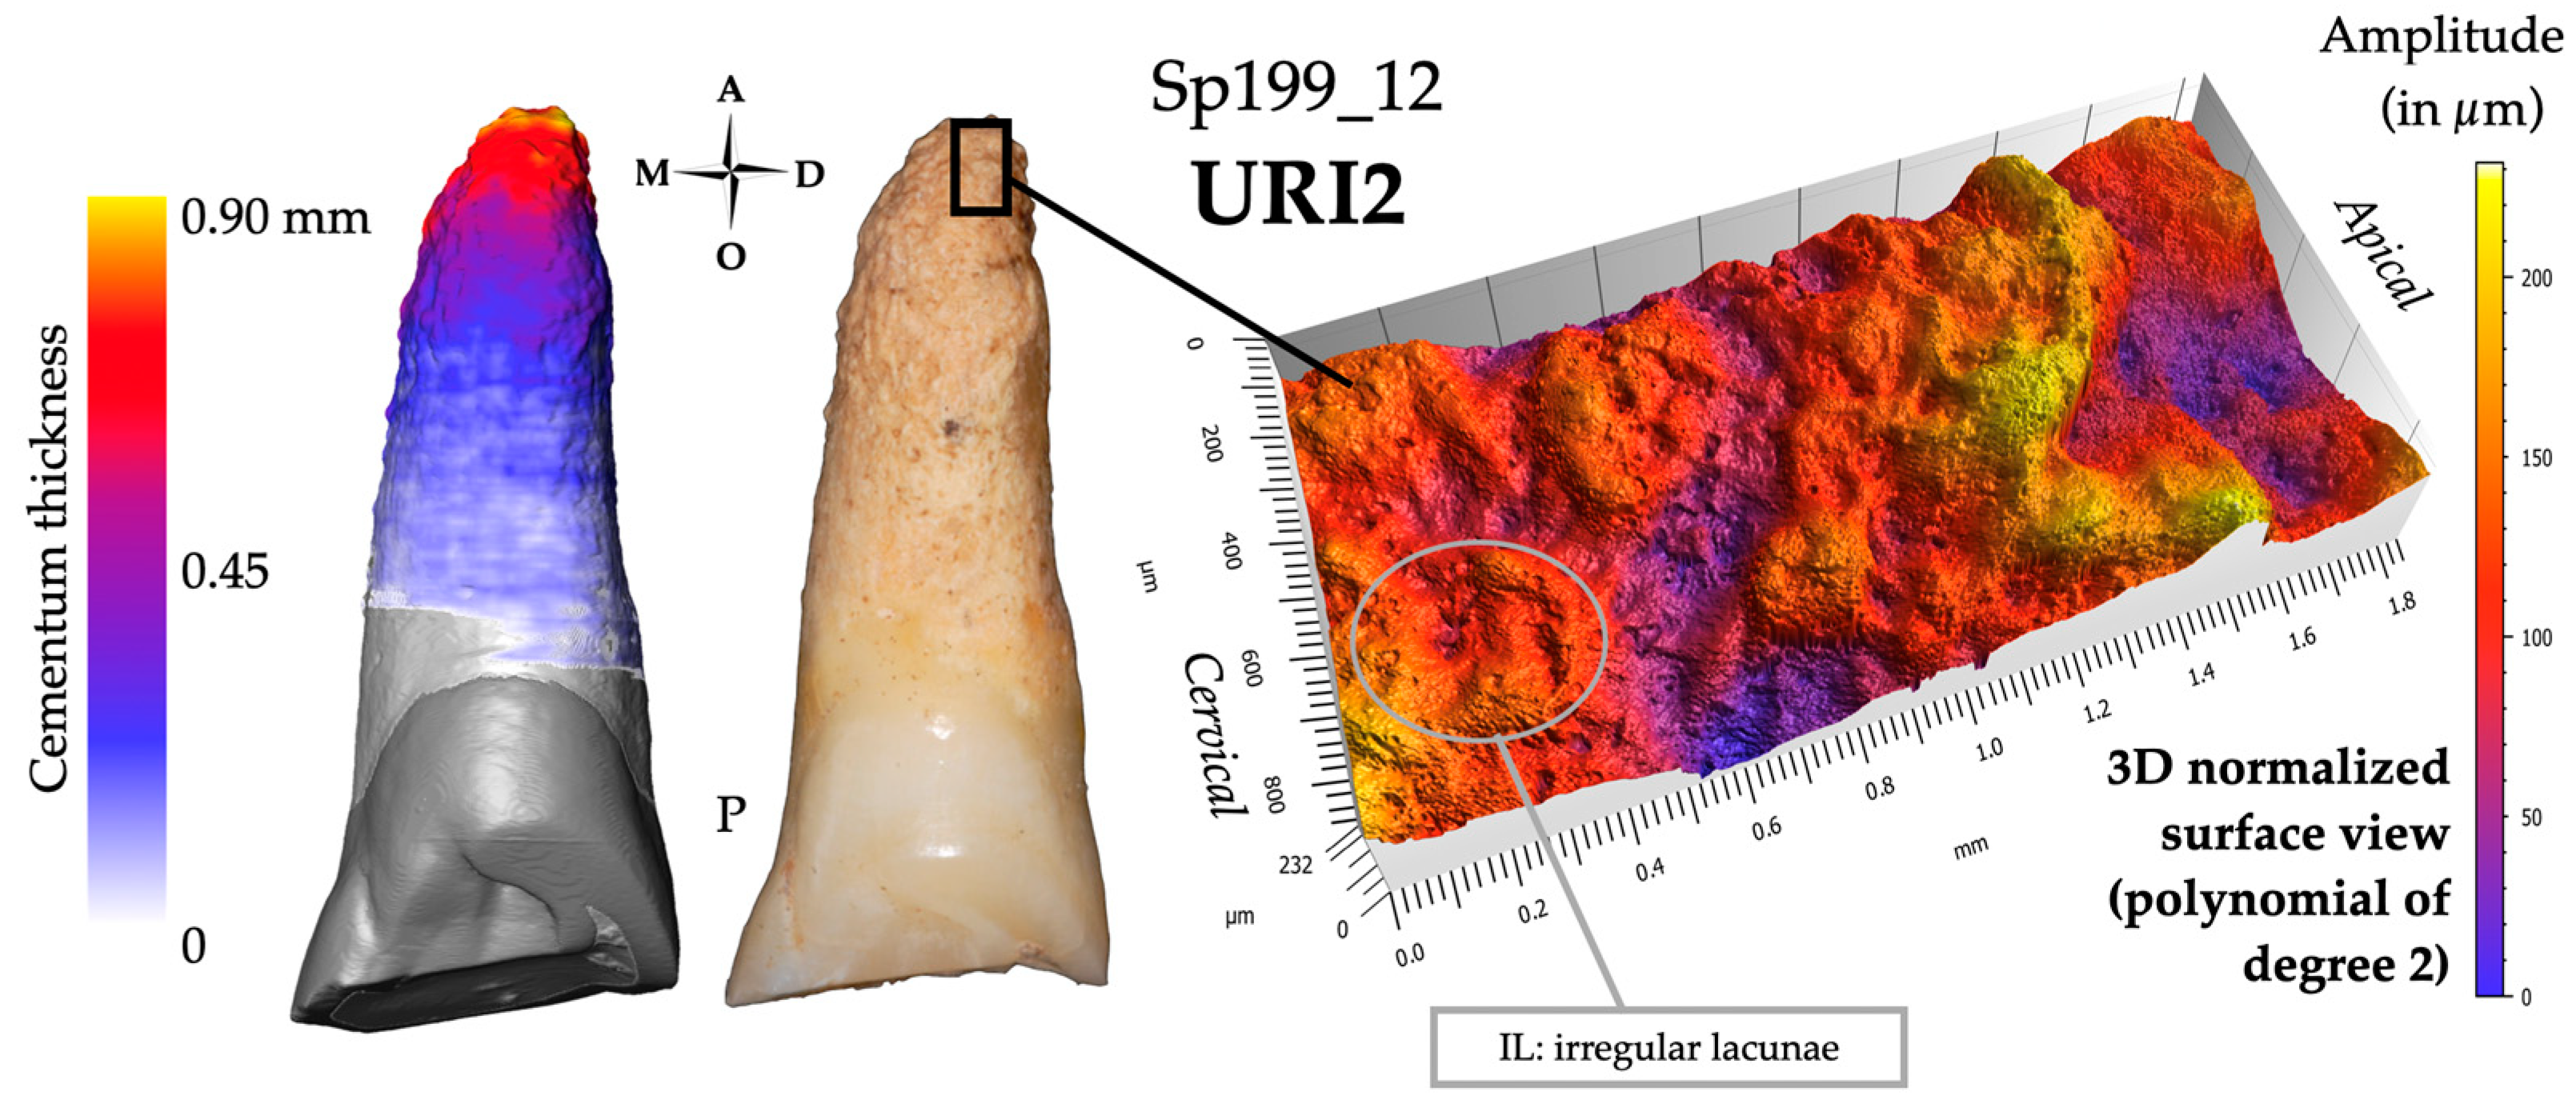
3.4. Hyperfunctional Teeth
3.4.1. Visual Examination
3.4.2. Microtomography and 3D Thickness Maps
3.4.3. Confocal Microscopy and 3D Topography Maps

3.5. Mixed Condition
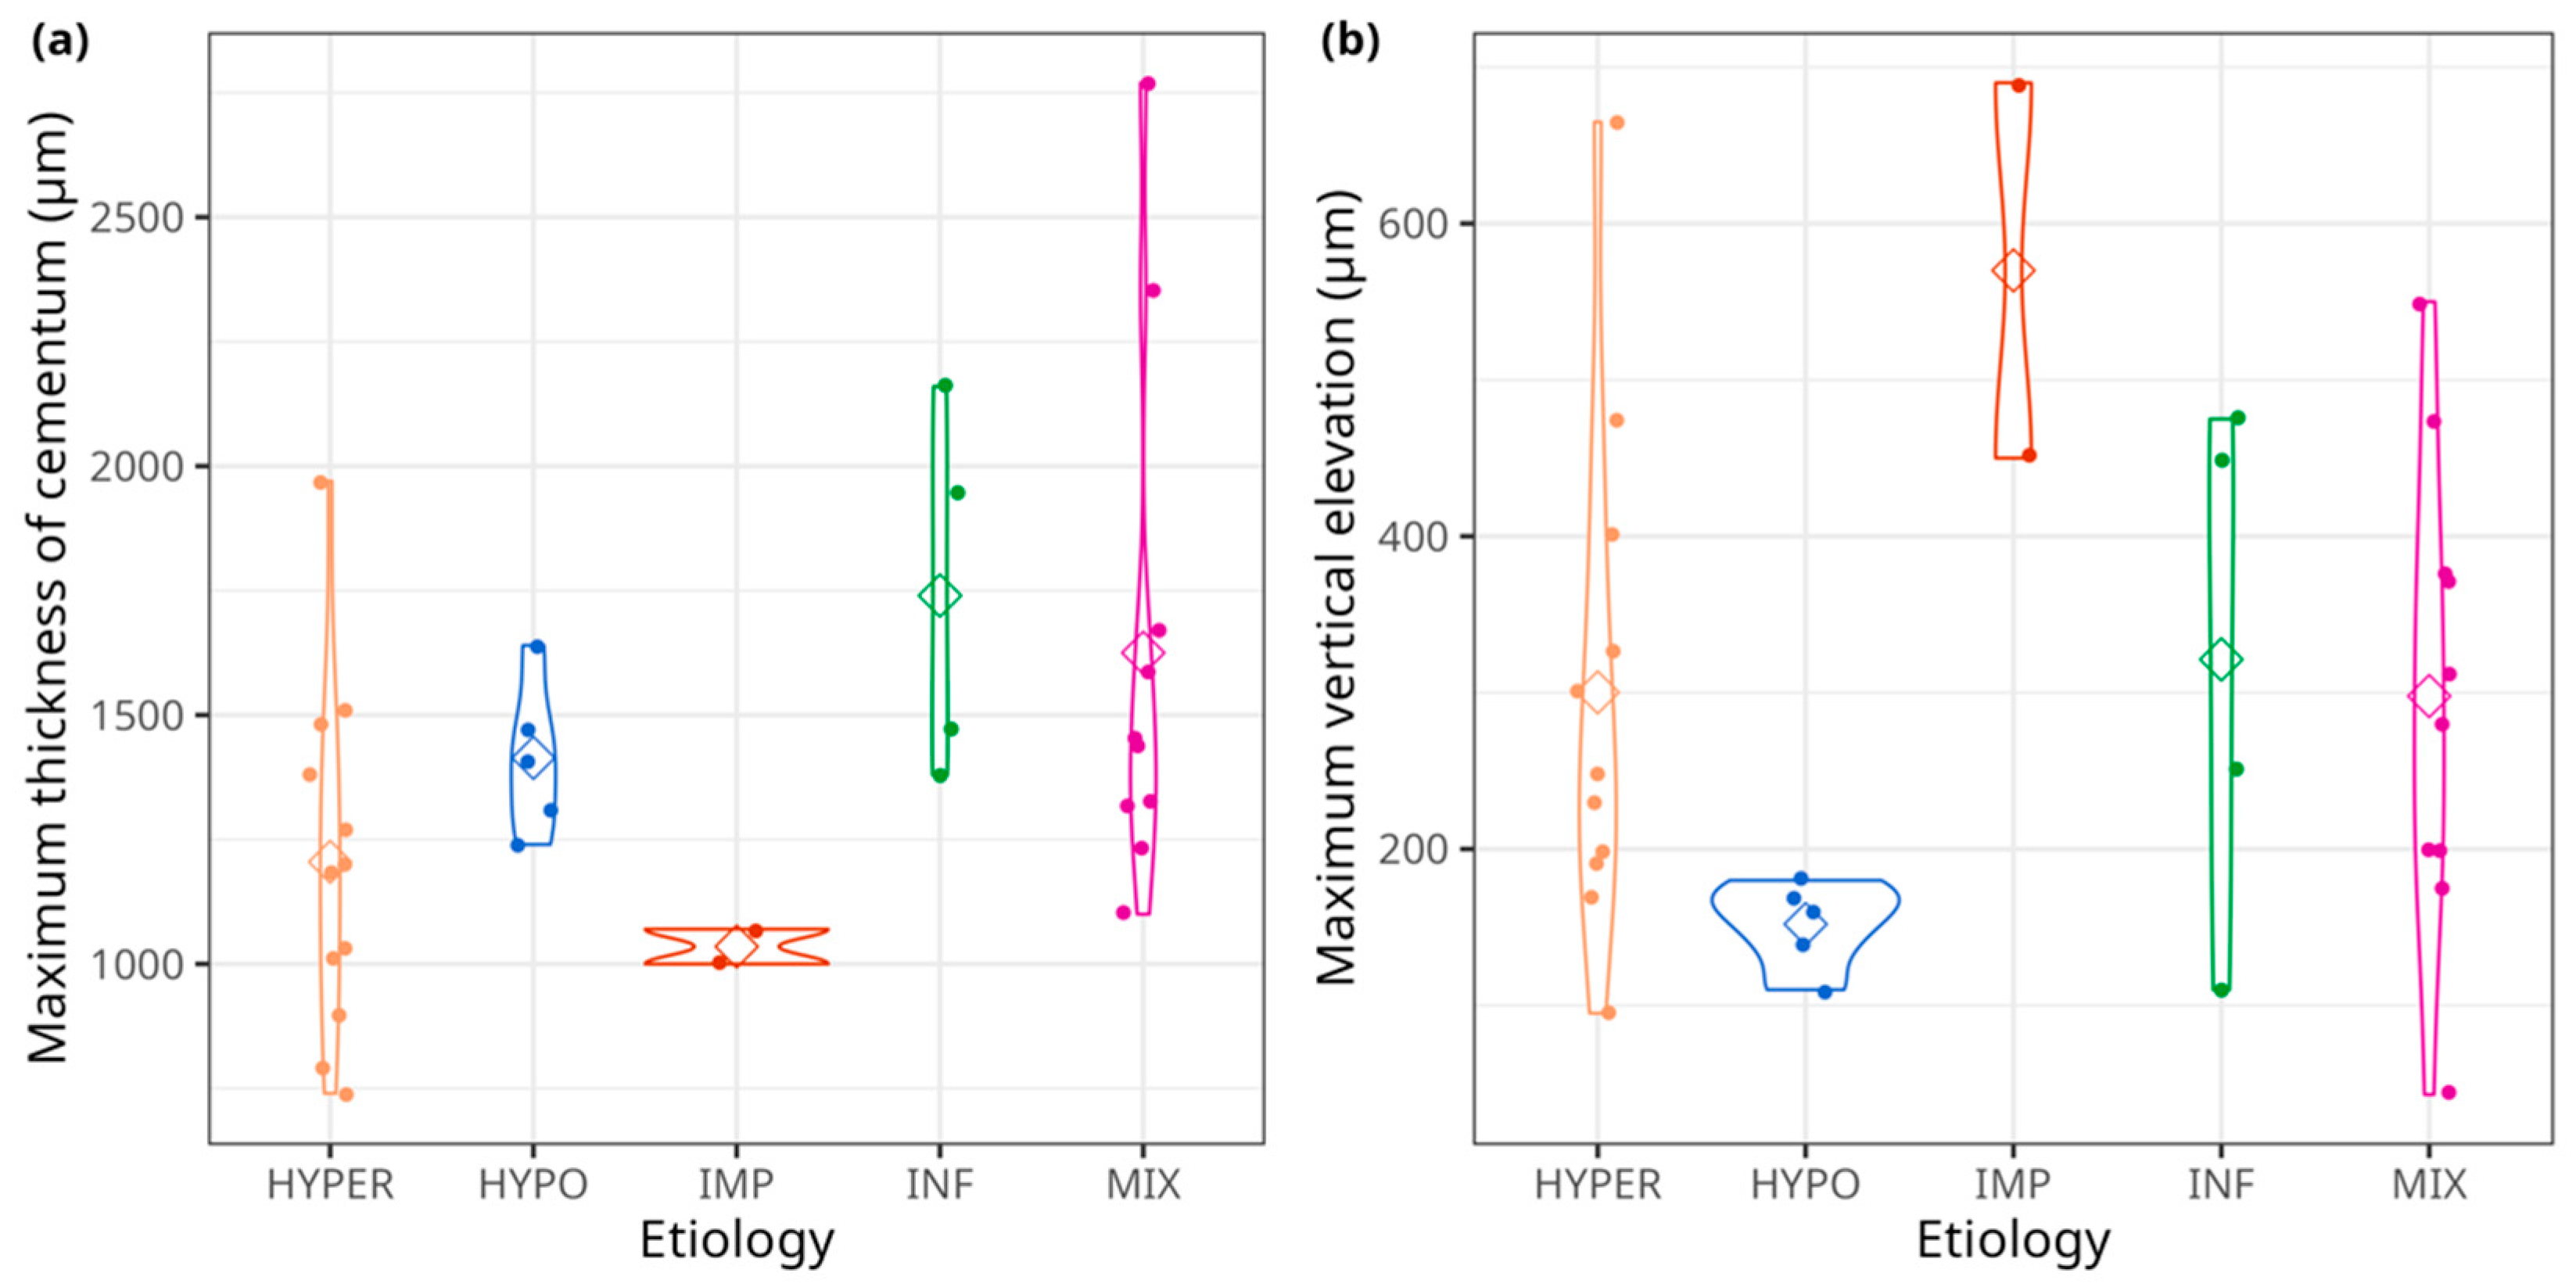
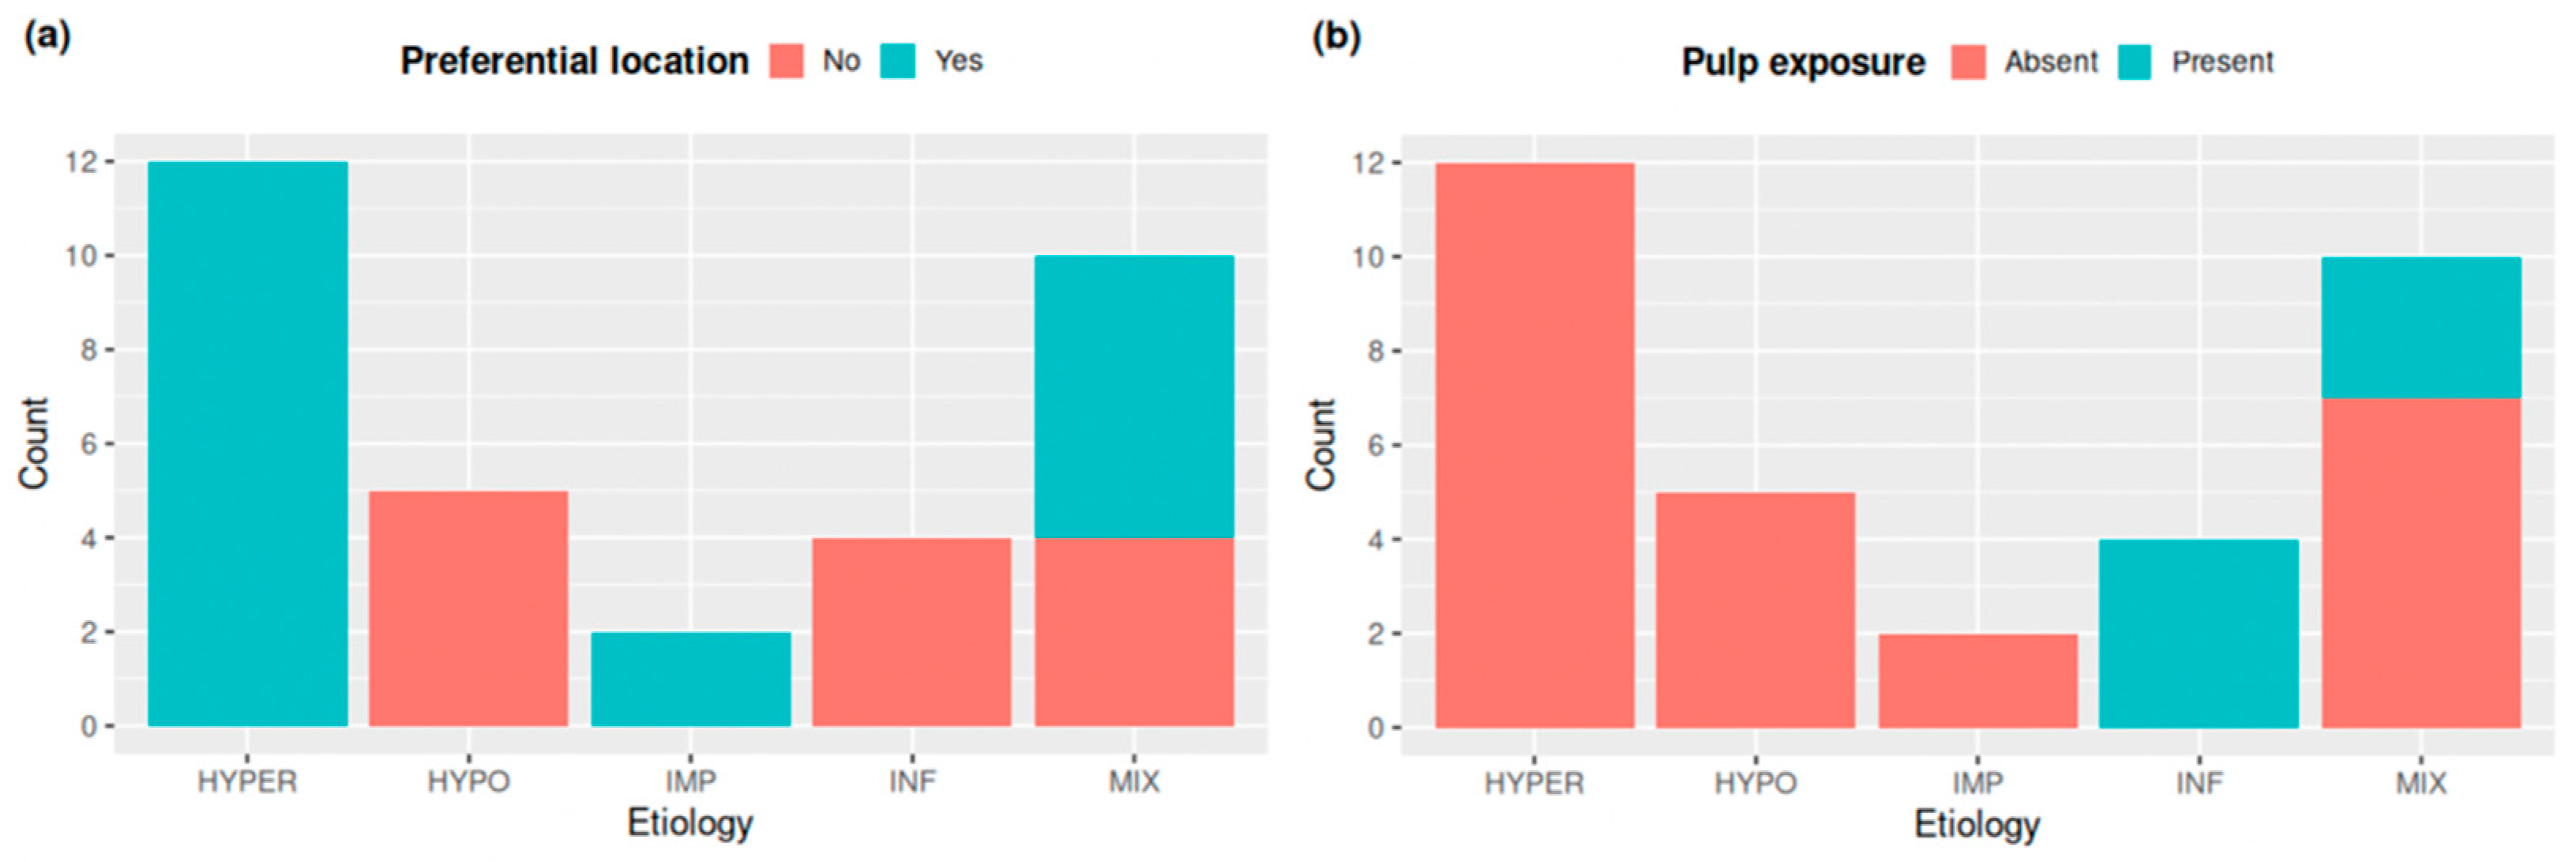
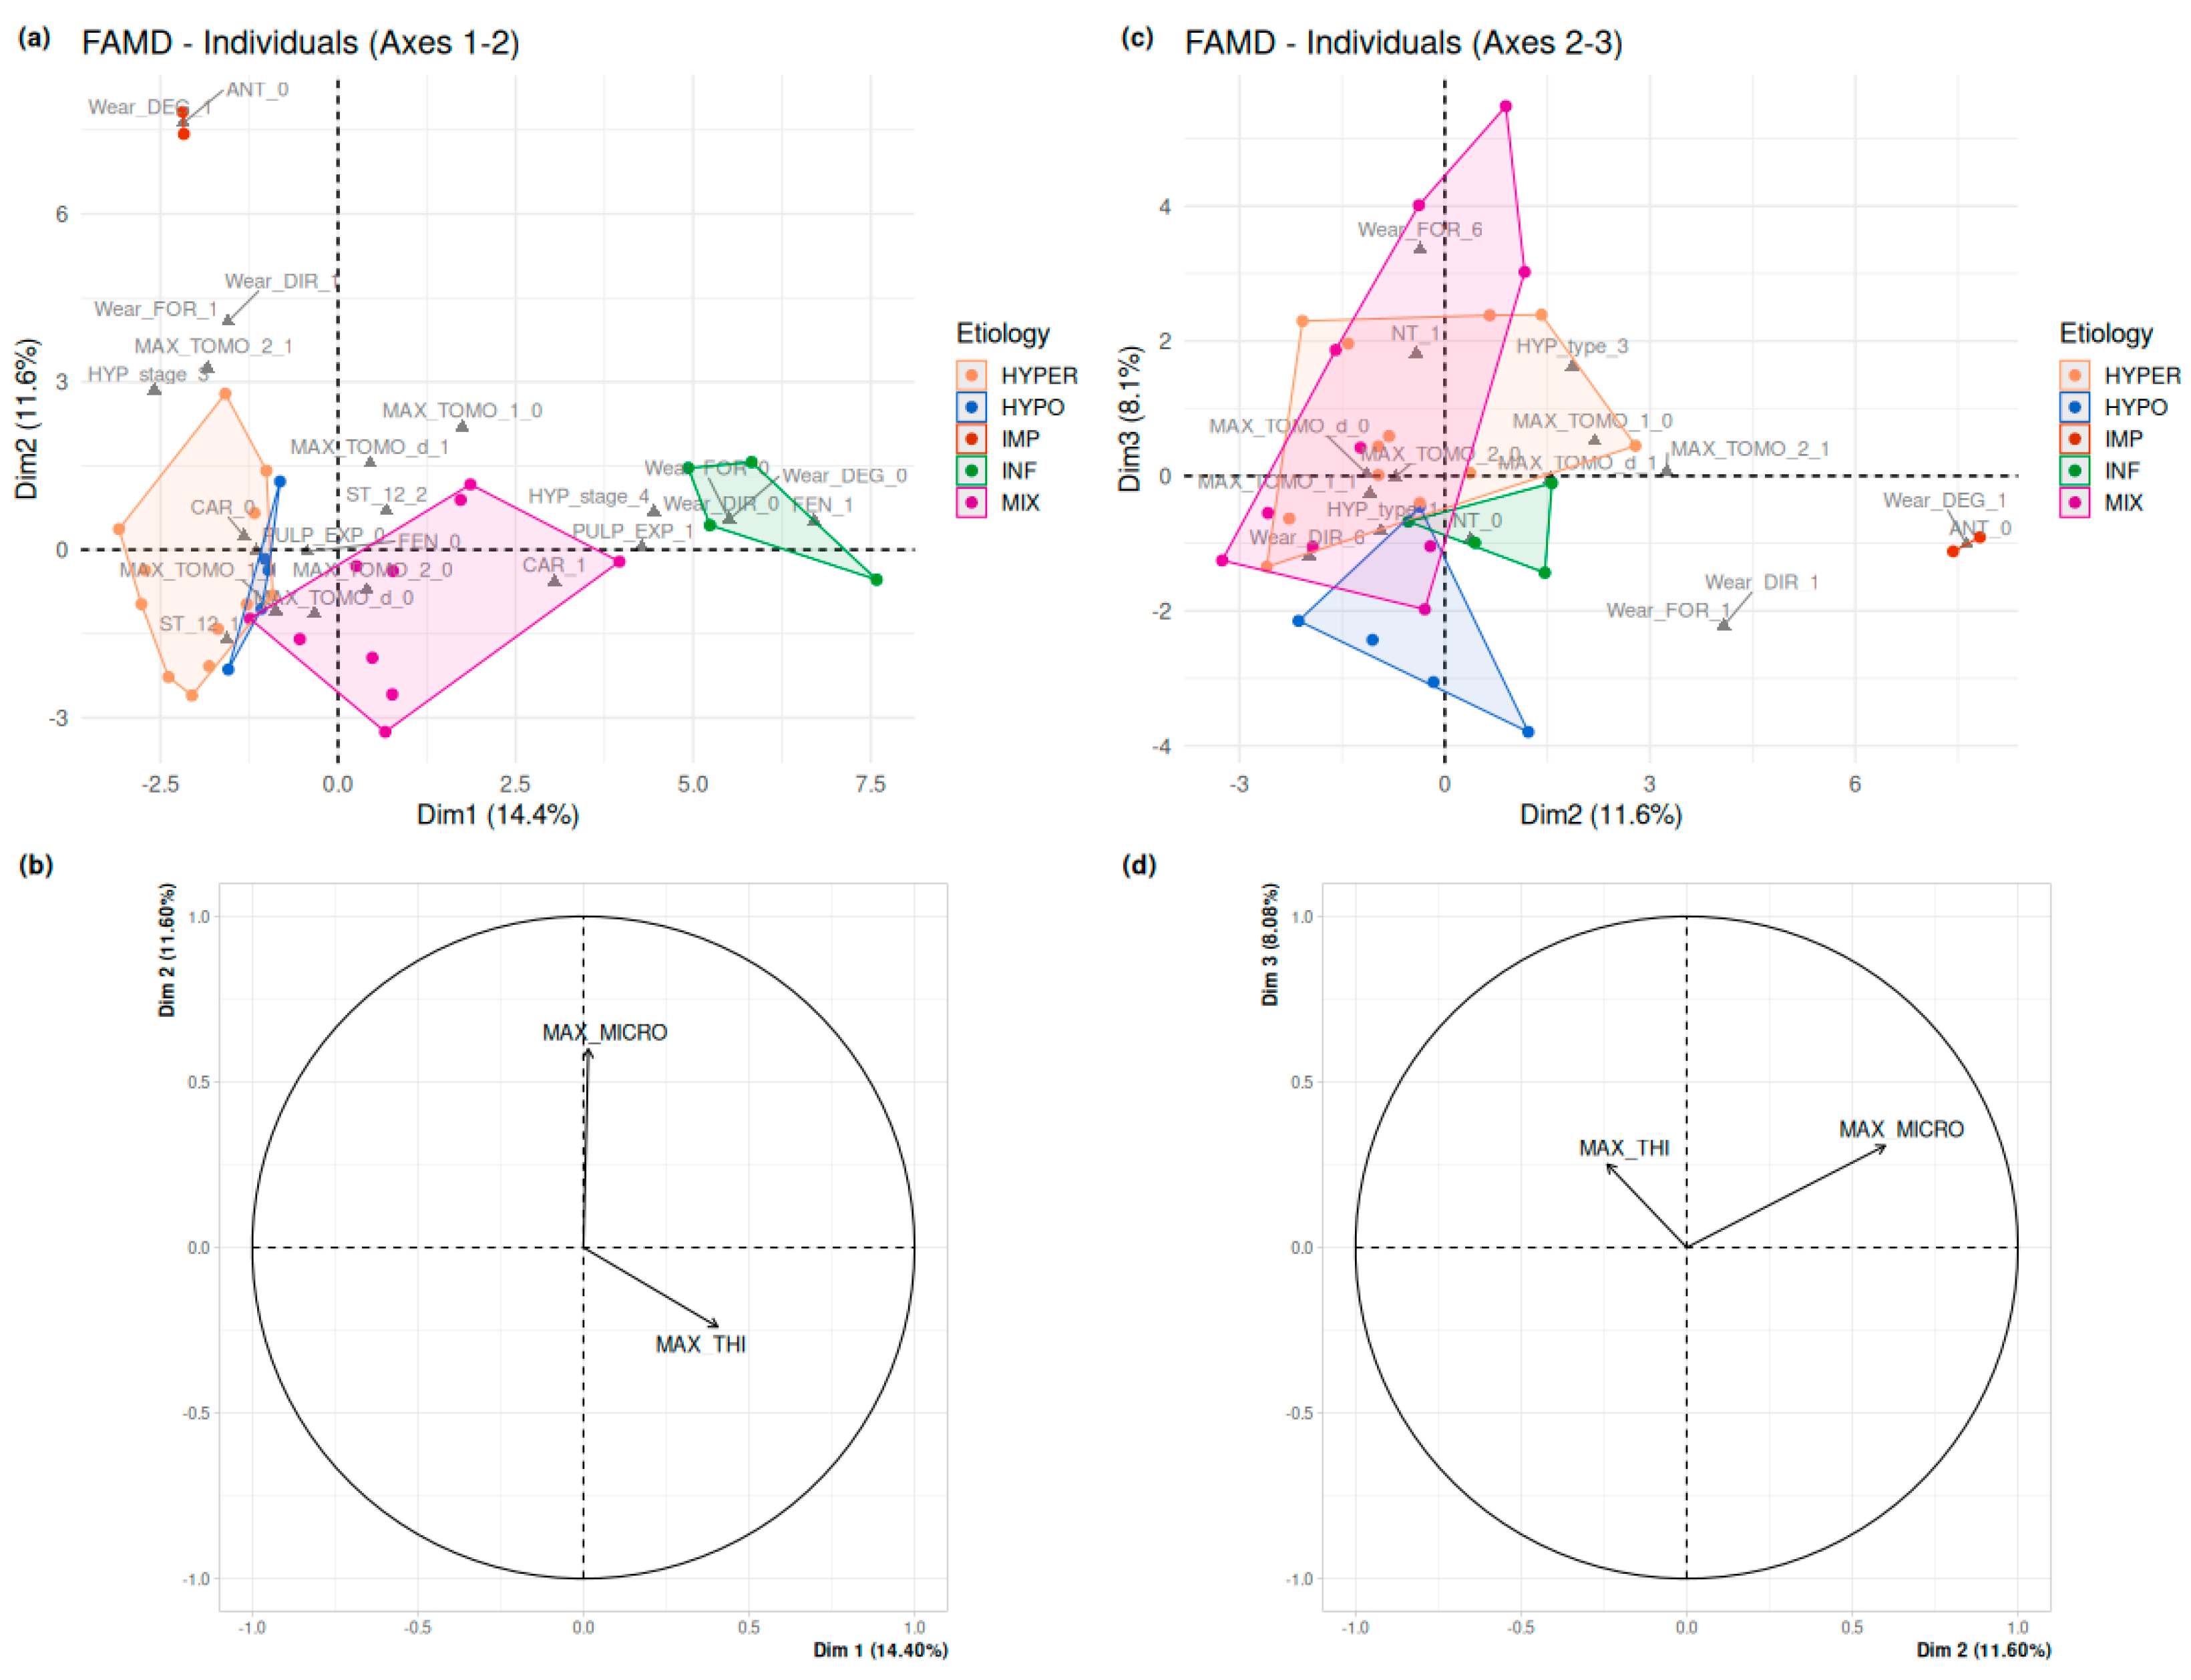
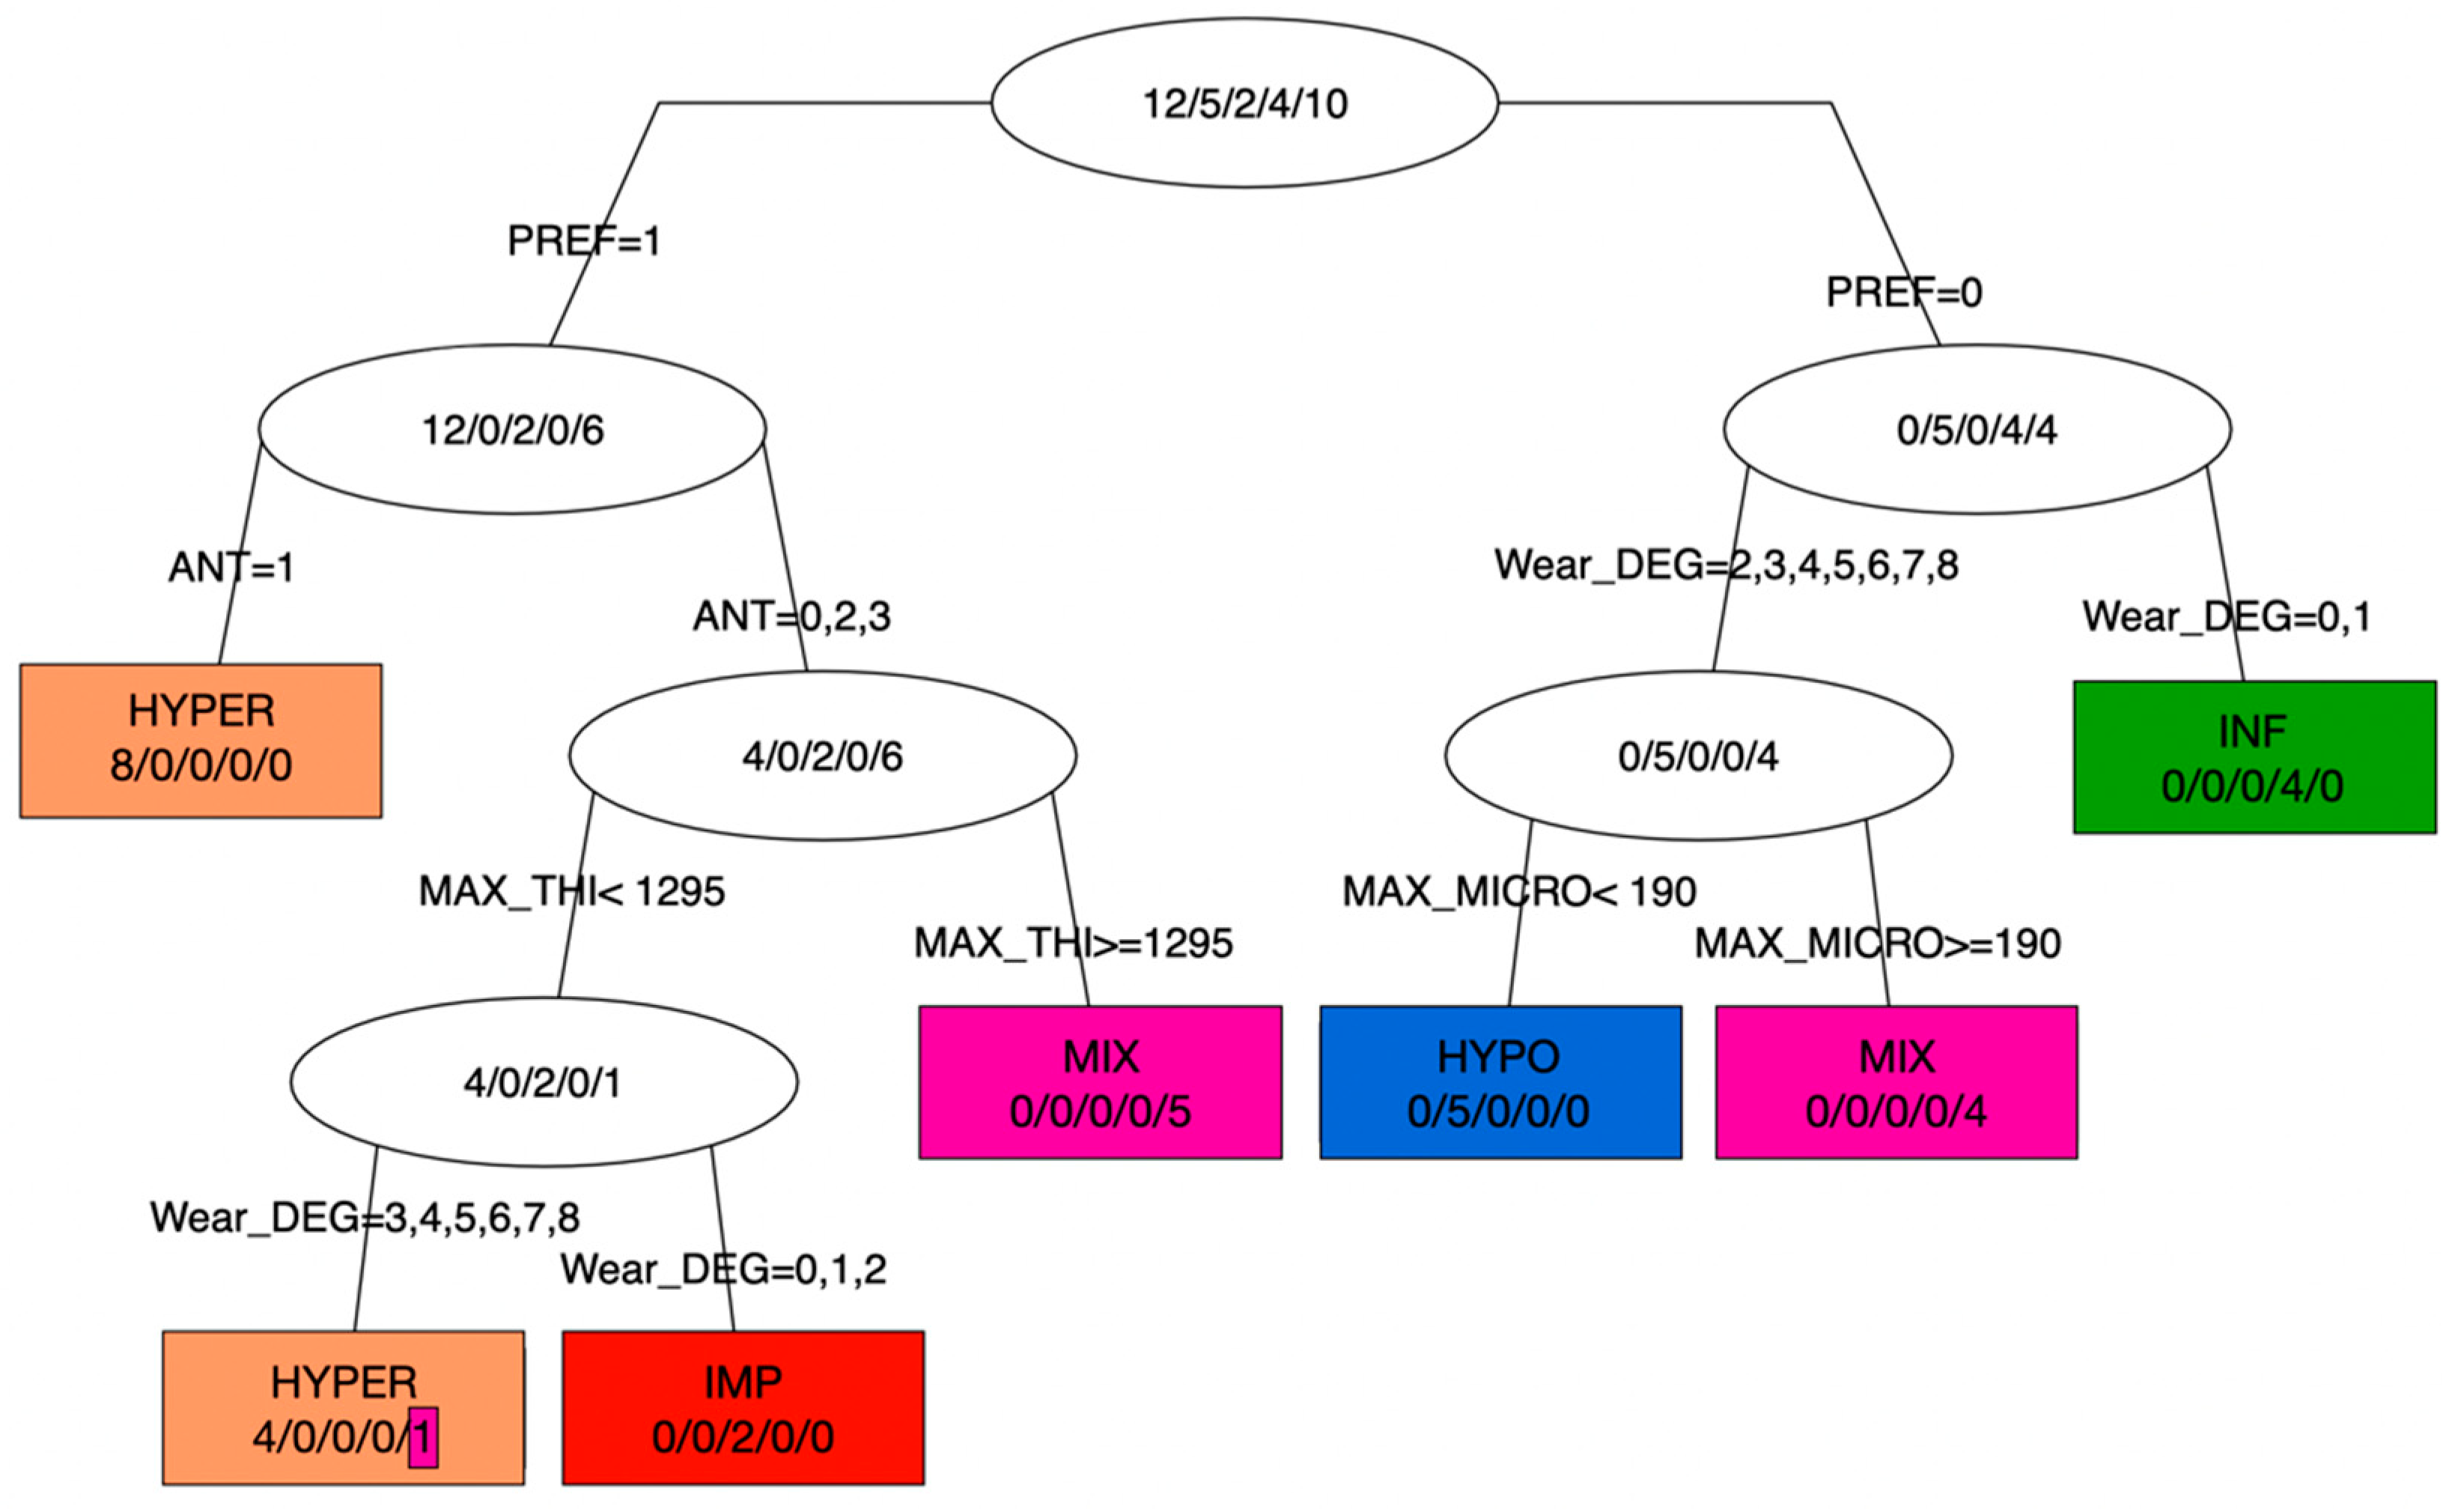
3.6. Statistical Analyses
4. Discussion
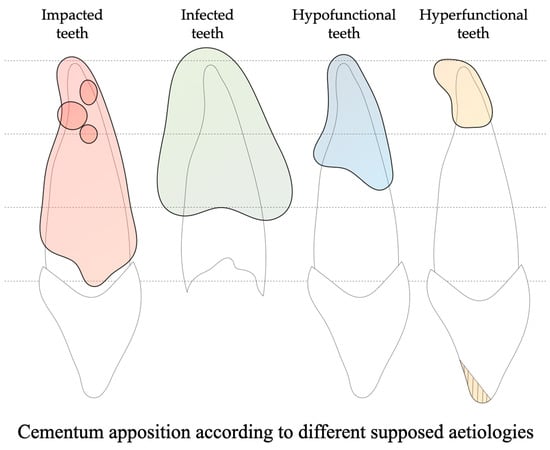
4.1. Impacted Teeth Are Characterized by a Diffuse and Asymmetric Hypercementosis Distribution
4.2. Infected Teeth Have an Extensive and Non-Preferential Hypercementosis Distribution
4.3. Hypofunctional Teeth Reveal a Moderate, Non-Preferential and Diffuse Pattern of Hypercementosis
4.4. Hyperfunctional Teeth Show a Preferential Hypercementosis with an Apical Localization
4.5. Which Diagnostic Criteria for Hypercementosis in the Sains-en-Gohelle Sample?
4.6. Future Directions of Research
5. Conclusions
Supplementary Materials
Author Contributions
Funding
Institutional Review Board Statement
Informed Consent Statement
Data Availability Statement
Acknowledgments
Conflicts of Interest
References
- Hillson, S. Dental Anthropology; Cambridge University Press: Cambridge, UK, 1996. [Google Scholar]
- Merbs, C.F. Patterns of Activity-Induced Pathology in a Canadian Inuit Population; University of Ottawa Press: Ottawa, ON, Canada, 1983. [Google Scholar]
- Molnar, S.; Barrett, M.J.; Brian, L.; Brace, C.L.; Brose, D.S.; Dewey, J.R.; Frisch, J.E.; Ganguly, P.; Gejvall, N.-G.; Greene, D.L.; et al. Tooth Wear and Culture: A Survey of Tooth Functions among Some Prehistoric Populations [and Comments and Reply]. Curr. Anthropol. 1972, 13, 511–526. [Google Scholar] [CrossRef]
- Cybulski, J.S. Tooth Wear and Material Culture: Precontact Patterns in the Tsimshian Area, British Columbia. Syesis 1974, 7, 31–35. [Google Scholar]
- Hylander, W.L. The Adaptive Significance of Eskimo Craniofacial Morphology. In Orofacial Growth and Development; Dahlberg, A.A., Graber, T.M., Eds.; De Gruyter Mouton: Berlin, Germany, 1977; pp. 129–170. ISBN 978-90-279-7889-9. [Google Scholar]
- Lukacs, J.R.; Pastor, R.F. Activity-Induced Patterns of Dental Abrasion in Prehistoric Pakistan: Evidence from Mehrgarh and Harappa. Am. J. Phys. Anthropol. 1988, 76, 377–398. [Google Scholar] [CrossRef] [PubMed]
- Brace, C.L. Did La Ferrassie I Use His Teeth as a Tool? Curr. Anthropol. 1975, 16, 396–397. [Google Scholar]
- Koby, F.-E. Une Incisive Néandertalienne Trouvée En Suisse. Verhandlungen Naturforschenden Ges. Basel 1956, 67, 1–15. [Google Scholar]
- Pedersen, P.O. The East Greenland Eskimo Dentition, Numerical Variations and Anatomy: A Contribution to Comparative Ethnic Odontography; Kommissionen for Videnskabelige Undersogelser i Gronland; C.A. Reitzels Forlag: Copenhagen, Denmark, 1949. [Google Scholar]
- Simpson, J. Observations on the Western Eskimo and the Country They Inhabit, from Notes Taken during Two Years at Point Barrow; Alaska Medical Library: Anchorage, AK, USA, 1855; pp. 917–942. [Google Scholar]
- Berbesque, J.; Marlowe, F.; Pawn, I.; Thompson, P.; Johnson, G.; Mabulla, A.Z. Sex Differences in Hadza Dental Wear Patterns: A Preliminary Report. Hum. Nat. 2012, 23, 270–282. [Google Scholar] [CrossRef] [PubMed]
- Ungar, P.S.; Grine, F.E.; Teaford, M.F.; Pérez-Pérez, A. A Review of Interproximal Wear Grooves on Fossil Hominin Teeth with New Evidence from Olduvai Gorge. Arch. Oral Biol. 2001, 46, 285–292. [Google Scholar] [CrossRef]
- Estalrrich, A.; Alarcón, J.A.; Rosas, A. Evidence of Toothpick Groove Formation in Neandertal Anterior and Posterior Teeth. Am. J. Phys. Anthropol. 2016, 162, 747–756. [Google Scholar] [CrossRef]
- Frayer, D.W.; Russell, M.D. Artificial Grooves on the Krapina Neanderthal Teeth. Am. J. Phys. Anthropol. 1987, 74, 393–405. [Google Scholar] [CrossRef]
- Garralda, M.D.; Maureille, B.; Le Cabec, A.; Oxilia, G.; Benazzi, S.; Skinner, M.M.; Hublin, J.-J.; Vandermeersch, B. The Neanderthal Teeth from Marillac (Charente, Southwestern France): Morphology, Comparisons and Paleobiology. J. Hum. Evol. 2020, 138, 102683. [Google Scholar] [CrossRef]
- Sun, C.; Xing, S.; Martín-Francés, L.; Bae, C.; Liu, L.; Wei, G.; Liu, W.; Liu, W. Interproximal Grooves on the Middle Pleistocene Hominin Teeth from Yiyuan, Shandong Province: New Evidence for Tooth-Picking Beh. Quat. Int. 2014, 354, 162–168. [Google Scholar] [CrossRef]
- Brace, C.L. Cultural Factors in the Evolution of the Human Dentition, 2nd ed.; Montagu, M.F.A., Ed.; Culture and the Evolution of Man; Oxford University Press: Oxford, UK, 1962. [Google Scholar]
- Wallace, J.A.; Barrett, M.J.; Brown, T.; Brace, C.L.; Howells, W.W.; Koritzer, R.T.; Sakura, H.; Stloukal, M.; Wolpoff, M.H.; Žlábek, K. Did La Ferrassie I Use His Teeth as a Tool? [And Comments and Reply]. Curr. Anthropol. 1975, 16, 393–401. [Google Scholar] [CrossRef]
- Krueger, K.L.; Willman, J.C.; Matthews, G.J.; Hublin, J.-J.; Pérez-Pérez, A. Anterior Tooth-Use Behaviors among Early Modern Humans and Neandertals. PLoS ONE 2019, 14, e0224573. [Google Scholar] [CrossRef] [PubMed]
- Gould, R.A. EXARC Experimental Archaeology Collection Manager Chipping Stones in the Outback. Nat. Hist. 1968, 77, 42–49. [Google Scholar]
- Molnar, P. Extramasticatory Dental Wear Reflecting Habitual Behavior and Health in Past Populations. Clin. Oral Investig. 2011, 15, 681–689. [Google Scholar] [CrossRef]
- Goldberg, M. Histologie des céments : Structures et ultrastructures. EMC-Méd. Buccale 2015, 10, 1–9. [Google Scholar]
- Ho, S.P.; Marshall, S.J.; Ryder, M.I.; Marshall, G.W. The Tooth Attachment Mechanism Defined by Structure, Chemical Composition and Mechanical Properties of Collagen Fibers in the Periodontium. Biomaterials 2007, 28, 5238–5245. [Google Scholar] [CrossRef]
- Bosshardt, D.D.; Selvig, K.A. Dental Cementum: The Dynamic Tissue Covering of the Root. Periodontol. 2000 1997, 13, 41–75. [Google Scholar] [CrossRef]
- Gonçalves, P.; Sallum, E.; Sallum, A.; Casati, M.; Toledo, S.; Nociti, F. Dental Cementum Reviewed: Development, Structure, Composition, Regeneration and Potential Functions. Braz. J. Oral Sci. 2005, 4, 651–658. [Google Scholar]
- Nanci, A. Chapter 1—Structure of the Oral Tissues. In Ten Cate’s Oral Histology, 9th ed.; Elsevier Health Sciences: London, UK, 2017; pp. 1–13. [Google Scholar]
- Consolaro, A.; Consolaro, R.B.; Francischone, L.A. Cementum, Apical Morphology and Hypercementosis: A Probable Adaptive Response of the Periodontal Support Tissues and Potential Orthodontic Implications. Dent. Press J. Orthod. 2012, 17, 21–30. [Google Scholar] [CrossRef]
- d’Incau, E.; Couture, C.; Crépeau, N.; Chenal, F.; Beauval, C.; Vanderstraete, V.; Maureille, B. Determination and Validation of Criteria to Define Hypercementosis in Two Medieval Samples from France (Sains-En-Gohelle, AD 7th–17th Century; Jau-Dignac-et-Loirac, AD 7th–8th Century). Arch. Oral Biol. 2015, 60, 293–303. [Google Scholar] [CrossRef] [PubMed]
- Massé, L.; Garot, E.; Maureille, B.; Le Cabec, A. Insights into the Aetiologies of Hypercementosis: A Systematic Review and a Scoring System. Arch. Oral Biol. 2023, 146, 105599. [Google Scholar] [CrossRef] [PubMed]
- Le Cabec, A.; Gunz, P.; Kupczik, K.; Braga, J.; Hublin, J.-J. Anterior Tooth Root Morphology and Size in Neanderthals: Taxonomic and Functional Implications. J. Hum. Evol. 2013, 64, 169–193. [Google Scholar] [CrossRef]
- Martinón-Torres, M.; Martín-Francés, L.; Gracia, A.; Olejniczak, A.; Prado-Simón, L.; Gómez-Robles, A.; Lapresa, M.; Carbonell, E.; Arsuaga, J.L.; Bermúdez de Castro, J.M. Early Pleistocene Human Mandible from Sima Del Elefante (TE) Cave Site in Sierra de Atapuerca (Spain): A Palaeopathological Study. J. Hum. Evol. 2011, 61, 1–11. [Google Scholar] [CrossRef] [PubMed]
- Martin, H. L’Homme Fossile de la Quina; Archives de morphologie générale et expérimentale; Gaston Doin, Ed.: Paris, France, 1923. [Google Scholar]
- Brothwell, D.R. The Macroscopic Dental Pathology of Some Earlier Human Populations. In Dental Anthropology: Society for the Study of Human Biology; Elsevier: Amsterdam, The Netherlands, 1963; pp. 271–288. [Google Scholar] [CrossRef]
- Piveteau, J. La Grotte de Regourdou (Dordogne). Paléontologie Humaine. Ann. Paléontol. 1966, LII, 163–194. [Google Scholar]
- Trinkaus, E. The Shanidar Neandertals; Academic Press: New York, NY, USA, 1983; ISBN 978-0-12-700550-8. [Google Scholar]
- Tillier, A.-M.; Arensburg, B.; Duday, H. La Mandibule et les dents du Néanderthalien de Kebara (Homo 2), Mont Carmel, Israël. Paléorient 1989, 15, 39–58. [Google Scholar] [CrossRef]
- Tillier, A.; Arensburg, B.; Rak, Y.; Vandermeersch, B. Middle Palaeolithic Dental Caries: New Evidence from Kebara (Mount Carmel, Israel). J. Hum. Evol. 1995, 29, 189. [Google Scholar] [CrossRef]
- Trinkaus, E.; Pinilla, B. Dental Caries in the Qafzeh 3 Middle Paleolithic Modern Human. Paléorient 2009, 35, 69–76. [Google Scholar] [CrossRef]
- García-González, R.; Sánchez-Puente, Z.; Rodríguez, L.; Quam, R.M.; Carretero, J.M. Hypercementosis of the Magdalenian Human Mandibular Teeth from El Mirón Cave, Cantabria (Spain). Quat. Int. 2019, 515, 150–158. [Google Scholar] [CrossRef]
- Bailey, S.; Hublin, J.-J. Dental Remains from the Grotte Du Renne at Arcy-Sur-Cure (Yonne). J. Hum. Evol. 2006, 50, 485–508. [Google Scholar] [CrossRef]
- Leroi-Gourhan, A. Les fouilles d’Arcy-sur-Cure (Yonne). Gall. Préhistoire 1961, 4, 3–16. [Google Scholar] [CrossRef]
- Elsayed, S.A.; Ayed, Y.; Alolayan, A.B.; Farghal, L.M.; Kassim, S. Radiographic Evaluation and Determination of Hypercementosis Patterns in Al-Madinah Al-Munawwarah, Saudi Arabia: A Retrospective Cross-Sectional Study. Niger. J. Clin. Pract. 2019, 22, 957–960. [Google Scholar] [CrossRef] [PubMed]
- Kim, S.H.; Hwang, E.H.; Lee, S.R. A Radiographic Study of Hypercementosis. J. Korean Acad. Maxillofac. Radiol. 1991, 21, 249–259. [Google Scholar]
- d’Incau, E.; Maureille, B.; Couture-Veschambre, C. Pattern of Human Cementum Deposition with a Special Emphasis on Hypercementosis. In Dental Cementum in Anthropology; Gourichon, L., Naji, S., Rendu, W., Eds.; Cambridge University Press: Cambridge, UK, 2022; pp. 94–109. ISBN 978-1-108-47708-6. [Google Scholar]
- Beauval, C.; Alonso, L.; Brunet, M.; Cabart, H.; Chenal, F.; Crépeau, N.; Daulny, L.; Doyen, J.-M.; Maury, M.; Fronteau, G.; et al. Rapport d’Opérations de Fouilles Archéologiques (Inédit). Sains-En-Gohelle «227 Rue Lamartine». Pas-de-Calais (62). Numéro Patriarche 4904. Etude Paléobiologique, Étude Des Modes d’Inhumation; Rapport d’opérations de fouilles archéologiques (inédit); Archéologie Médiévale: Caen, France, 2012. [Google Scholar]
- d’Incau, E. Hypercémentose : Définition, Classification et Fréquence. Apport Des Résultats à La Lignée Néandertalienne. Ph.D. Thesis, Université de Bordeaux, Bordeaux, France, 2012. [Google Scholar]
- Bosshardt, D.D.; Schroeder, H.E. Cementogenesis Reviewed: A Comparison between Human Premolars and Rodent Molars. Anat. Rec. 1996, 245, 267–292. [Google Scholar] [CrossRef]
- Stamfelj, I.; Vidmar, G.; Cvetko, E.; Gaspersic, D. Cementum Thickness in Multirooted Human Molars: A Histometric Study by Light Microscopy. Ann. Anat. Anat. Anz. Off. Organ Anat. Ges. 2008, 190, 129–139. [Google Scholar] [CrossRef] [PubMed]
- d’Incau, E.; Couture, C.; Maureille, B. Human Tooth Wear in the Past and the Present: Tribological Mechanisms, Scoring Systems, Dental and Skeletal Compensations. Arch. Oral Biol. 2012, 57, 214–229. [Google Scholar] [CrossRef] [PubMed]
- Molnar, S. Human Tooth Wear, Tooth Function and Cultural Variability. Am. J. Phys. Anthropol. 1971, 34, 175–189. [Google Scholar] [CrossRef]
- Lasfargues, J.; Louis, J.; Kaleka, R. Classifications des Lésions Carieuses. De Black Au Concept Actuel Par Sites et Stades; EMC Elsevier SAS Paris Odontol: Paris, France, 2006; pp. 1–16. [Google Scholar]
- Consolaro, A.; de Oliveira, L.U.; Vasconcelos, M.H.F. Determinação da prevalência da hipercementose e suas implicações etiopatogênicas. Odontólogo Mod. 1987, 14, 6–14. [Google Scholar]
- Piette, E.; Goldberg, M. Chapitre 5 Structure des dents (céments). In La Dent Normale et Pathologique; De Boeck Supérieur: Paris, France, 2001. [Google Scholar]
- Pinheiro, B.C. Hipercementose: Estudo Macroscópico, Estereomicroscópico, Radiográfico e à Microscopia Eletrônica de Varredura. Ph.D. Thesis, Universidade de São Paulo, São Paulo, Brazil, 2005. [Google Scholar]
- Azaz, B.; Ulmansky, M.; Moshev, R.; Sela, J. Correlation between Age and Thickness of Cementum in Impacted Teeth. Oral Surg. Oral Med. Oral Pathol. 1974, 38, 691–694. [Google Scholar] [CrossRef]
- Nasmyth, A. On the Structure, Physiology, and Pathology of the Persistent Capsular Investments and Pulp of the Tooth. Medico-Chir. Trans. 1839, 22, 310–328. [Google Scholar] [CrossRef]
- Beucher, S.; Lantuéjoul, C. Use of Watersheds in Contour Detection. In Proceedings of the International Workshop on Image Processing, Rennes, France, 17–21 September 1979; Volume 132. [Google Scholar]
- Crameri, F.; Shephard, G.E.; Heron, P.J. The Misuse of Colour in Science Communication. Nat. Commun. 2020, 11, 5444. [Google Scholar] [CrossRef]
- Moreland, K. Diverging Color Maps for Scientific Visualization. In Proceedings of the Advances in Visual Computing, Las Vegas, NV, USA, 30 November–2 December 2009; Bebis, G., Boyle, R., Parvin, B., Koracin, D., Kuno, Y., Wang, J., Pajarola, R., Lindstrom, P., Hinkenjann, A., Encarnação, M.L., et al., Eds.; Springer: Berlin/Heidelberg, Germany, 2009; pp. 92–103. [Google Scholar]
- Artigas, R. Imaging Confocal Microscopy. In Optical Measurement of Surface Topography; Leach, R., Ed.; Springer: Berlin/Heidelberg, Germany, 2011; pp. 237–286. ISBN 978-3-642-12012-1. [Google Scholar]
- Bermudez, C.; Matilla, A.; Aguerri, A. Confocal Fusion: Towards the Universal Optical 3D Metrology Technology. In Proceedings of the Presented at the LAMDAMAP, 2017, Wotton-under-Edge, UK, 15–16 March 2017. [Google Scholar]
- Pagès, J. Analyse factorielle de données mixtes. Rev. Stat. Appliquée 2023, LII, 93–111. [Google Scholar]
- Josse, J.; Husson, F. missMDA: A Package for Handling Missing Values in Multivariate Data Analysis. J. Stat. Softw. 2016, 70, 1–31. [Google Scholar] [CrossRef]
- Breiman, L.; Friedman, J.; Stone, C.J.; Olshen, R.A. Classification and Regression Trees; Taylor & Francis: Abingdon, UK, 1984; ISBN 978-0-412-04841-8. [Google Scholar]
- R Core Team. R: A Language and Environment for Statistical Computing; R Foundation for Statistical Computing: Vienna, Austria, 2023. [Google Scholar]
- Henner, N.; Pignoly, M.; Antezack, A.; Monnet-Corti, V. Periodontal Approach of Impacted and Retained Maxillary Anterior Teeth. J. Dentofac. Anom. Orthod. 2018, 21, 204. [Google Scholar] [CrossRef]
- Eschbach, F. Rapport d’Opération d’Archéologie Préventive—Clermont-Ferrand—Rue Amadeo, « Centre Hospitalier Sainte Marie » Volume IIa/III; Rapport d’Opération d’Archéologie: D.R.A.C. Auvergne, France, 2011. [Google Scholar]
- Martín-Francés, L.; Martinón-Torres, M.; Gracia-Téllez, A.; Martínez, I.; Arsuaga, J.L.; Bermúdez De Castro, J.M. Hypercementosis Study in the Early and Middle Pleistocene Human Fossils from Atapuerca (Spain); First meeting of the ESHE: Leipzig, Germany, 23 September 2011; p. 65. Available online: https://www.eshe.eu/static/eshe/peshe/ESHE_2011_abstracts.pdf (accessed on 12 December 2023).
- Antunes, M.T.; Cunha, A.S. Neanderthalian Remains from Figueira Brava Cave, Portugal. Geobios 1992, 25, 681–692. [Google Scholar] [CrossRef]
- Garralda, M.-D.; Vandermeersch, B. Les Néandertaliens de la grotte de Combe-Grenal (Domme, Dordogne, France)/The Neanderthals from Combe-Grenal cave (Domme, Dordogne, France). Paléo Rev. Archéologie Préhistorique 2000, 12, 213–259. [Google Scholar] [CrossRef]
- Maureille, B.; Djindjian, F.; Garralda, M.D.; Mann, A.E.; Vandermeersch, B. Les dents moustériennes de la grotte Boccard, lieu-dit Bas-de-Morant (commune de Créancey, Côte-d’Or, Bourgogne). Bull. Mém. Société D’Anthropologie Paris BMSAP 2008, 20, 59–78. [Google Scholar] [CrossRef]
- Scolan, H.; Santos, F.; Tillier, A.-M.; Maureille, B.; Quintard, A. Des nouveaux vestiges néanderthaliens à Las Pélénos (Monsempron-Libos, Lot-et-Garonne, France). Bull. Mém. Société Anthropol. Paris 2012, 24, 69–95. [Google Scholar] [CrossRef]
- Margvelashvili, A.; Zollikofer, C.P.E.; Lordkipanidze, D.; Tafforeau, P.; Ponce de León, M.S. Comparative Analysis of Dentognathic Pathologies in the Dmanisi Mandibles. Am. J. Phys. Anthropol. 2016, 160, 229–253. [Google Scholar] [CrossRef]
- Grine, F.E.; Mongle, C.S.; Kollmer, W.; Romanos, G.; du Plessis, A.; Maureille, B.; Braga, J. Hypercementosis in Late Pleistocene Homo sapiens Fossils from Klasies River Main Site, South Africa. Arch. Oral Biol. 2023, 149, 105664. [Google Scholar] [CrossRef]
- Waters-Rist, A.; Bazaliiskii, V.I.; Weber, A.; Goriunova, O.I.; Katzenberg, M.A. Activity-Induced Dental Modification in Holocene Siberian Hunter-Fisher-Gatherers. Am. J. Phys. Anthropol. 2010, 143, 266–278. [Google Scholar] [CrossRef] [PubMed]
- Azaz, B.; Michaeli, Y.; Nitzan, D. Aging of Tissues of the Roots of Nonfunctional Human Teeth (Impacted Canines). Oral. Surg. Oral. Med. Oral. Pathol. 1977, 43, 572–578. [Google Scholar] [CrossRef] [PubMed]
- Zemsky, J.L. Hypercementosis in Relation to Unerupted and Malposed Teeth a Preliminary Report. J. Dent. Res. 1931, 11, 159–174. [Google Scholar] [CrossRef]
- López-Valverde, A.; López-Cristiá, M.; Prados-Frutos, J.C.; de Diego, R.G.; de Vicente, J.; Cutando, A. Oral Pathology in the Iberian Neanderthals. Afr. J. Biotechnol. 2012, 11, 6359–6363. [Google Scholar] [CrossRef]
- Dean, M.C.; Rosas, A.; Estalrrich, A.; García-Tabernero, A.; Huguet, R.; Lalueza-Fox, C.; Bastir, M.; de la Rasilla, M. Longstanding Dental Pathology in Neandertals from El Sidrón (Asturias, Spain) with a Probable Familial Basis. J. Hum. Evol. 2013, 64, 678–686. [Google Scholar] [CrossRef] [PubMed]
- Klaatsch, H.; Hauser, O. Homo mousteriensis Hauseri: Ein Altdiluvialer Skelettfund im Departement Dordogne und seine Zugehörigkeit zum Neandertaltypus; Vieweg, Braunschweig: Braunschweig, Germany, 1909. [Google Scholar]
- Castex, D. Mortalité, Morbidité et Gestion de l’espace Funéraire Au Cours Du Haut Moyen-Age : Contribution Spécifique de l’anthropologie Biologique. Ph.D. Thesis, University of Bordeaux 1, Talence, France, 1994. [Google Scholar]
- Nicklisch, N.; Oelze, V.M.; Schierz, O.; Meller, H.; Alt, K.W. A Healthier Smile in the Past? Dental Caries and Diet in Early Neolithic Farming Communities from Central Germany. Nutrients 2022, 14, 1831. [Google Scholar] [CrossRef]
- Zohrabian, V.M.; Abrahams, J.J. Inflammatory Diseases of the Teeth and Jaws. Semin. Ultrasound. CT MR 2015, 36, 434–443. [Google Scholar] [CrossRef]
- Lanfranco, L.P.; Eggers, S.; Lanfranco, L.P.; Eggers, S. Caries through Time: An Anthropological Overview. In Contemporary Approach to Dental Caries; IntechOpen: London, UK, 2012; ISBN 978-953-51-0305-9. [Google Scholar]
- Nicklisch, N.; Ganslmeier, R.; Siebert, A.; Friederich, S.; Meller, H.; Alt, K.W. Holes in Teeth—Dental Caries in Neolithic and Early Bronze Age Populations in Central Germany. Ann. Anat. Anat. Anz. Off. Organ Anat. Ges. 2016, 203, 90–99. [Google Scholar] [CrossRef]
- Lacy, S.A.; Wu, X.-J.; Jin, C.-Z.; Qin, D.-G.; Cai, Y.-J.; Trinkaus, E. Dentoalveolar Paleopathology of the Early Modern Humans from Zhirendong, South China. Int. J. Paleopathol. 2012, 2, 10–18. [Google Scholar] [CrossRef]
- Tillier, A.-M.; Arensburg, B.; Vandermeersch, B.; Chech, M. New Human Remains from Kebara Cave (Mount Carmel). The Place of the Kebara Hominids in the Levantine Mousterian Fossil Record. Paléorient 2003, 29, 35–62. [Google Scholar] [CrossRef]
- Polet, C.; Orban, R.; Noël, R. Les Dents et les Ossements Humains : Que Mangeait-on au Moyen Âge ? Brepols Publishers: Turnhout, Belgium, 2001; ISBN 978-2-503-51174-0. [Google Scholar]
- Rao, V.M.; Karasick, D. Hypercementosis-An Important Clue to Paget Disease of the Maxilla. Skeletal Radiol. 1982, 9, 126–128. [Google Scholar] [CrossRef] [PubMed]
- Dastmalchi, R.; Poison, A.; Bouwsma, O.; Proskin, H. Cementum Thickness and Mesial Drift. J. Clin. Periodontol. 1990, 17, 709–713. [Google Scholar] [CrossRef] [PubMed]
- Berkovitz, B.K.B.; Moxham, B.J.; Newman, H.N. The Periodontal Ligament in Health and Disease; Mosby-Wolfe: London, UK, 1995; ISBN 978-0-7234-1931-0. [Google Scholar]
- Moss, J.P. A Review of the Theories of Approximal Migration of Teeth; Butterworths: London, UK, 1976; pp. 205–212. [Google Scholar]
- Comuzzie, A.G.; Steele, D.G. Enlarged Occlusal Surfaces on First Molars Due to Severe Attrition and Hypercementosis: Examples from Prehistoric Coastal Populations of Texas. Am. J. Phys. Anthropol. 1989, 78, 9–15. [Google Scholar] [CrossRef]
- Gilbert, J.-M., III. Étude odontologique. Gall. Préhistoire 1992, 34, 282–284. [Google Scholar] [CrossRef]
- Lebel, S.; Trinkaus, E. New Discoveries of Middle Paleolithic Human Remains from the “Bau de l’Aubésier (Vaucluse, France). Bull. Mém. Société D’Anthropologie Paris BMSAP 2001, 13, 16–21. [Google Scholar] [CrossRef]
- Kronfeld, R. Histologic Study of the Influence of Function on the Human Periodontal Membrane. J. Am. Dent. Assoc. 1922 1931, 18, 1242–1274. [Google Scholar] [CrossRef]
- Kupczik, K. Tooth Root Morphology in Primates and Carnivores. Ph.D. Thesis, University College London, London, UK, 2003. [Google Scholar]
- Dean, C.; Le Cabec, A.; Spiers, K.; Zhang, Y.; Garrevoet, J. Incremental Distribution of Strontium and Zinc in Great Ape and Fossil Hominin Cementum Using Synchrotron X-ray Fluorescence Mapping. J. R. Soc. Interface 2018, 15, 20170626. [Google Scholar] [CrossRef]
- Dean, M.C.; Garrevoet, J.; Van Malderen, S.J.M.; Santos, F.; Mirazón Lahr, M.; Foley, R.; Le Cabec, A. The Distribution and Biogenic Origins of Zinc in the Mineralised Tooth Tissues of Modern and Fossil Hominoids: Implications for Life History, Diet and Taphonomy. Biology 2023, 12, 1455. [Google Scholar] [CrossRef]
- Brozou, A.; Mannino, M.A.; Van Malderen, S.J.M.; Garrevoet, J.; Pubert, E.; Fuller, B.T.; Dean, M.C.; Colard, T.; Santos, F.; Lynnerup, N.; et al. Using SXRF and LA-ICP-TOFMS to Explore Evidence of Treatment and Physiological Responses to Leprosy in Medieval Denmark. Biology 2023, 12, 184. [Google Scholar] [CrossRef]
- Massé, L.; d’Incau, E.; Souron, A.; Vanderesse, N.; Santos, F.; Maureille, B.; Le Cabec, A. Data File for Massé et al.’s Article, “Unraveling the Life History of Past Populations through Hypercementosis: Insights into Cementum Apposition Patterns and Possible Etiologies Using Micro-CT and Confocal Microscopy”. 2023. Available online: https://zenodo.org/records/10357391 (accessed on 14 December 2023).
- Schulte, E.; Davison, D.; Dye, T.; Dominik, C. A Multi-Language Computing Environment for Literate Programming and Reproducible Research. J. Stat. Softw. 2012, 46, 1–24. [Google Scholar] [CrossRef]
- Simonsohn, U.; Gruson, H. Groundhog: Reproducible Scripts via Version-Specific Package Loading. 2023. Available online: https://CRAN.R-project.org/package=groundhog (accessed on 12 December 2023).


| Individual | Sex | Age (yrs) | Tooth Identification | |
|---|---|---|---|---|
| FDI | BA | |||
| Sp17 | F | 20–39 | 15 | URP4 |
| Sp20 | IND | >20 | 35 | LLP4 |
| Sp39 | F | 20–49 | 35 | LLP4 |
| Sp114 | F | 20–60 | 14 | URP3 |
| Sp173 | M | >60 | 45 | LRP4 |
| Sp199 | M | >30 | 11 | URI1 |
| 12 | URI2 | |||
| Sp335 | M | >18 | 13 | URC |
| 23 | ULC | |||
| Sp479 | M | 20–60 | 11 | URI1 |
| Sp583 | F | >60 | 45 | LRP4 |
| Sp591 | M | 20–39 | 12 | URI2 |
| Sp666 | M | >30 | 33 | LLC |
| Sp709 | I | >20 | 31 | LLI1 |
| Sp735 | M | >20 | 45 | LRP4 |
| Sp755 | F | 20–39 | 13 | URC |
| 23 | ULC | |||
| Sp810 | F | >20 | 13 | URC |
| 23 | ULC | |||
| Sp876 | M | >30 | 45 | LRP4 |
| 35 | LLP4 | |||
| 44 | LRP3 | |||
| Sp884 | F | >30 | 34 | LLP3 |
| 35 | LLP4 | |||
| Sp914 | M | 20–39 | 33 | LLC |
| 34 | LLP3 | |||
| 35 | LLP4 | |||
| 43 | LRC | |||
| Sp1010 | M | >30 | 44 | LRP3 |
| Sp1135 | M | >30 | 11 | URI1 |
| Sp1172 | F | >30 | 15 | URP4 |
| 24 | ULP3 | |||
| Sp1230 | M | >20 | 34 | LLP3 |
| 44 | LRP4 | |||
| Sp1300 | MD | MD | 14 | URP3 |
| Specimens | Visual Examination | Microtomography—3D Thickness Maps | Confocal Microscopy—3D Topography Maps | ||||||||||||||||||||||||||
|---|---|---|---|---|---|---|---|---|---|---|---|---|---|---|---|---|---|---|---|---|---|---|---|---|---|---|---|---|---|
| Tooth | Occlusal Wear | CAR Si/Sta | Pulp EXP | IMP | HC | Bone Context | MAX THI (µm) | MAX LOC | MIN LOC | PREF LOC | Note | MAX LOC | MAX VE (µm) | ST | Note | OF | MAX VE (µm) | ST | Note | ||||||||||
| DEG | DIR | FOR | FEN | CAL | NT | ANT | |||||||||||||||||||||||
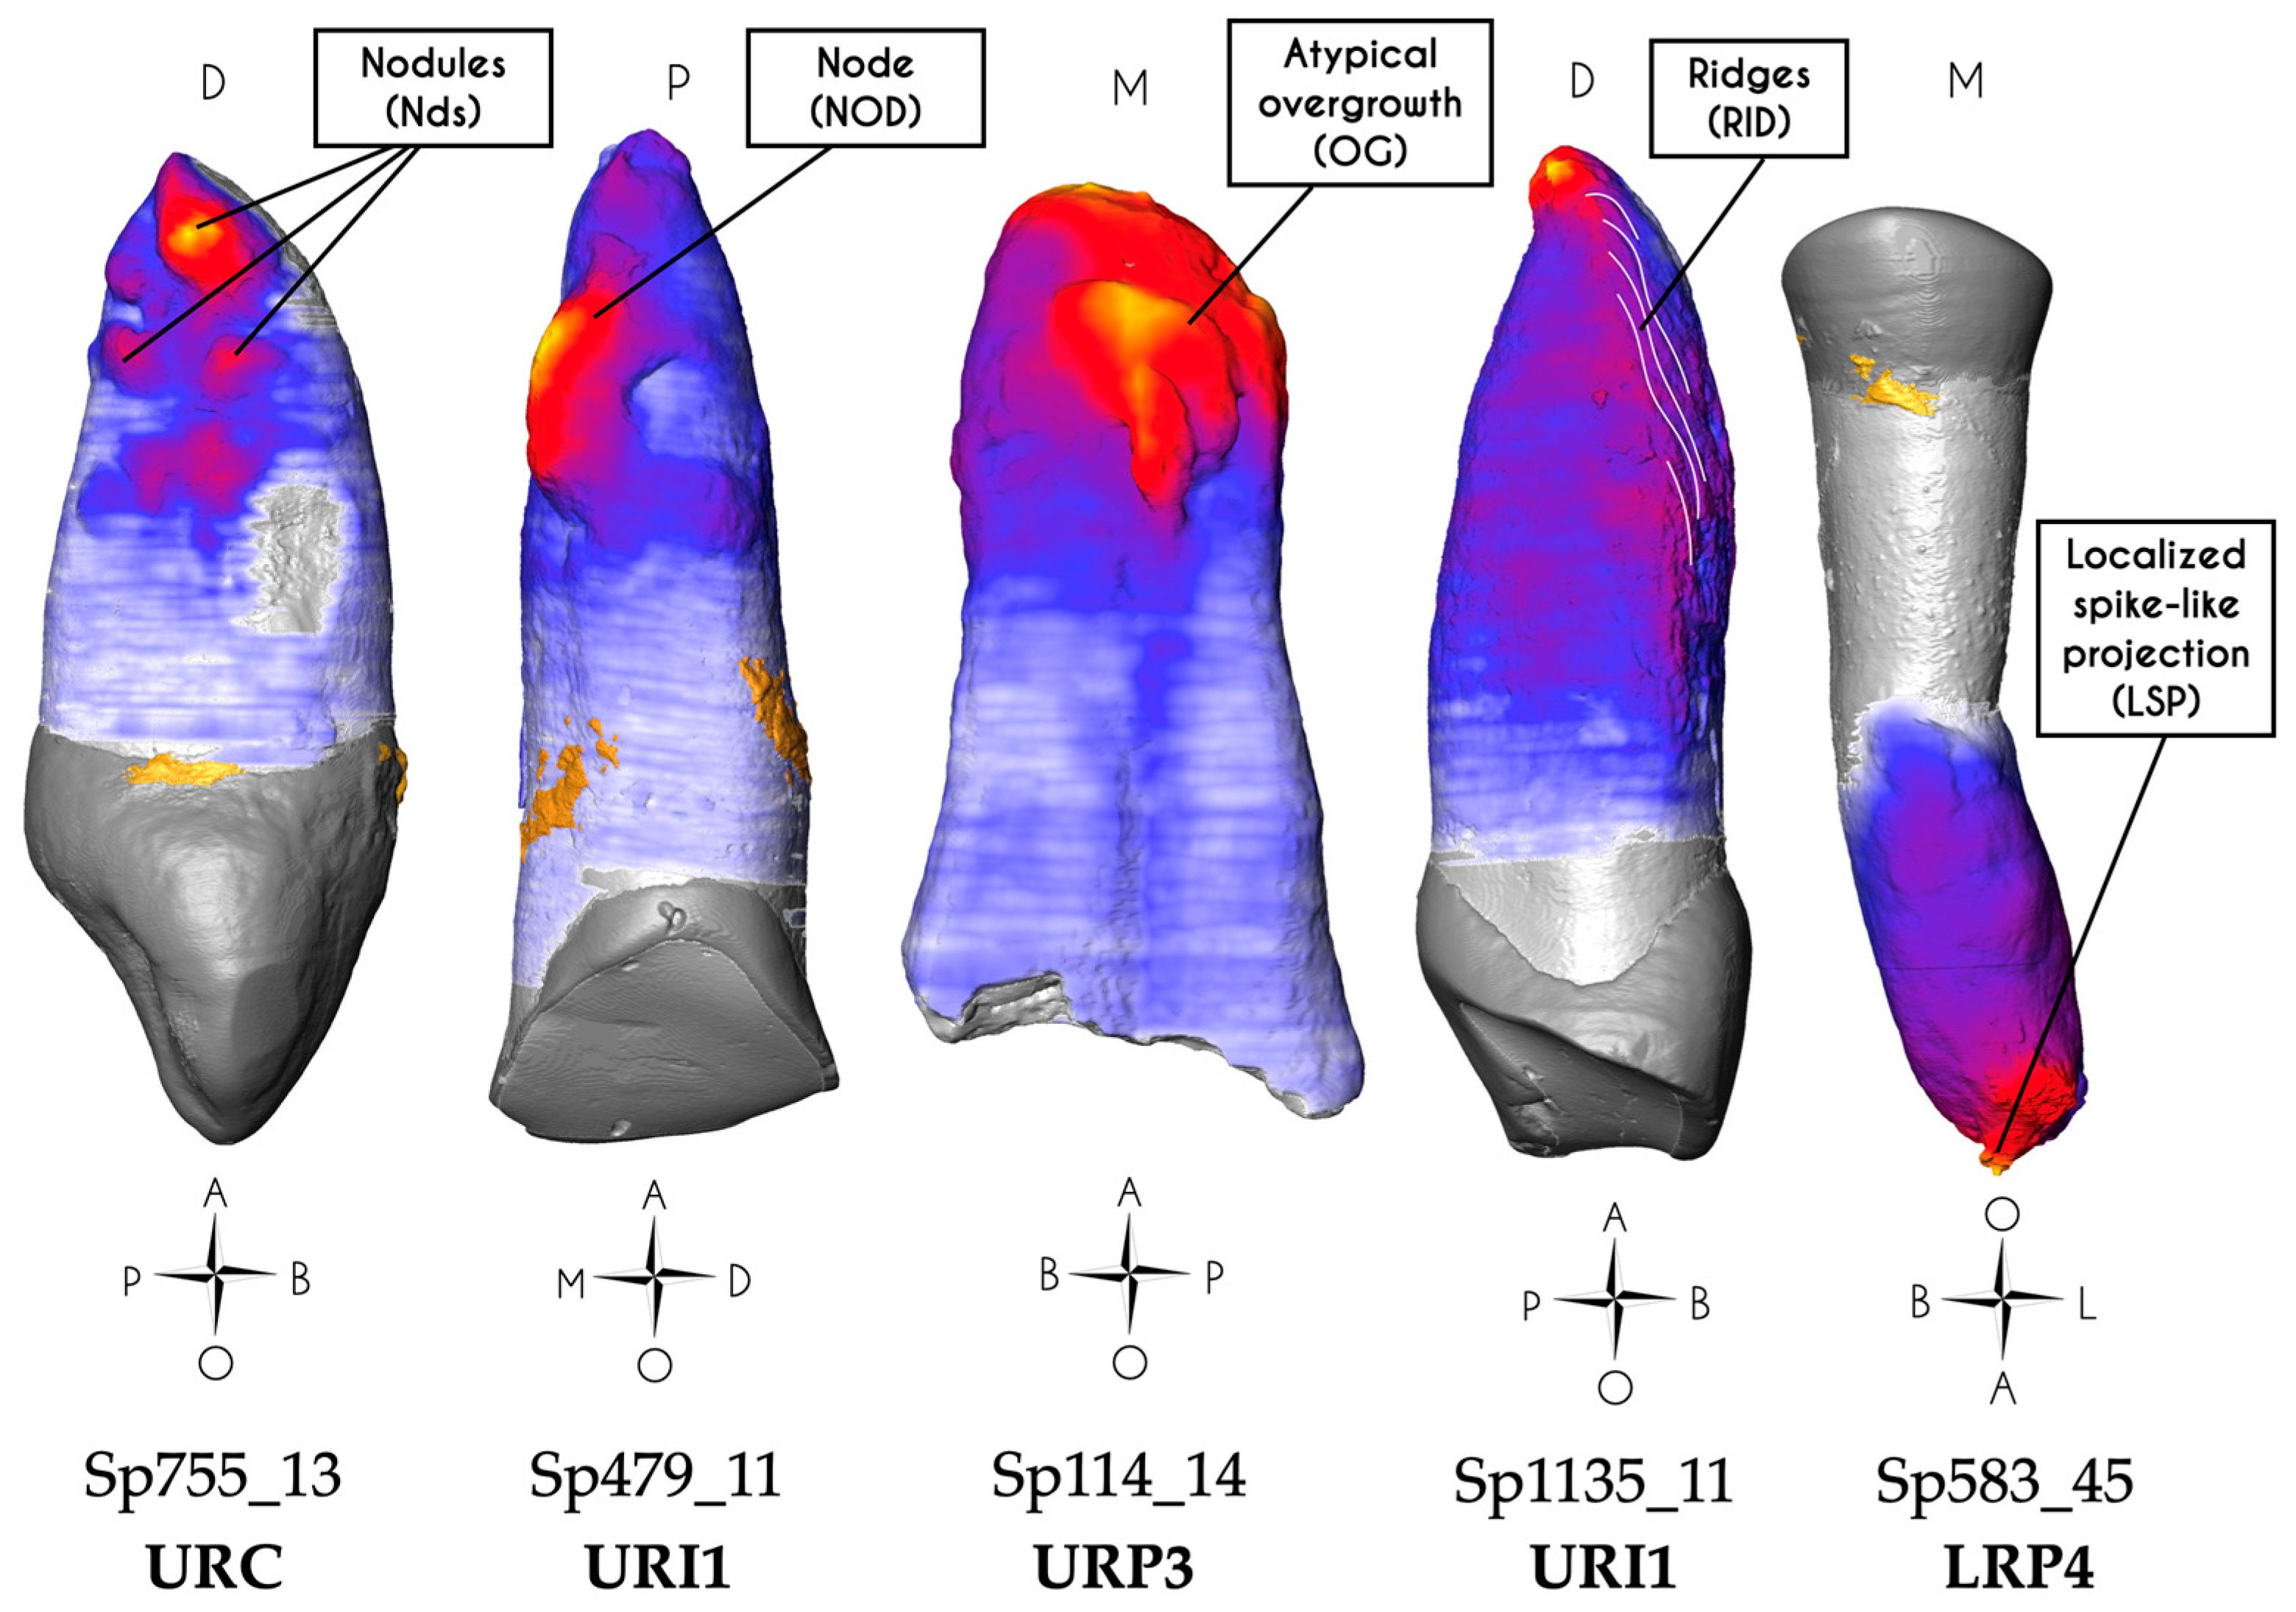
| Group 1: Impacted teeth | Sp755_13 | URL | 1 | 1 | 1 | - | 0 | 1 | 3.3.m | 0 | 0 | - | - | 1000 | 2d | < | Yes | Nds (d) | 2d | 690 | +S2 | Nds | 2m | 100 | -R2 | ||||
| Sp755_23 | ULC | 1 | 1 | 1 | - | 0 | 1 | 3.3.m | 0 | 0 | - | - | 1070 | 2d | < | Yes | NOD (d) | 2d | 450 | +S2 | IL | 2m | 90 | -R2 | IL | ||||
| Group 2: Infected teeth | Sp114_14 | URP3 | NA | NA | NA | 1/4 | M | 0 | 3.4.M | 1 | 0 | 0 | 1 | 1470 | m | < | No | OG | m | 475 | +S2 | ||||||||
| Sp335_23 | ULC | NA | NA | NA | 1/4 | M | 0 | 1.4.M | 1 | 0 | 2 | 1 | 2160 | < | > | No | RES (>) | < | 250 | +R2 | |||||||||
| Sp914_43 | LRC | NA | NA | NA | 1/4 | M | 0 | 1.4.m | 0 | 0 | 0 | NA | 1950 | d | m | No | - | d | 450 | +S2 | |||||||||
| Sp1172_15 | URP4 | NA | NA | NA | 1/4 | M | 0 | 1.4.M | 0 | 0 | 1d | 1 | 1380 | d | No | No | RES (d) | d | 110 | -S2 | AF | m | 220 | -S2 | AF | ||||
| Group 3: Hypo functional teeth | Sp17_15 | URP4 | 3 | 4 | 2 | - | 0 | 0 | 1.2.m | 0 | 0 | 1d | 1 | 1640 | 2m | < | No | FR (2m) | 2m | 160 | -R2 | FR | |||||||
| Sp20_35 | LLP4 | 2 | 6 | 2 | - | 0 | 0 | 1.2.m | 0 | 0 | 0 | 1 | 1310 | 1m | < | No | - | 1m | 180 | -S2 | IL | 2d | 150 | +S2 | CL | ||||
| Sp173_45 | LRP4 | 3 | 6 | 3 | - | 0 | 0 | 1.2.m | 0 | 0 | 0 | 2 | 1470 | 1> | < | No | SE | 1> | 170 | -S1 | CL | ||||||||
| Sp914_34 | LLP3 | 2 | 1 | 1 | - | 0 | 0 | 1.2.m | 0 | 0 | 0 | NA | 1410 | 1d | No | No | - | 1d | 140 | -S2 | |||||||||
| Sp1230_34 | LLP3 | 3 | 1 | 1 | - | 0 | 0 | 1.2.m | 0 | 1 | 0 | 1 | 1240 | 1m | No | No | - | 1m | 110 | -R2 | |||||||||
| Sp1230_44 * | URP3 | 3 | 1 | 1 | - | 0 | 0 | 1.2.M | 0 | 0 | 0 | 1 | 1280 | 1d | m | No | 2 roots | ||||||||||||
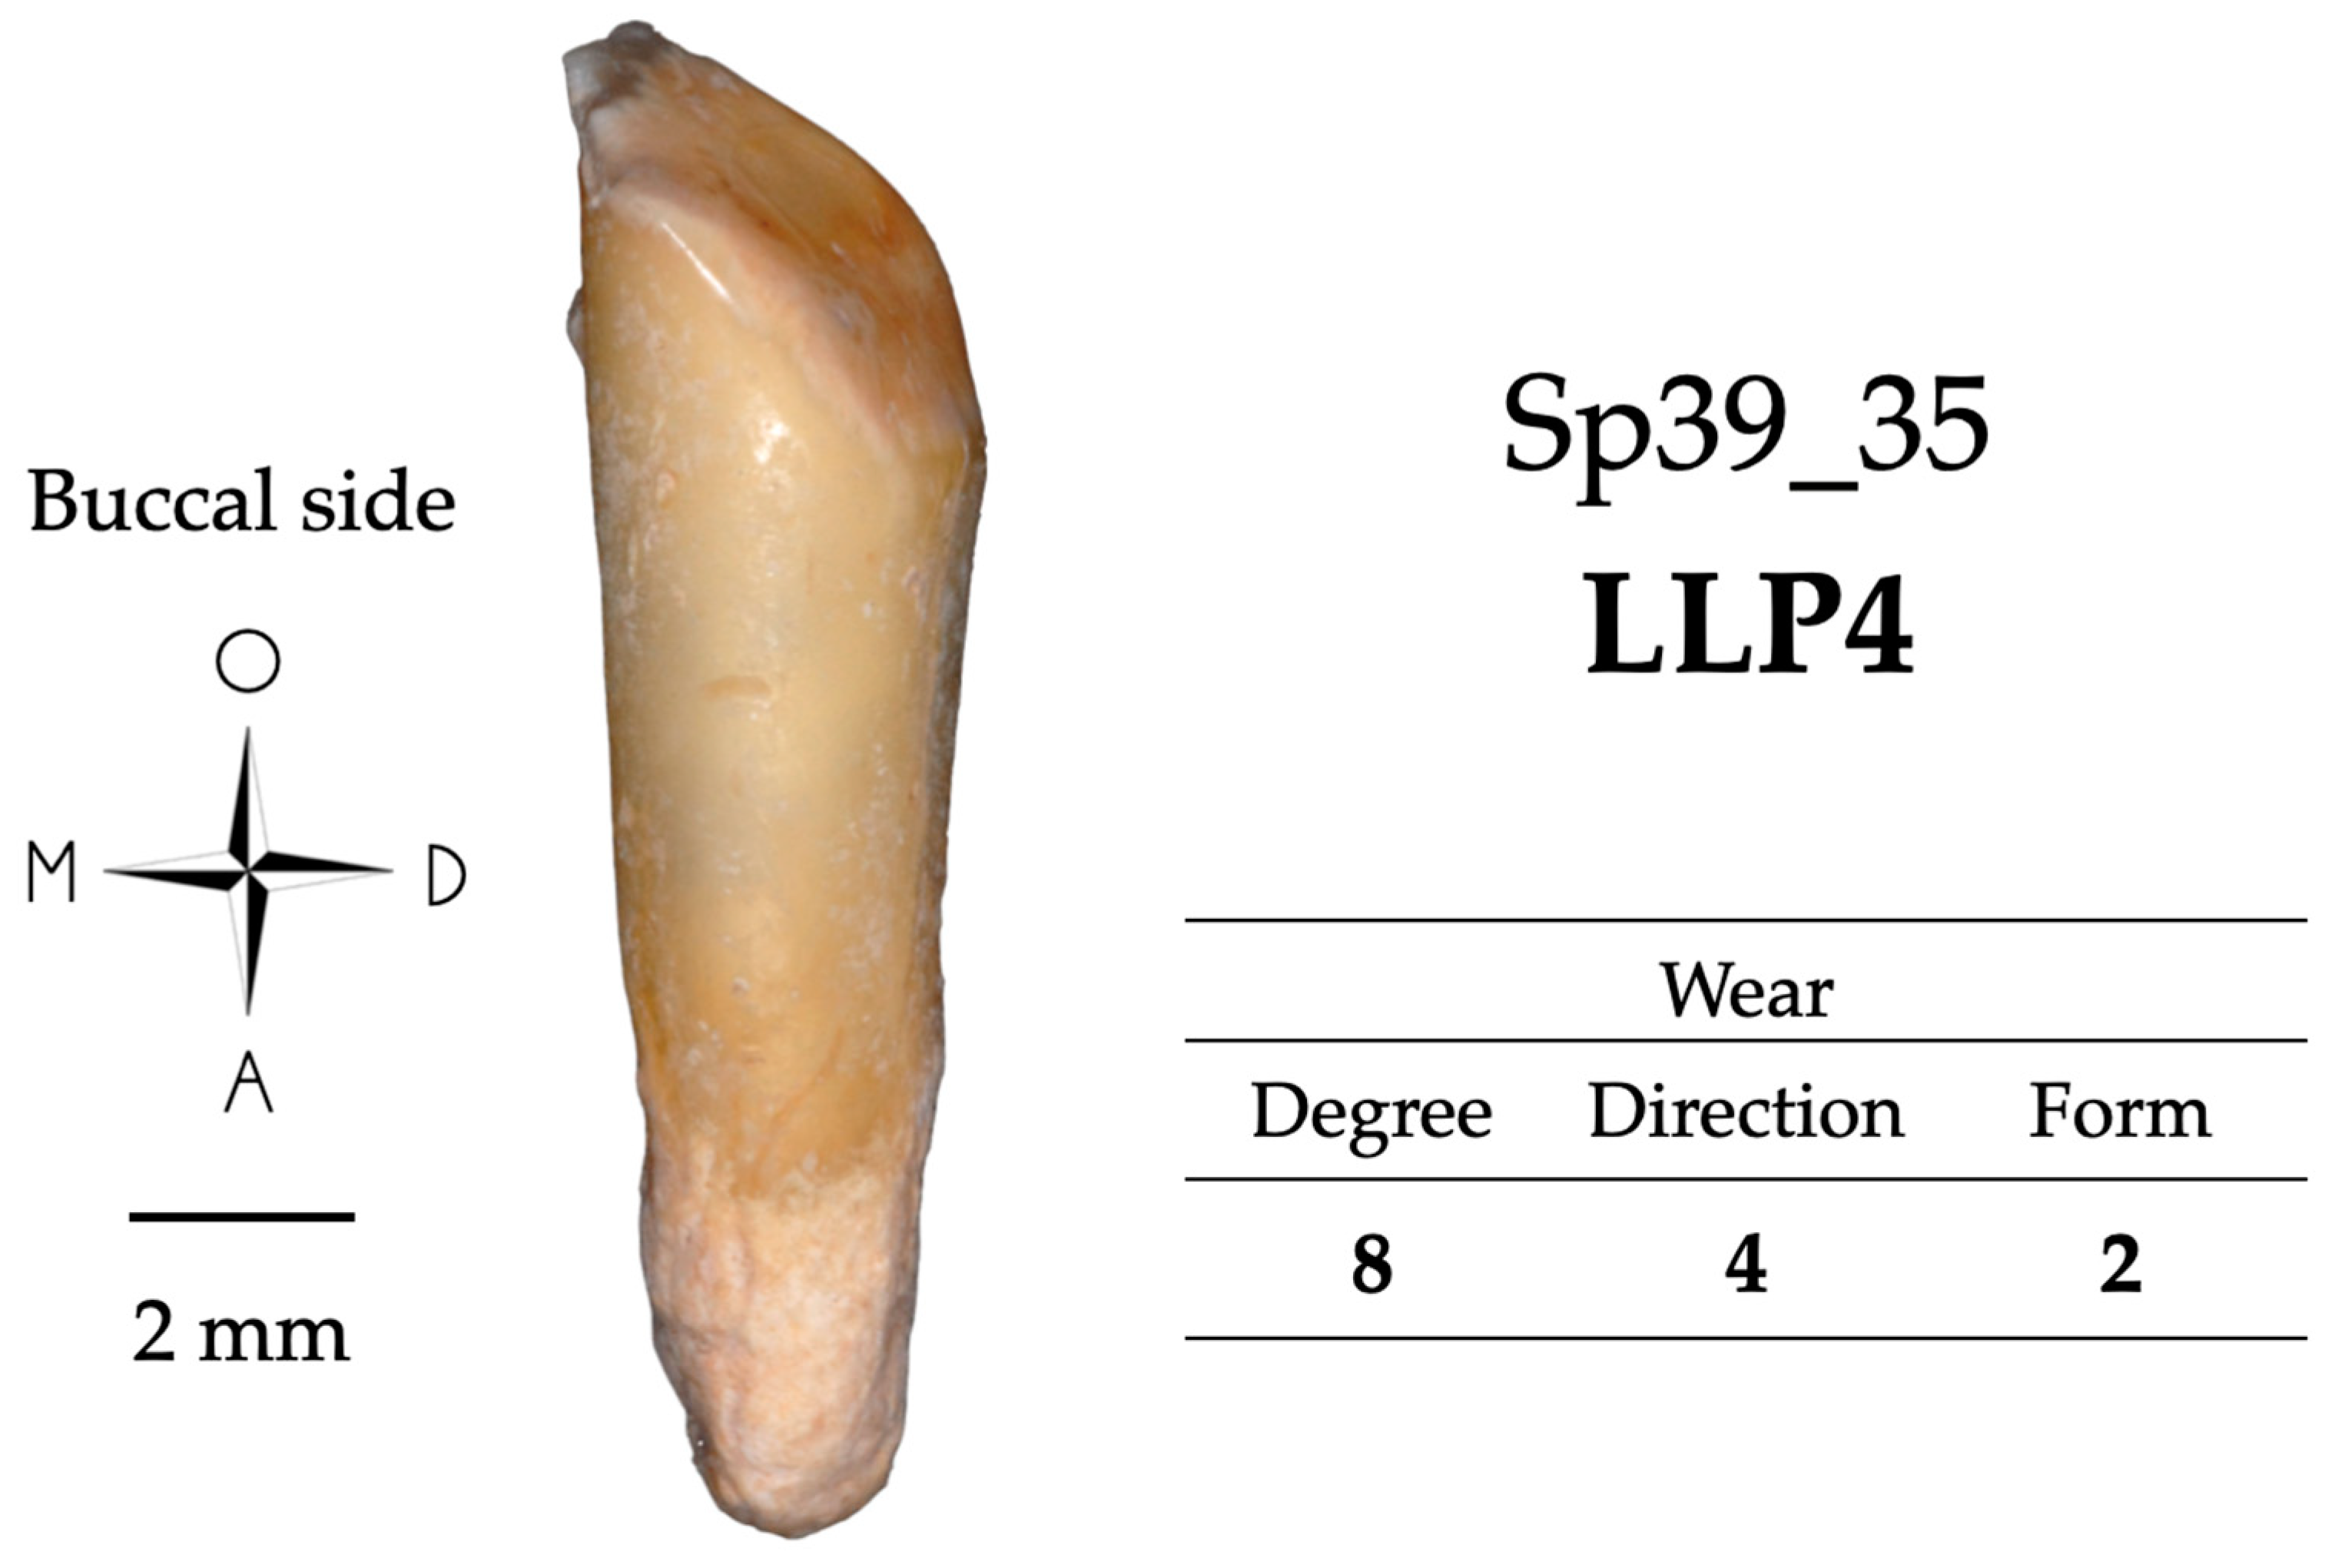
| Group 4: Hyper functional teeth | Sp39_35 | LLP4 | 8 | 4 | 2 | - | 0 | 0 | 1.2.m | 0 | 0 | 2 | 1 | 740 | 1m | No | Yes | - | 1m | 400 | +R2 | ||||||||
| Sp199_11 | URI1 | 6 | 6 | 4 | - | 0 | 0 | 1.2.m | 0 | 0 | 0 | 1 | 1380 | 1> | < | Yes | RES (1<) | 1> | 170 | -R1 | |||||||||
| Sp199_12 | URI2 | 6 | 4 | 4 | - | 0 | 0 | 1.3.m | 0 | 0 | 0 | 1 | 900 | 1> | < | Yes | - | 1> | 230 | +R1 | IL | 1< | 350 | +R1 | |||||
| Sp335_13 | URC | 4 | 2 | 2 | - | 0 | 0 | 1.2.m | 0 | 0 | 2 | 1 | 1970 | 1d | < | Yes | FR (1>m) | 1d | 325 | +R1 | |||||||||
| Sp479_11 | URI1 | 7 | 2 | 2 | - | 0 | 0 | 3.2.M | 0 | 0 | 0 | 1 | 1480 | 1> | < | Yes | NOD (m>) | 1m> | 665 | +S2 | NOD | ||||||||
| Sp591_12 | URI2 | 5 | 4 | 6 | - | 0 | 0 | 1.1.m | 0 | 0 | 1d | 1 | 1510 | 1> | < | Yes | FR (1>) | 1d | 192 | -R2 | FR | ||||||||
| Sp810_13 | URC | 3 | 2 | 2 | - | 0 | 0 | 1.3.m | 0 | 0 | 0 | NA | 1030 | 1> | < | Yes | - | 1> | 200 | +R1 | |||||||||
| Sp810_23 | ULC | 3 | 2 | 2 | - | 0 | 0 | 3.2.m | 0 | 0 | 0 | NA | 790 | 2> | < | Yes | Nds (>) | 2> | 475 | +S2 | Nds | ||||||||
| Sp876_35 | LLP4 | 6 | 2 | 6 | - | 0 | 0 | 1.2.m | 0 | 1 | 2 | 2 | 1010 | 1> | < | Yes | - | 1> | 250 | +R2 | |||||||||
| Sp914_33 | LLC | 4 | 4 | 4 | - | 0 | 0 | 1.2.m | 0 | 0 | 0 | NA | 1270 | 1> | No | Yes | - | 1> | 95 | -R1 | |||||||||
| Sp1010_44 * | LRP3 | 5 | 4 | 6 | - | 0 | 0 | 3.2.M | 0 | 0 | 1d | NA | 2080 | 1d | m | Yes | 2 roots | ||||||||||||
| Sp1172_24 | ULP3 | 6 | 2 | 4 | - | 0 | 0 | 3.2.M | 0 | 0 | 1d | 1 | 1200 | 2d | < | Yes | NOD (d) | ||||||||||||
| Sp1135_11 | URI1 | 6 | 4 | 5 | - | 0 | 0 | 1.3.m | 0 | 0 | 0 | 1 | 1180 | 1>d +2m | 1< | Yes | RID (<) | 1m | 300 | +R1 | 2<d | 260 | +R1 | RID | |||||
| Group 5: Mixed conditions | Sp583_45 | LRP4 | 6 | 4 | 2 | - | 0 | 0 | 3.2.M | 0 | 1 | 1d | 2 | 2770 | 1 | < | Yes | LSP (1) | 2> | 43 | -S2 | ||||||||
| Sp666_33 | LLC | 7 | 5 | 6 | 2/2 | 0 | 0 | 3.2.M | 0 | 1 | 1m | NA | 2350 | 1m | < | Yes | NOD, CAR (m) | 1m | 475 | +S2 | NOD | ||||||||
| Sp709_31 | LLI1 | 6 | 6 | 4 | - | 0 | 0 | 3.1.m | 0 | 1 | 0 | NA | 1330 | 1< | No | Yes | LPS (<) | < | 550 | +R1 | LSP | ||||||||
| Sp735_45 | LRP4 | 4 | 6 | 3 | 2/4 | C | 0 | 1.2.M | 0 | 0 | 1d | 2 | 1230 | 1m | No | Yes | CAR (m) | 1m | 175 | -R1 | d | 118 | -S2 | IL | |||||
| Sp876_44 | LRP3 | NA | NA | NA | 1/4 | M | 0 | 1.4.m | 0 | 1 | 0 | 2 | 1320 | 1d | No | Yes | RES (m<) | 1d | 200 | +R2 | |||||||||
| Sp876_45 | LRP4 | 4 | 6 | 3 | 2/2 | 0 | 0 | 1.2.M | 0 | 1 | 0 | 2 | 1670 | 1d | < | No | FR (1>) | 2d | 200 | +R2 | |||||||||
| Sp884_34 | LLP3 | 8 | 3 | 6 | - | 0 | 0 | 3.4.M | 0 | 0 | 1m | 1 | 1450 | d | No | No | W | 1d | 370 | +R2 | |||||||||
| Sp884_35 | LLP4 | 8 | 7 | 6 | - | W | 0 | 3.4.M | 0 | 0 | 1d | 2 | 1590 | d> | < | Yes | OG (>) | > | 310 | +R2 | |||||||||
| Sp914_35 | LLP4 | 3 | 3 | 3 | 2/3 | 0 | 0 | 1.2.m | 0 | 0 | 0 | NA | 1100 | 1d | No | No | CAR (d) | 1d | 375 | +R2 | |||||||||
| Sp1300_14 | URP3 | 7 | 4 | 4 | 2/2 | 0 | 0 | 1.2.M | 0 | 0 | NA | 2 | 1440 | 1m | > | No | CAR (m) | 2m | 280 | +R1 | |||||||||
| Group | Decisive Criteria |
|---|---|
| Impacted teeth |
|
| Infected teeth |
|
| Hypofunctional teeth |
|
| Hyperfunctional teeth |
|
| Mixed condition |
|
Disclaimer/Publisher’s Note: The statements, opinions and data contained in all publications are solely those of the individual author(s) and contributor(s) and not of MDPI and/or the editor(s). MDPI and/or the editor(s) disclaim responsibility for any injury to people or property resulting from any ideas, methods, instructions or products referred to in the content. |
© 2024 by the authors. Licensee MDPI, Basel, Switzerland. This article is an open access article distributed under the terms and conditions of the Creative Commons Attribution (CC BY) license (https://creativecommons.org/licenses/by/4.0/).
Share and Cite
Massé, L.; d’Incau, E.; Souron, A.; Vanderesse, N.; Santos, F.; Maureille, B.; Le Cabec, A. Unraveling the Life History of Past Populations through Hypercementosis: Insights into Cementum Apposition Patterns and Possible Etiologies Using Micro-CT and Confocal Microscopy. Biology 2024, 13, 43. https://doi.org/10.3390/biology13010043
Massé L, d’Incau E, Souron A, Vanderesse N, Santos F, Maureille B, Le Cabec A. Unraveling the Life History of Past Populations through Hypercementosis: Insights into Cementum Apposition Patterns and Possible Etiologies Using Micro-CT and Confocal Microscopy. Biology. 2024; 13(1):43. https://doi.org/10.3390/biology13010043
Chicago/Turabian StyleMassé, Léa, Emmanuel d’Incau, Antoine Souron, Nicolas Vanderesse, Frédéric Santos, Bruno Maureille, and Adeline Le Cabec. 2024. "Unraveling the Life History of Past Populations through Hypercementosis: Insights into Cementum Apposition Patterns and Possible Etiologies Using Micro-CT and Confocal Microscopy" Biology 13, no. 1: 43. https://doi.org/10.3390/biology13010043