1. Introduction
Circulating tumor cells (CTCs) are carcinoma cells which migrate through the intracellular matrix, actively enter the circulation through endothelial cells, presumably of capillaries and venules, and are disseminated through the bloodstream. Some CTCs survive to attach and penetrate the endothelial cells of capillaries and venules in distant organs, thereby forming metastases in these distant organs. Hence, CTCs are characteristically found in the blood of patients with metastases. The potential of a liquid biopsy to procure tumor cells before and during treatment in a non-invasive fashion has generated substantial interest in its use in oncology research and clinical practice. However, isolating CTCs from blood is inherently challenging, which has limited the use of CTCs in the clinical setting [
1].
CTCs are usually rare, representing a minuscule fraction of the cells present in a blood sample. Consequently, the number of CTCs isolated from a single-tube blood draw (5–10 mL of peripheral blood) is typically very low, frequently being from 1 to 15 cells. Nonetheless, these cells provide valuable data: several lines of evidence have confirmed that the detection of CTCs represents an innovative and reliable tool to predict disease progression and overall survival in patients with metastatic breast cancer (MBC) [
2,
3,
4,
5,
6,
7]. Furthermore, the enumeration of CTCs at different time points during treatment is considered a reliable surrogate marker of treatment response and a potential alternative form of non-invasive monitoring of response to therapy [
5,
6,
7].
Many technologies have been developed to isolate, enumerate, and characterize CTCs [
1,
8,
9,
10]. Of these, the CELLSEARCH
® System (Menarini-Silicon Biosystems, Huntingdon Valley, PA, USA) is the only CTC device cleared by the U.S. Food and Drug Administration (FDA). The CELLSEARCH
® System was cleared specifically for the enumeration of CTCs from the blood of patients with metastatic breast, colorectal, and prostate cancer [
11].
The CELLSEARCH® System captures CTCs based on immune affinity using antibodies specific to epithelial cell adhesion molecule (EpCAM). This cell-surface protein is expressed by many CTC subsets but is neither specific to CTCs nor is it universally expressed by all CTCs. Antibodies against surface EpCAM are routinely used to capture CTCs from blood, but such an approach is inherently limited to tumor cells with epithelial differentiation.
Cancer development frequently involves a transition of cells from an epithelial phenotype to a mesenchymal phenotype (a process referred to as epithelial-to-mesenchymal transition, or EMT), which results in the downregulation of EpCAM expression [
12,
13] and is associated with tumor-initiating potential [
14,
15]. During this switch to EMT, epithelial cells undergo upregulation of mesenchymal gene expression patterns and downregulation of epithelial genes. Furthermore, epithelial cells lose the ability to form streamlined cell–cell connections and cell polarity due to the restructuring of their cytoskeleton. Consequently, individual cells gain increased motility potential and an invasive phenotype [
16]. EpCAM-based methods, therefore, fail to efficiently capture mesenchymal cells, leading to the selective isolation of CTC phenotypes that may not be representative of most cells being shed from a tumor that have the ability to establish themselves and grow at a distal site. In addition, not all epithelial cancer cells express EpCAM [
17].
Antibody-based capture methods may also impact further characterization, such as gene expression analyses [
18]. As gene expression, by nature, reflects external signals received by cells and consequent signaling pathways within them, the interaction of capture antibodies with the cell surface may alter gene expression data obtained from CTCs captured using immune-affinity enrichment methods. Altogether, these limitations underscore an unmet need for the agnostic enrichment of intact CTCs that can be used in clinically meaningful downstream analyses.
The Parsortix
® PC1 System is a semi-automated device based on based microfluidic technology that enables the capture and harvest of rare cells (e.g., CTCs) from peripheral blood based on cell size and deformability [
19,
20,
21,
22,
23,
24,
25]. It addresses several issues encountered with current CTC capture technologies because it does not use antibodies or other cell-surface affinity agents to capture the target cells. The isolation/capture mechanism employed by the system is a purely physical method rather than a chemical or biological one, making it epitope independent and consequently agnostic to cellular phenotypes [
21,
22,
23] and able to capture cells with mesenchymal features.
This multi-center clinical study, entitled “Harvest of Circulating Tumor Cells (CTCs) from Patients with Metastatic Breast Cancer (MBC) Using the Parsortix
® PC1 System” (the ANG-002 HOMING study;
ClinicalTrials.gov identifier: NCT03427450), was designed and conducted to demonstrate that the Parsortix
® PC1 System can capture and harvest CTCs from the peripheral blood of patients with MBC and that the CTCs harvested by the system can be used for subsequent downstream evaluation. Cytology evaluation, quantitative polymerase chain reaction (PCR), fluorescence in situ hybridization (FISH), and RNA-seq were chosen as representative downstream evaluation methods, covering a range of molecular, histopathological, and cytomorphological techniques currently used in clinical laboratories. The results from the HOMING study demonstrated that CTCs can indeed be harvested from the peripheral blood of patients with MBC and utilized in subsequent downstream analysis methods. The data generated under this study were included in a De Novo request for classification of the Parsortix
® PC1 System (DEN200062) as a Class II prescription device, and the FDA granted the request on 24 May 2022 (
https://www.accessdata.fda.gov/cdrh_docs/pdf20/DEN200062.pdf, accessed on 20 October 2022).
2. Materials and Methods
2.1. Ethical Conduct of the Study
The ANG-002 HOMING study was an IRB-approved prospective clinical trial registered with
ClinicalTrials.gov (identifier: NCT03427450) and sponsored by ANGLE Europe Limited (Guildford, UK), the manufacturer of the Parsortix
® PC1 System. The study involved the collection of whole-blood samples from patients with MBC (either women with newly diagnosed MBC who were about to start a new line of therapy of any type to treat and/or manage their disease or those with currently progressive or recurrent MBC) as well as from a control population of healthy female volunteers (HVs) consisting of women who self-declared no prior/current history of cancer and no known history of breast disease. All study participants provided informed consent before participation in the study. All laboratory testing was performed by operators blinded to the clinical status of the participants.
Participants were enrolled, and samples were collected and processed at four institutions: The University of Texas MD Anderson Cancer Center, Houston, TX, USA; University of Southern California, Los Angeles, CA, USA; University of Rochester Medical Center, Rochester, NY, USA; and Northwestern University, Chicago, IL, USA. The study was conducted with the approval of each institution’s institutional review board and in accordance with the Declaration of Helsinki. A study-specific online database was designed, constructed, and maintained using the University of Rochester Medical Center’s REDCap system [
26,
27].
2.2. Blood Collection and Processing
Each participant provided between ~7 mL and 23 mL of whole blood collected specifically for this study into one 3 mL K2EDTA tube followed by two 10 mL K2EDTA tubes at a single time point. For patients with MBC, blood was collected before the initiation of their new therapy and a minimum of 7 days after the last administration of any previous cytotoxic treatment, either from venipuncture or through an existing port. For patients continuing an existing oral hormonal and/or targeted immunotherapy in addition to starting a new treatment, blood was drawn before the next administration of their oral hormonal therapy and/or immunotherapy and before the initiation of their new therapy treatment. For HVs, blood was collected via venipuncture on the day of study.
For the capture of CTCs, all samples were processed using the Parsortix® PC1 System within 8 h of collection. First, the blood volume in each of the K2EDTA tubes was estimated using an engineering ruler. The initial portion of blood collected into the 3 mL K2EDTA tube immediately following the venipuncture or the port flushing was used for a complete blood count with leukocyte differential testing. For the two 10 mL K2EDTA tubes, a minimum combined volume of ≥5 mL of blood was required for processing using the Parsortix® PC1 System equipped with a Parsortix GEN3D6.5 Cell Separation Cassette. If both tubes contained a combined total of <5 mL of blood, the participant was considered non-evaluable, and the blood was discarded. If only one of the 10 mL K2EDTA tubes contained ≥5 mL of blood, then only the blood in that tube was processed for the primary cytological evaluation. If both tubes had <5 mL of blood, but the combined volume of blood in both tubes was ≥5 mL, then the blood from the two tubes was combined in a 10 mL K2EDTA tube into ≥5 mL of blood that was processed for the primary cytological evaluation. If both 10 mL K2EDTA tubes had ≥5 mL of blood, then the tube with the higher volume of blood was processed for the primary cytological evaluation, and the other tube was processed for one of the exploratory evaluations (qPCR, FISH, or RNA-seq).
Information about samples was blinded from the processors, and no follow-up information was collected for any participants. The population of cells captured from each blood sample by the Parsortix® PC1 System was harvested directly from the cell separation cassettes (each harvest consisting of a total volume of 210 µL of phosphate-buffered saline) into collection vessels and used for downstream processing and characterization.
2.3. Downstream Characterization
2.3.1. Primary Evaluation
For all participants, the cells harvested from the 10 mL K2EDTA tube containing the larger volume of blood were subjected to cytomorphological evaluation by a qualified pathologist (JDK) to determine the presence and number of observable CTCs.
Cytology Processing
Following enrichment, cells were harvested into a 1.5 mL microfuge tube containing 60 µL of fetal bovine serum (FBS). The harvested cells suspended in FBS were pipetted into a Cytospin 4 Cytofunnel assembly (ThermoFisher Scientific, Waltham, MA, USA) containing a positively charged glass Cytoslide (ThermoFisher Scientific). The slide assembly was cytocentrifuged at 800 rpm for 3 min on low acceleration, and the slide was removed from the assembly and allowed to air-dry at room temperature for 1 min. The air-dried slide was then submersed in 100% methanol for 1 min, removed, gently tapped at the edge on a paper towel to remove any excess methanol, and allowed to air-dry at room temperature for 30 min. The fixed slides were stored at room temperature until shipment weekly to the designated central testing laboratory located at the MD Anderson Cancer Center.
At the laboratory, the slides underwent Wright-Giemsa staining on an automated stainer, and examination by a qualified pathologist (JDK) with expertise in blood evaluation and cytopathology who identified and enumerated CTCs using conventional cytomorphological criteria of malignancy, which included: increased nuclear-to-cytoplasmic ratio, cellular pleomorphism, large size relative to white blood cells, irregular nuclear membrane, chromatin structure, nuclear hyperchromasia, cytoplasmic vacuoles, cellular aggregates (≥2 cells). The stained slides were evaluated by light microscopy, and the cells that had been cytomorphologically identified as CTCs by the qualified pathologist were photographed, identified, and counted. Cells without definite features of malignancy but distinct from usual peripheral blood–formed elements (e.g., neutrophils, immature granulocytic precursors, monocytes, nucleated red blood cells) were not counted as CTCs. Naked nuclei or cell fragments were not evaluated. Samples in which technical artifacts caused substantial deformation of peripheral blood elements to an extent that compromised their morphological evaluation were considered unsatisfactory.
2.3.2. Exploratory Evaluations
For participants for whom both 10 mL K2EDTA tubes contained ≥5 mL of blood, the cells harvested from the second tube were subjected to one of the following exploratory evaluations.
Gene Expression Evaluation by qRT-PCR Processing
Cells captured in the cassette were harvested directly into a 2.0 mL microfuge tube and centrifuged at ~400× g for 5 min at 4 °C, and as much of the supernatant as possible was removed without disturbing the cell pellet. The cell pellet was resuspended in 320 µL of Qiagen buffer RLT containing 1% 2-mercaptoethanol. Lysates were stored at −80 °C until batch shipment to the designated central qPCR testing laboratory at The MD Anderson Cancer Center for gene expression analysis using quantitative reverse-transcriptase real-time PCR (qRT-PCR). Each lysate was evaluated for expression of the following genes using hydrolysis (TaqMan) probes (Bio-Rad Laboratories, Hercules, CA, USA): GAPDH and B2M (housekeeping genes), GYPA (a nucleated red blood cell marker), PTPRC (a white blood cell marker), EpCAM and KRT19 (epithelial cell markers), ERBB2 (a breast tumor marker), and TWIST1 and SNAI2 (mesenchymal cell markers). Each gene was analyzed in triplicate for every sample (including samples from patients, healthy volunteers, positive and negative controls), and 40 cycles of PCR were performed. PCR thermocycling and data acquisition were performed using the appropriate instrumentation and software, which automatically set the cycle threshold (Ct). The average of the three replicate Ct values for each gene target for each sample and for the positive and negative controls were used for the evaluations presented in this report. For all instances where a gene was undetectable after 40 cycles of PCR, a Ct value of 40.0 was assigned for analysis purposes. Aliquots of nuclease-free water were used as negative controls for the assay. The SUM149 triple-negative breast cancer cell line was selected as a positive control since it exhibits a partial EMT phenotype. Aliquots of SUM149 cell lysate were used as positive controls. They were expected to have positive expression for GAPDH, B2M, KRT19, EpCAM, ERBB2, TWIST1, and SNAI2 while lacking expression of the white blood cell marker PTPRC and the nucleated red blood cell marker GYPA. Expression results are shown as 40-Ct values so that increased values reflect increased expression, and undetectable values are represented as 0. Normalization was not used so that gene expression can be interpreted as expression per tube of blood since the number of captured CTCs is variable.
RNA-seq Processing
An aliquot of 200 μL of whole blood from the 10 mL K2EDTA tube was transferred directly into a 1.5 mL microfuge tube containing 1 mL of RNAlater RNA Stabilization Solution before processing of the blood sample on the Parsortix® PC1 System. The remaining blood was processed on the Parsortix® PC1 System, and the cells captured in the cassette were harvested directly into a 0.2 mL PCR tube. The harvest was centrifuged at ~400× g for 5 min at room temperature, and as much of the supernatant as possible was removed without disturbing the cell pellet. The cell pellet was resuspended in 10 μL of Agilent SideStep lysis and stabilization buffer. Both lysates (i.e., the aliquot of whole blood and the harvest) were stored at −80 °C until shipment to the designated central RNA-seq testing laboratory at the University of Southern California. The RNA-seq laboratory isolated RNA from the whole blood lysates using Ambion RiboPure blood kits for RNA. The cDNA generated was amplified and purified using 50 ng of the purified RNA obtained from each of the whole blood lysates and 2 µL from each harvest lysates using NuGEN Trio RNA-Seq kits. cDNA libraries were then prepared, amplified, refined, and filtered for each sample using NuGEN Trio RNA-seq kits. The quantity and quality of each library preparation were assessed using DNA quantitation by a Qubit fluorometer. DNA fragment size distribution was determined using an Agilent 2100 Bioanalyzer. Only the cDNA libraries from the Parsortix® harvest samples (and not the whole blood aliquots) were evaluated as a part of this report. The cDNA libraries generated from the harvest samples were sequenced using an Illumina HiSeq 2500 at the University of Southern California Genomics Core with 2 × 125 bp paired-end reads. Data analysis was conducted by an experienced bioinformatician (DC) to determine the expression patterns of breast cancer–related genes.
The RNA-seq method described above was validated in whole-transcriptome profiling studies in CTC from patients with non-metastatic breast cancer (stage II-III). These studies’ procedures and results were previously reported [
28,
29], and the results demonstrated that CTCs from patients with MBC could be used to generate cDNA libraries of sufficient quantity and quality that enable whole-genome sequencing.
Salmon 1.5.0 mapped the HV and MBC Parsortix
® PC1 harvest sequencing data against the reference transcriptome V37 from Gencode [
30]. Quantification output from Salmon is reported in transcripts per kilobase million (TPM), computed by dividing read counts by the length of each gene in kilobases to obtain reads per kilobase (RPK). All the RPK values in a sample are summed, and the summation is divided by 1,000,000 to provide a “per million” scaling factor. The RPK values are divided by the per million scaling factors to obtain the TPM value. The sum of all TPM values is the same in each sample, making it easier to compare the proportion of reads mapped to a gene in each sample.
In contrast, with reads per kilobase million (RPKM) and fragments per kilobase million (FPKM), the sum of the normalized reads in each sample may be different, making it harder to compare models directly. In a second analysis, a listing of all unmapped reads (i.e., reads that did not map to the transcriptome) from the Salmon analysis was tabulated for each sample. Magic-BLAST 1.5.0 was used to compare 100,000 randomly sampled from each of the unmapped reads files to the genome ver GRCh38 from Gencode, the transcriptome V37 from Gencode, and a file with all rDNA sequences downloaded from GenBank. The purpose was to determine whether the unmapped reads from Salmon analysis map better to the genome or the rDNA, instead of the transcriptome, which would support gDNA contamination. A result can contain more than 100,000 entries because a read can map to more than one genomic feature in the reference.
HER2 FISH Processing
Cells captured in the cassette were harvested directly into a 1.5 mL microfuge tube containing 60 µL of FBS. The harvested cells suspended in FBS were pipetted into a Cytospin 4 Cytofunnel assembly with a positively charged glass Cytoslide. The slide assembly was cytocentrifuged at 800 rpm for 3 min on low acceleration, and the slide was removed from the body and allowed to air-dry at room temperature for 1 min. The air-dried slide was then submersed in 100% methanol for 15 min, removed, gently tapped at the edge on a paper towel to remove any excess methanol, and allowed to air-dry at room temperature for 30 min. The fixed slides were stored at ≤−20 °C until shipment to the designated central HER2 FISH testing laboratory at the University of Southern California for processing, as described elsewhere [
31,
32,
33], using commercially available HER2 FISH reagents (Abbott PathVysion HER2 DNA Probes [PN 30-171060/1800], DAPI II Counterstain [PN 30-804861/8100], NP-40 [PN 30-804820/8100], 20X SSC [PN 805850], and Vysis FISH Pretreatment Reagent Kits [PN 32-801270]) and evaluated by a board-certified pathologist (MFP). The pathologist determined the presence or absence of cells showing human epidermal growth factor receptor 2 (HER2/ERBB2) gene amplification. Criteria for evaluating CTCs for HER2 gene amplification status by FISH involved an assessment of the nuclear morphology to distinguish tumor cells from normal leukocytes in the slide preparations, followed by an evaluation of the HER2 gene copy number and chromosome 17 centromere (CEP17) copy number in the tumor cells. The criteria used in distinguishing tumor cells from white blood cells are similar to the requirements described for the cytological evaluation of the peripheral blood cells with the Wright-Giemsa stain. These criteria of malignancy included an increased nucleus size, nuclear pleomorphism, increased size relative to white blood cells, irregular nuclear membranes, increased nuclear DAPI staining, uneven distribution of atomic chromatin (heterochromatin and euchromatin), and aggregation of multiple, large cells. Because the CTCs contained intact tumor cell nuclei, not 4-micron histology tissue sections through tumor cell nuclei, the average chromosome 17 number was considered a reflection of overall DNA ploidy status as well as chromosome 17 aneusomy. A sample was considered HER2-amplified if the HER2/CEP17 ratio was greater than 2 and HER2 gene copies were present in groups as observed in human breast cancer cell lines known to have HER2 gene amplification with HER2/ERBB2 gene copies arranged as aggregates in homogeneous staining regions [
34] CTCs with increased HER2 gene copy number greater than 4 but also paired with individual chromosome 17 centromeres, as observed in human breast cancer cell lines that lack HER2 gene amplification and lack HER2 mRNA/protein overexpression, were evaluated as HER2-not-amplified.
3. Results and Discussion
3.1. Patient Characteristics
A flow chart of participants enrolled in the ANG-002 HOMING study is shown in
Figure 1. A total of 216 patients with metastatic breast cancer and 205 female healthy volunteers were enrolled at the four clinical study sites between April 2018 and February 2019. Nine (4.2%) of the patients with MBC and one (0.5%) of the HVs enrolled were ineligible for the study, leaving 207 eligible patients with MBC and 204 eligible HVs that were evaluable for one or more of the study endpoints. The HVs tended to be younger, healthier, and more racially diverse than the patients with MBC (
Table 1).
As enrollment was open to any patient with MBC starting a new line of therapy, the patient population was split between those with newly diagnosed metastatic disease and others with progressive or recurrent disease at the time of the sample collection. Patient characteristics between these two cohorts were generally well-balanced. Overall, 27 (13.0%) of the patients with MBC had HER2-positive tumors (as determined from their medical records using the available HER2 IHC and/or FISH testing results on their primary and/or metastatic tumor tissue); only 4 (5.4%) of patients with newly diagnosed MBC had HER2-positive tumors, in contrast to 23 (17.3%,
p = 0.014) of the patients with MBC with progressive and/or recurrent disease (
Table 1). Despite these differences, the MBC patients enrolled in the ANG-002 study were representative of patients with MBC that would be seen in the general population [
35].
3.2. Cytology Evaluation
To enumerate CTCs agnostic to protein expression bias, we used standard cytology techniques to identify cells based on longstanding morphologic features associated with malignancy. In validation studies, the cytocentrifugation (cytospin) method used to prepare slides for cytology and FISH evaluation showed significant cell loss for three cell lines (
Figure S1). These results indicated that 37–51% of the cells harvested by the Parsortix
® PC1 System were lost due to the cytology slide preparation method and/or the Wright-Giemsa staining procedure (compared to harvesting the cells directly into 96-well plates).
For the identification and enumeration of CTCs, the cells harvested from blood samples were fixed, Wright-Giemsa stained, and reviewed by a single pathologist; the resulting CTC prevalence rates in HVs and patients with MBC are shown in (
Table 2). A flow diagram of the eligible subjects with evaluable cytology slides is shown in
Figure 2a. In the 204 eligible HVs and 207 eligible patients with MBC, 12 (5.9%) and 13 (6.3%), respectively, did not produce evaluable slides for cytology examination, leaving a total of 192 HVs and 194 patients with MBC with evaluable Wright-Giemsa-stained cytology slides.
Examples of the Wright-Giemsa-stained CTCs are shown in
Figure 2b, including harvested CTC clusters. Among the 194 patients with MBC with evaluable results, 94 (48.5%, 95% CI 41.5–55.4%) had one or more cells classified as CTCs, whereas 100 (51.5%, 95% CI 44.6–58.5%) had no cells classified as CTCs (
Table 2 and
Table 3,
Figure 2c). Among the 192 HVs that had evaluable results, 173 (90.1%, 95% CI 85.1–93.6%) had no cells classified as CTCs, whereas 19 (9.9%, 95% CI 6.4–14.9%) had one or more cells classified as CTCs, representing a significantly lower rate of CTC detection compared to that of the patients with MBC (Fisher exact test
p < 0.001,
Table 3).
A significantly larger proportion of patients with MBC with recurring or progressive metastatic disease were found to have one or more CTCs compared to those with newly diagnosed metastatic disease (
Table 3), which is consistent with what has been reported in the literature on CTCs in metastatic breast cancer [
36]. Furthermore, CTC counts were significantly higher in patients with recurring/progressive disease (
p = 0.019,
Figure 2c).
Table 2 further summarizes the proportions of HVs and patients with MBC with CTCs observed on their cytology slides according to various demographic and clinical subgroups. Interestingly, among women with newly diagnosed MBC, approximately twice as many who were ≥ 57 years old (i.e., post-menopausal women) were observed to have CTCs compared to those who were < 57 years old (47.2% vs. 18.2%, respectively,
p = 0.012).
There is also some evidence that the sample collection method had an impact on the CTC counts. A significantly larger proportion of the patients with MBC whose blood was drawn via a central port were observed to have CTCs compared with the patients whose blood was drawn via venipuncture (≥1 CTC: 94.3% vs. 38.4%, respectively, Fisher exact test
p < 0.001, ≥5 CTCs: 62.9% vs. 13.8%, respectively, Fisher exact test
p < 0.001,
Table 2). This may be due to technical or procedural differences, volume, anatomic collection location, or patient population (a larger percentage of patients with progressive or recurrent disease had their blood samples collected via an installed port;
Table 1). Previous reports have also shown that CTC levels can vary by anatomical location of cancer [
37,
38]. Additionally, peripheral blood drawn from antecubital veins has likely circulated through both lung and peripheral capillaries after egressing from tumors (from either primary, i.e., breast, or metastatic sites). In contrast, some blood from a central port comes directly from the tumor without first filtering through additional capillary beds. The Parsortix
® PC1 System enriches for cells that cannot pass through the ~6.5-μm critical gap of the separation cassette at 99 millibars of pressure (roughly equivalent to typical diastolic blood pressure); these same cells may likewise be unable to traverse the microcirculation of a capillary lumen. Another possible explanation for this observation is that patients with MBC with a central port indwelling usually receive intravenous treatments such as chemotherapy and thus may have a more aggressive disease compared to the wider population of patients with MBC. Progressive disease was noted in 31 (88.6%) of the 35 patients who had blood drawn from a central port and in only 94 (59.1%) of the 159 patients who had blood drawn via venipuncture (Fisher exact test
p = 0.001,
Table 2). Consequently, this subset of patients with MBC (i.e., those with a central port installed experiencing disease progression) is a specific population that would likely benefit from CTC evaluation.
In summary, cytologic evaluation showed that 48.5% (95% CI 41.5–55.4%) of all patients with MBC with evaluable staining results had one or more CTCs identified. Even though cytocentrifugation is a widely used method for depositing cells onto cytology slides and recent studies have shown that Parsortix-harvested cells deposited onto cytology slides via cytocentrifugation have effectively preserved cellular morphology [
39], it is essential to note that this method caused significant loss (~57% on average) of the cells present in the Parsortix
® PC1 System harvests. Given this large observed cell loss, it is possible that a larger proportion of patients with MBC had CTCs present in their harvests, but these cells were simply not retained on the cytology slides. Alternative techniques to place cells on microscope slides without using the cytocentrifugation methods are under development. However, other downstream analysis techniques, such as gene expression analysis, may be able to utilize cells captured and harvested directly into a container without loss of the harvested cells potentially caused by subsequent manipulations of the harvested material.
3.3. Gene Expression by qRT-PCR
As described above, CTCs harvested directly for gene expression may serve as more effective biomarkers of CTCs. Although still subject to variation, gene expression analysis is relatively less subjective than image analysis and does not require deposition of the cells onto a slide. A subset of enrolled patients had a second blood tube processed by the Parsortix
® PC1 System, and the cells harvested were subjected to gene expression analysis by qRT-PCR (as described in this section) or RNA-seq (as described in the next section). The qRT-PCR assay used to evaluate gene markers for epithelial, mesenchymal and breast cancer cells was shown to be reliable and reproducible [
40] and was able to detect a single epithelial cell that expressed
KRT19, a single epithelial cell that expressed
ERRB2, 10 cells that expressed
EPCAM, or approximately 25–50 mesenchymal cells that expressed
SNAI2 and/or
TWIST1 (data not shown).
Figure 3a provides the flow chart for the 77 eligible patients with MBC and 105 eligible HVs where the second blood sample was used for qPCR regarding their eligibility for this exploratory evaluation. Only one of the lysates from the 75 patients with MBC and two lysates from the 104 HVs who had a sufficient volume of blood for processing failed to produce a reliable PCR readout (as determined by the lack of positive signal for the housekeeping genes), leaving a total of 74 patients with MBC and 102 HVs with evaluable qPCR results.
CTC gene expression from the qPCR evaluation and the corresponding enumeration from the cytology evaluation are summarized in
Table 4. A total of 18 negative controls (nuclease-free water) and 18 positive controls (SUM149 cell lysate) were compared with the patient and HV samples. Using a Ct threshold of ≤35.0 for each of the genes to define positivity, none of the negative controls were positive for any of the genes, and 100% of the positive controls were positive for all of the genes (except the
GYPA and
PTPRC genes, as expected). In both the patients with MBC and HVs, 100% were positive for one or both of the housekeeping genes, 100% were positive for
PTPRC (indicating the presence of white blood cells in all of the harvests), and <7% were positive for
GYPA (indicating a low incidence of red blood cell contamination). As shown in
Table 4, 52.7% of the patients with MBC were positive (Ct value ≤ 35.0) for at least one of the CTC-related genes (
KRT19,
EPCAM,
ERBB2,
TWIST1, and/or
SNAI2), whereas only 19.6% of the HVs were positive for at least one of the CTC-related genes. Optimizing the Ct thresholds for each gene based on expression in the HVs increased the specificity of CTC genes at the expense of sensitivity (
Table S1).
As shown in
Figure 3b, control genes, including
GAPDH,
B2M, and
PTPRC (CD45), were elevated in the samples from the MBC patients, suggesting both putative CTCs and white blood cells have a higher capture rate in samples from patients with MBC compared to samples from HVs. In the patients with MBC and HVs, respectively, 21.6% vs. 0% were positive for KRT19, 13.5% vs. 1.0% were positive for
EPCAM, 47.3% vs. 19.6% were positive for ERBB2 (indicating a level of background expression for this gene), 5.4% vs. 1.0% were positive for TWIST1, and none were positive for SNAI2 (
Table 4). Looking at the combined expression of only the KRT19,
EPCAM,
TWIST1, and/or
SNAI2 genes, only 1.0% of the HVs compared to 24.3% of the patients with MBC were positive for one or more of those cancer cell–related genes (Fisher exact test
p < 0.001) (
Table 4).
When compared to the number of CTCs identified using a cytomorphological review of the Wright-Giemsa stained cytology slides, the sum total expression of CTC-related genes (40-Ct of KRT19,
EPCAM,
ERBB2,
TWIST1, and
SNAI2) showed a general correlation with CTC enumeration, particularly at higher CTC burdens (R
2 = 0.3405, Pearson’ rho = 0.569,
p < 0.001, Spearman’s rho [less influenced by outliers] = 0.159,
p = 0.034,
Figure 3b,c). The discrepancy at lower CTC counts may reflect the utility of gene expression when morphology may be hard to distinguish or may reflect differences between parallel blood tubes (e.g., significant loss of harvested cells on the cytology slides due to cytocentrifugation slide preparation method). Furthermore, as seen in
Table 4, only 1 (1.2%) of the 83 HVs with 0 CTCs identified on their cytology slides and none (0%) of the 16 HVs with ≥1 CTC identified on their cytology slides were positive for the combination of
KRT19,
EPCAM,
TWIST1, and/or
SNAI2, in contrast to 8 (25.8%) of the 31 patients with MBC with 0 CTCs identified on their cytology slides and 9 (22.5%) of the 40 patients with MBC with ≥1 CTC identified on their cytology slides (
Table 4). This suggests that the orthogonal measures of morphology and gene expression could help increase detection specificity.
As seen in
Figure 3b, samples enriched from patients with MBC had significantly elevated expression of
EPCAM (Mann–Whitney U
p = 0.016),
ERBB2 (
p = 0.0025),
KRT19 (
p = 0.049), and the mesenchymal cell–related genes SNAI2 (
p < 0.001) and
TWIST1 (
p < 0.001). Interestingly, when no CTCs were detected on the paired cytology slide, there was no difference in
EPCAM or
KRT19 expression between patients with MBC and HVs, but
ERBB2,
SNAI2, and
TWIST1 remained elevated in the patient samples (
Figure S2). Furthermore, samples from patients with MBC had elevated housekeeping control genes
B2M and
GAPDH independent of the detection of CTCs. In contrast, the white blood cell and red blood cell control genes
PTPRC and
GYPA were not elevated (
Figure S2). Together, these results suggest that CTCs with mesenchymal features are less likely to be detected visually (or are more easily lost during the cytocentrifugation slide preparation method) and that adding the molecular characterization aided in their detection.
Comparing samples from patients with newly diagnosed MBC and patients with recurrent or progressive MBC, there were no significant differences in total CTC gene expression (
Figure 4a), in contrast to the stark differences in CTC counts between patients with MBC and HVs. However, compared to the HVs,
EPCAM,
KRT19, and
TWIST1 were significantly higher in patients with progressive/recurrent MBC (but not in newly diagnosed MBC); only
ERBB2 and
SNAI2 were elevated in both patient cohorts (
Figure S3). This may be due to the relatively smaller sample size of patients in the newly diagnosed MBC patient cohort.
Patients with HER2-positive tumor tissue would be expected to have CTCs with elevated expression of
ERBB2 (the gene product for the HER2 protein). However, there was no significant difference in the
ERBB2 expression by enriched CTCs in patients with HER2-positive tumors compared to those with HER2-negative tumors, with the caveat that there were very few patients with HER2-positive MBC disease (40-Ct = 3.87 for patients with HER2-positive tumors vs. 40-Ct = 4.44 for patients with HER2-negative tumors, Wilcoxon signed rank test
p = 0.4, Student’s
t-test
p = 0.5823,
Figure 4b). Likewise, among the patients with MBC with detectable CTCs on their cytology slide, qPCR expression of
ERBB2 was nearly identical between HER2 groups (40-Ct = 4.44 for patients with HER2-positive tumors vs. 40-Ct = 4.53 for patients with HER2-negative tumors, Student’s
t-test
p = 0.936). However, in this study, all of the patients with MBC with HER2-positive tumors had recurring or progressing diseases at the time; none of the patients with HER2-positive tumors were newly diagnosed. Patients with MBC with HER2-negative tumors (who consequently did not receive HER2-targeted therapy) had higher expression of ERBB2 than HVs (
p = 0.0025), whereas MBC patients with HER2-positive tumors did not (
p = 0.63) (
Figure 4b).
Furthermore, only patients with MBC with HER2-negative tumor tissue expressed SNAI2, although this difference was not statistically significant. Eleven patients with MBC with HER2-negative tumors showed expression of
SNAI2 by qPCR, while no patients with MBC with HER2-positive tumors and no HVs showed
SNAI2 expression (Fisher exact test
p = 0.3455); average
SNAI2 expression was higher in the HER2-negative cohort (
Figure 4c). Others have noted that HER2 expression can drive EMT [
41,
42,
43,
44,
45,
46], including EMT in CTCs [
47], and can predict the presence of CTCs [
48]. All the patients with MBC with HER2-positive tumor tissue in the current study were enrolled with progressive and/or recurrent disease.
There were no other significant differences in expression levels of the CTC-related genes between various breast cancer subtypes (estrogen receptor-positive, progesterone receptor positive, HER2-positive, triple-negative). However, some weak trends were observed (
Figure 3c, sorted by CTC count, and
Figure S4, hierarchical clustering by gene expression). High gene expression was generally associated with high CTC counts on the corresponding cytology slide. CTC gene expression in patients with triple-negative breast cancer was dispersed but tended to cluster with higher expression (
Figure S4).
As described above, samples collected via a port had a much higher CTC count by cytology review. However, molecular profiling (
Figure S5) showed only a slight trend for higher expression of CTC genes. Only the white blood cell marker
PTPRC (CD45) was significantly higher in samples from patients with MBC collected via the port. These results suggest that the decrease in CTC counts by cytology review could be partially due to sample quality related to the slide preparation method since the morphology is lost to a greater extent compared to the gene expression.
These results demonstrated that the cells harvested from the peripheral blood of patients with MBC by the Parsortix® PC1 System could be analyzed with a qPCR method to evaluate the expression of genes using standard molecular techniques currently used in many clinical and/or research laboratory settings.
3.4. Combining Gene Expression Results with CTC Counts Reduces Classification Uncertainty
Among the 176 samples evaluated for gene expression and CTC enumeration, there were no HVs that had both >1 observed CTC and expression of any CTC-related genes (excluding ERBB2) below a standard Ct threshold of 35.0. At the same time, 17 patients with MBC met both criteria (
Figure S6, Node 6, far-right). Furthermore, only 15 of the 74 patients with MBC (20.3%) had both no observed CTCs and no expression of any CTC-related genes (
Figure S6, Node 7, far-left). Additionally, 8 (10.6%) patients with MBC that had no CTCs detected by cytology were positive for at least 1 CTC-related gene, suggesting an increased sensitivity due to the inclusion of gene expression compared to the use of CTC counts alone.
3.5. RNA-Sequencing
For unbiased evaluation of gene expression, RNA-seq was performed using cDNA prepared from RNA isolated from the CTC harvests of a subset of HVs and a small number of patients with MBC.
Figure 5a provides the flow chart for the 18 eligible patients with MBC and 59 HVs whose second blood sample was intended to be used for the RNA-seq evaluation. A total of 53 HVs and 16 patients with MBC were evaluable for the analysis. The data contained a significant percentage of genomic DNA or other non-mRNA materials, representing approximately 90% of the sequenced reads. However, there were no significant differences (Student’s
t-test) in the observed transcriptome reads, total reads, or percentage mapped to the transcriptome between the Parsortix
® PC1 System harvests obtained from the HVs and the patients with MBC. There was minimal non-human and ribosomal contamination. To assess the quality of the sequencing, a quality score (Q-score), which is a prediction of the probability of an error in base calling, was used. A high Q-score implies that a base call is more reliable and less likely to be incorrect, where Q = −10 log10 (e). For example, for base calls with a quality score of Q30, one base call in 1000 is predicted to be incorrect. The Q30 values for the sequencing data from the 53 HVs and 16 patients with MBC were all more than 90%, and the coverages (the rate of sequencing reads covering the reference genome cDNA sequence) were of a sufficient level in all samples. The transcriptome mapping results were consistent across all samples, so differential gene expression comparison was possible.
TPM-normalized expression values per gene were generated for all samples. A total of 200 genes were found to be differentially expressed between HVs and patients with MBC with
p < 0.005 (Student’s
t-test), 424 genes were differentially expressed with
p < 0.01, and 2570 genes were differentially expressed with
p < 0.05.
Figure 5b plots the sum of the TPM values from each sample for the differentially expressed genes between the HVs and patients with MBC with individual
p-values of <0.001. The two groups are well differentiated by this set of genes, with a
p-value of <0.0001 (Student’s
t-test).
The expression of genes in the harvests from the Parsortix
® PC1 System known to be associated with the KEGG Pathways in cancer (
https://www.kegg.jp, accessed on 20 October 2022) was examined for differential expression between the HVs and patients with MBC.
Figure 5c lists the genes in the KEGG cancer pathways set that were determined to be differentially expressed between the HVs and patients with MBC with
p-values of <0.05 (Student’s
t-test). For illustrative purposes, a simple combination of the TPM values for these genes (net TPM score equals the sum of TPM for upregulated genes minus the sum of TPM values for downregulated genes) was calculated for each sample.
Figure 5d illustrates the net TPM values derived from the 20 KEGG cancer pathway genes with
p-values of <0.05 (Student’s
t-test) for each of the HV and MBC samples. Significant discrimination was observed between the groups (Student’s
t-test
p < 0.0001). Since cancer signaling pathways were significantly enriched in the samples from the MBC patients compared to those from the HVs, this result suggests that the population of cells captured and harvested from the peripheral blood of patients with MBC processed by the Parsortix
® PC1 System does contain cancer cells.
Further examples are illustrated in
Figures S7–S9, where harvests from various subgroups of patients with MBC are compared. Genes from the KEGG cancer pathway list were examined for differential expression between the identified groups. A net TPM score was generated for each sample using the genes that exhibited individual
p-values of <0.05.
Figure S7 lists the relevant genes and illustrates discrimination based on grouping patients by tissue HER2 status.
Figure S8 provides a list of genes that appear to be associated with metastases to the lymph nodes.
Figure S9 identifies a different gene expression profile potentially reflecting the presence of bone metastases.
The RNA-seq data confirm that the cells harvested by the Parsortix® PC1 System from the peripheral blood of patients with MBC (and HVs) can be used to generate RNA-seq data that directly reflect cancer-associated gene expression patterns. This was demonstrated despite contaminating genomic DNA, illustrating the further potential to be realized with alternative RNA-seq sample preparation protocols.
3.6. HER2 FISH
HER2 is an important diagnostic component of breast cancer management and is typically evaluable at the single-cell level. Therefore, one of our exploratory evaluations involved interrogating the HER2 amplification status in the population of cells harvested from a subset of the HVs and patients with MBC using the Parsortix® PC1 System.
Figure 6a provides the flow chart for the 40 eligible HVs and 112 patients with MBC, collected at The MD Anderson Cancer Center, University of Rochester Medical Center, and Northwestern University, whose second blood sample was intended to be used for the HER2 FISH evaluation. A total of 38 (95.0%) of the 40 eligible HVs and 101 (90.2%) of the 112 eligible patients with MBC had evaluable HER2 FISH-stained cytology slides; 5 (13.2%) of the 38 evaluable HVs and 28 (27.7%) of the 101 evaluable patients with MBC had one or more CTCs identified on their HER2 FISH-stained cytology slides (
Table S2).
Figure 6b provides example images of the CTCs identified on the HER2 FISH slides of patients with MBC, including the single CTC from a newly diagnosed patient with HER2-positive MBC that demonstrated HER2 amplification. The single sample showing HER2 amplification represents 33.3% of the patients with MBC who had HER2-positive disease and had CTCs identified on their HER2 FISH slides (
Table 5). Approximately 83% of the patients with MBC had estrogen receptor–positive and/or progesterone receptor–positive disease, and only 9.9% had HER2-positive breast cancer, which is lower than the proportion generally described in the literature (~20%). Therefore, although a reasonable number of samples were tested for HER2 status by FISH, only a minimal number were expected to have HER2 amplification. It should be noted that a strict definition of HER2 FISH positivity was used for this study, permitting resolution of all CTCs into either “HER2-amplified” or “HER2-not-amplified” status, as described previously in large cohorts of breast cancer patients and patients screened for entry to large clinical trials [
31,
32,
33].
These results demonstrated that the Parsortix® PC1 System can capture and harvest CTCs from the peripheral blood of patients with MBC and that the population of cells harvested can be effectively evaluated using a commercially available HER2 FISH assay and reagents.
4. Study Limitations
The open platform of the Parsortix system allows for multiple downstream analyses. However, this openness may limit immediate introduction to clinical environments as it requires additional technology, personnel, and equipment out of the box. It was difficult to comprehensively demonstrate all potential downstream evaluation methods that a user could employ to evaluate the cells harvested by the Parsortix® PC1 System from the peripheral blood of patients with MBC. In this study, we focused on cytology evaluation, qPCR, FISH, and RNA-seq as examples of downstream analysis methods. These four methods cover a range of cytology and molecular techniques currently used in clinical laboratories and many FDA-cleared tests, including protein, RNA, and DNA analysis techniques.
We recognize that the study is limited by a lack of additional alternative downstream analyses, such as interrogation for mutations. Still, the study design and amount of testing that could be done for each subject were limited by the volume of blood that we could safely and ethically draw from the patients with MBC. In addition, the cytology evaluation method used to identify CTCs was based solely on morphological characteristics and, therefore, more subjective than an immunofluorescence staining assay. Additionally, the slide preparation method for the cytology and FISH analyses proved to have a high cell loss, with 37–51% of the harvested cells not being deposited on the slides. This most likely resulted in underestimation of the number of CTCs in the blood samples. However, a correction factor would not be practical for the high number of samples with no CTCs observed, as the cell loss caused by the cytology slide preparation method was highly variable. However, we used cytocentrifugation (also known as cytospin) because it is a routine procedure performed in pathology laboratory practice and readily available to most laboratories. In addition to the cell loss caused by the cytology slide preparation method, the degree of subjectivity around the cytomorphological interpretation/identification of CTCs is another study limitation. CTC-specific markers (such as pan-cytokeratin), in addition to the Wright-Giemsa staining, to assess the phenotype of the atypical, non-normal, and malignant cells identified on the CTC slides may have provided additional evidence that the malignant cells indeed were CTCs. However, the morphological scoring of CTCs has more clinical value and avoids the use of potentially poor-performing antibodies. Future efforts to establish diagnostic criteria for morphologic CTC evaluation are needed in conjunction with broader adoption of the Parsortix® PC1 System in clinical practice.
The study specified that a minimum volume of blood needed to be available (≥5 mL) for the processing of each sample instead of specifying that an exact volume of blood be used for each sample (e.g., 7.5 mL or 8 mL). However, the use of varying volumes of blood for each sample makes it impossible to directly compare results between samples that used different volumes of blood. Furthermore, there is known variability in the numbers of cells present between different tubes of blood taken from the same patient (tube-to-tube variability).
No FDA-cleared orthogonal method was tested to demonstrate the equivalency of the Parsortix® PC1 System for the capture and harvest of CTCs. The FDA-cleared CELLSEARCH® System was not deemed suitable for inclusion as a reference method because its technological operating characteristics are fundamentally different. The CELLSEARCH® System enriches CTCs based on immunoaffinity to EpCAM, magnetically immobilizes the cells inside a visualization chamber, stains the captured cells with DAPI and anti-EpCAM and anti-CD45 antibodies, captures fluorescent images of the stained cells, and presents the digitized images to a user for identification of CTCs. In contrast, the Parsortix® PC1 System uses microfluidics to enrich cells based on their size and deformability, and it allows the cells captured by the microfluidic device to be harvested into a small buffer volume for further evaluation. The Parsortix PC1 System may have an advantage over the CELL-SEARCH System in detecting mesenchymal CTCs, but CTCs can be epithelial, mesenchymal, or hybrid. Furthermore, the clinical significance of the amount and type of CTC on therapeutic efficacy in MBC as well as primary breast cancer is still unknown. It remains to be seen how the CTCs detected in the current study will affect the clinical outcome of MBC patients.
Follow-up studies will be required to demonstrate the clinical utility of CTC enrichment in patients with MBC using the Parsortix® PC1 System in combination with analytically validated subsequent downstream analysis methods for molecular characteristics. This study was designed only to test the enrichment platform, and thus, the samples obtained were de-identified, and no follow-up clinical data was collected.
Overall, the results of this study showed that the population of cells harvested by the Parsortix® PC1 System from the peripheral blood of patients with MBC could be evaluated using currently available laboratory methods for the identification and characterization of CTCs. As CTCs are obtained from peripheral blood (i.e., a liquid biopsy), additional samples can easily be obtained with minimal impact if there is a processing error and/or no CTCs are present in the population of cells harvested or if additional blood volume is deemed necessary to meet downstream assay performance requirements.
5. Conclusions
The HOMING Study “Harvest of CTCs from Patients with MBC using the Parsortix
® System” was a multi-center, prospective, blinded study that enrolled over 200 evaluable healthy volunteers and 200 patients with MBC at four US-based clinical sites to demonstrate the ability of the system to enrich CTC for subsequent downstream analysis. The data here showed that cells harvested from the peripheral blood of the eligible HVs and patients with MBC using the Parsortix
® PC1 System can be successfully evaluated using cytology (i.e., Wright-Giemsa staining), qRT-PCR, RNA-sequencing, and FISH. The data generated from this study were used to support a De Novo request for classification of the Parsortix
® PC1 system (DEN200062) as a Class II prescription device that was granted by the FDA on 24 May 2022 (
https://www.accessdata.fda.gov/cdrh_docs/pdf20/DEN200062.pdf, accessed on 20 October 2022).
Supplementary Materials
The following supporting information can be downloaded at:
https://www.mdpi.com/article/10.3390/cancers14215238/s1, Figure S1: Comparison of linearity, Figure S2: Gene expression in samples with and without detected CTCs in corresponding cytology slides, Figure S3: CTC-related gene expression in newly diagnosed and recurrent/progressive metastatic breast cancer (MBC), Figure S4: CTC count and CTC-related gene expression hierarchical clustering, Figure S5: Trend for higher CTC-related gene expression from samples collected from a port, Figure S6: Decision Tree, Figure S7: Genes from the KEGG Cancer for HER Primary Tumors, Figure S8: Genes from the KEGG Cancer for LN Positive MBC, Figure S9: Genes from the KEGG Cancer for Bone Metastasis MBC, Table S1: Proportions of healthy volunteers and MBC patients with positive gene expression, Table S2: Summary of CTC counts on HER2.
Author Contributions
Conceptualization, E.N.C., G.J., R.G.M., M.C., J.E.L., J.D.K., M.F.P., M.C.M., J.M.R. and N.T.U.; methodology, E.N.C., G.J., J.E.L., J.D.K., M.F.P., M.C.M. and J.M.R.; formal analysis, E.N.C., G.J., J.D.K., M.C.M. and J.M.R.; investigation, R.G.M., M.C., J.E.L., J.D.K., M.F.P. and N.T.U.; data curation, J.D.K., M.F.P., K.K.K., N.K., Q.Z., Y.Z., P.K., R.G. and M.C.M.; writing—original draft preparation, E.N.C., G.J., M.C.M. and J.M.R.; writing—review and editing, E.N.C., G.J., R.G.M., M.C., J.E.L., J.D.K., M.F.P., M.C.M., J.M.R. and N.T.U.; project administration, M.C.M. All authors have read and agreed to the published version of the manuscript.
Funding
This study was supported by ANGLE Europe Limited. M.F. Press was supported by grants from the Breast Cancer Research Program (BCRF-20, 21, 22-132), Tower Cancer Research Program (Grant Number 006886-0001), Miriam and Sheldon G. Adelson Medical Research Program, and a gift from Richard Balch.
Institutional Review Board Statement
Study ANG-002 was conducted in accordance with the Declaration of Helsinki, and approved by the Institutional Review Board of The University of Texas MD Anderson Cancer Center (PA17-1047 approved November 28, 2017) and the Institutional Review Board (IRB) or Independent Ethics Committee (IEC) for each of the 4 participating sites (full list can be found at
https://clinicaltrials.gov/ct2/show/NCT03427450, accessed 20 October 2022).
Informed Consent Statement
Informed consent was obtained from all subjects involved in the study.
Data Availability Statement
The data can be shared up on request.
Acknowledgments
The authors would like to acknowledge and thank all of the women who participated in the clinical study and provided their clinical samples, as well as the following individuals at each of the clinical study sites for their contributions to the conduct of the study, processing of the clinical samples, and evaluation of the results: MD Anderson Cancer Center (Houston, TX): Sausan Abouharb, Angela Alexander, Heather B McBride, Franklin D Alvarez, Carlos Barcenas, Daniel Booser, Mariana Chavez MacGregor, Senthil Damodaran, Min Fu, Nuhad Ibrahim, Kai Megumi, Meghan Karuturi, Kimberly Koenig, Rachel Layman, Bora Lim, Jennifer Litton, Angela Marx, Rashmi Murthy, Charla Parker, Phillip R Peabody, David Ramirez, LaToya Samuel, Maryanne E Sapon, Huiming Sun, Parijatham Thomas, Debasish Tripathy, Vincent Valero, Jie Willey, Anita Woods; University of Rochester Cancer Center (Rochester, NY): Erin Bodekor, Robin Boerman, Erika Bronk, Erica Burgeson, Jennifer Cocking, Kathryn Corcoran, Lauren Curran, Ajay Dhakal, Jacqueline Doucette, Laura Eckert-Davis, Ashley Essom, Rachel Farkas, Kristina Galton, Jessica Gooch, Holly Greiner, Amy Hayes, Alissa Huston, Amber Johnson, Dina Johnson, Barbara Kavinsky, Anne Keefer, Jennifer Knaak, Susan Koomen, Jacqueline Lenhard, Peter MacDowell, Allison Magnuson, Chelsea Marsh, Philip J Meacham, Michelle Miller, Laura Mitchell, Ildiko Nagy, Farishta Nezomuddin, Anne Olzinksi-Kunze, Stasia Ortu, Kelvin Peek, Peter Prieto, Christine Quinn, Crystal Regis, Amy Rovitelli, Mary Sears, Michelle Shayne, Umayal Sivagnanalingam, Kristin Skinner, Sarah Strause, Deborah Street, Cody Tallett, Brian Yirinec; University of Southern California (Los Angeles, CA): Richa Aggarwal, Sibley Bardales, Daniel Campo, Amab Basu, Margie Carranza, America Casillas-Lopez, Yvonne Chairez, Victor Chiu, Aniska D’Souza, Simon Davenport, Grace Facio, Lilia Frausto, Umair Ghani, John Greco, Erwin Grussie, John Y Hu, Irene Kang, Jasleen Khanuja, Nara Lee, Grace Li, Ming Li, Janice Lu, Yi-Tsung Lu, Aaron Mejia, Gangothri Namasivayam, Maria Nelson, Caitlin O’Neill, Ravi Patel, Tania Porras, Nathan Punwani, Lusine Raddatz, Pauline Reonisto, Shirley Sain, Naomi Schechter, Stephen Sener, Anson Snow, Jacob Thomas, Varsha Tulpule, Rebecca Umayam, Ivonne Villalobos Press, Kristy Watkins, Kristopher Wentzel, Bin Xie, Yue Zhu; Northwestern University (Chicago, IL): Madonna Breganio, Sarah Craig, Rebecca Curry-Edwards, Tara Dedic, Carmen Diaz, Lisa Flaum, William Gradishar, Leeaht Gross, Levon Guzman, Katy Kerby, Kelly Kindy, Marissa Malaret, Ellen Malone, Adrianna Rodriguez, Ami Shah, Marian Tentler, Regina Uthe, Amy Youngkin; ANGLE Europe Limited (Study Sponsor): Khalil Al-bacha Hjazi, Martin Cooke, Andrew Newland, Anne-Sophie Pailhes-Jimenez, Peggy Robinson, Paul Smith, Amy Templeman, Christopher Wagner. The manuscript was edited by Sarah Bronson, ELS, of the Research Medical Library in The University of Texas MD Anderson Cancer Center.
Conflicts of Interest
The authors ENC, GJ, KKK, NK, QZ, YZ, PK and RG declare no conflict of interest. RGM reports consulting fees from Fujirebio Diagnostics; MC reports AstraZeneca (Consulting Fees (e.g., advisory boards), Contracted Research) Celcuity (Consulting Fees (e.g., advisory boards)) Eli Lilly (Consulting Fees (e.g., advisory boards), Contracted Research, Fees for Non-CMEServices Received Directly from Commercial Interest or their Agents (e.g., speakers’ bureaus)) Ellipses (Consulting Fees (e.g., advisory boards)) Foundation Medicine (Fees for Non-CME Services Received Directly from Commercial Interest or their Agents (e.g., speakers’ bureaus)) Guardant (Fees for Non-CME Services Received Directly from Commercial Interest or their Agents (e.g., speakers’ bureaus)) Menarini (Consulting Fees (e.g., advisory boards)) Olaris (Consulting Fees (e.g., advisory boards)) Pfizer (Contracted Research, Fees for Non-CME Services Received Directly from Commercial Interest or their Agents (e.g., speakers’ bureaus)) Semonix (Consulting Fees (e.g., advisory boards)); JEL reports grant from ANGLE (Contracted Research); JDK reports Angle, plc (Consulting Fees (e.g., advisory boards), Contracted Research); MFP reports AstraZeneca (Consulting Fees (e.g., advisory boards)) Biocartis SA (Consulting Fees (e.g., advisory boards)) CEPHEID (Consulting Fees (e.g., advisory boards)) Eli Lilly & Company (Consulting Fees (e.g., advisory boards)) Lilly USA, LLC (Consulting Fees (e.g., advisory boards)) Merck & Co. (Consulting Fees (e.g., advisory boards)) Puma Biotechnology (Consulting Fees (e.g., advisory boards)) TORL BIOTHERAPEUTICS LLC (Ownership Interest (stocks, stock options, patent or other intellectual property or other ownership interest excluding diversified mutual funds)) Zymeworks Inc. (Consulting Fees (e.g., advisory boards)); MCM reports ANGLE plc (Full-time employee, Ownership Interest (stocks, stock options, patent or other intellectual property or other ownership interest excluding diversified mutual funds)); JMR reports Angle plc (Consulting Fees (e.g., advisory boards), Contracted Research); NTU reports Angle plc (Contracted Research) AnHeart Therapeutics Inc. (Consulting Fees (e.g., advisory boards)) AstraZeneca Pharmaceutical (Consulting Fees (e.g., advisory boards)) Carisma Therapeutics, Inc. (Consulting Fees (e.g., advisory boards), Contracted Research) CARNA Biosciences, Inc. (Consulting Fees (e.g., advisory boards)) ChemDiv, Inc. (Consulting Fees (e.g., advisory boards), Contracted Research) Chugai Pharmaceutical (Consulting Fees (e.g., advisory boards)) Daiichi Sankyo, Inc. (Consulting Fees (e.g., advisory boards), Contracted Research) DualityBio (Consulting Fees (e.g., advisory boards), Contracted Research) DynaMed (Consulting Fees (e.g., advisory boards)) Eisai Medical Research Inc (Consulting Fees (e.g., advisory boards), Contracted Research) Epic Science (Contracted Research) Gilead Sciences, Inc. (Consulting Fees (e.g., advisory boards), Contracted Research) Kechow Pharma (Consulting Fees (e.g., advisory boards)) Kirilys Therapeutics, Inc. (Consulting Fees (e.g., advisory boards)) Kyowa Hakko Kirin Co., Ltd. (Speaker) LARVOL (Consulting Fees (e.g., advisory boards)) Merck Co. (Contracted Research) OBI Pharma Inc. (Contracted Research) OncoCyte Co. (Consulting Fees (e.g., advisory boards)) Oncolys BioPharma Inc. (Contracted Research) Ourotech, Inc., DBA Pear Bio (Royalty) Peptilogics, Inc. (Consulting Fees (e.g., advisory boards)) Pfizer Inc. (Consulting Fees (e.g., advisory boards), Contracted Research) Phoenix Molecular Designs (Consulting Fees (e.g., advisory boards)) Preferred Medicine, Inc. (Consulting Fees (e.g., advisory boards), Contracted Research) Rakuten Medical, Inc. (Consulting Fees (e.g., advisory boards)) Sumitomo Dainippon Pharma, Inc. (Contracted Research) Sysmex Co. Ltd. (Consulting Fees (e.g., advisory boards)) Takeda Pharmaceuticals, Ltd. (Consulting Fees (e.g., advisory boards)) Unitech Medical, Inc. (Consulting Fees (e.g., advisory boards)). MCM, a full-time employee of ANGLE North America, Inc., a subsidiary of ANGLE plc, and was involved in the design of the study, the analysis and interpretation of the data, the decision to publish the results, and in the writing of the manuscript. The information and results reported in the manuscript, as well as their interpretations, are based on generally accepted scientific principals and methods and as such were not inappropriately influenced by the commercial interest of the funder (ANGLE Europe Limited).
References
- Hong, B.; Zu, Y. Detecting circulating tumor cells: Current challenges and new trends. Theranostics 2013, 3, 377–394. [Google Scholar] [CrossRef] [PubMed] [Green Version]
- Cristofanilli, M.; Hayes, D.F.; Budd, G.T.; Ellis, M.J.; Stopeck, A.; Reuben, J.M.; Doyle, G.V.; Matera, J.; Allard, W.J.; Miller, M.C.; et al. Circulating tumor cells: A novel prognostic factor for newly diagnosed metastatic breast cancer. J. Clin. Oncol. 2005, 23, 1420–1430. [Google Scholar] [CrossRef] [PubMed]
- Dawood, S.; Broglio, K.; Valero, V.; Reuben, J.; Handy, B.; Islam, R.; Jackson, S.; Hortobagyi, G.N.; Fritsche, H.; Cristofanilli, M. Circulating tumor cells in metastatic breast cancer: From prognostic stratification to modification of the staging system? Cancer 2008, 113, 2422–2430. [Google Scholar] [CrossRef] [PubMed]
- Hayes, D.F.; Cristofanilli, M.; Budd, G.T.; Ellis, M.J.; Stopeck, A.; Miller, M.C.; Matera, J.; Allard, W.J.; Doyle, G.V.; Terstappen, L.W. Circulating tumor cells at each follow-up time point during therapy of metastatic breast cancer patients predict progression-free and overall survival. Clin. Cancer Res. 2006, 12, 4218–4224. [Google Scholar] [CrossRef] [PubMed] [Green Version]
- Budd, G.T.; Cristofanilli, M.; Ellis, M.J.; Stopeck, A.; Borden, E.; Miller, M.C.; Matera, J.; Repollet, M.; Doyle, G.V.; Terstappen, L.W.; et al. Circulating tumor cells versus imaging--predicting overall survival in metastatic breast cancer. Clin. Cancer Res. 2006, 12, 6403–6409. [Google Scholar] [CrossRef] [PubMed] [Green Version]
- Liu, M.C.; Shields, P.G.; Warren, R.D.; Cohen, P.; Wilkinson, M.; Ottaviano, Y.L.; Rao, S.B.; Eng-Wong, J.; Seillier-Moiseiwitsch, F.; Noone, A.M.; et al. Circulating tumor cells: A useful predictor of treatment efficacy in metastatic breast cancer. J. Clin. Oncol. 2009, 27, 5153–5159. [Google Scholar] [CrossRef] [PubMed] [Green Version]
- Hayes, D.F.; Smerage, J. Is there a role for circulating tumor cells in the management of breast cancer? Clin. Cancer Res. 2008, 14, 3646–3650. [Google Scholar] [CrossRef] [PubMed] [Green Version]
- Pantel, K.; Alix-Panabieres, C. Real-time liquid biopsy in cancer patients: Fact or fiction? Cancer Res. 2013, 73, 6384–6388. [Google Scholar] [CrossRef] [PubMed] [Green Version]
- Alunni-Fabbroni, M.; Sandri, M.T. Circulating tumour cells in clinical practice: Methods of detection and possible characterization. Methods 2010, 50, 289–297. [Google Scholar] [CrossRef] [PubMed]
- Allard, W.J.; Matera, J.; Miller, M.C.; Repollet, M.; Connelly, M.C.; Rao, C.; Tibbe, A.G.; Uhr, J.W.; Terstappen, L.W. Tumor cells circulate in the peripheral blood of all major carcinomas but not in healthy subjects or patients with nonmalignant diseases. Clin. Cancer Res. 2004, 10, 6897–6904. [Google Scholar] [CrossRef] [PubMed]
- Cristofanilli, M.; Budd, G.T.; Ellis, M.J.; Stopeck, A.; Matera, J.; Miller, M.C.; Reuben, J.M.; Doyle, G.V.; Allard, W.J.; Terstappen, L.W.; et al. Circulating tumor cells, disease progression, and survival in metastatic breast cancer. N. Engl. J. Med. 2004, 351, 781–791. [Google Scholar] [CrossRef] [PubMed] [Green Version]
- Zhang, Z.; Wuethrich, A.; Wang, J.; Korbie, D.; Lin, L.L.; Trau, M. Dynamic Monitoring of EMT in CTCs as an Indicator of Cancer Metastasis. Anal. Chem. 2021, 93, 16787–16795. [Google Scholar] [CrossRef] [PubMed]
- Sankpal, N.V.; Fleming, T.P.; Sharma, P.K.; Wiedner, H.J.; Gillanders, W.E. A double-negative feedback loop between EpCAM and ERK contributes to the regulation of epithelial-mesenchymal transition in cancer. Oncogene 2017, 36, 3706–3717. [Google Scholar] [CrossRef] [PubMed] [Green Version]
- Yang, J.; Mani, S.A.; Donaher, J.L.; Ramaswamy, S.; Itzykson, R.A.; Come, C.; Savagner, P.; Gitelman, I.; Richardson, A.; Weinberg, R.A. Twist, a master regulator of morphogenesis, plays an essential role in tumor metastasis. Cell 2004, 117, 927–939. [Google Scholar] [CrossRef] [PubMed] [Green Version]
- Mani, S.A.; Guo, W.; Liao, M.J.; Eaton, E.N.; Ayyanan, A.; Zhou, A.Y.; Brooks, M.; Reinhard, F.; Zhang, C.C.; Shipitsin, M.; et al. The epithelial-mesenchymal transition generates cells with properties of stem cells. Cell 2008, 133, 704–715. [Google Scholar] [CrossRef] [PubMed] [Green Version]
- Hollier, B.G.; Evans, K.; Mani, S.A. The epithelial-to-mesenchymal transition and cancer stem cells: A coalition against cancer therapies. J. Mammary Gland. Biol. Neoplasia 2009, 14, 29–43. [Google Scholar] [CrossRef] [PubMed]
- Chudziak, J.; Burt, D.J.; Mohan, S.; Rothwell, D.G.; Mesquita, B.; Antonello, J.; Dalby, S.; Ayub, M.; Priest, L.; Carter, L.; et al. Clinical evaluation of a novel microfluidic device for epitope-independent enrichment of circulating tumour cells in patients with small cell lung cancer. Analyst 2016, 141, 669–678. [Google Scholar] [CrossRef] [PubMed]
- Yap, K.; Cohen, E.N.; Reuben, J.M.; Khoury, J.D. Circulating Tumor Cells: State-of-the-art Update on Technologies and Clinical Applications. Curr. Hematol. Malig. Rep. 2019, 14, 353–357. [Google Scholar] [CrossRef] [PubMed]
- Hvichia, G.E.; Parveen, Z.; Wagner, C.; Janning, M.; Quidde, J.; Stein, A.; Muller, V.; Loges, S.; Neves, R.P.; Stoecklein, N.H.; et al. A novel microfluidic platform for size and deformability based separation and the subsequent molecular characterization of viable circulating tumor cells. Int. J. Cancer 2016, 138, 2894–2904. [Google Scholar] [CrossRef] [PubMed]
- Lampignano, R.; Yang, L.; Neumann, M.H.D.; Franken, A.; Fehm, T.; Niederacher, D.; Neubauer, H. A Novel Workflow to Enrich and Isolate Patient-Matched EpCAM(high) and EpCAM(low/negative) CTCs Enables the Comparative Characterization of the PIK3CA Status in Metastatic Breast Cancer. Int. J. Mol. Sci. 2017, 18, 1885. [Google Scholar] [CrossRef] [PubMed]
- Miller, M.C.; Robinson, P.S.; Wagner, C.; O’Shannessy, D.J. The Parsortix Cell Separation System-A versatile liquid biopsy platform. Cytom. Part A 2018, 93, 1234–1239. [Google Scholar] [CrossRef] [PubMed]
- Gorges, T.M.; Kuske, A.; Rock, K.; Mauermann, O.; Muller, V.; Peine, S.; Verpoort, K.; Novosadova, V.; Kubista, M.; Riethdorf, S.; et al. Accession of Tumor Heterogeneity by Multiplex Transcriptome Profiling of Single Circulating Tumor Cells. Clin. Chem. 2016, 62, 1504–1515. [Google Scholar] [CrossRef] [PubMed] [Green Version]
- Xu, L.; Mao, X.; Guo, T.; Chan, P.Y.; Shaw, G.; Hines, J.; Stankiewicz, E.; Wang, Y.; Oliver, R.T.D.; Ahmad, A.S.; et al. The Novel Association of Circulating Tumor Cells and Circulating Megakaryocytes with Prostate Cancer Prognosis. Clin. Cancer Res. 2017, 23, 5112–5122. [Google Scholar] [CrossRef] [PubMed] [Green Version]
- Maertens, Y.; Humberg, V.; Erlmeier, F.; Steffens, S.; Steinestel, J.; Bogemann, M.; Schrader, A.J.; Bernemann, C. Comparison of isolation platforms for detection of circulating renal cell carcinoma cells. Oncotarget 2017, 8, 87710–87717. [Google Scholar] [CrossRef] [PubMed] [Green Version]
- Obermayr, E.; Maritschnegg, E.; Agreiter, C.; Pecha, N.; Speiser, P.; Helmy-Bader, S.; Danzinger, S.; Krainer, M.; Singer, C.; Zeillinger, R. Efficient leukocyte depletion by a novel microfluidic platform enables the molecular detection and characterization of circulating tumor cells. Oncotarget 2018, 9, 812–823. [Google Scholar] [CrossRef] [PubMed] [Green Version]
- Harris, P.A.; Taylor, R.; Thielke, R.; Payne, J.; Gonzalez, N.; Conde, J.G. Research electronic data capture (REDCap)—A metadata-driven methodology and workflow process for providing translational research informatics support. J. Biomed. Inform. 2009, 42, 377–381. [Google Scholar] [CrossRef] [PubMed] [Green Version]
- Harris, P.A.; Taylor, R.; Minor, B.L.; Elliott, V.; Fernandez, M.; O’Neal, L.; McLeod, L.; Delacqua, G.; Delacqua, F.; Kirby, J.; et al. The REDCap consortium: Building an international community of software platform partners. J. Biomed. Inform. 2019, 95, 103208. [Google Scholar] [CrossRef] [PubMed]
- Lang, J.E.; Ring, A.; Porras, T.; Kaur, P.; Forte, V.A.; Mineyev, N.; Tripathy, D.; Press, M.F.; Campo, D. RNA-Seq of Circulating Tumor Cells in Stage II-III Breast Cancer. Ann. Surg. Oncol. 2018, 25, 2261–2270. [Google Scholar] [CrossRef] [PubMed] [Green Version]
- Kaur, P.; Campo, D.; Porras, T.B.; Ring, A.; Lu, J.; Chairez, Y.; Su, Y.; Kang, I.; Lang, J.E. A Pilot Study for the Feasibility of Exome-Sequencing in Circulating Tumor Cells Versus Single Metastatic Biopsies in Breast Cancer. Int. J. Mol. Sci. 2020, 21, 4826. [Google Scholar] [CrossRef] [PubMed]
- Patro, R.; Duggal, G.; Love, M.I.; Irizarry, R.A.; Kingsford, C. Salmon provides fast and bias-aware quantification of transcript expression. Nat. Methods 2017, 14, 417–419. [Google Scholar] [CrossRef] [PubMed]
- Press, M.F.; Villalobos, I.; Santiago, A.; Guzman, R.; Cervantes, M.; Gasparyan, A.; Campeau, A.; Ma, Y.; Tsao-Wei, D.D.; Groshen, S. Assessing the New American Society of Clinical Oncology/College of American Pathologists Guidelines for HER2 Testing by Fluorescence In Situ Hybridization: Experience of an Academic Consultation Practice. Arch. Pathol. Lab. Med. 2016, 140, 1250–1258. [Google Scholar] [CrossRef] [PubMed] [Green Version]
- Press, M.F.; Sauter, G.; Buyse, M.; Fourmanoir, H.; Quinaux, E.; Tsao-Wei, D.D.; Eiermann, W.; Robert, N.; Pienkowski, T.; Crown, J.; et al. HER2 Gene Amplification Testing by Fluorescent In Situ Hybridization (FISH): Comparison of the ASCO-College of American Pathologists Guidelines With FISH Scores Used for Enrollment in Breast Cancer International Research Group Clinical Trials. J. Clin. Oncol. 2016, 34, 3518–3528. [Google Scholar] [CrossRef] [PubMed]
- Press, M.F.; Seoane, J.A.; Curtis, C.; Quinaux, E.; Guzman, R.; Sauter, G.; Eiermann, W.; Mackey, J.R.; Robert, N.; Pienkowski, T.; et al. Assessment of ERBB2/HER2 Status in HER2-Equivocal Breast Cancers by FISH and 2013/2014 ASCO-CAP Guidelines. JAMA Oncol. 2019, 5, 366–375. [Google Scholar] [CrossRef] [PubMed] [Green Version]
- Press, M.F.; Sauter, G.; Buyse, M.; Bernstein, L.; Guzman, R.; Santiago, A.; Villalobos, I.E.; Eiermann, W.; Pienkowski, T.; Martin, M.; et al. Alteration of topoisomerase II-alpha gene in human breast cancer: Association with responsiveness to anthracycline-based chemotherapy. J. Clin. Oncol. 2011, 29, 859–867. [Google Scholar] [CrossRef] [PubMed] [Green Version]
- Howlader, N.; Altekruse, S.F.; Li, C.I.; Chen, V.W.; Clarke, C.A.; Ries, L.A.; Cronin, K.A. US incidence of breast cancer subtypes defined by joint hormone receptor and HER2 status. J. Natl. Cancer Inst. 2014, 106. [Google Scholar] [CrossRef] [PubMed] [Green Version]
- Bidard, F.C.; Peeters, D.J.; Fehm, T.; Nole, F.; Gisbert-Criado, R.; Mavroudis, D.; Grisanti, S.; Generali, D.; Garcia-Saenz, J.A.; Stebbing, J.; et al. Clinical validity of circulating tumour cells in patients with metastatic breast cancer: A pooled analysis of individual patient data. Lancet Oncol. 2014, 15, 406–414. [Google Scholar] [CrossRef] [PubMed]
- Sun, Y.F.; Guo, W.; Xu, Y.; Shi, Y.H.; Gong, Z.J.; Ji, Y.; Du, M.; Zhang, X.; Hu, B.; Huang, A.; et al. Circulating Tumor Cells from Different Vascular Sites Exhibit Spatial Heterogeneity in Epithelial and Mesenchymal Composition and Distinct Clinical Significance in Hepatocellular Carcinoma. Clin. Cancer Res. 2018, 24, 547–559. [Google Scholar] [CrossRef] [PubMed] [Green Version]
- Terai, M.; Mu, Z.; Eschelman, D.J.; Gonsalves, C.F.; Kageyama, K.; Chervoneva, I.; Orloff, M.; Weight, R.; Mastrangelo, M.J.; Cristofanilli, M.; et al. Arterial Blood, Rather Than Venous Blood, is a Better Source for Circulating Melanoma Cells. EBioMedicine 2015, 2, 1821–1826. [Google Scholar] [CrossRef] [PubMed] [Green Version]
- Jesenko, T.; Modic, Z.; Kuhar, C.G.; Cemazar, M.; Matkovic, U.; Miceska, S.; Varl, J.; Kuhar, A.; Kloboves-Prevodnik, V. Morphological features of breast cancer circulating tumor cells in blood after physical and biological type of isolation. Radiol. Oncol. 2021, 55, 292–304. [Google Scholar] [CrossRef] [PubMed]
- Cohen, E.N.; Jayachandran, G.; Hardy, M.R.; Venkata Subramanian, A.M.; Meng, X.; Reuben, J.M. Antigen-agnostic microfluidics-based circulating tumor cell enrichment and downstream molecular characterization. PLoS ONE 2020, 15, e0241123. [Google Scholar] [CrossRef] [PubMed]
- Ingthorsson, S.; Andersen, K.; Hilmarsdottir, B.; Maelandsmo, G.M.; Magnusson, M.K.; Gudjonsson, T. HER2 induced EMT and tumorigenicity in breast epithelial progenitor cells is inhibited by coexpression of EGFR. Oncogene 2016, 35, 4244–4255. [Google Scholar] [CrossRef] [PubMed] [Green Version]
- Gupta, P.; Srivastava, S.K. HER2 mediated de novo production of TGFbeta leads to SNAIL driven epithelial-to-mesenchymal transition and metastasis of breast cancer. Mol. Oncol. 2014, 8, 1532–1547. [Google Scholar] [CrossRef] [PubMed]
- Jenndahl, L.E.; Isakson, P.; Baeckstrom, D. c-erbB2-induced epithelial-mesenchymal transition in mammary epithelial cells is suppressed by cell-cell contact and initiated prior to E-cadherin downregulation. Int. J. Oncol. 2005, 27, 439–448. [Google Scholar] [CrossRef] [PubMed]
- D’Souza, B.; Berdichevsky, F.; Kyprianou, N.; Taylor-Papadimitriou, J. Collagen-induced morphogenesis and expression of the alpha 2-integrin subunit is inhibited in c-erbB2-transfected human mammary epithelial cells. Oncogene 1993, 8, 1797–1806. [Google Scholar] [PubMed]
- D’Souza, B.; Taylor-Papadimitriou, J. Overexpression of ERBB2 in human mammary epithelial cells signals inhibition of transcription of the E-cadherin gene. Proc. Natl. Acad. Sci. USA 1994, 91, 7202–7206. [Google Scholar] [CrossRef] [PubMed] [Green Version]
- Khoury, H.; Dankort, D.L.; Sadekova, S.; Naujokas, M.A.; Muller, W.J.; Park, M. Distinct tyrosine autophosphorylation sites mediate induction of epithelial mesenchymal like transition by an activated ErbB-2/Neu receptor. Oncogene 2001, 20, 788–799. [Google Scholar] [CrossRef] [PubMed] [Green Version]
- Giordano, A.; Gao, H.; Anfossi, S.; Cohen, E.; Mego, M.; Lee, B.N.; Tin, S.; De Laurentiis, M.; Parker, C.A.; Alvarez, R.H.; et al. Epithelial-mesenchymal transition and stem cell markers in patients with HER2-positive metastatic breast cancer. Mol. Cancer Ther. 2012, 11, 2526–2534. [Google Scholar] [CrossRef] [PubMed] [Green Version]
- Lang, J.E.; Mosalpuria, K.; Cristofanilli, M.; Krishnamurthy, S.; Reuben, J.; Singh, B.; Bedrosian, I.; Meric-Bernstam, F.; Lucci, A. HER2 status predicts the presence of circulating tumor cells in patients with operable breast cancer. Breast Cancer Res. Treat. 2009, 113, 501–507. [Google Scholar] [CrossRef] [PubMed]
Figure 1.
Study enrollment, eligibility, and evaluation. HV, healthy volunteer; MBC, metastatic breast cancer; Cyto, cytology evaluation; qPCR, quantitative polymerase chain reaction; FISH, fluorescence in situ hybridization.
Figure 1.
Study enrollment, eligibility, and evaluation. HV, healthy volunteer; MBC, metastatic breast cancer; Cyto, cytology evaluation; qPCR, quantitative polymerase chain reaction; FISH, fluorescence in situ hybridization.
Figure 2.
(a) Flow diagram for cytopathology evaluation in 207 eligible MBC patients. (b) Representative images of cells classified as CTCs (red arrows) from MBC patients that were harvested by the Parsortix PC1 system and deposited onto cytology slides by cytocentrifugation (images not to same scale) and Wright-Giemsa stained. (c) CTC numbers from the review of evaluable Wright-Giemsa-stained cytology slides. CTC, circulating tumor cell; HV, healthy volunteer; MBC, metastatic breast cancer. * p < 0.05, *** p < 0.001.
Figure 3.
(a) Flow diagram for qPCR evaluation in eligible HV and MBC patients. (b) CTC count correlates with total CTC-related gene expression (40-Sum of KRT19, EPCAM, ERBB2, TWIST, and SNAI2 Ct values). Heat map and scatter plots of CTC gene expression show correlation of gene expression with the number of CTCs observed (c) Sum CTC related genes expression = 0.3701 ∗ CTC count + 6.771; R square = 0.3405, slope significantly different from zero (p < 0.0001). HV, healthy volunteer; MBC, metastatic breast cancer; qPCR, quantitative polymerase chain reaction. NS = p ≥0.05, * p < 0.05, ** p < 0.01, *** p < 0.001.
Figure 4.
(a) Sum of CTC-related gene expression (40-Sum of EPCAM, KRT19, ERBB2, SNAI2, and TWIST Ct values) in HV, newly diagnosed MBC, and MBC with recurrence or progression. (b) ERBB2 expression in CTC-enriched samples by tissue HER2 status. (c) SNAI2 expression in CTC-enriched samples by tissue HER2 status. CTC, circulating tumor cell; HV, healthy volunteer; MBC, metastatic breast cancer.
Figure 5.
(a) Flow diagram for RNA-seq evaluation in eligible HV and MBC patients. (b) Sum of TPM values for all genes differentially expressed (p < 0.001) between Parsortix PC1 harvests obtained from HV comparators and MBC patients. (c) Genes from the KEGG Cancer Pathway were differentially expressed between the HV and MBC harvests (p < 0.05) (d). Net TPM score of these 20 genes for HV and MBC samples. CTC, circulating tumor cell; HV, healthy volunteer; MBC, metastatic breast cancer.
Figure 6.
(a) Flow diagram for HER2 FISH evaluation in eligible MBC patients. (b) Example images of HER2 FISH-stained CTCs from MBC patients that were harvested by the Parsortix PC1 system and deposited onto cytology slides (images not to scale). CTC, circulating tumor cell; HV, healthy volunteer; MBC, metastatic breast cancer; FISH, fluorescence in situ hybridization.
Table 1.
Summary of eligible MBC patients and HVs demographics and clinical characteristics.
Table 1.
Summary of eligible MBC patients and HVs demographics and clinical characteristics.
Parameter
and Categories | Eligible HV
Subjects with
Evaluable Results | Eligible MBC
Patients with
Evaluable
Results | Eligible MBC Patients
with Evaluable Results | |
|---|
Newly
Diagnosed | Progression
/Recurring | |
|---|
| No. of eligible participants | 204 | 207 | 74 (35.7%) | 133 (64.3%) | |
| Age at the time of the blood collection | | | | |
| <57 years old | 170 (83.3%) | 103 (49.8%) | 37 (50.0%) | 66 (49.6%) | |
| ≥57 years old | 34 (16.7%) | 104 (50.2%) | 37 (50.0%) | 67 (50.4%) | |
| Fisher exact p-value | <0.001 | 1.000 | |
| Blood collection method | | | | | |
| Venipuncture | 204 (100.0%) | 171 (82.6%) | 70 (94.6%) | 101 (75.9%) | |
| Port | 0 (0.0%) | 36 (17.4%) | 4 (5.4%) | 32 (24.1%) | |
| Fisher exact p-value | <0.001 | <0.001 | |
| Menopausal status | | | | | |
| Pre-menopausal | 130 (63.7%) | 36 (17.4%) | 15 (20.3%) | 21 (15.8%) | |
| Post-menopausal | 53 (26.0%) | 158 (76.3%) | 50 (67.6%) | 108 (81.2%) | |
| Unknown | 21 (10.3%) | 13 (6.3%) | 9 (12.2%) | 4 (3.0%) | |
| Fisher exact p-value * | <0.001 | 0.328 | |
| Race/ethnicity | | | | | |
| White | 109 (53.4%) | 151 (72.9%) | 55 (74.3%) | 96 (72.2%) | |
| Black | 20 (9.8%) | 22 (10.6%) | 8 (10.8%) | 14 (10.5%) | |
| Hispanic | 40 (19.6%) | 21 (10.1%) | 8 (10.8%) | 13 (9.8%) | |
| Other/unknown | 35 (17.2%) | 13 (6.3%) | 3 (4.1%) | 10 (7.5%) | |
| Fisher exact p-value | <0.001 | 0.826 | |
| Previous history of cancer? | | | | | |
| Yes | 0 (0.0%) | 15 (7.2%) | 5 (6.8%) | 10 (7.5%) | |
| No | 204 (100.0%) | 192 (92.8%) | 69 (93.2%) | 123 (92.5%) | |
| Fisher exact p-value | <0.001 | 1.000 | |
| Breast cancer ER status | | | | | |
| Positive | --- | 160 (77.3%) | 55 (74.3%) | 105 (78.9%) | |
| Negative | --- | 45 (21.7%) | 18 (24.3%) | 27 (20.3%) | |
| Unknown | --- | 2 (1.0%) | 1 (1.4%) | 1 (0.8%) | |
| Fisher exact p-value * | --- | 0.487 | |
| Breast cancer PR status | | | | | |
| Positive | --- | 127 (61.4%) | 44 (59.5%) | 83 (62.4%) | |
| Negative | --- | 73 (35.3%) | 27 (36.5%) | 46 (34.6%) | |
| Unknown | --- | 7 (3.4%) | 3 (4.1%) | 4 (3.0%) | |
| Fisher exact p-value * | --- | 0.761 | |
| Breast cancer HR status | | | |
| Positive | --- | 39 (79.7%) | 57 (77.0%) | 108 (81.2%) | |
| Negative | --- | 165 (18.8%) | 16 (21.6%) | 23 (17.3%) | |
| Unknown | --- | 3 (1.4%) | 1 (1.4%) | 2 (1.5%) | |
| Fisher exact p-value * | --- | 0.448 | |
| Breast cancer HER2-Neu status | | | | | |
| Negative | --- | 165 (79.7%) | 66 (89.2%) | 99 (74.4%) | |
| Positive | --- | 27 (13.0%) | 4 (5.4%) | 23 (17.3%) | |
| Equivocal | --- | 8 (3.9%) | 1 (1.4%) | 7 (5.3%) | |
| Unknown | --- | 7 (3.4%) | 3 (4.1%) | 4 (3.0%) | |
| Fisher exact p-value * | --- | 0.014 | |
| Breast cancer TNBC status | | | |
| TNBC | --- | 33 (15.9%) | 54 (50.5%) | 98 (73.7%) | |
| Non-TNBC | --- | 152 (73.4%) | 13 (12.1%) | 20 (15.0%) | |
| Unknown | --- | 22 (10.6%) | 7 (6.5%) | 15 (11.3%) | |
| Fisher exact p-value * | --- | 0.675 | |
| Metastatic disease status determined by (more than one may apply) | | Fisher exact p-value ** |
| Imaging | --- | 198 (95.7%) | 70 (94.6%) | 128 (96.2%) | 0.724 |
| Rising tumor markers | --- | 5 (2.4%) | 2 (2.7%) | 3 (2.3%) | 1.000 |
| Physical signs and symptoms | --- | 17 (8.2%) | 8 (10.8%) | 9 (6.8%) | 0.306 |
| Physician determination | --- | 4 (1.9%) | 1 (1.4%) | 3 (2.3%) | 1.000 |
| Other (primarily biopsy) | --- | 62 (30.0%) | 49 (66.2%) | 13 (9.8%) | 0.000 |
| Sites of metastasis (more than one may apply) | | | Fisher exact p-value ** |
| Abdomen | --- | 6 (2.9%) | 3 (4.1%) | 3 (2.3%) | 0.669 |
| Adrenal gland | --- | 3 (1.4%) | 0 (0.0%) | 3 (2.3%) | 0.554 |
| Ascites | --- | 1 (0.5%) | 1 (1.4%) | 0 (0.0%) | 0.357 |
| Bone | --- | 139 (67.1%) | 42 (56.8%) | 97 (72.9%) | 0.021 |
| Brain | --- | 29 (14%) | 5 (6.8%) | 24 (18.0%) | 0.035 |
| Chest wall | --- | 16 (7.7%) | 4 (5.4%) | 12 (9.0%) | 0.425 |
| Liver | --- | 80 (38.6%) | 10 (13.5%) | 70 (52.6%) | 0.000 |
| Lung | --- | 77 (37.2%) | 23 (31.1%) | 54 (40.6%) | 0.181 |
| Lymph nodes | --- | 107 (51.7%) | 33 (44.6%) | 74 (55.6%) | 0.148 |
| Other site(s) | --- | 33 (15.9%) | 9 (12.2%) | 24 (18.0%) | 0.325 |
Table 2.
CTC prevalence rates from initial cytopathology review in MBC patients and HVs by demographic and clinical characteristics.
Table 2.
CTC prevalence rates from initial cytopathology review in MBC patients and HVs by demographic and clinical characteristics.
| Parameter and Categories | Eligible HV Subjects and MBC Patients with Evaluable Cytology Slides |
|---|
All Eligible and Evaluable
HV Subjects | All Eligible and Evaluable
MBC Patients | Newly Diagnosed
MBC Patients | Progression/Recurring
MBC Patients |
|---|
| N | ≥1 CTC | ≥5 CTC | N | ≥1 CTC | ≥5 CTC | N | ≥1 CTC | ≥5 CTC | N | ≥1 CTC | ≥5 CTC |
|---|
| All participants | 192 | 19 (9.9%) | 2 (1.0%) | 194 | 94 (48.5%) | 44 (22.7%) | 69 | 23 (33.3%) | 9 (13.0%) | 125 | 71 (56.8%) | 35 (28.0%) |
| Age at the time of the blood collection | | | | | | | | | | |
| <57 Years Old | 159 | 15 (9.4%) | 1 (0.6%) | 96 | 41 (42.7%) | 17 (17.7%) | 33 | 6 (18.2%) | 3 (9.1%) | 63 | 35 (55.6%) | 14 (22.2%) |
| ≥57 Years Old | 33 | 4 (12.1%) | 1 (3.0%) | 98 | 53 (54.1%) | 27 (27.6%) | 36 | 17 (47.2%) | 6 (16.7%) | 62 | 36 (58.1%) | 21 (33.9%) |
| Fisher exact test p-value | | 0.748 | 0.315 | | 0.117 | 0.123 | | 0.012 | 0.481 | | 0.857 | 0.167 |
| Blood collection method | | | | | | | | | | | | |
| via Venipuncture | 192 | 19 (9.9%) | 2 (1.0%) | 159 | 61 (38.4%) | 22 (13.8%) | 65 | 19 (29.2%) | 7 (10.8%) | 94 | 42 (44.7%) | 15 (16.0%) |
| via Port | 0 | 0 (0.0%) | 0 (0.0%) | 35 | 33 (94.3%) | 22 (62.9%) | 4 | 4 (100.0%) | 2 (50.0%) | 31 | 29 (93.5%) | 20 (64.5%) |
| Fisher exact test p-value | | --- | --- | | <0.001 | <0.001 | | 0.010 | 0.080 | | <0.001 | <0.001 |
| Menopausal status | | | | | | | | | | | | |
| Pre-Menopausal | 124 | 12 (9.7%) | 1 (0.8%) | 34 | 14 (41.2%) | 7 (20.6%) | 14 | 2 (14.3%) | 1 (7.1%) | 20 | 12 (60.0%) | 6 (30.0%) |
| Post-Menopausal | 51 | 5 (9.8%) | 1 (2.0%) | 147 | 75 (51.0%) | 35 (23.8%) | 46 | 19 (41.3%) | 8 (17.4%) | 101 | 56 (55.4%) | 27 (26.7%) |
| Unknown | 17 | 2 (11.8%) | 0 (0.0%) | 13 | 5 (38.5%) | 2 (15.4%) | 9 | 2 (22.2%) | 0 (0.0%) | 4 | 3 (75.0%) | 2 (50.0%) |
| Fisher exact test p-value | | 1.000 | 0.499 | | 0.344 | 0.832 | | 0.108 | 0.671 | | 0.808 | 0.787 |
| Race/ethnicity | | | | | | | | | | | | |
| White | 102 | 7 (6.9%) | 1 (1.0%) | 141 | 71 (50.4%) | 31 (22.0%) | 51 | 19 (37.3%) | 7 (13.7%) | 90 | 52 (57.8%) | 24 (26.7%) |
| Black | 20 | 5 (25.0%) | 0 (0.0%) | 21 | 13 (61.9%) | 9 (42.9%) | 7 | 2 (28.6%) | 2 (28.6%) | 14 | 11 (78.6%) | 7 (50.0%) |
| Hispanic | 37 | 4 (10.8%) | 1 (2.7%) | 21 | 4 (19.0%) | 1 (4.8%) | 8 | 2 (25.0%) | 0 (0.0%) | 13 | 2 (15.4%) | 1 (7.7%) |
| Other/Unknown | 33 | 3 (9.1%) | 0 (0.0%) | 11 | 6 (54.5%) | 3 (27.3%) | 3 | 0 (0.0%) | 0 (0.0%) | 8 | 6 (75.0%) | 3 (37.5%) |
| Fisher exact test p-value | | 0.114 | 0.719 | | 0.022 | 0.026 | | 0.740 | 0.388 | | 0.004 | 0.084 |
| Breast cancer ER status | | | | | | | | | | | | |
| Positive | 0 | 0 (0.0%) | 0 (0.0%) | 151 | 70 (46.4%) | 35 (23.2%) | 52 | 18 (34.6%) | 7 (13.5%) | 99 | 52 (52.5%) | 28 (28.3%) |
| Negative | 0 | 0 (0.0%) | 0 (0.0%) | 42 | 24 (57.1%) | 9 (21.4%) | 16 | 5 (31.3%) | 2 (12.5%) | 26 | 19 (73.1%) | 7 (26.9%) |
| Fisher’s Exact Test p-value | | --- | --- | | 0.227 | 1.000 | | 1.000 | 1.000 | | 0.076 | 1.000 |
| Breast Cancer PR Status | | | | | | | | | | | | |
| Positive | 0 | 0 (0.0%) | 0 (0.0%) | 121 | 57 (47.1%) | 26 (21.5%) | 42 | 13 (31.0%) | 6 (14.3%) | 79 | 44 (55.7%) | 20 (25.3%) |
| Negative | 0 | 0 (0.0%) | 0 (0.0%) | 67 | 33 (49.3%) | 15 (22.4%) | 24 | 9 (37.5%) | 3 (12.5%) | 43 | 24 (55.8%) | 12 (27.9%) |
| Unknown | 0 | 0 (0.0%) | 0 (0.0%) | 6 | 4 (66.7%) | 3 (50.0%) | 3 | 1 (33.3%) | 0 (0.0%) | 3 | 3 (100.0%) | 3 (100.0%) |
| Fisher exact test p-value | | --- | --- | | 0.879 | 1.000 | | 0.599 | 1.000 | | 1.000 | 0.830 |
| Breast cancer HER2-Neu status | | | | | | | | | | | | |
| Negative | 0 | 0 (0.0%) | 0 (0.0%) | 156 | 70 (44.9%) | 33 (21.2%) | 62 | 21 (33.9%) | 8 (12.9%) | 94 | 49 (52.1%) | 25 (26.6%) |
| Positive | 0 | 0 (0.0%) | 0 (0.0%) | 24 | 17 (70.8%) | 8 (33.3%) | 3 | 1 (33.3%) | 1 (33.3%) | 21 | 16 (76.2%) | 7 (33.3%) |
| Equivocal | 0 | 0 (0.0%) | 0 (0.0%) | 8 | 4 (50.0%) | 2 (25.0%) | 1 | 1 (100.0%) | 0 (0.0%) | 7 | 3 (42.9%) | 2 (28.6%) |
| Unknown | 0 | 0 (0.0%) | 0 (0.0%) | 6 | 3 (50.0%) | 1 (16.7%) | 3 | 0 (0.0%) | 0 (0.0%) | 3 | 3 (100.0%) | 1 (33.3%) |
| Fisher exact test p-value | | --- | --- | | 0.061 | 0.378 | | 0.533 | 0.452 | | 0.098 | 0.809 |
| Breast cancer TNBC status | | | | | | | | | | | | |
| Non-TNBC | 0 | 0 (0.0%) | 0 (0.0%) | 143 | 66 (46.2%) | 33 (23.1%) | 51 | 17 (33.3%) | 7 (13.7%) | 92 | 49 (64.1%) | 26 (28.3%) |
| TNBC | 0 | 0 (0.0%) | 0 (0.0%) | 31 | 19 (61.3%) | 6 (19.4%) | 12 | 5 (4.2%) | 2 (16.7%) | 19 | 14 (73.7%) | 4 (21.0%) |
| Unknown | 0 | 0 (0.0%) | 0 (0.0%) | 20 | 9 (45.0%) | 5 (25.0%) | 6 | 1 (16.7%) | 0 (0.0%) | 14 | 8 (57.1%) | 5 (35.7%) |
| Fisher exact test p-value | | --- | --- | | 0.4499 | 0.6523 | | 0.5859 | 0.1019 | | 0.6209 | 0.5195 |
| Sites of metastasis (more than one may apply) | | | | | | | | | | |
| Abdomen | 0 | 0 (0.0%) | 0 (0.0%) | 6 | 3 (50.0%) | 2 (33.3%) | 3 | 1 (33.3%) | 1 (33.3%) | 3 | 2 (66.7%) | 1 (33.3%) |
| Adrenal gland | 0 | 0 (0.0%) | 0 (0.0%) | 3 | 2 (66.7%) | 1 (33.3%) | 0 | 0 (0.0%) | 0 (0.0%) | 3 | 2 (66.7%) | 1 (33.3%) |
| Ascites | 0 | 0 (0.0%) | 0 (0.0%) | 1 | 0 (0.0%) | 0 (0.0%) | 1 | 0 (0.0%) | 0 (0.0%) | 0 | 0 (0.0%) | 0 (0.0%) |
| Bone | 0 | 0 (0.0%) | 0 (0.0%) | 132 | 72 (54.5%) | 40 (30.3%) | 39 | 14 (35.9%) | 9 (23.1%) | 93 | 58 (62.4%) | 31 (33.3%) |
| Brain | 0 | 0 (0.0%) | 0 (0.0%) | 26 | 17 (65.4%) | 9 (34.6%) | 4 | 2 (50.0%) | 1 (25.0%) | 22 | 15 (68.2%) | 8 (36.4%) |
| Chest wall | 0 | 0 (0.0%) | 0 (0.0%) | 16 | 11 (68.8%) | 4 (25.0%) | 4 | 3 (75.0%) | 2 (50.0%) | 12 | 8 (66.7%) | 2 (16.7%) |
| Kidney | 0 | 0 (0.0%) | 0 (0.0%) | 0 | 0 (0.0%) | 0 (0.0%) | 0 | 0 (0.0%) | 0 (0.0%) | 0 | 0 (0.0%) | 0 (0.0%) |
| Liver | 0 | 0 (0.0%) | 0 (0.0%) | 73 | 41 (56.2%) | 19 (26.0%) | 9 | 2 (22.2%) | 2 (22.2%) | 64 | 39 (60.9%) | 17 (26.6%) |
| Lung | 0 | 0 (0.0%) | 0 (0.0%) | 70 | 35 (50.0%) | 19 (27.1%) | 22 | 6 (27.3%) | 1 (4.5%) | 48 | 29 (60.4%) | 18 (37.5%) |
| Lymph nodes | 0 | 0 (0.0%) | 0 (0.0%) | 101 | 48 (47.5%) | 19 (18.8%) | 31 | 10 (32.3%) | 3 (9.7%) | 70 | 38 (54.3%) | 16 (22.9%) |
| Other site(s) | 0 | 0 (0.0%) | 0 (0.0%) | 33 | 15 (45.5%) | 4 (12.1%) | 9 | 4 (44.4%) | 1 (11.1%) | 24 | 11 (45.8%) | 3 (12.5%) |
Table 3.
Summary of CTCs from review of evaluable Wright-Giemsa stained cytology slides from 192 HV subjects and 194 MBC patients.
Table 3.
Summary of CTCs from review of evaluable Wright-Giemsa stained cytology slides from 192 HV subjects and 194 MBC patients.
| No. of CTCs Observed | Cytopathology Review Results:
Eligible HV Subjects and MBC Patients with Adequate Cytology Slides (% [95% CI]) |
|---|
| Evaluable HV Subjects | Evaluable MBC Patients | Fisher
Exact
p-Value | Newly Diagnosed
MBC Patients | Recurring/Progressing
MBC Patients | Fisher
Exact
p-Value |
|---|
| 0 CTC | 173 (90.1% [85.1–93.6%]) | 100 (51.5% [44.6–58.5%]) | --- | 46 (66.7% [54.9–76.6%]) | 54 (43.2% [34.8–52.0%]) | --- |
| ≥1 CTC | 19 (9.9% [6.4–14.9%]) | 94 (48.5% [41.5–55.4%]) | <0.001 | 23 (33.3% [23.4–45.1%]) | 71 (56.8% [48.0–65.2%]) | 0.003 |
| ≥2 CTC | 6 (3.1% [1.4–6.6%]) | 77 (39.7% [33.1–46.7%]) | <0.001 | 18 (26.1% [17.2–37.5%]) | 59 (47.2% [38.7–55.9%]) | 0.006 |
| ≥3 CTC | 4 (2.1% [0.8–5.2%]) | 63 (32.5% [26.3–39.4%]) | <0.001 | 14 (20.3% [12.5–31.2%]) | 49 (39.2% [31.1–48.0%]) | 0.010 |
| ≥4 CTC | 2 (1.0% [0.3–3.7%]) | 53 (27.3% [21.5–34.0%]) | <0.001 | 12 (17.4% [10.2–28.0%]) | 41 (32.8% [25.2–41.4%]) | 0.028 |
| ≥5 CTC | 2 (1.0% [0.3–3.7%]) | 44 (22.7% [17.3–29.1%]) | <0.001 | 9 (13.0% [7.0–23.0%]) | 35 (28.0% [20.9–36.4%]) | 0.020 |
| ≥10 CTC | 1 (0.5% [0.1–2.9%]) | 30 (15.5% [11.0–21.2%]) | <0.001 | 4 (5.8% [2.3–14.0%]) | 26 (20.8% [14.6–28.7%]) | 0.006 |
| TOTAL N | 192 | 194 | | 69 | 125 | |
Table 4.
Proportions of HV subjects and MBC patients with positive gene expression using a Ct value threshold of ≤35.0 for each gene to determine positivity and comparisons to numbers of CTCs observed on Wright-Giemsa-stained slides during cytopathology review.
Table 4.
Proportions of HV subjects and MBC patients with positive gene expression using a Ct value threshold of ≤35.0 for each gene to determine positivity and comparisons to numbers of CTCs observed on Wright-Giemsa-stained slides during cytopathology review.
| Group * | N | GAPDH | B2M | GYPA | PTPRC | KRT19 | EpCAM | ERBB2 | TWIST1 | SNAI2 | KRT19, EpCAM, ERBB2, TWIST &/or SNAI2 | KRT19, EpCAM, TWIST &/or SNAI2 |
|---|
| Negative Controls | 18 | 0.0% | 0.0% | 0.0% | 0.0% | 0.0% | 0.0% | 0.0% | 0.0% | 0.0% | 0.0% | 0.0% |
| Positive Controls | 18 | 100.0% | 100.0% | 5.6% | 16.7% | 100.0% | 100.0% | 100.0% | 100.0% | 100.0% | 100.0% | 100.0% |
| All HVs | 102 | 99.0% | 100.0% | 2.0% | 100.0% | 0.0% | 1.0% | 19.6% | 1.0% | 0.0% | 19.6% | 1.0% |
| with a CTC count | 99 (97.1%) | 100.0% | 100.0% | 2.0% | 100.0% | 0.0% | 1.0% | 20.2% | 1.0% | 0.0% | 20.2% | 1.0% |
| with 0 CTC | 83 (83.8%) | 100.0% | 100.0% | 2.4% | 100.0% | 0.0% | 1.2% | 21.7% | 1.2% | 0.0% | 21.7% | 1.2% |
| with 1 CTC | 11 (11.1%) | 100.0% | 100.0% | 0.0% | 100.0% | 0.0% | 0.0% | 18.2% | 0.0% | 0.0% | 18.2% | 0.0% |
| with 2–4 CTCs | 3 (3.1%) | 100.0% | 100.0% | 0.0% | 100.0% | 0.0% | 0.0% | 0.0% | 0.0% | 0.0% | 0.0% | 0.0% |
| with 5–9 CTCs | 1 (1.0%) | 100.0% | 100.0% | 0.0% | 100.0% | 0.0% | 0.0% | 0.0% | 0.0% | 0.0% | 0.0% | 0.0% |
| with ≥10 CTCs | 1 (1.0%) | 100.0% | 100.0% | 0.0% | 100.0% | 0.0% | 0.0% | 0.0% | 0.0% | 0.0% | 0.0% | 0.0% |
| All MBC patients | 74 | 98.6% | 100.0% | 5.4% | 100.0% | 21.6% | 13.5% | 47.3% | 5.4% | 0.0% | 52.7% | 24.3% |
| with a CTC count | 71 (95.9%) | 98.6% | 100.0% | 5.6% | 100.0% | 22.5% | 14.1% | 47.9% | 5.6% | 0.0% | 53.5% | 25.4% |
| with 0 CTC | 31 (43.7%) | 100.0% | 100.0% | 3.2% | 100.0% | 22.6% | 9.7% | 48.4% | 6.5% | 0.0% | 54.8% | 25.8% |
| with 1 CTC | 10 (14.1%) | 100.0% | 100.0% | 0.0% | 100.0% | 0.0% | 0.0% | 30.0% | 0.0% | 0.0% | 30.0% | 0.0% |
| with 2–4 CTCs | 14 (19.7%) | 92.9% | 100.0% | 0.0% | 100.0% | 28.6% | 21.4% | 42.9% | 7.1% | 0.0% | 57.1% | 35.7% |
| with 5–9 CTCs | 5 (7.0%) | 100.0% | 100.0% | 0.0% | 100.0% | 0.0% | 0.0% | 40.0% | 0.0% | 0.0% | 40.0% | 0.0% |
| with ≥10 CTCs | 11 (15.5%) | 100.0% | 100.0% | 27.3% | 100.0% | 45.5% | 36.4% | 72.7% | 9.1% | 0.0% | 72.7% | 45.5% |
| All newly diagnosed MBC patients | 21 | 100.0% | 100.0% | 9.5% | 100.0% | 23.8% | 9.5% | 66.7% | 14.3% | 0.0% | 71.4% | 28.6% |
| with a CTC count | 20 (95.2%) | 100.0% | 100.0% | 10.0% | 100.0% | 25.0% | 10.0% | 65.0% | 15.0% | 0.0% | 70.0% | 30.0% |
| with 0 CTC | 12 (60.0%) | 100.0% | 100.0% | 8.3% | 100.0% | 33.3% | 8.3% | 66.7% | 16.7% | 0.0% | 75.0% | 41.7% |
| with 1 CTC | 2 (10.0%) | 100.0% | 100.0% | 0.0% | 100.0% | 0.0% | 0.0% | 50.0% | 0.0% | 0.0% | 50.0% | 0.0% |
| with 2–4 CTCs | 3 (15.0%) | 100.0% | 100.0% | 0.0% | 100.0% | 0.0% | 0.0% | 66.7% | 0.0% | 0.0% | 66.7% | 0.0% |
| with 5–9 CTCs | 2 (10.0%) | 100.0% | 100.0% | 0.0% | 100.0% | 0.0% | 0.0% | 50.0% | 0.0% | 0.0% | 50.0% | 0.0% |
| with ≥10 CTCs | 1 (5.0%) | 100.0% | 100.0% | 100.0% | 100.0% | 100.0% | 100.0% | 100.0% | 100.0% | 0.0% | 100.0% | 100.0% |
| All recurrent/progressive MBC patients | 53 | 98.1% | 100.0% | 3.8% | 100.0% | 20.8% | 15.1% | 39.6% | 1.9% | 0.0% | 45.3% | 22.6% |
| with CTC count | 51 (96.2%) | 98.0% | 100.0% | 3.9% | 100.0% | 21.6% | 15.7% | 41.2% | 2.0% | 0.0% | 47.1% | 23.5% |
| with 0 CTC | 19 (37.2%) | 100.0% | 100.0% | 0.0% | 100.0% | 15.8% | 10.5% | 36.8% | 0.0% | 0.0% | 42.1% | 15.8% |
| with 1 CTC | 8 (15.7%) | 100.0% | 100.0% | 0.0% | 100.0% | 0.0% | 0.0% | 25.0% | 0.0% | 0.0% | 25.0% | 0.0% |
| with 2–4 CTCs | 11 (21.6%) | 90.9% | 100.0% | 0.0% | 100.0% | 36.4% | 27.3% | 36.4% | 9.1% | 0.0% | 54.5% | 45.5% |
| with 5–9 CTCs | 3 (5.9%) | 100.0% | 100.0% | 0.0% | 100.0% | 0.0% | 0.0% | 33.3% | 0.0% | 0.0% | 33.3% | 0.0% |
| with ≥10 CTCs | 10 (19.6%) | 100.0% | 100.0% | 20.0% | 100.0% | 40.0% | 30.0% | 70.0% | 0.0% | 0.0% | 70.0% | 40.0% |
Table 5.
Results from evaluation of Parsortix harvests using HER2 FISH. The number and proportion of samples with CTCs identified on the FISH slide and the number and proportion of samples showing CTCs with HER2 amplification in the HV subjects and MBC patients by their tissue HER2 status.
Table 5.
Results from evaluation of Parsortix harvests using HER2 FISH. The number and proportion of samples with CTCs identified on the FISH slide and the number and proportion of samples showing CTCs with HER2 amplification in the HV subjects and MBC patients by their tissue HER2 status.
| Parameter and Categories | HVs | MBC Patients by Tissue HER2 Status |
|---|
| Unknown | Equivocal | Negative | Positive |
|---|
| n | 38 | 3 | 4 | 84 | 10 |
| No. with CTC identified | 5 (13.2%) | 0 (0.0%) | 2 (50.0%) | 23 (27.4%) | 3 (30.0%) |
| No. with HER2 amplified in CTC | 0 of 5 (0%) | - | 0 of 2 (0%) | 0 of 23 (0%) | 1 of 3 (33.3%) |
| Publisher’s Note: MDPI stays neutral with regard to jurisdictional claims in published maps and institutional affiliations. |
© 2022 by the authors. Licensee MDPI, Basel, Switzerland. This article is an open access article distributed under the terms and conditions of the Creative Commons Attribution (CC BY) license (https://creativecommons.org/licenses/by/4.0/).


 ,
, 


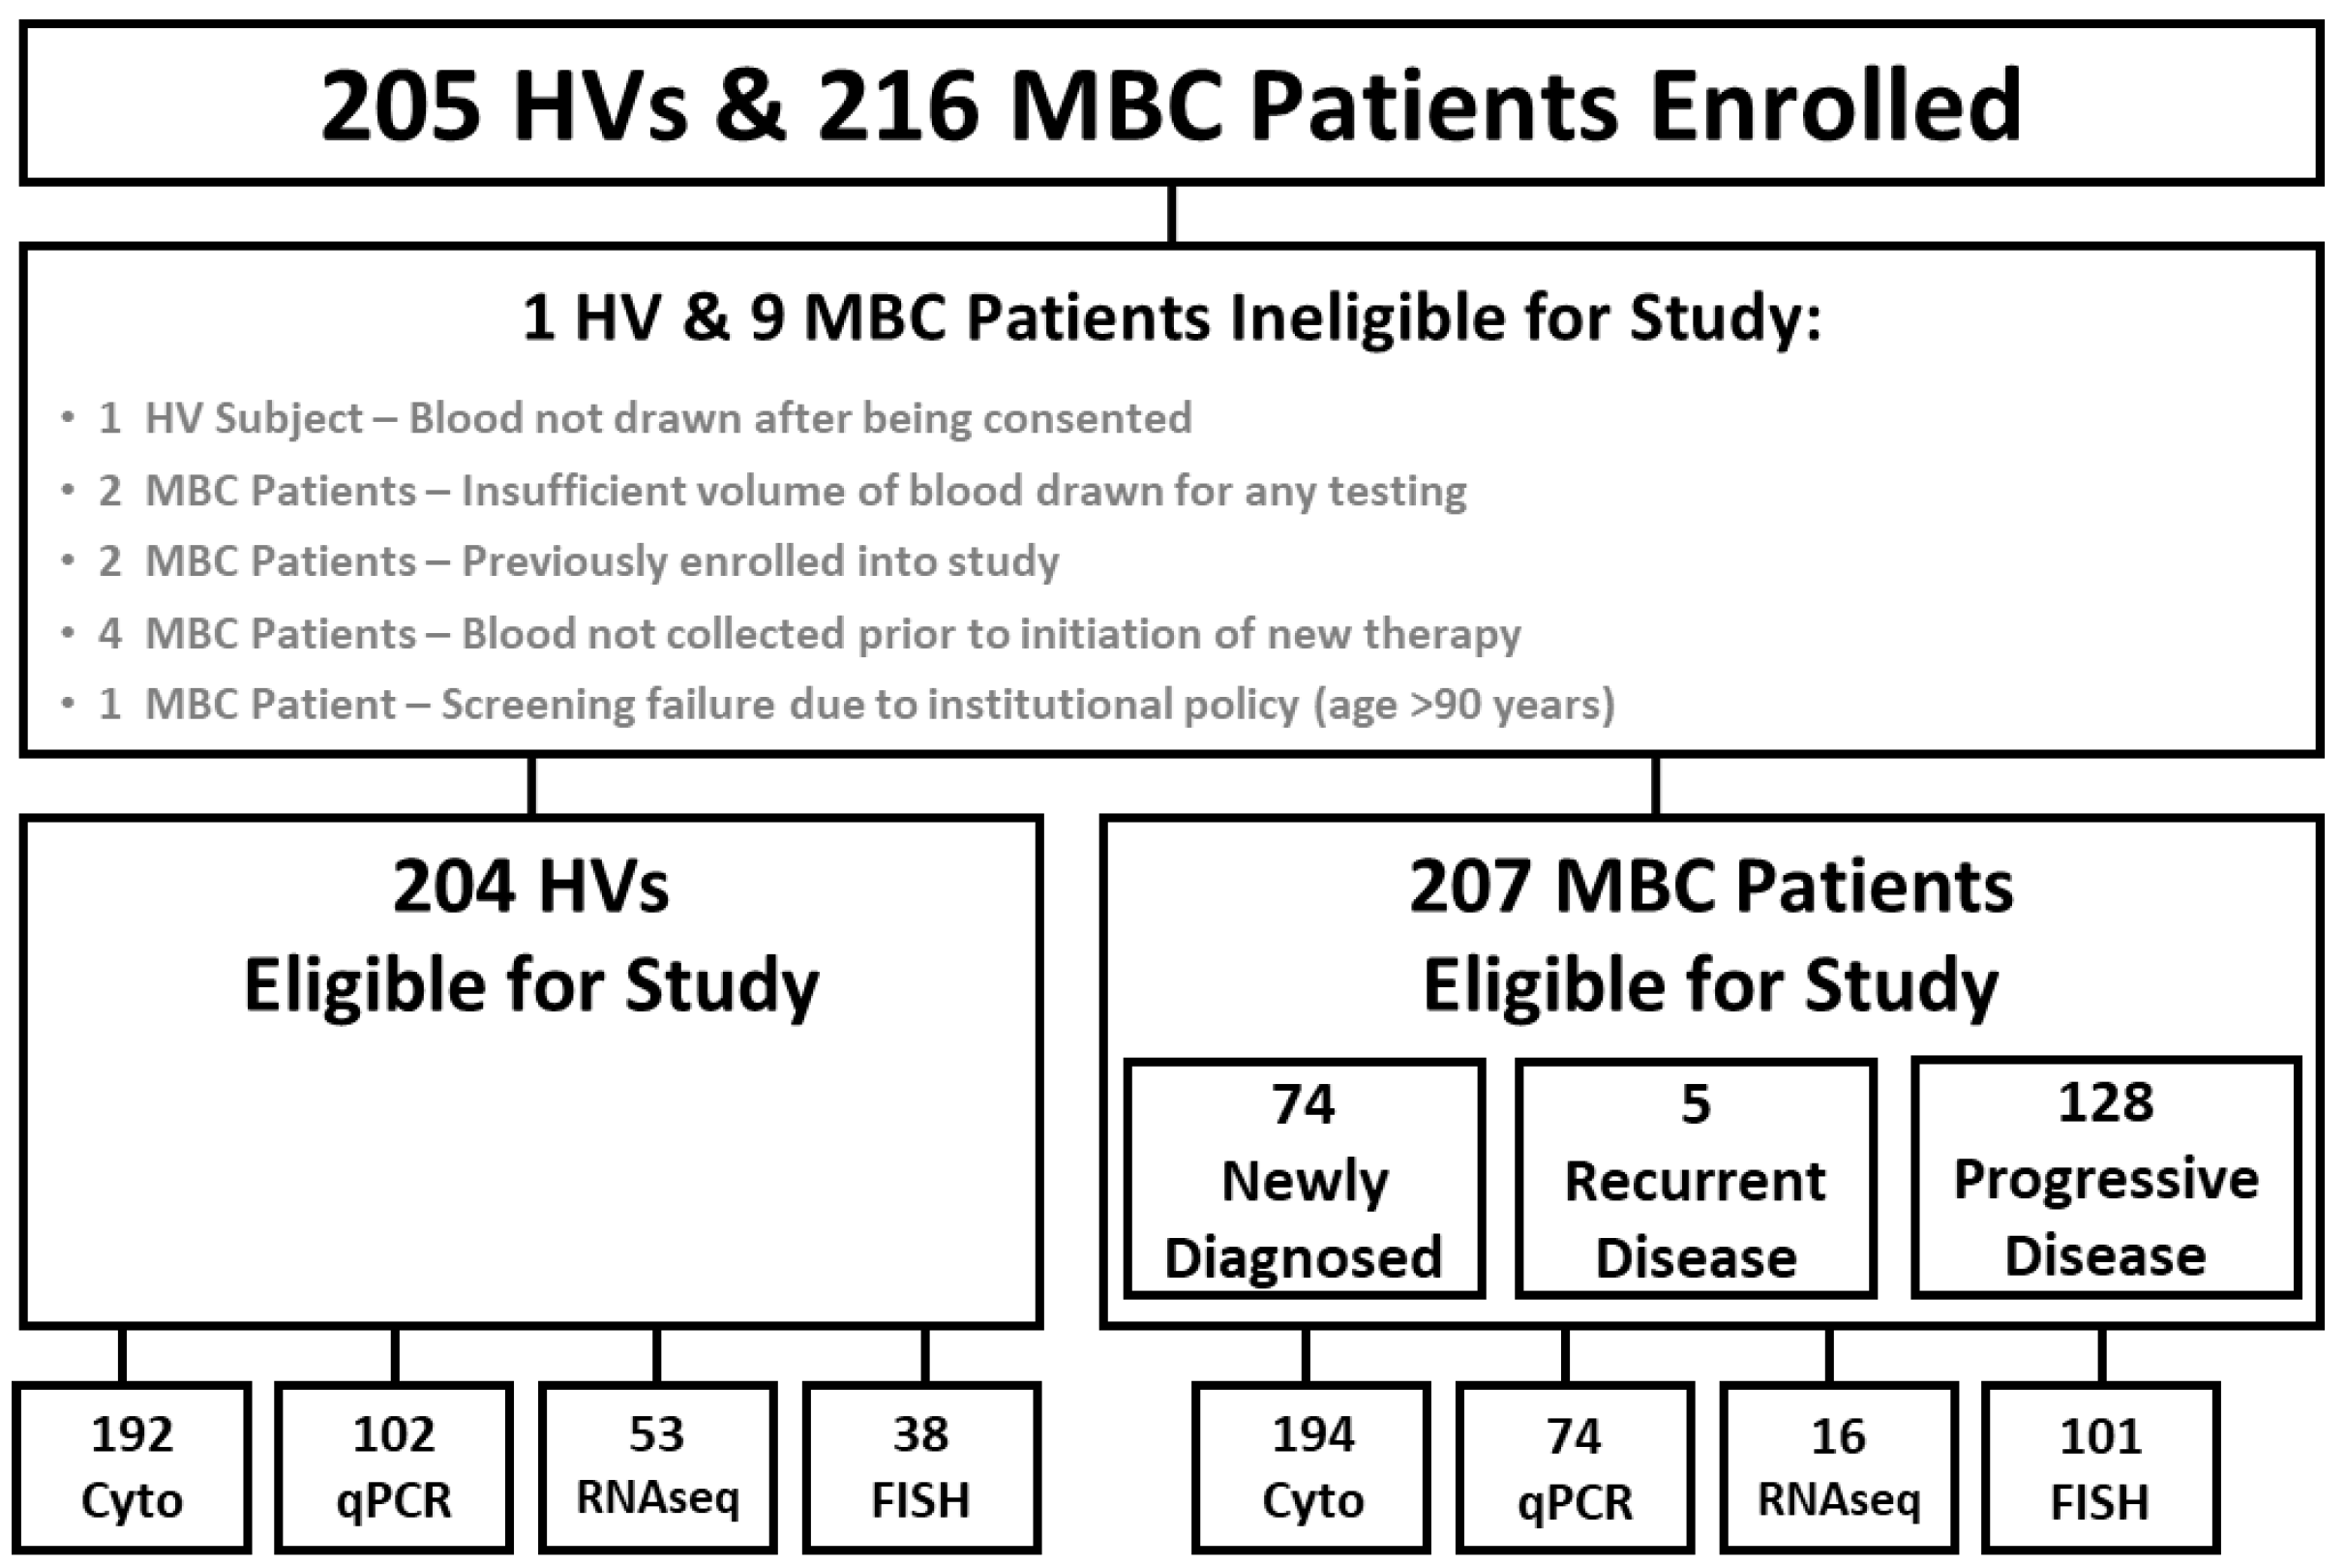
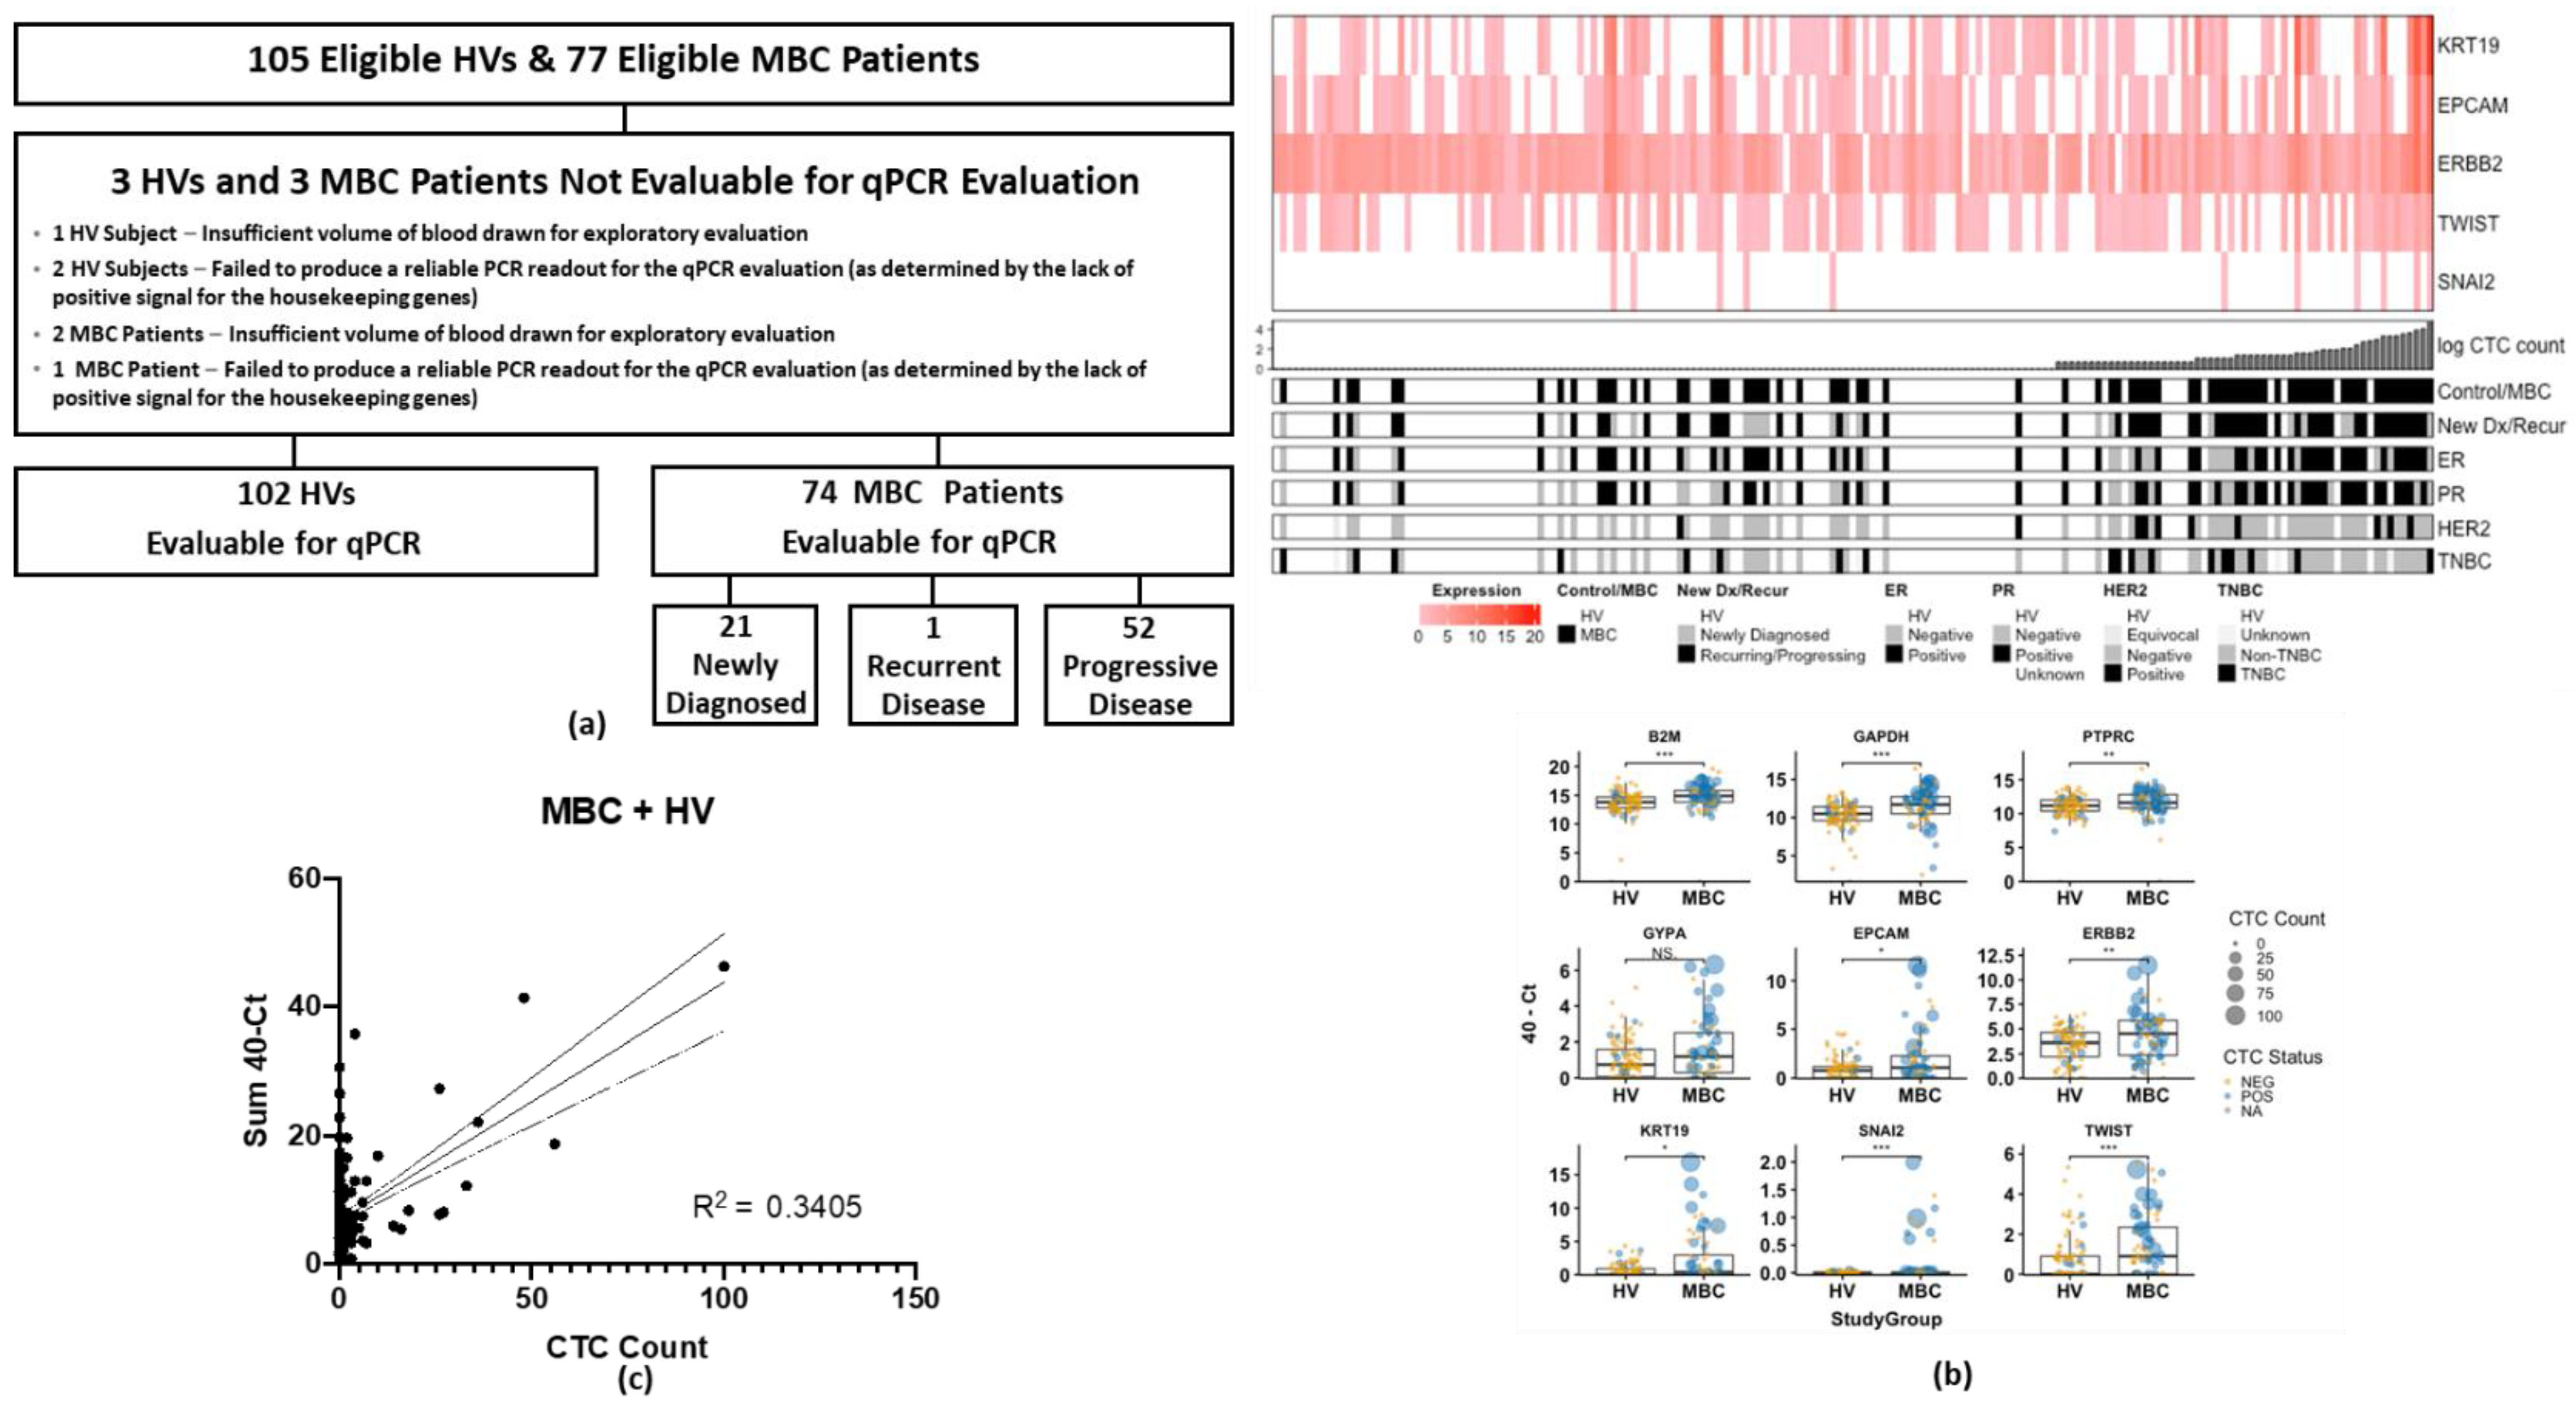
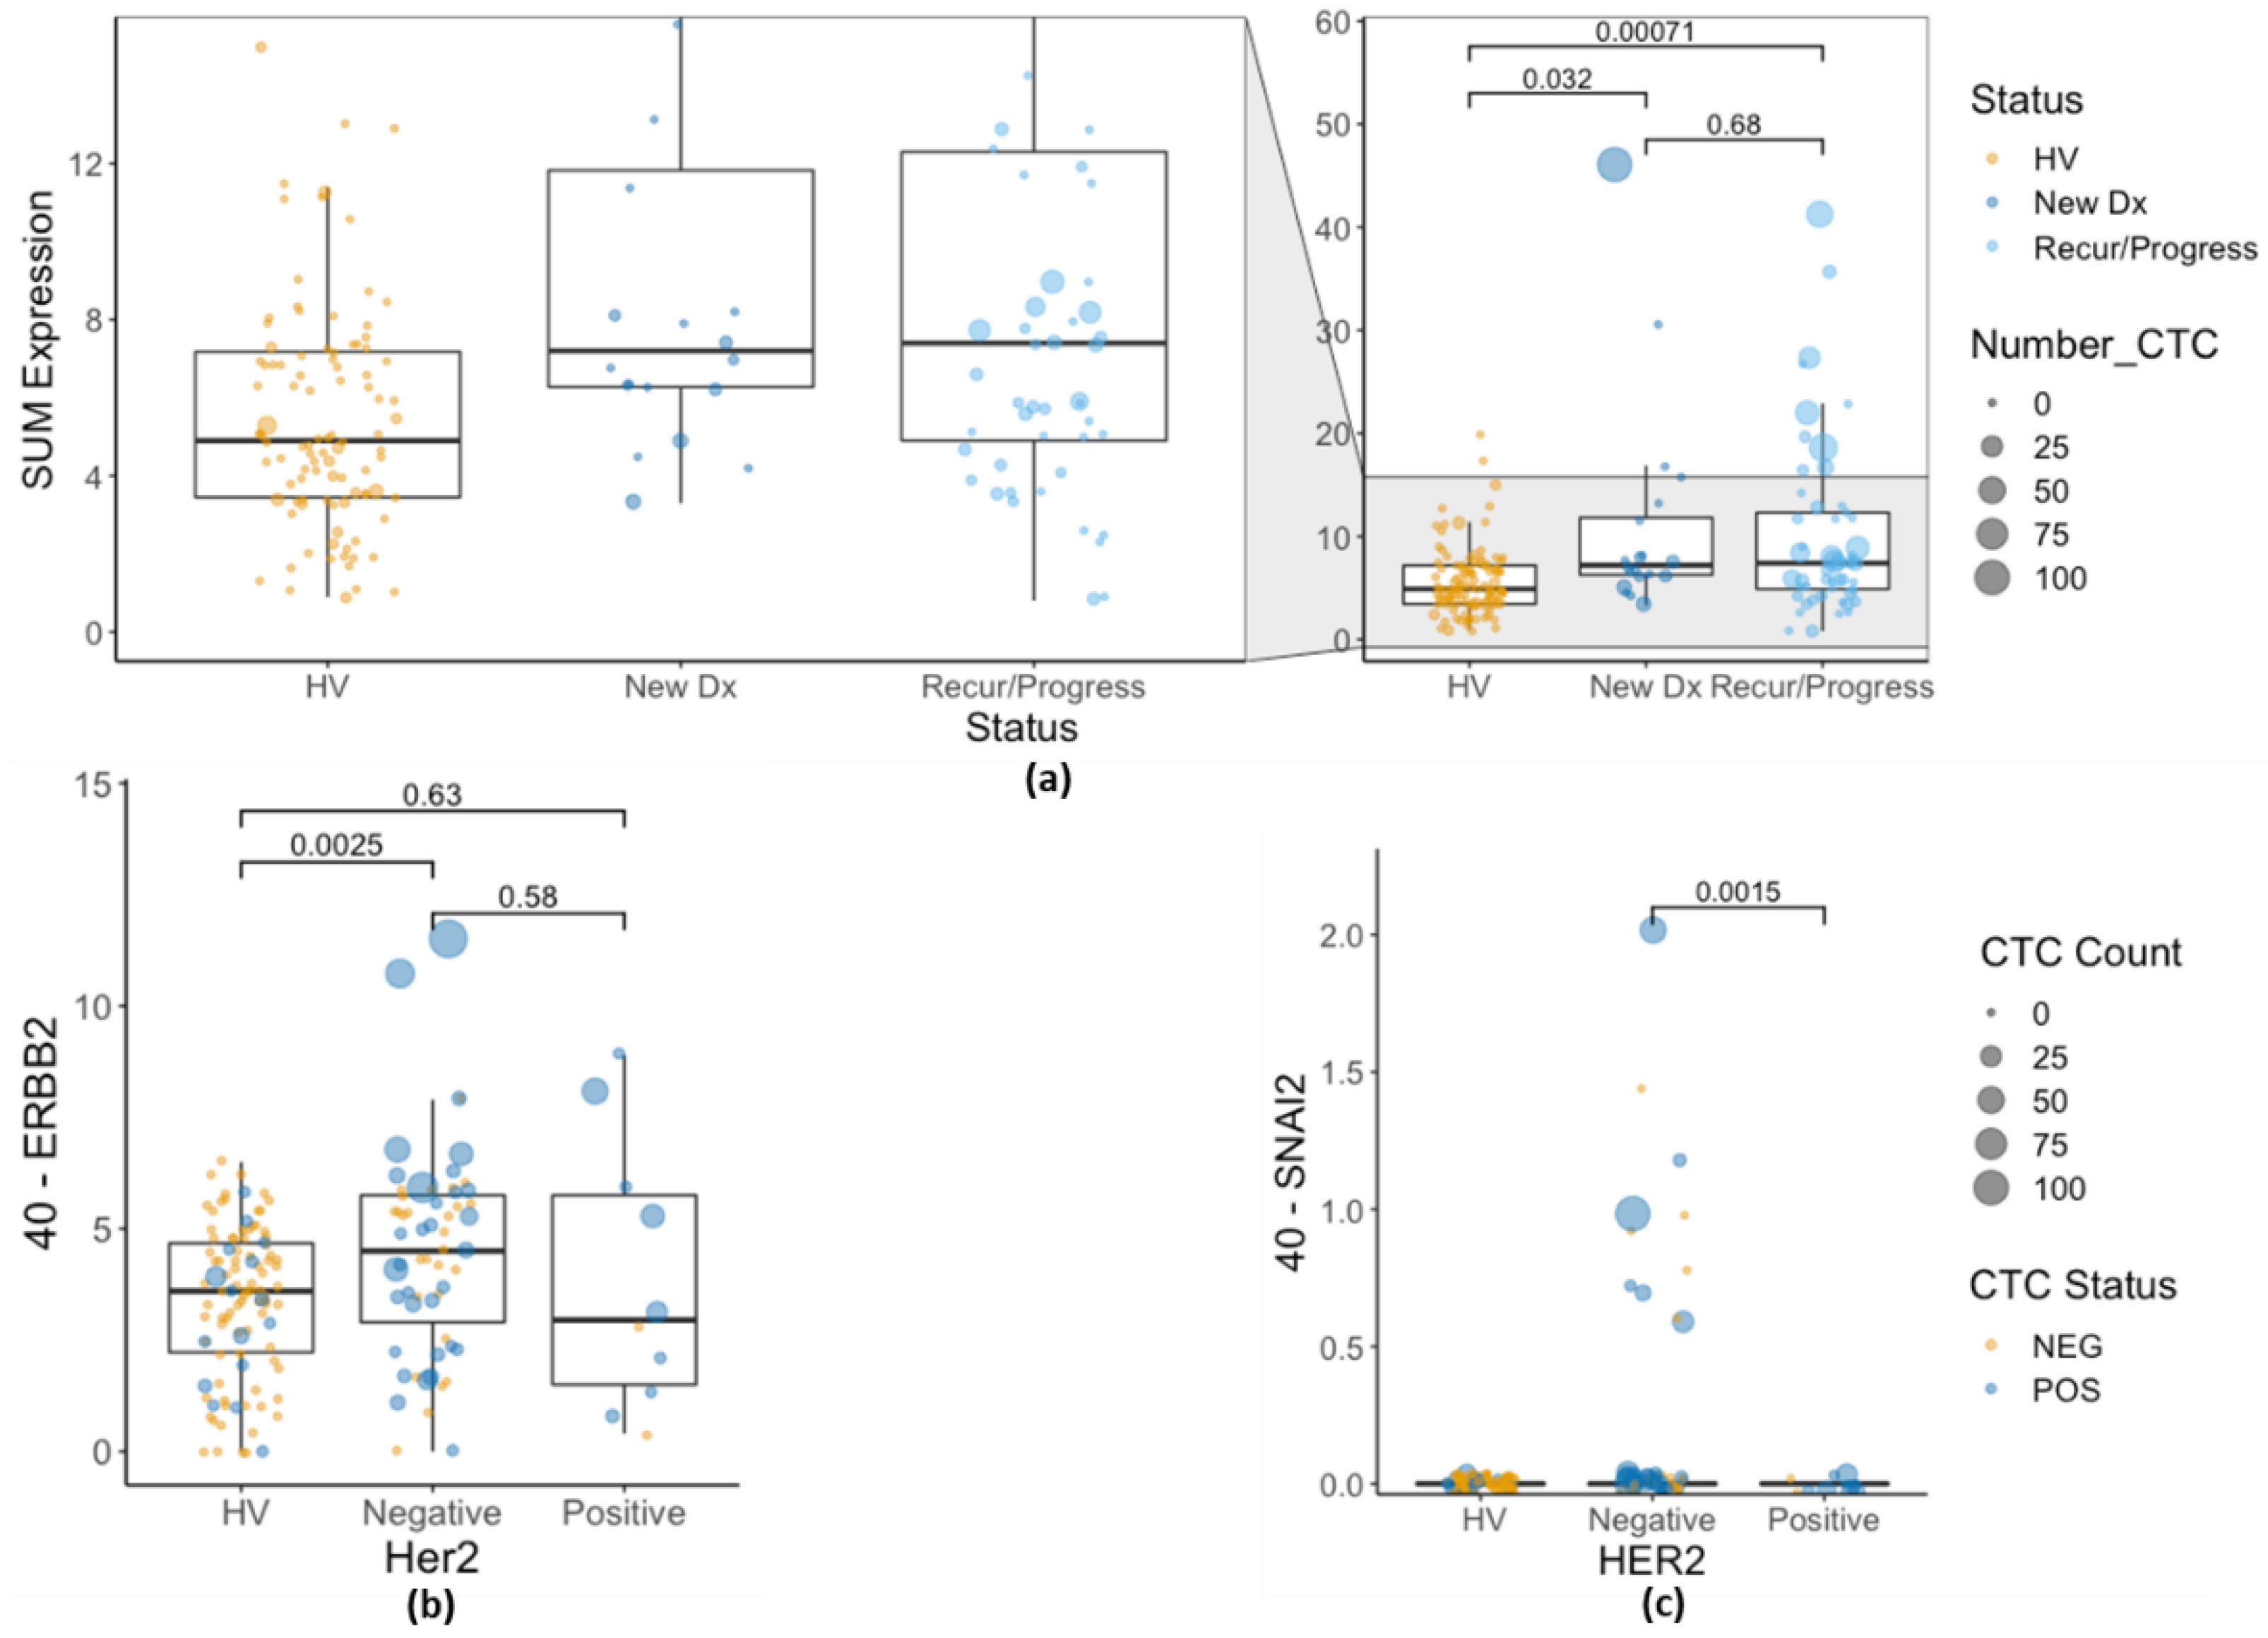
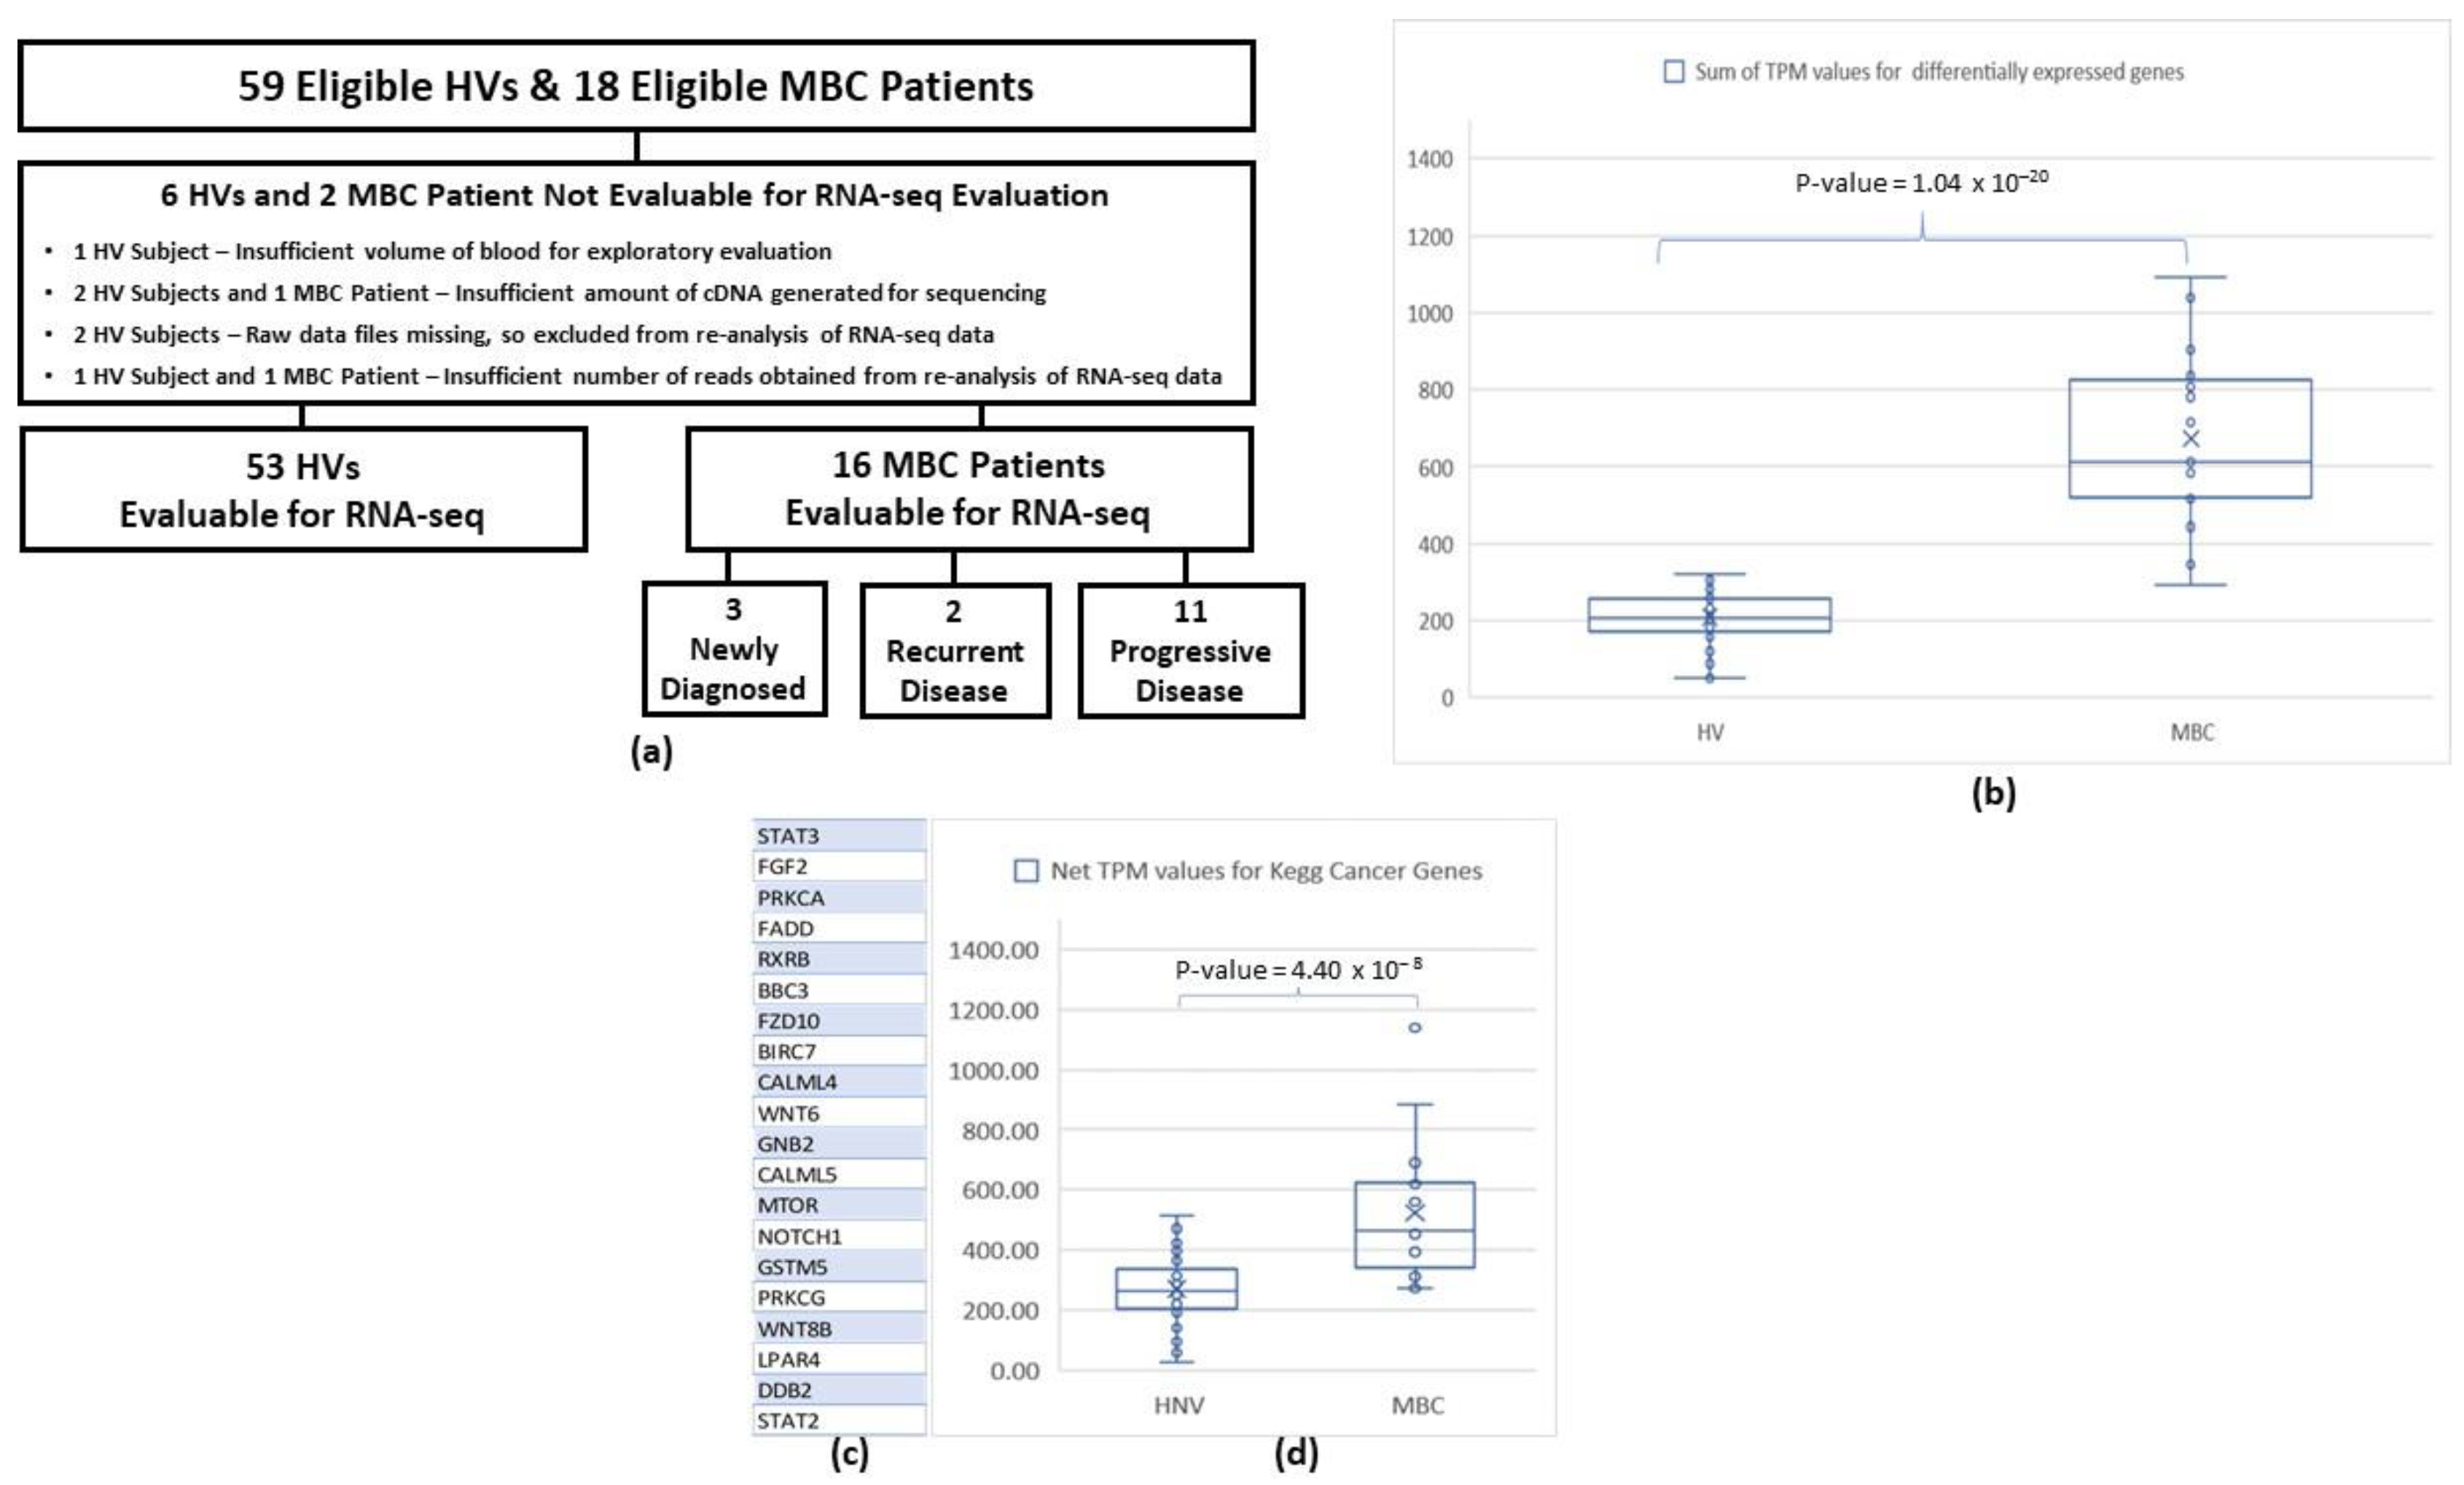
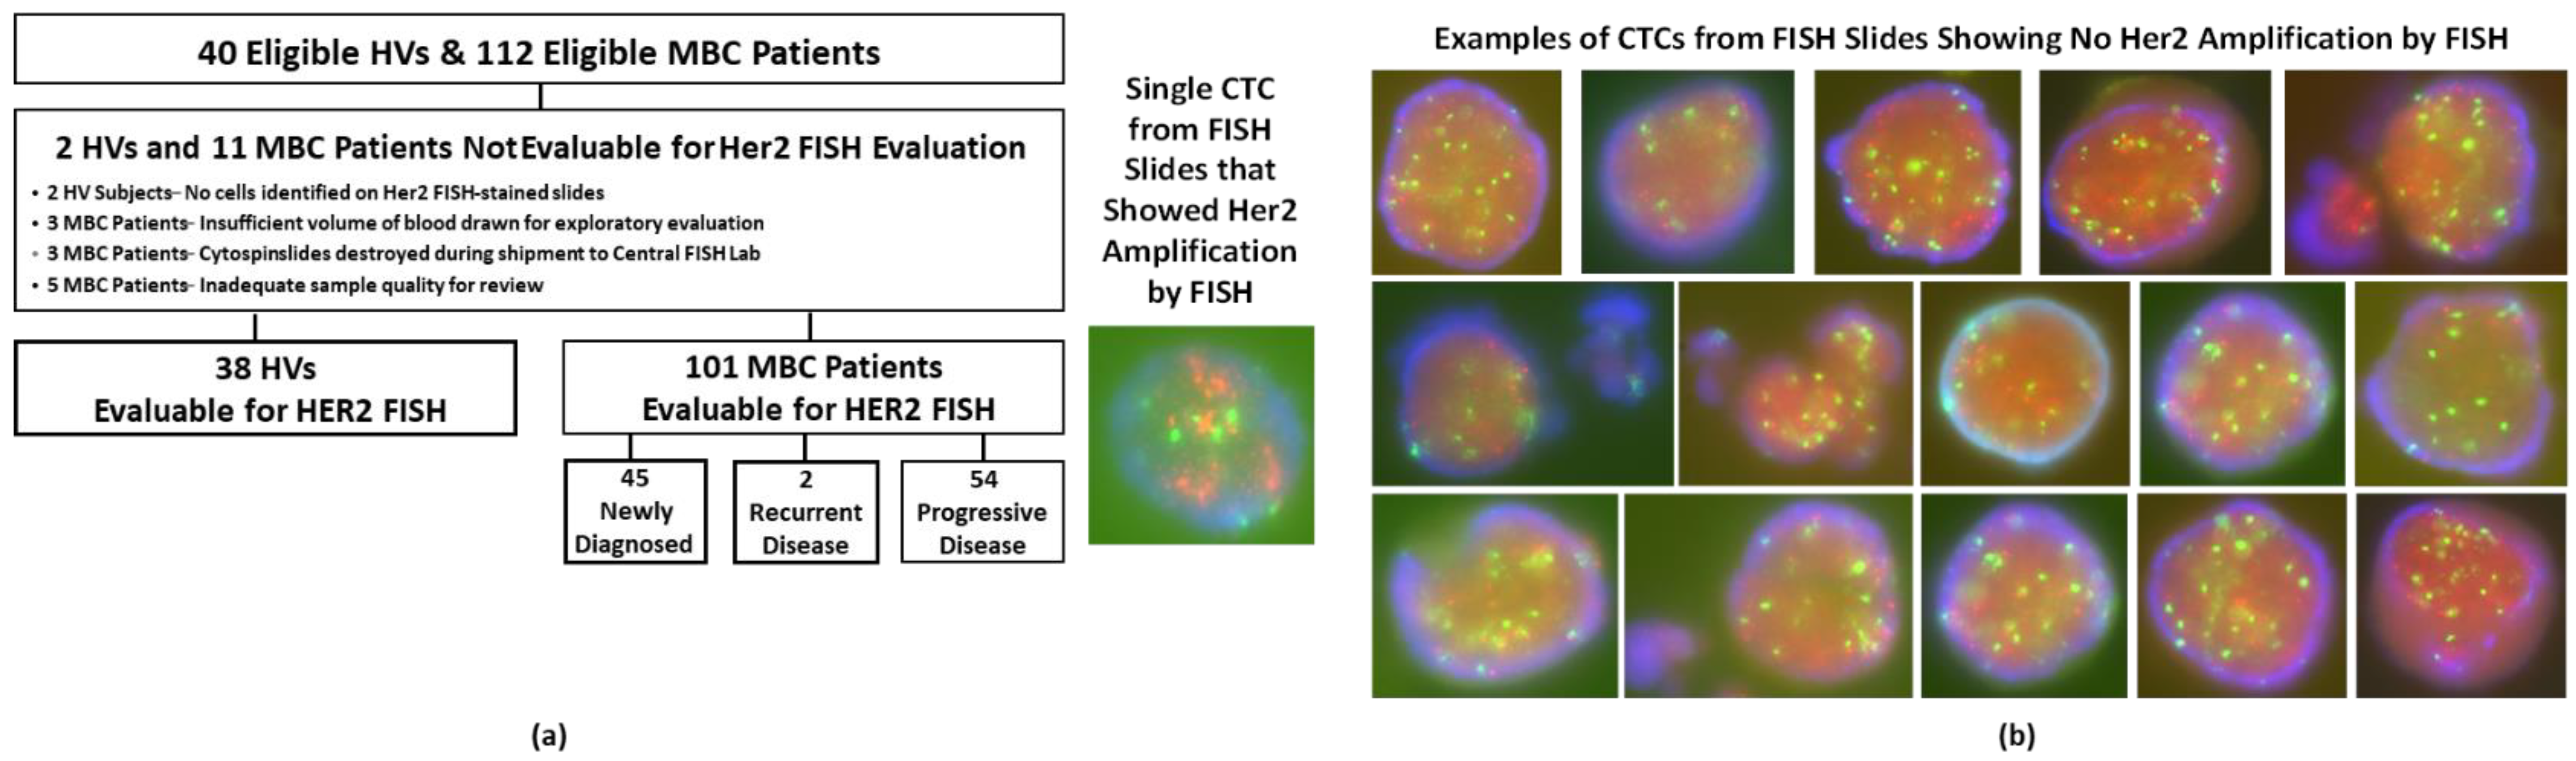