Aggregatibacter actinomycetemcomitans Induces Autophagy in Human Junctional Epithelium Keratinocytes

 , , , , and
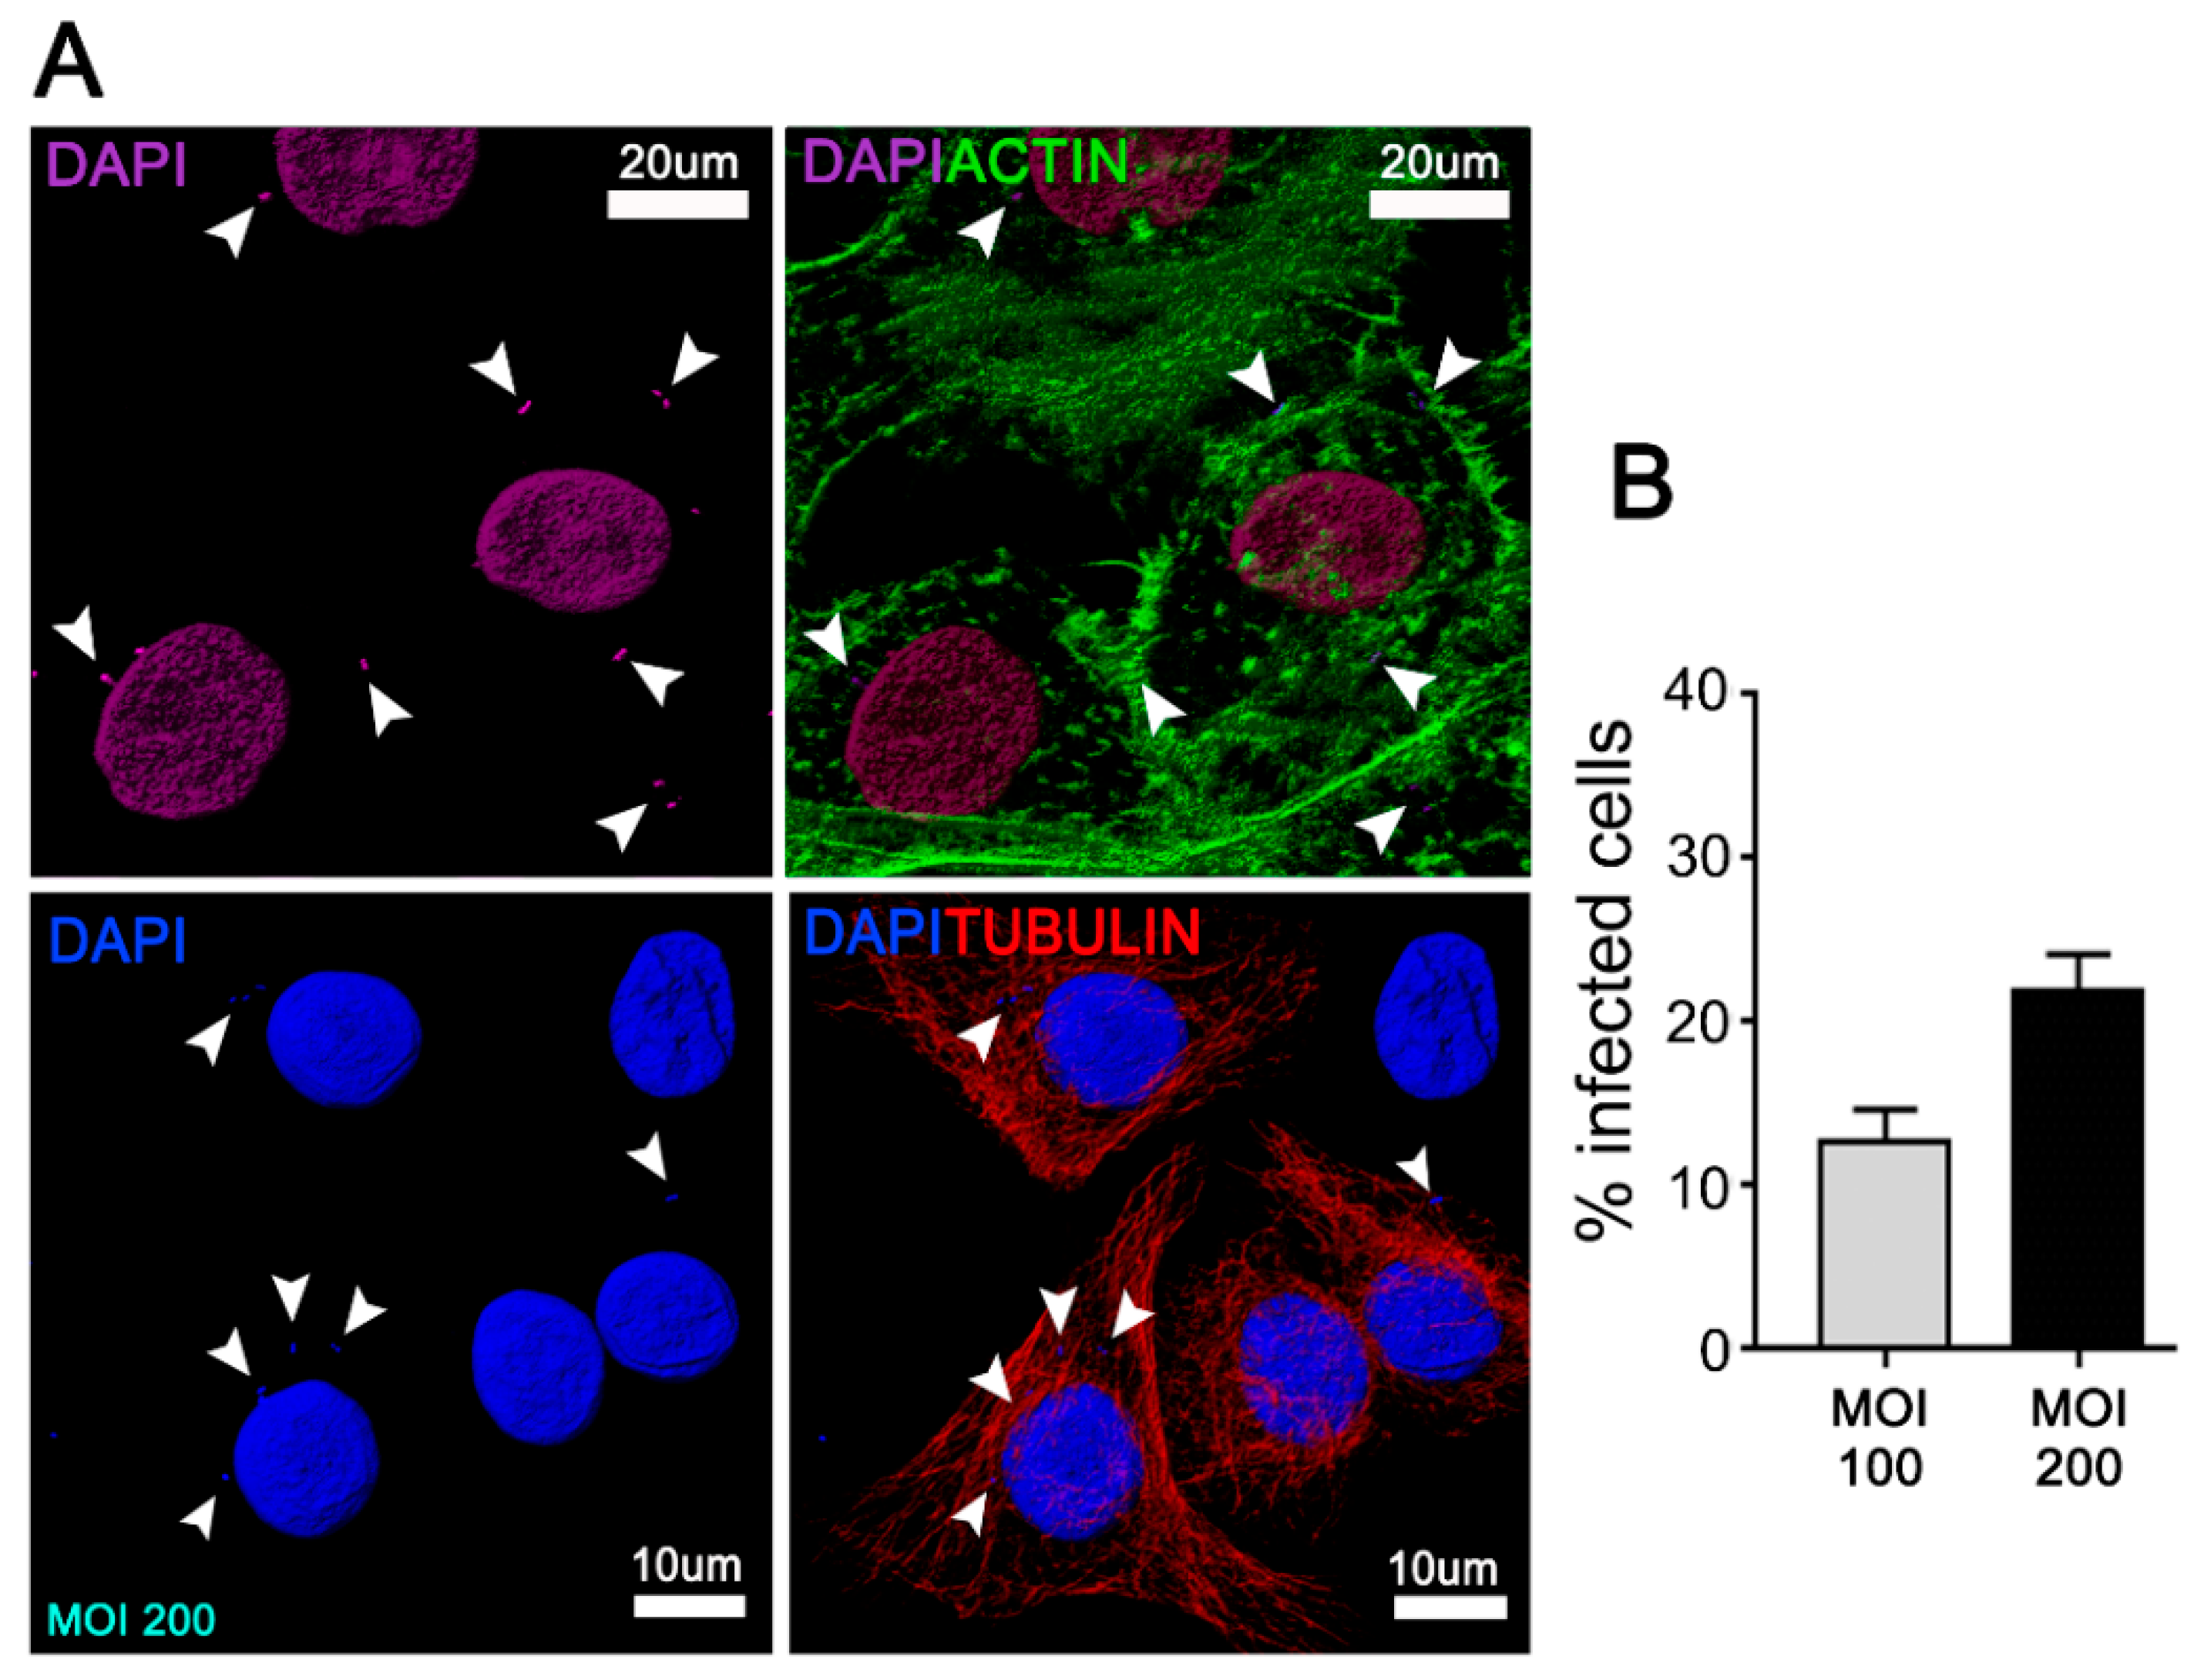
Abstract
:1. Introduction
2. Materials and Methods
2.1. Cell Line and Culture Conditions
2.2. Bacterial Strain and LPS Purification
2.3. In Vitro Infection Model
2.4. Total RNA Extraction and Reverse Transcriptase Polymerase Chain Reaction (RT-PCR)
2.5. Immunoblot Assays
2.6. Indirect Immunofluorescence Confocal Assays
2.7. Immunofluorescence Colocalization Analysis
2.8. Algorithm-Based Autophagosomes Detection
2.9. Lysosomes Alkalinization and Inhibition of the Downstream Autophagic Activity
2.10. Cell Viability Analysis
2.11. Statistical Analysis
3. Results
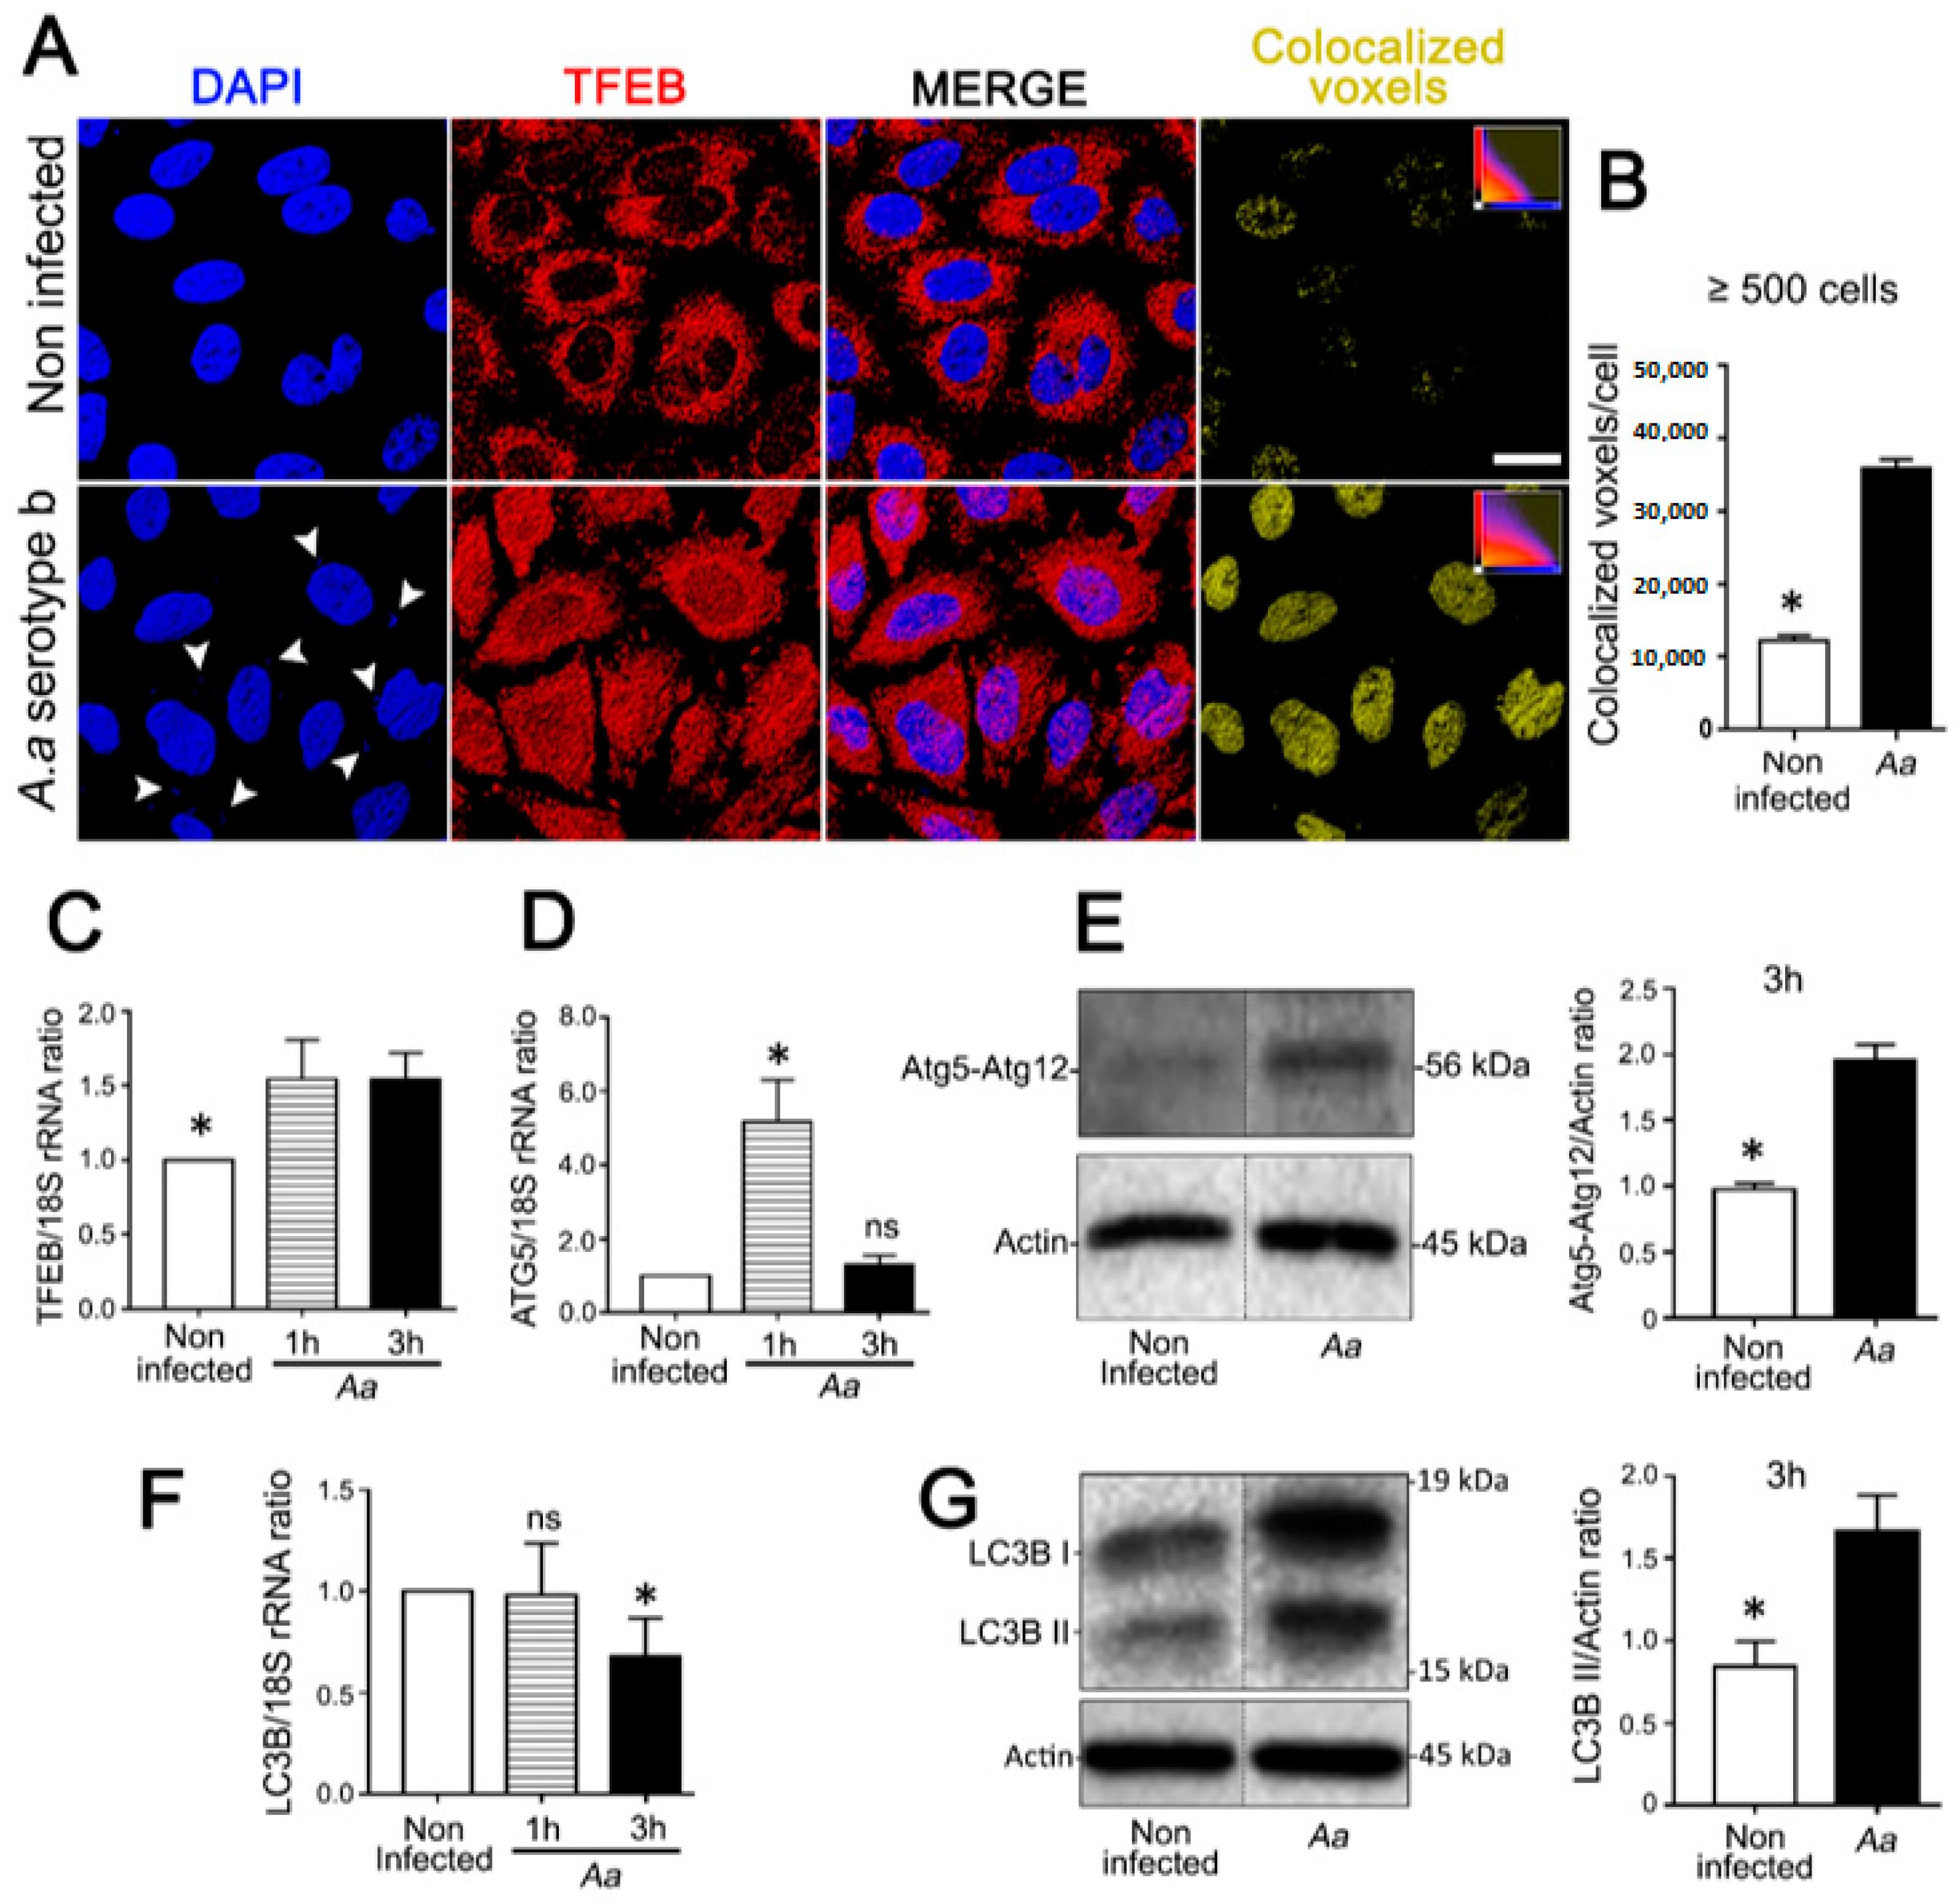
3.1. A. Actinomycetemcomitans Induces Autophagy in JEKs
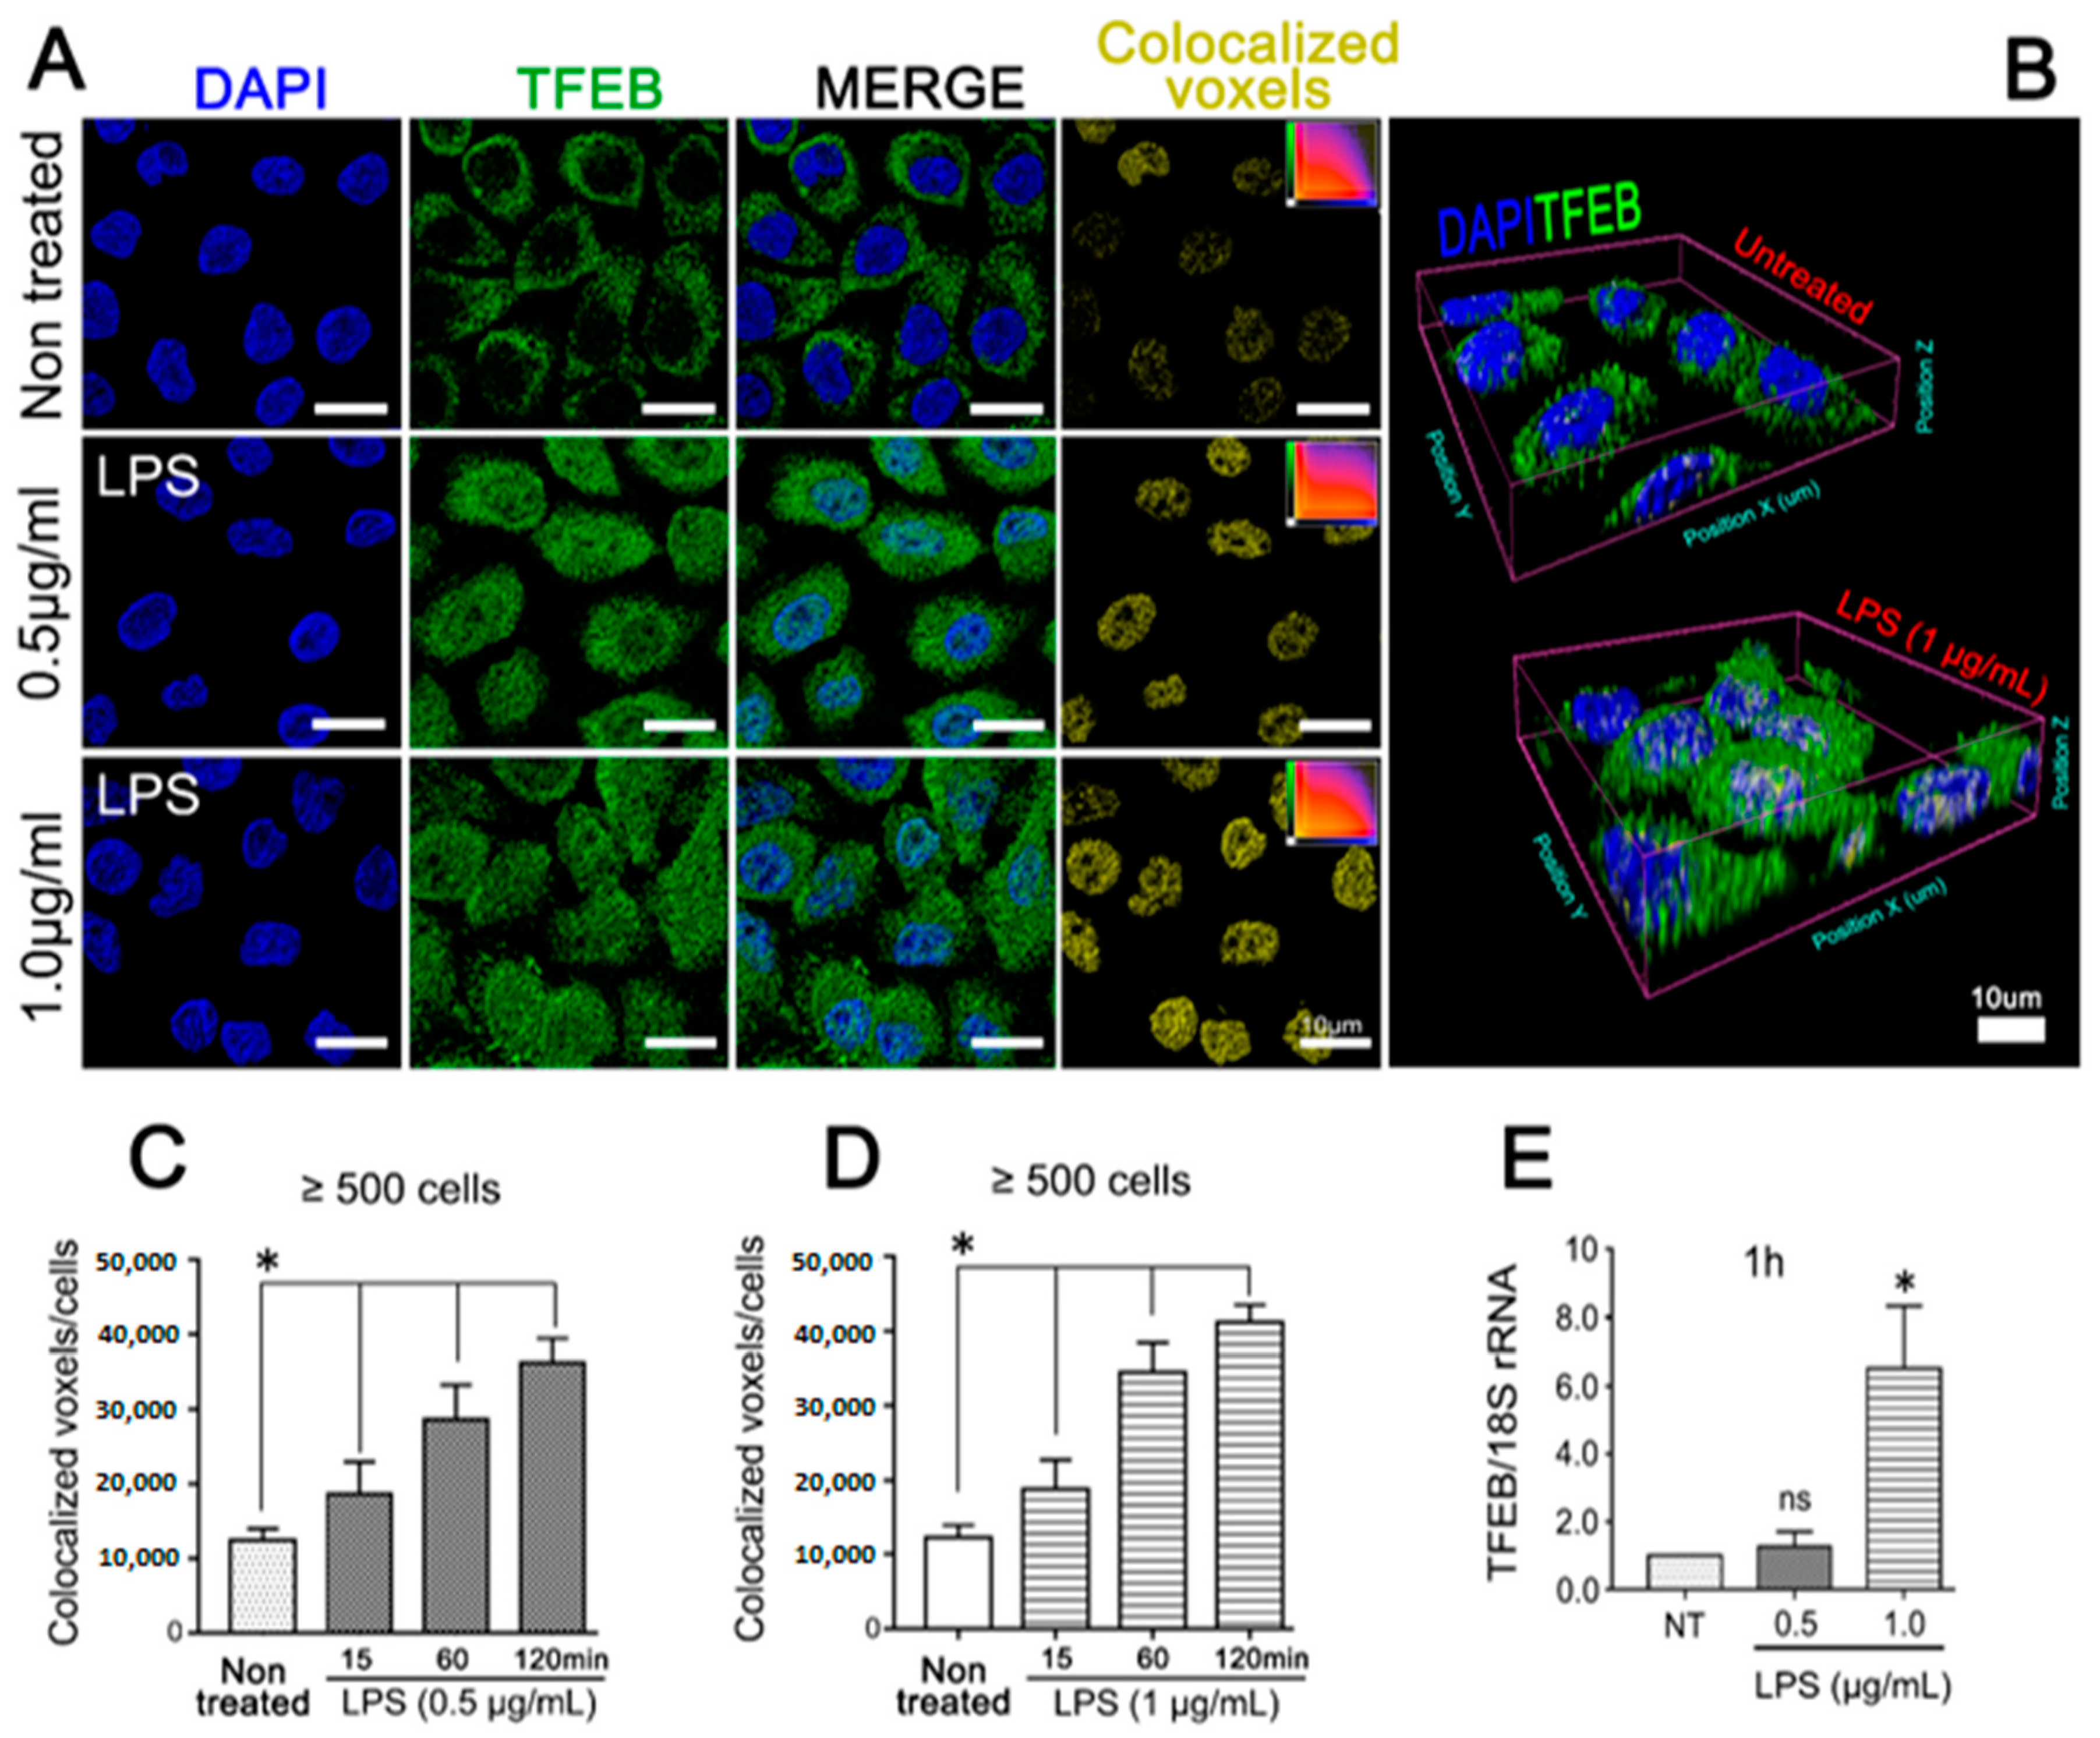
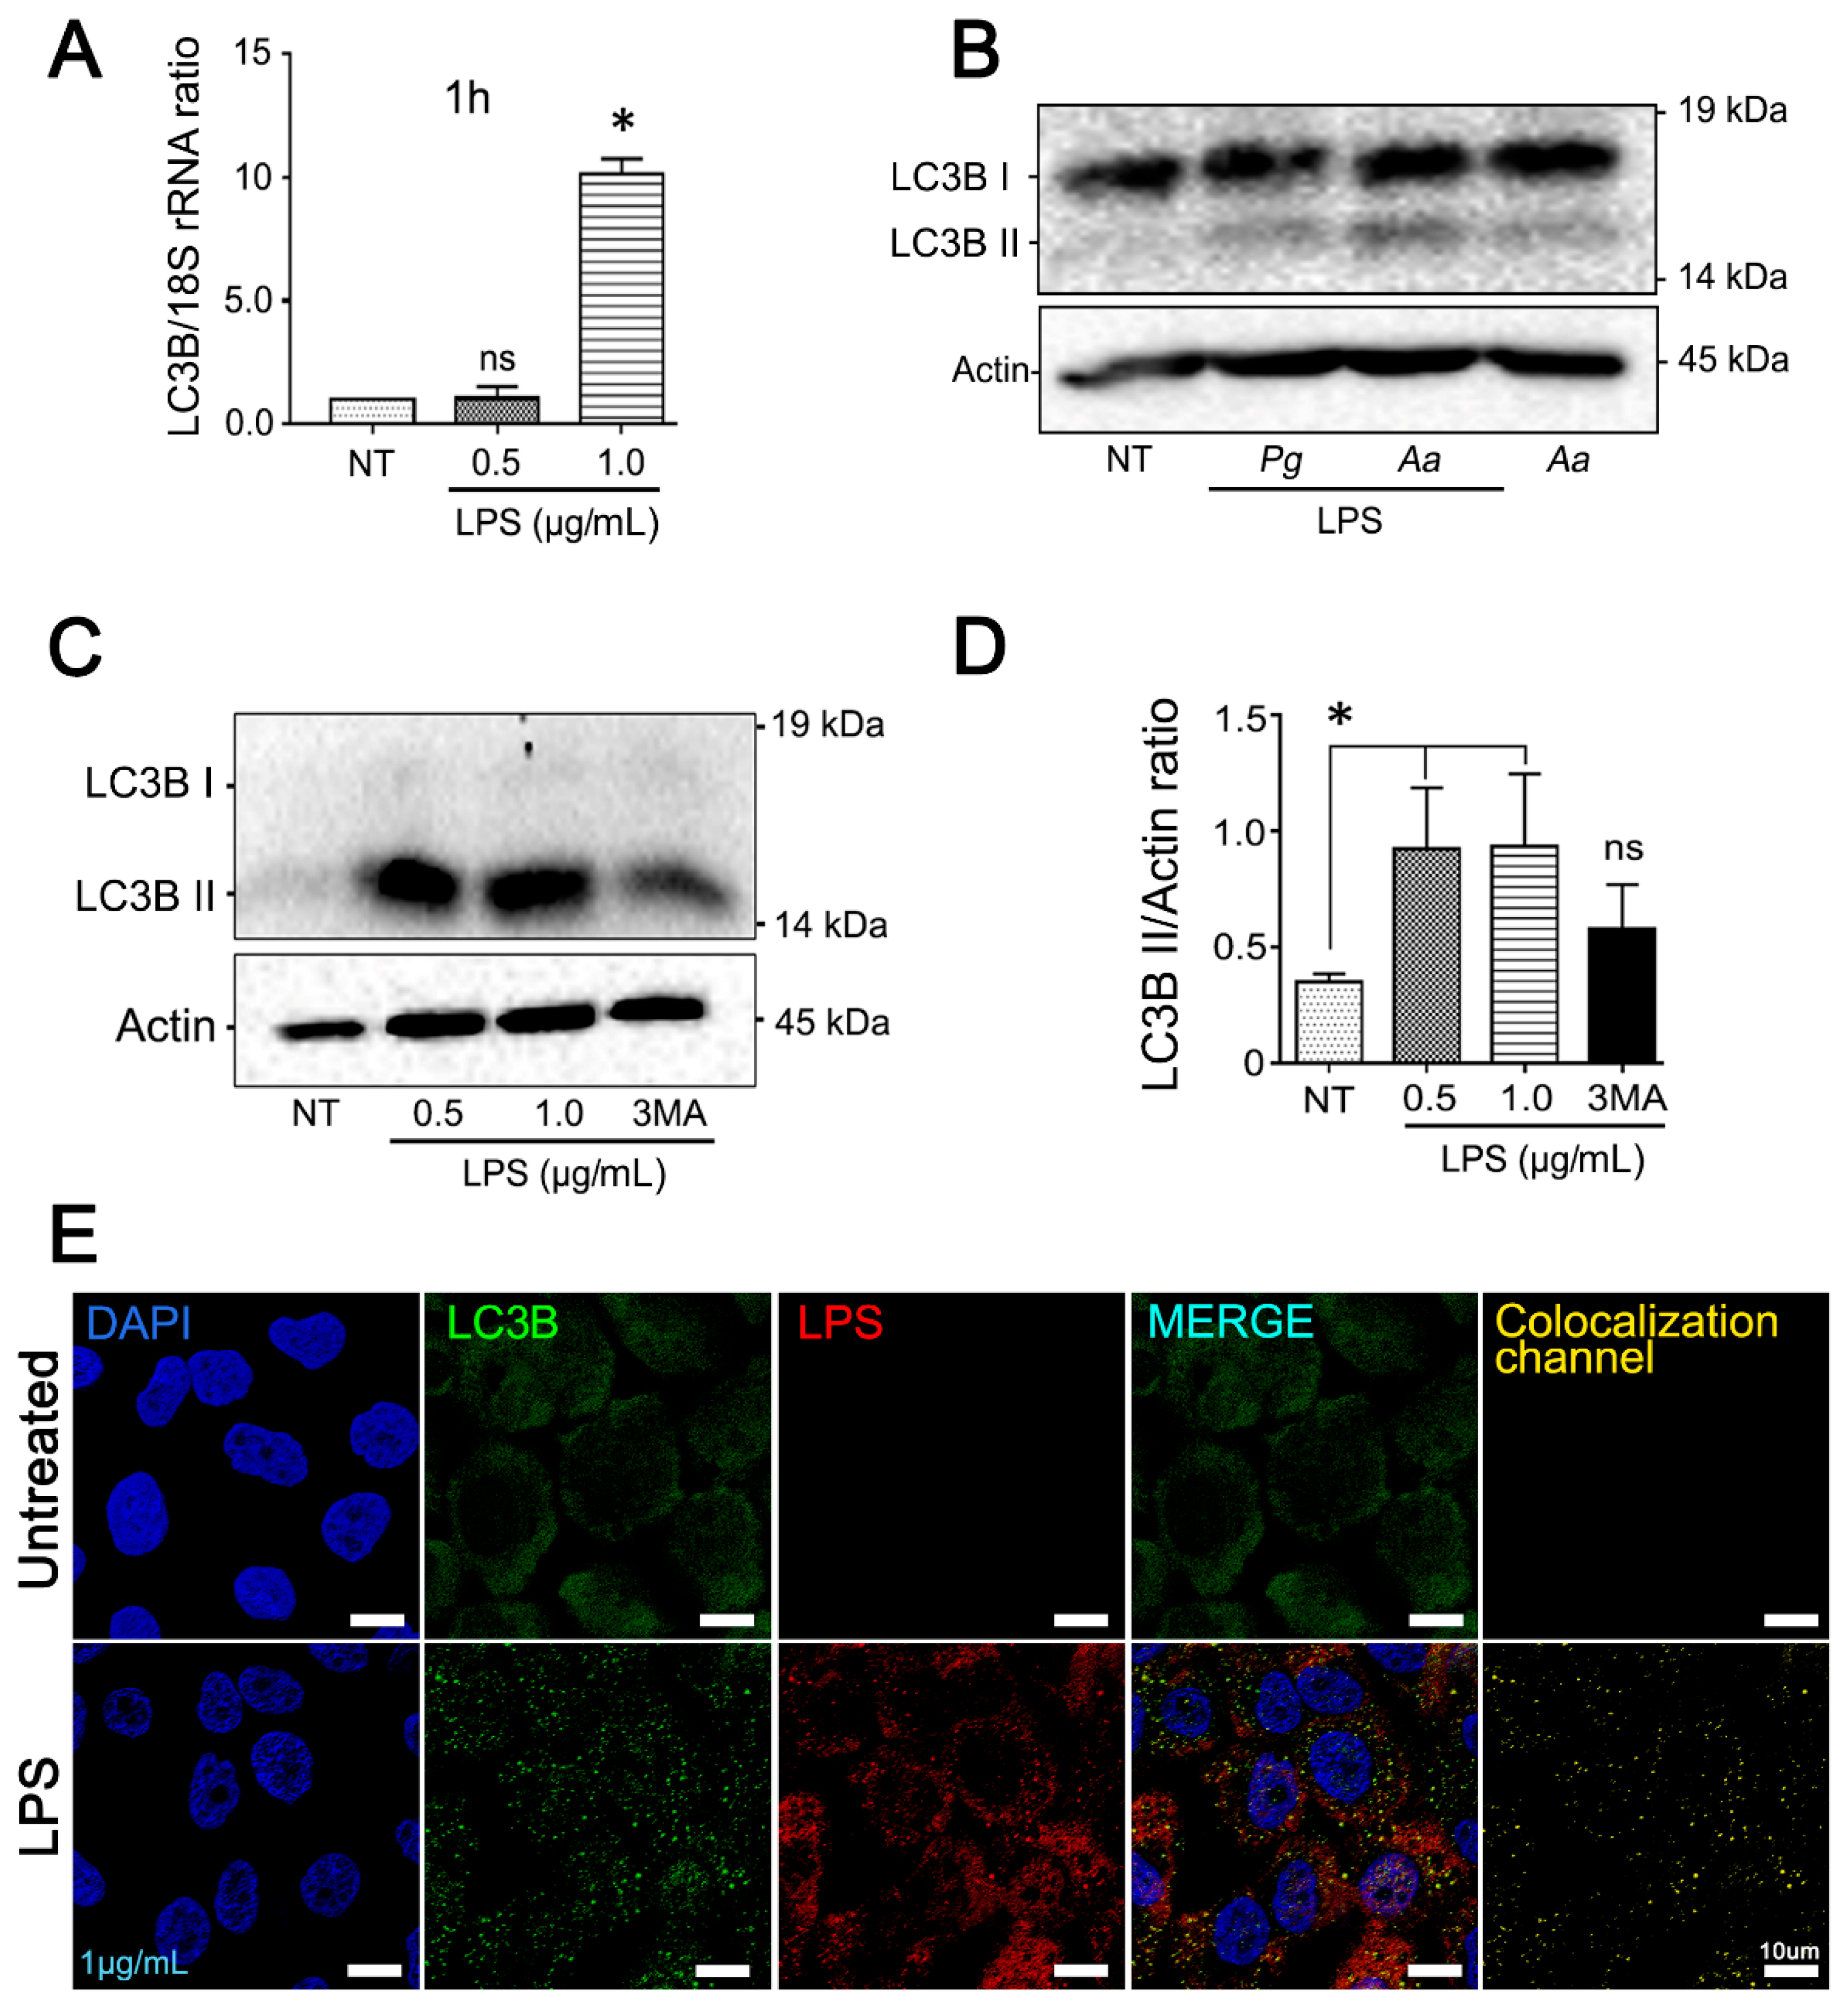
3.2. Purified LPS from A. Actinomycetemcomitans Induces TFEB Nuclear Translocation and Biogenesis of LC3-Positive Vesicles in JEKs
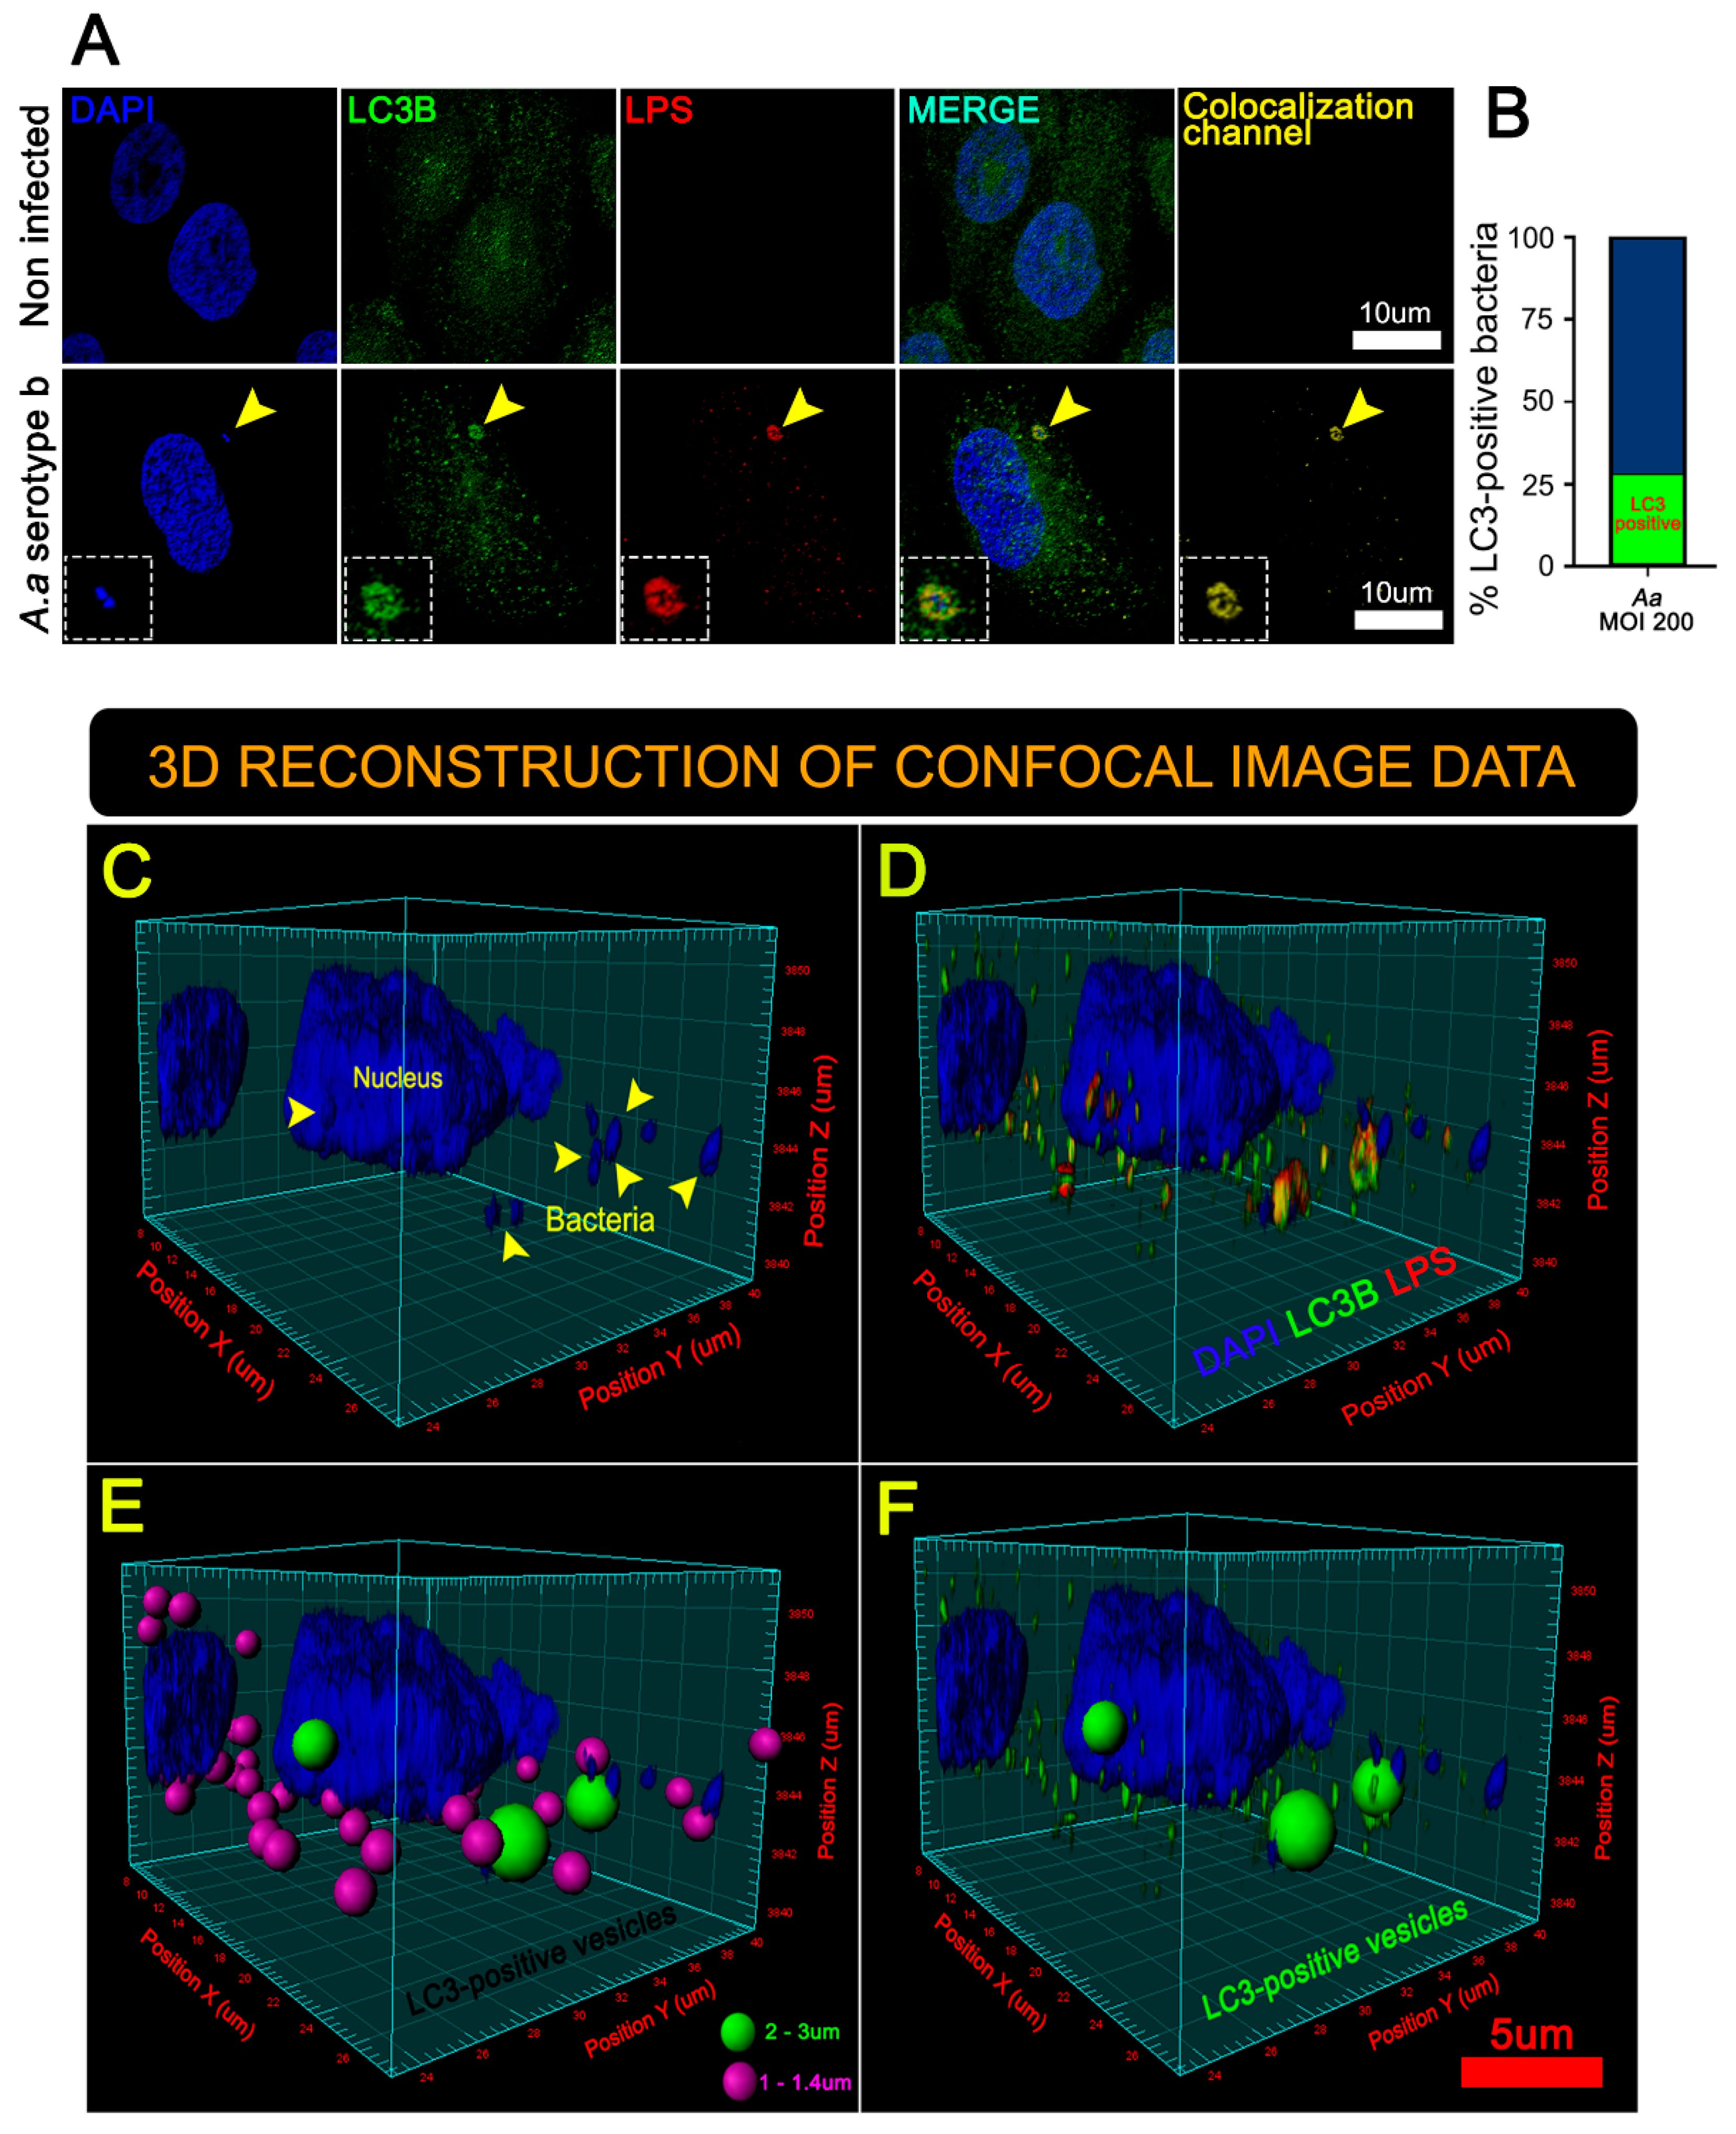
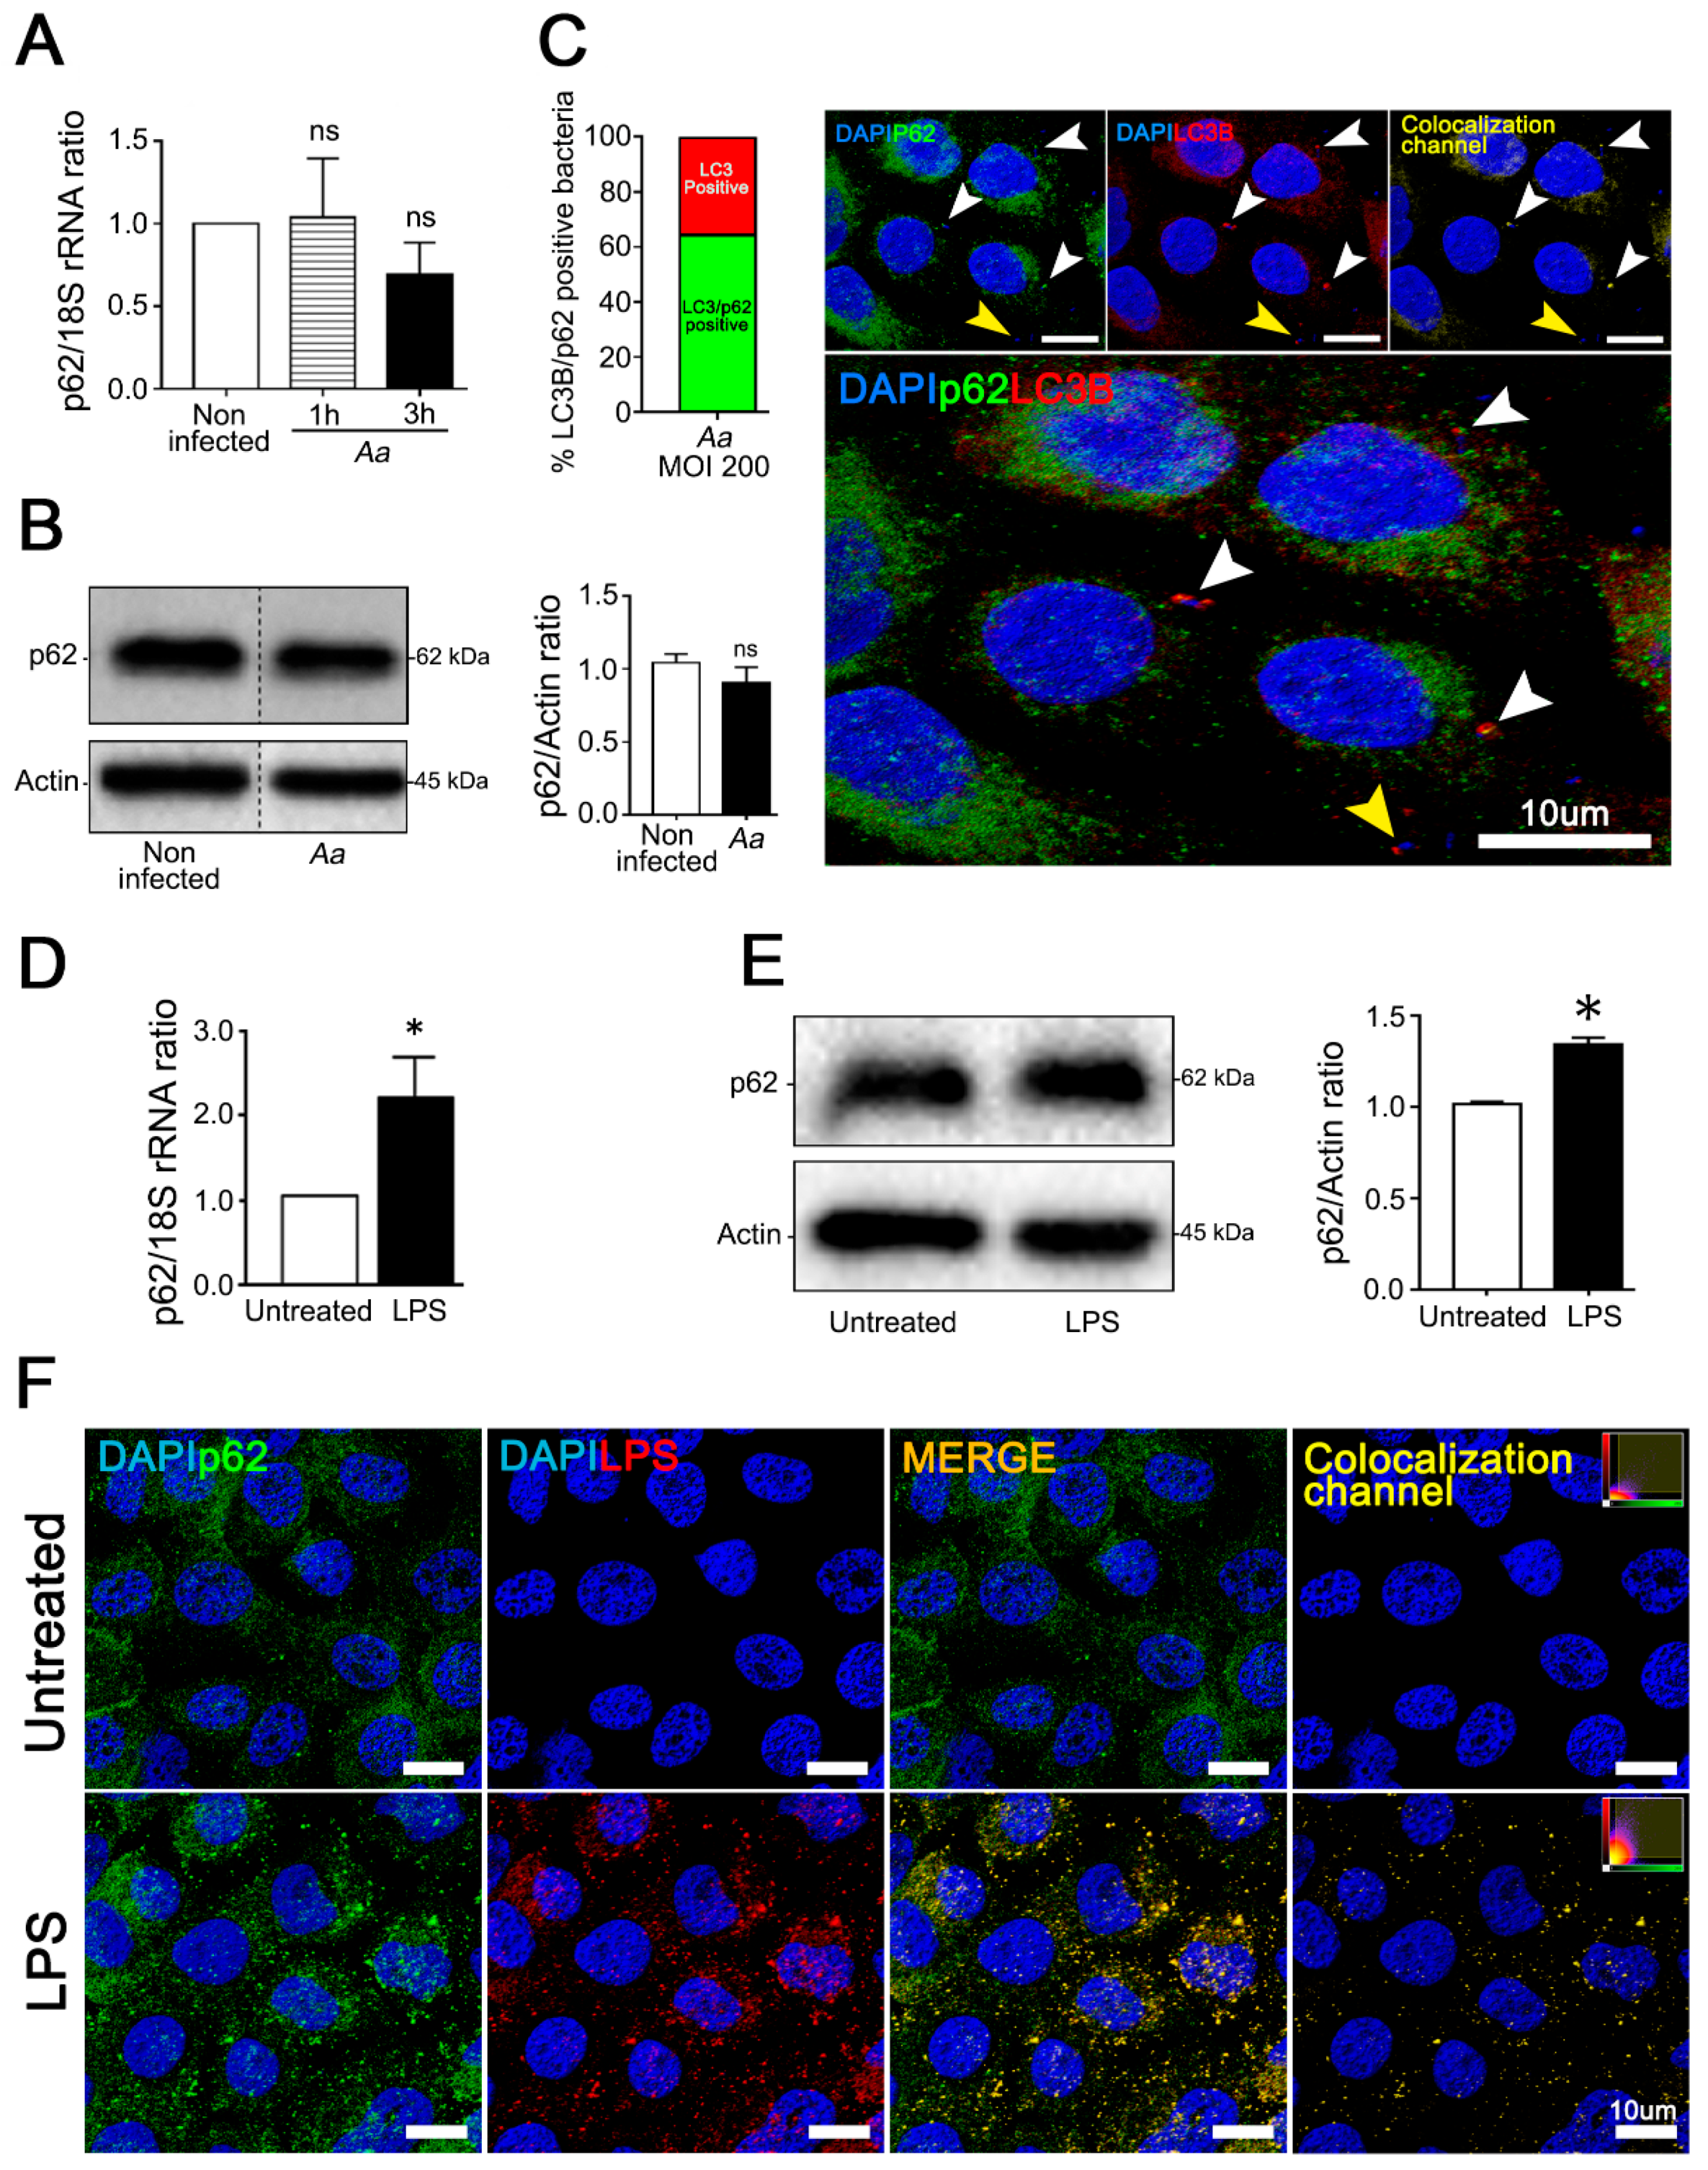
3.3. A. Actinomycetemcomitans Induces Selective Autophagy Mediated by p62/SQSTM1
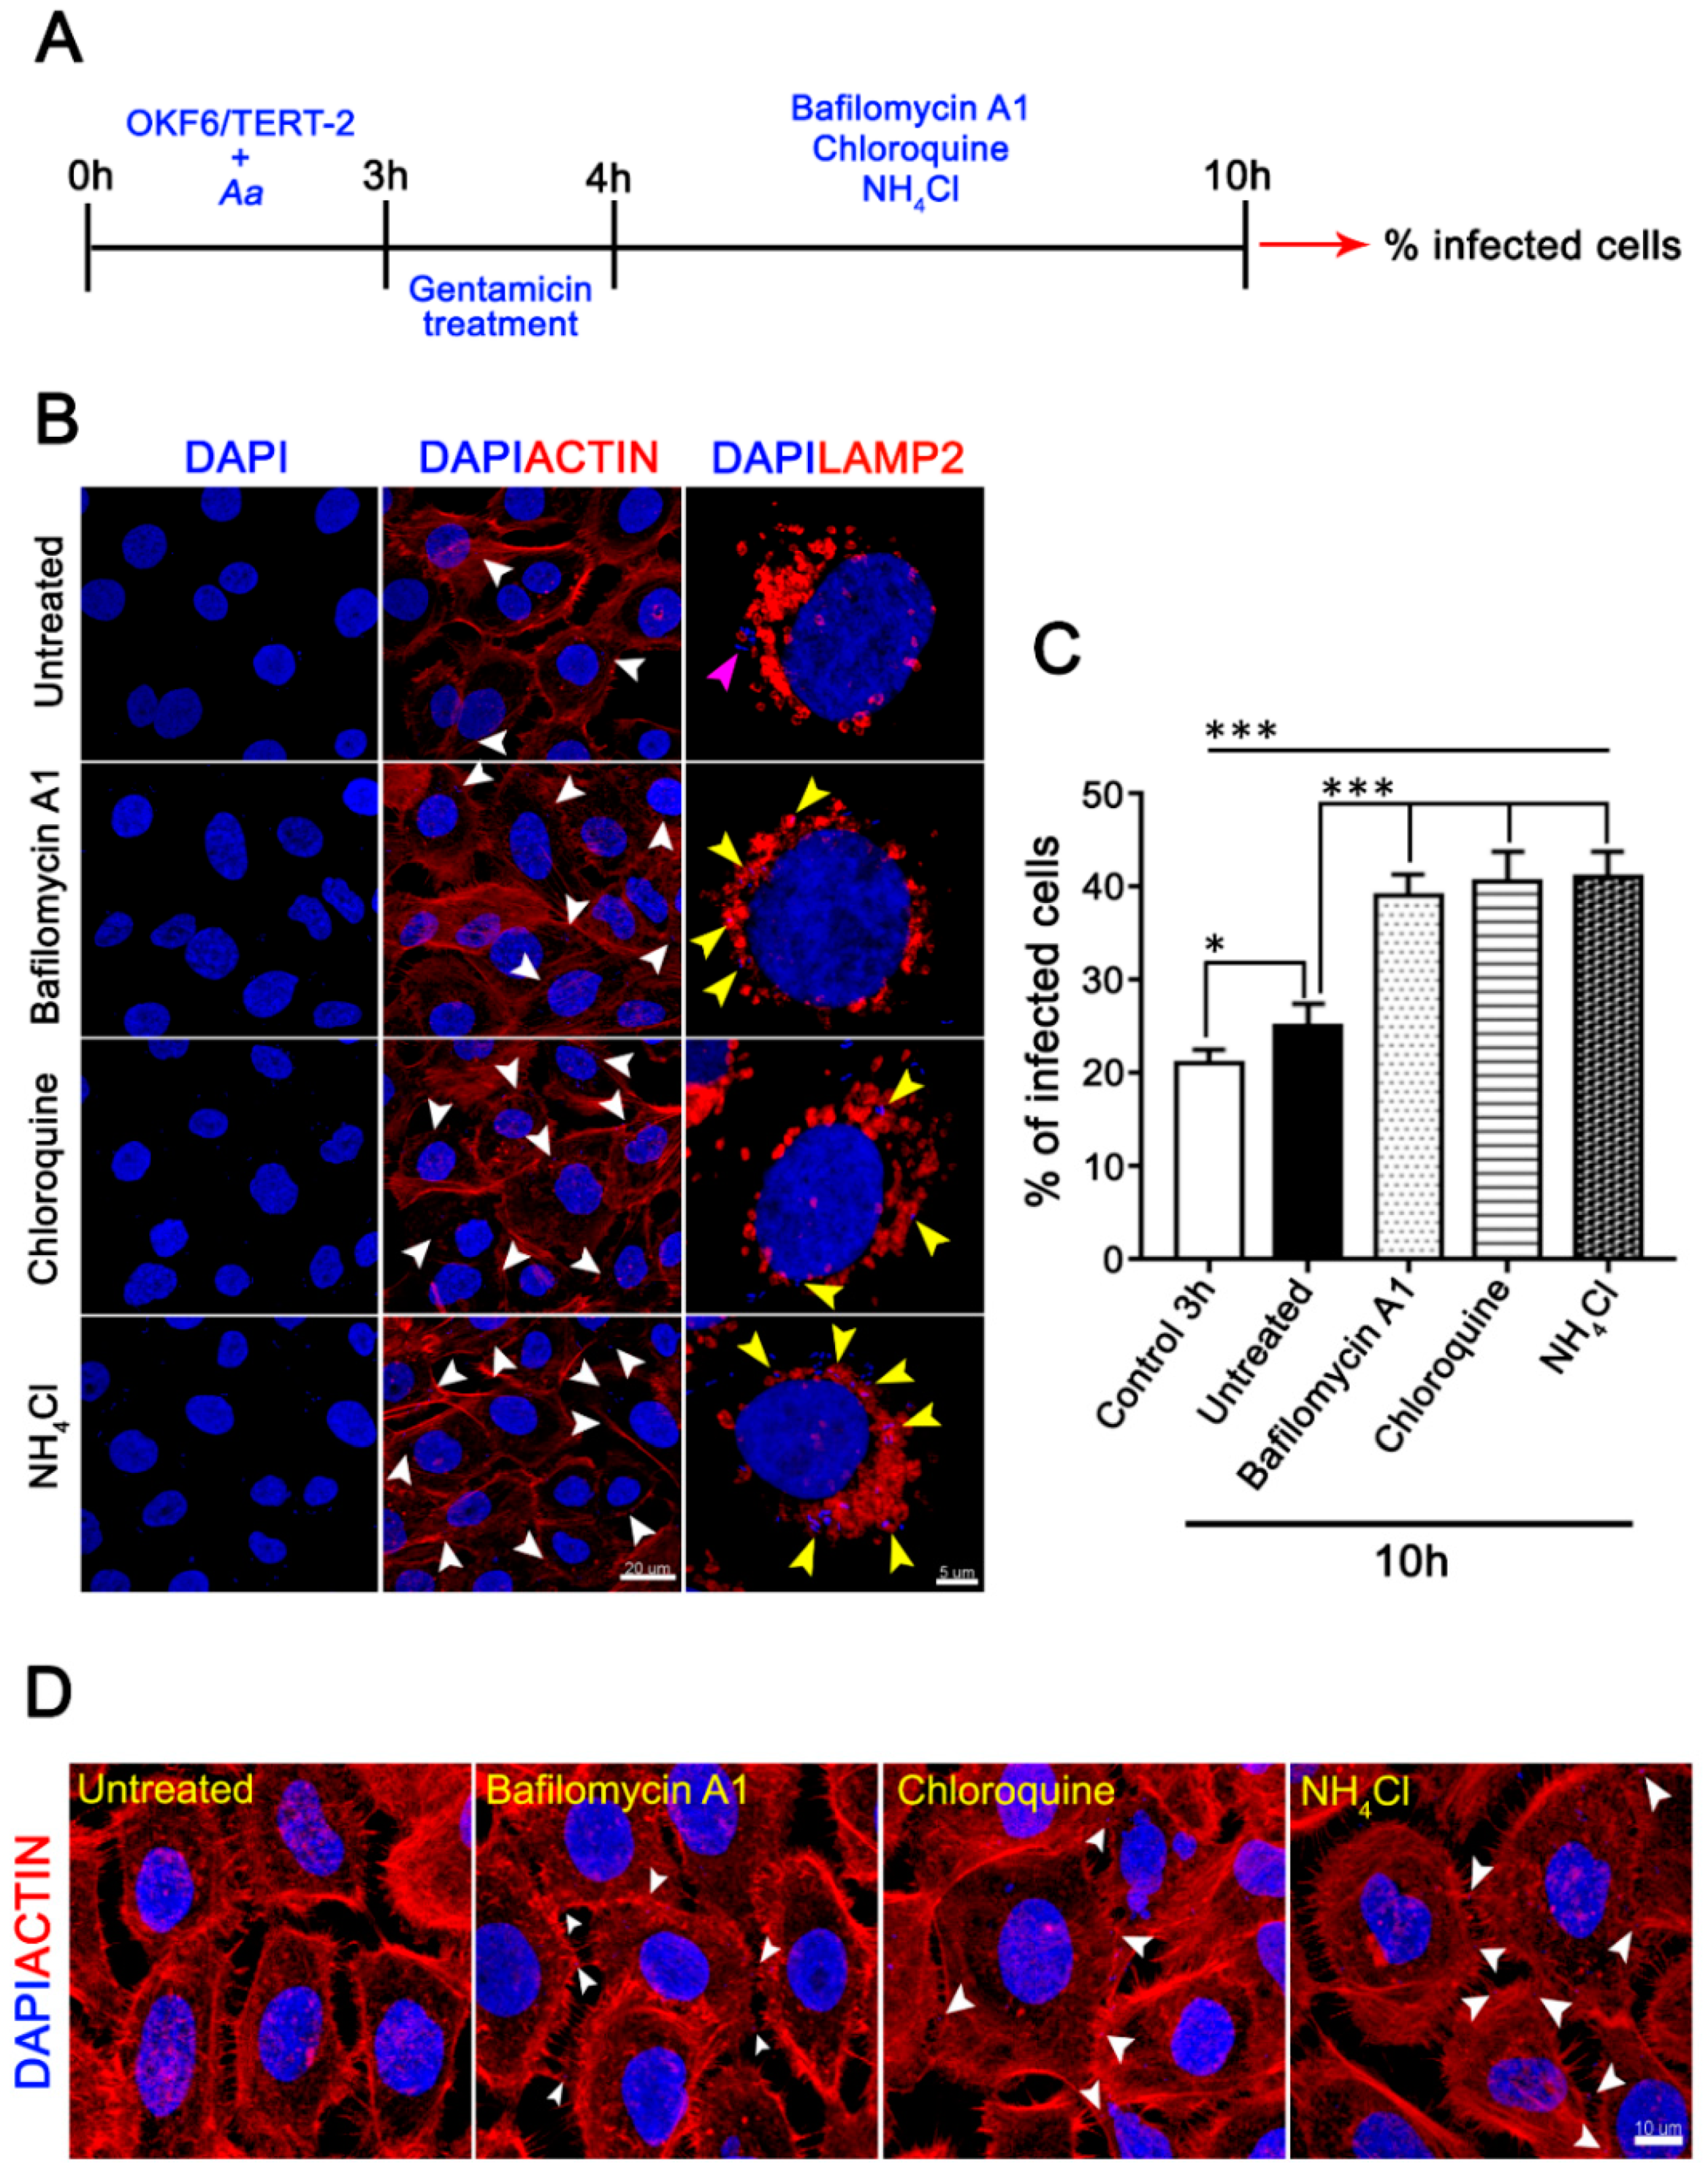
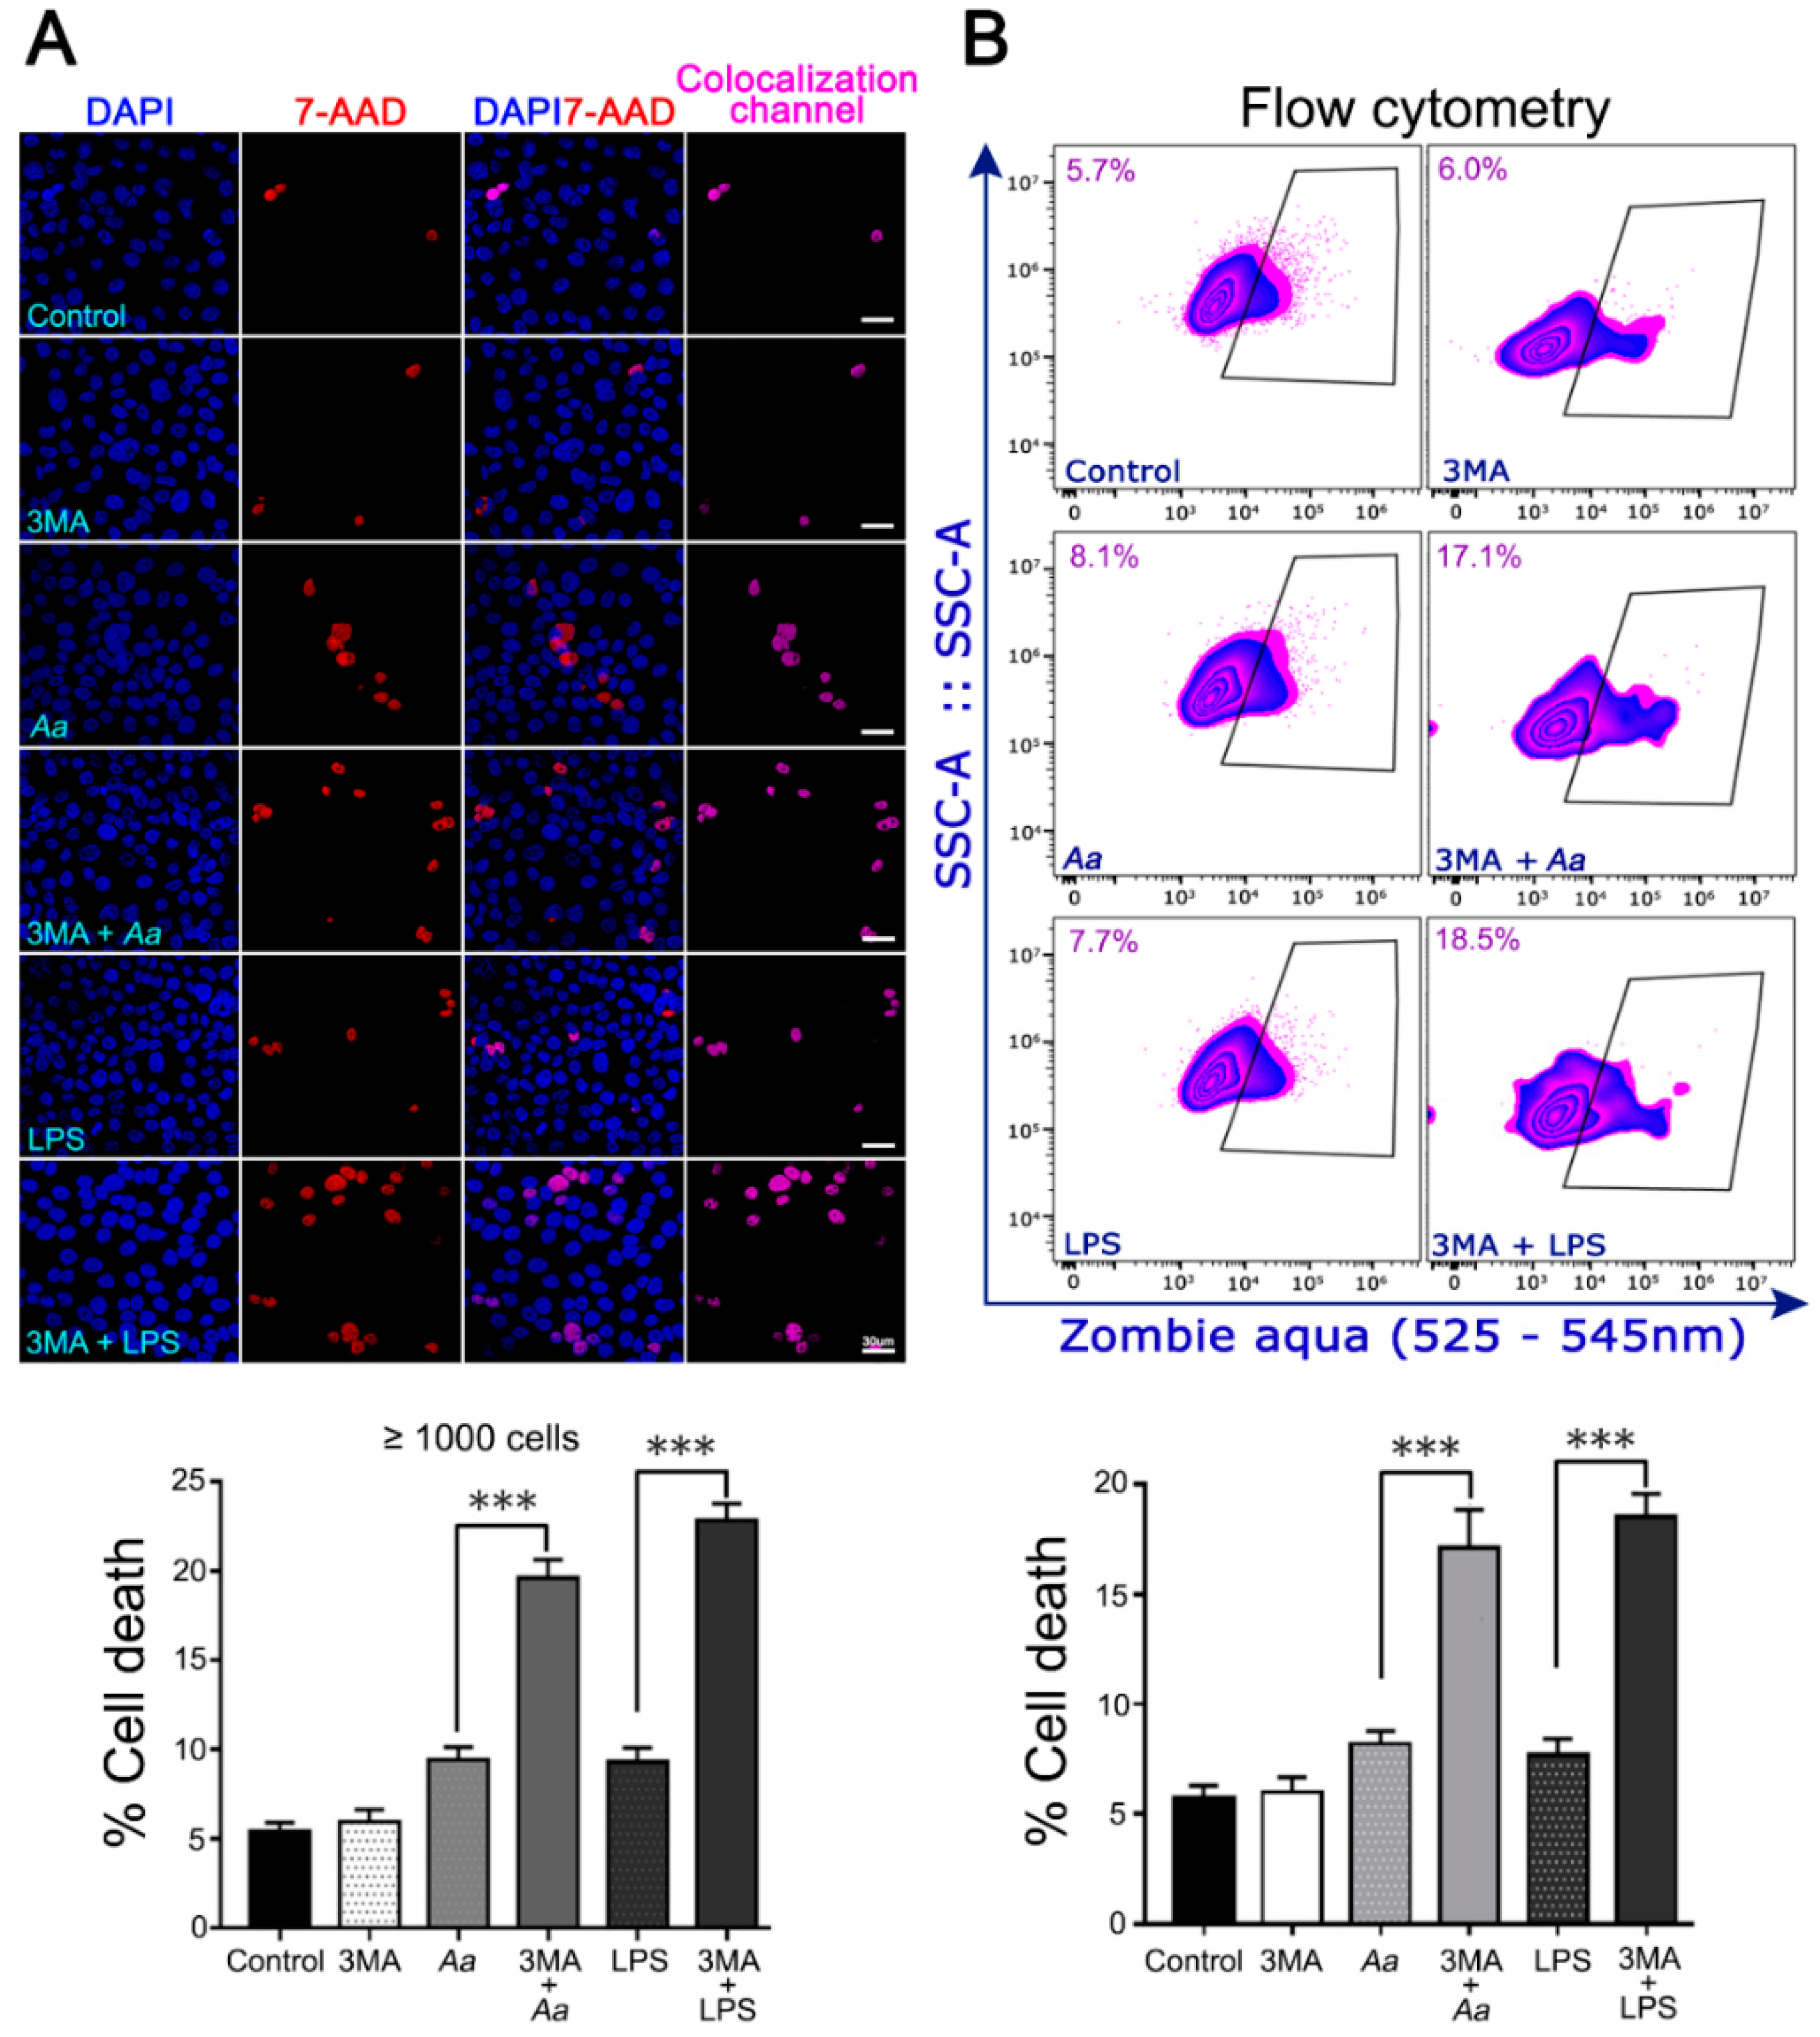
3.4. The Pharmacological Inhibition of Autophagy Increases the Infected Cell Number and the Cell-Death of A. Actinomycetemcomitans-Challenged JEKs
4. Discussion
5. Conclusions
Supplementary Materials
Author Contributions
Funding
Acknowledgments
Conflicts of Interest
References
- Ohsumi, Y. Historical landmarks of autophagy research. Cell Res. 2014, 24, 9–23. [Google Scholar] [CrossRef] [Green Version]
- Tan, Y.Q.; Zhang, J.; Zhou, G. Autophagy and its implication in human oral diseases. Autophagy 2017, 13, 225–236. [Google Scholar] [CrossRef] [PubMed] [Green Version]
- Giampieri, F.; Afrin, S.; Forbes-Hernandez, T.Y.; Gasparrini, M.; Cianciosi, D.; Reboredo-Rodriguez, P.; Varela-Lopez, A.; Quiles, J.L.; Battino, M. Autophagy in human health and disease: Novel therapeutic opportunities. Antioxid. Redox Signal. 2019, 30, 577–634. [Google Scholar] [CrossRef] [PubMed]
- Huang, J.; Brumell, J.H. Bacteria-autophagy interplay: A battle for survival. Nat. Rev. Microbiol. 2014, 12, 101–114. [Google Scholar] [CrossRef] [PubMed]
- Mizushima, N.; Yoshimori, T.; Levine, B. Methods in mammalian autophagy research. Cell 2010, 140, 313–326. [Google Scholar] [CrossRef] [Green Version]
- Klionsky, D.J.; Schulman, B.A. Dynamic regulation of macroautophagy by distinctive ubiquitin-like proteins. Nat. Struct. Mol. Biol. 2014, 21, 336–345. [Google Scholar] [CrossRef]
- Füllgrabe, J.; Ghislat, G.; Cho, D.H.; Rubinsztein, D.C. Transcriptional regulation of mammalian autophagy at a glance. J. Cell Sci. 2016, 129, 3059–3066. [Google Scholar] [CrossRef] [Green Version]
- Jo, E.K.; Yuk, J.M.; Shin, D.M.; Sasakawa, C. Roles of autophagy in elimination of intracellular bacterial pathogens. Front. Immunol. 2013, 4, 97. [Google Scholar] [CrossRef] [Green Version]
- Curtis, M.A.; Zenobia, C.; Darveau, R.P. The relationship of the oral microbiotia to periodontal health and disease. Cell Host Microbe 2011, 10, 302–306. [Google Scholar] [CrossRef] [Green Version]
- Hajishengallis, G. Periodontitis: From microbial immune subversion to systemic inflammation. Nat. Rev. Immunol. 2015, 15, 30–44. [Google Scholar] [CrossRef]
- Newman, M.G.; Takei, H.; Klokkevold, P.R.; Carranza, F.A. Carranza’s Clinical Periodontology-E-Book: Expert Consult: Online; Elsevier Health Sciences: Amsterdam, The Netherlands, 2014. [Google Scholar]
- Tomita, S.; Komiya-Ito, A.; Imamura, K.; Kita, D.; Ota, K.; Takayama, S.; Makino-Oi, A.; Kinumatsu, T.; Ota, M.; Saito, A. Prevalence of Aggregatibacter actinomycetemcomitans, Porphyromonas gingivalis and Tannerella forsythia in Japanese patients with generalized chronic and aggressive periodontitis. Microb. Pathog. 2013, 61–62, 11–15. [Google Scholar] [CrossRef] [PubMed]
- Könönen, E.; Müller, H.P. Microbiology of aggressive periodontitis. Periodontology 2000 2014, 65, 46–78. [Google Scholar] [CrossRef] [PubMed]
- Tuuli, A.; Laura, K.; Terhi, M.; Jan, O.; Riikka, I. Aggregatibacter actinomycetemcomitans LPS binds human interleukin-8. J. Oral Microbiol. 2018, 11, 1549931. [Google Scholar] [CrossRef] [Green Version]
- Brígido, J.A.; da Silveira, V.R.; Rego, R.O.; Nogueira, N.A. Serotypes of Aggregatibacter actinomycetemcomitans in relation to periodontal status and geographic origin of individuals-a review of the literature. Med. Oral Patol. Oral Cir. Bucal. 2014, 19, e184–e191. [Google Scholar] [CrossRef]
- Henderson, B.; Nair, S.P.; Ward, J.M.; Wilson, M. Molecular pathogenicity of the oral opportunistic pathogen Actinobacillus actinomycetemcomitans. Annu. Rev. Microbiol. 2003, 57, 29–55. [Google Scholar] [CrossRef]
- Herbert, B.A.; Novince, C.M.; Kirkwood, K.L. Aggregatibacter actinomycetemcomitans, a potent immunoregulator of the periodontal host defense system and alveolar bone homeostasis. Mol. Oral Microbiol. 2016, 31, 207–227. [Google Scholar] [CrossRef] [Green Version]
- Belibasakis, G.N.; Maula, T.; Bao, K.; Lindholm, M.; Bostanci, N.; Oscarsson, J.; Ihalin, R.; Johansson, A. Virulence and pathogenicity properties of Aggregatibacter actinomycetemcomitans. Pathogens 2019, 8, 222. [Google Scholar] [CrossRef] [Green Version]
- Groeger, S.E.; Meyle, J. Epithelial barrier and oral bacterial infection. Periodontology 2000 2015, 69, 46–67. [Google Scholar] [CrossRef]
- Nibali, L.; Donos, N. Periodontitis and redox status: A review. Curr. Pharm. Des. 2013, 19, 2687–2697. [Google Scholar] [CrossRef]
- Liu, C.; Mo, L.; Niu, Y.; Li, X.; Zhou, X.; Xu, X. The role of reactive oxygen species and autophagy in periodontitis and their potential linkage. Front. Physiol. 2017, 8, 439. [Google Scholar] [CrossRef]
- Song, Z.C.; Zhou, W.; Shu, R.; Ni, J. Hypoxia induces apoptosis and autophagic cell death in human periodontal ligament cells through HIF-1α pathway. Cell Prolif. 2012, 45, 239–248. [Google Scholar] [CrossRef] [PubMed]
- Lorenzo-Pouso, A.I.; Castelo-Baz, P.; Pérez-Sayáns, M.; Lim, J.; Leira, Y. Autophagy in periodontal disease: Evidence from a literature review. Arch. Oral Biol. 2019, 102, 55–64. [Google Scholar] [CrossRef] [PubMed]
- Bullon, P.; Cordero, M.D.; Quiles, J.L.; Ramirez-Tortosa, M.E.C.; Gonzalez-Alonso, A.; Alfonsi, S.; García-Marín, R.; de Miguel, M.; Battino, M. Autophagy in periodontitis patients and gingival fibroblasts: Unraveling the link between chronic diseases and inflammation. BMC Med. 2012, 10, 122. [Google Scholar] [CrossRef] [PubMed] [Green Version]
- Díaz-Zúñiga, J.; Yáñez, J.P.; Alvarez, C.; Melgar-Rodríguez, S.; Hernández, M.; Sanz, M.; Vernal, R. Serotype-dependent response of human dendritic cells stimulated with Aggregatibacter actinomycetemcomitans. J. Clin. Periodontol. 2014, 41, 242–251. [Google Scholar] [CrossRef] [PubMed]
- Díaz-Zúñiga, J.; Melgar-Rodríguez, S.; Alvarez, C.; Monasterio, G.; Benítez, A.; Ciuchi, P.; Díaz, C.; Mardones, J.; Escobar, A.; Sanz, M.; et al. T-lymphocyte phenotype and function triggered by Aggregatibacter actinomycetemcomitans is serotype-dependent. J. Periodontal. Res. 2015, 50, 824–835. [Google Scholar] [CrossRef]
- Tsai, C.M.; Frasch, C.E. A sensitive silver stain for detecting lipopolysaccharides in polyacrylamide gels. Anal. Biochem. 1982, 119, 115–119. [Google Scholar] [CrossRef]
- Al-Qutub, M.N.; Braham, P.H.; Karimi-Naser, L.M.; Liu, X.; Genco, C.A.; Darveau, R.P. Hemin-dependent modulation of the lipid A structure of Porphyromonas gingivalis lipopolysaccharide. Infect. Immun. 2006, 74, 4474–4485. [Google Scholar] [CrossRef] [Green Version]
- Cortez, C.; Real, F.; Yoshida, N. Lysosome biogenesis/scattering increases host cell susceptibility to invasion by Trypanosoma cruzi metacyclic forms and resistance to tissue culture trypomastigotes. Cell Microbiol. 2016, 18, 748–760. [Google Scholar] [CrossRef] [Green Version]
- Real, F.; Mortara, R.A. The diverse and dynamic nature of Leishmania parasitophorous vacuoles studied by multidimensional imaging. PLoS Negl. Trop. Dis. 2012, 6, e1518. [Google Scholar] [CrossRef] [Green Version]
- Jackson, W.; Yamada, M.; Moninger, T.; Grose, C. Visualization and quantitation of abundant macroautophagy in virus-infected cells by confocal three-dimensional fluorescence imaging. J. Virol. Methods 2013, 193, 244–250. [Google Scholar] [CrossRef] [Green Version]
- Coffey, E.E.; Beckel, J.M.; Laties, A.M.; Mitchell, C.H. Lysosomal alkalization and dysfunction in human fibroblasts with the Alzheimer’s disease-linked presenilin 1 A246E mutation can be reversed with cAMP. Neuroscience 2014, 263, 111–124. [Google Scholar] [CrossRef] [PubMed] [Green Version]
- Thomé, M.P.; Filippi-Chiela, E.C.; Villodre, E.S.; Migliavaca, C.B.; Onzi, G.R.; Felipe, K.B.; Lenz, G. Ratiometric analysis of Acridine Orange staining in the study of acidic organelles and autophagy. J. Cell Sci. 2016, 129, 4622–4632. [Google Scholar] [CrossRef] [PubMed] [Green Version]
- Napolitano, G.; Ballabio, A. TFEB at a glance. J. Cell Sci. 2016, 129, 2475–2481. [Google Scholar] [CrossRef] [PubMed] [Green Version]
- Zhang, Z.; Singh, R.; Aschner, M. Methods for the detection of autophagy in mammalian cells. Curr. Protoc. Toxicol. 2016, 69, 20.12.1–20.12.26. [Google Scholar] [CrossRef]
- Zheng, Y.T.; Shahnazari, S.; Brech, A.; Lamark, T.; Johansen, T.; Brumell, J.H. The adaptor protein p62/SQSTM1 targets invading bacteria to the autophagy pathway. J. Immunol. 2009, 183, 5909–5916. [Google Scholar] [CrossRef] [Green Version]
- Donos, N. The periodontal pocket. Periodontology 2000 2018, 76, 7–15. [Google Scholar] [CrossRef]
- Bosshardt, D.D.; Lang, N.P. The junctional epithelium: From health to disease. J. Dent Res. 2005, 84, 9–20. [Google Scholar] [CrossRef]
- Visvikis, O.; Ihuegbu, N.; Labed, S.A.; Luhachack, L.G.; Alves AM, F.; Wollenberg, A.C.; Stuart, L.M.; Stormo, G.D.; Irazoqui, J.E. Innate host defense requires TFEB-mediated transcription of cytoprotective and antimicrobial genes. Immunity 2014, 40, 896–909. [Google Scholar] [CrossRef] [Green Version]
- Unuma, K.; Aki, T.; Funakoshi, T.; Hashimoto, K.; Uemura, K. Extrusion of mitochondrial contents from lipopolysaccharide-stimulated cells: Involvement of autophagy. Autophagy 2015, 11, 1520–1536. [Google Scholar] [CrossRef] [Green Version]
- Lu, H.; Fan, Y.; Qiao, C.; Liang, W.; Hu, W.; Zhu, T.; Zhang, J.; Chen, Y.E. TFEB inhibits endothelial cell inflammation and reduces atherosclerosis. Sci. Signal. 2017, 10, eaah4214. [Google Scholar] [CrossRef]
- Pasparakis, M. Role of NF-κB in epithelial biology. Immunol. Rev. 2012, 246, 346–358. [Google Scholar] [CrossRef]
- Srinivasan, M.; Kodumudi, K.N.; Galli, D.M. Aggregatibacter actinomycetemcomitans modulates toll-like receptors 2 and 4 in gingival epithelial cells in experimental periodontitis. J. Int. Clin. Dent. Res. Organ. 2010, 2, 24–29. [Google Scholar] [CrossRef]
- Jiao, Y.; Hasegawa, M.; Inohara, N. Emerging roles of immunostimulatory oral bacteria in periodontitis development. Trends Microbiol. 2014, 22, 157–163. [Google Scholar] [CrossRef] [Green Version]
- Thay, B.; Damm, A.; Kufer, T.A.; Wai, S.N.; Oscarsson, J. Aggregatibacter actinomycetemcomitans outer membrane vesicles are internalized in human host cells and trigger NOD1- and NOD2-dependent NF-κB activation. Infect. Immun. 2014, 82, 4034–4046. [Google Scholar] [CrossRef] [Green Version]
- Chung, J.; Kim, S.; Lee, H.A.; Park, M.H.; Song, Y.R.; Na, H.S. Trans-cinnamic aldehyde inhibits Aggregatibacter actinomycetemcomitans-induced inflammation in THP-1-derived macrophages via autophagy activation. J. Periodontol. 2018, 89, 1262–1271. [Google Scholar] [CrossRef]
- Du, L.; Li, Y.; Liu, W. Maresin 1 regulates autophagy and inflammation in human periodontal ligament cells through glycogen synthase kinase-3β/β-catenin pathway under inflammatory conditions. Arch. Oral Biol. 2018, 87, 242–247. [Google Scholar] [CrossRef]
- Hagio-Izaki, K.; Yasunaga, M.; Yamaguchi, M.; Kajiya, H.; Morita, H.; Yoneda, M.; Hirofuji, T.; Ohno, J. Lipopolysaccharide induces bacterial autophagy in epithelial keratinocytes of the gingival sulcus. BMC Cell Biol. 2018, 19, 18. [Google Scholar] [CrossRef]
- Benjamin, J.L.; Sumpter, R.; Levine, B.; Hooper, L.V. Intestinal epithelial autophagy is essential for host defense against invasive bacteria. Cell Host Microbe 2013, 13, 723–734. [Google Scholar] [CrossRef] [Green Version]
- Conway, K.L.; Kuballa, P.; Song, J.H.; Patel, K.K.; Castoreno, A.B.; Yilmaz, O.H.; Jijon, H.B.; Zhang, M.; Aldrich, L.N.; Villablanca, E.J.; et al. Atg16l1 is required for autophagy in intestinal epithelial cells and protection of mice from Salmonella infection. Gastroenterology 2013, 145, 1347–1357. [Google Scholar] [CrossRef] [Green Version]
- Zhang, L.; Hu, W.; Cho, C.H.; Chan, F.K.; Yu, J.; Fitzgerald, J.R.; Cheung, C.K.; Xiao, Z.G.; Shen, J.; Li, L.F.; et al. Reduced lysosomal clearance of autophagosomes promotes survival and colonization of Helicobacter pylori. J. Pathol. 2018, 244, 432–444. [Google Scholar] [CrossRef] [Green Version]
- Beertsen, W.; Willenborg, M.; Everts, V.; Zirogianni, A.; Podschun, R.; Schröder, B.; Eskelinen, E.L.; Saftig, P. Impaired phagosomal maturation in neutrophils leads to periodontitis in lysosomal-associated membrane protein-2 knockout mice. J. Immunol. 2008, 180, 475–482. [Google Scholar] [CrossRef] [Green Version]
- Bélanger, M.; Rodrigues, P.H.; Dunn, W.A.; Progulske-Fox, A. Autophagy: A highway for Porphyromonas gingivalis in endothelial cells. Autophagy 2006, 2, 165–170. [Google Scholar] [CrossRef]
- Rodrigues, P.H.; Bélanger, M.; Dunn, W.; Progulske-Fox, A. Porphyromonas gingivalis and the autophagic pathway: An innate immune interaction? Front. Biosci. 2008, 13, 178–187. [Google Scholar] [CrossRef] [Green Version]
- Jiang, M.; Li, Z.; Zhu, G. The role of autophagy in the pathogenesis of periodontal disease. Oral Dis. 2020, 26, 259–269. [Google Scholar] [CrossRef]
- Lee, H.A.; Song, Y.; Na, H.S.; Chung, J. Role of Aggregatibacter actinomycetemcomitans-induced autophagy in inflammatory response. J. Periodontol. 2020. Available online: https://aap.onlinelibrary.wiley.com/doi/abs/10.1002/JPER.19-0639 (accessed on 9 May 2020). [CrossRef]
- Deretic, V.; Levine, B. Autophagy, immunity, and microbial adaptations. Cell Host Microbe 2009, 5, 527–549. [Google Scholar] [CrossRef] [Green Version]


© 2020 by the authors. Licensee MDPI, Basel, Switzerland. This article is an open access article distributed under the terms and conditions of the Creative Commons Attribution (CC BY) license (http://creativecommons.org/licenses/by/4.0/).
Share and Cite
Vicencio, E.; Cordero, E.M.; Cortés, B.I.; Palominos, S.; Parra, P.; Mella, T.; Henrríquez, C.; Salazar, N.; Monasterio, G.; Cafferata, E.A.; et al. Aggregatibacter actinomycetemcomitans Induces Autophagy in Human Junctional Epithelium Keratinocytes. Cells 2020, 9, 1221. https://doi.org/10.3390/cells9051221
Vicencio E, Cordero EM, Cortés BI, Palominos S, Parra P, Mella T, Henrríquez C, Salazar N, Monasterio G, Cafferata EA, et al. Aggregatibacter actinomycetemcomitans Induces Autophagy in Human Junctional Epithelium Keratinocytes. Cells. 2020; 9(5):1221. https://doi.org/10.3390/cells9051221
Chicago/Turabian StyleVicencio, Emiliano, Esteban M. Cordero, Bastián I. Cortés, Sebastián Palominos, Pedro Parra, Tania Mella, Constanza Henrríquez, Nelda Salazar, Gustavo Monasterio, Emilio A. Cafferata, and et al. 2020. "Aggregatibacter actinomycetemcomitans Induces Autophagy in Human Junctional Epithelium Keratinocytes" Cells 9, no. 5: 1221. https://doi.org/10.3390/cells9051221