
Pulmonary Arteriovenous Pressure Gradient and Time-Averaged Mean Velocity of Small Pulmonary Arteries Can Serve as Sensitive Biomarkers in the Diagnosis of Pulmonary Arterial Hypertension: A Preclinical Study by 4D-Flow MRI

 , , ,
, , ,
Abstract
:
1. Introduction
2. Materials and Methods
- Animal model: A total of 27 male Sprague Dawley rats (Charles River Laboratories, Sulzfeld, Germany) with an average weight of 330 ± 39.9 g were included in the study and divided into three different experimental groups: (A) Baseline (n = 11, with a nuchal subcutaneous injection of 300 µL NaCl 0.9%); (B) Severe PAH (n = 8, with a single-dose subcutaneous injection of 60 mg/kg monocrotaline—Carl Roth, Karlsruhe, Germany—dissolved in 300 µL NaCl 0.9%); and (C) Moderate PAH (n = 8, with the same medication as the severe PAH group and an additional oral application of 15 mg/kg macitentan—Actelion Pharmaceuticals Ltd., Allschwil, Switzerland—from day 14 to 28). All invasive and non-invasive diagnostic procedures were performed 4 weeks after disease induction. The general anesthesia protocol was chosen depending on the diagnostic procedure: all the non-invasive procedures were conducted under inhalation of isoflurane ~3% (due to the long tubing between the vaporizers and the MRI system) to keep the animals’ respiration in the range of 30 to 50 per minute. Perfusion was carried out under deep anesthesia with the intra-peritoneal administration of a single dose of 100 mg/kg body weight of ketamine (volume 450 µL) and 10 mg/kg body weight of xylazine (volume 250 µL). All the experiments were conducted in accordance with approved ethical guidelines (see the section on the Institutional Review Board Statement).
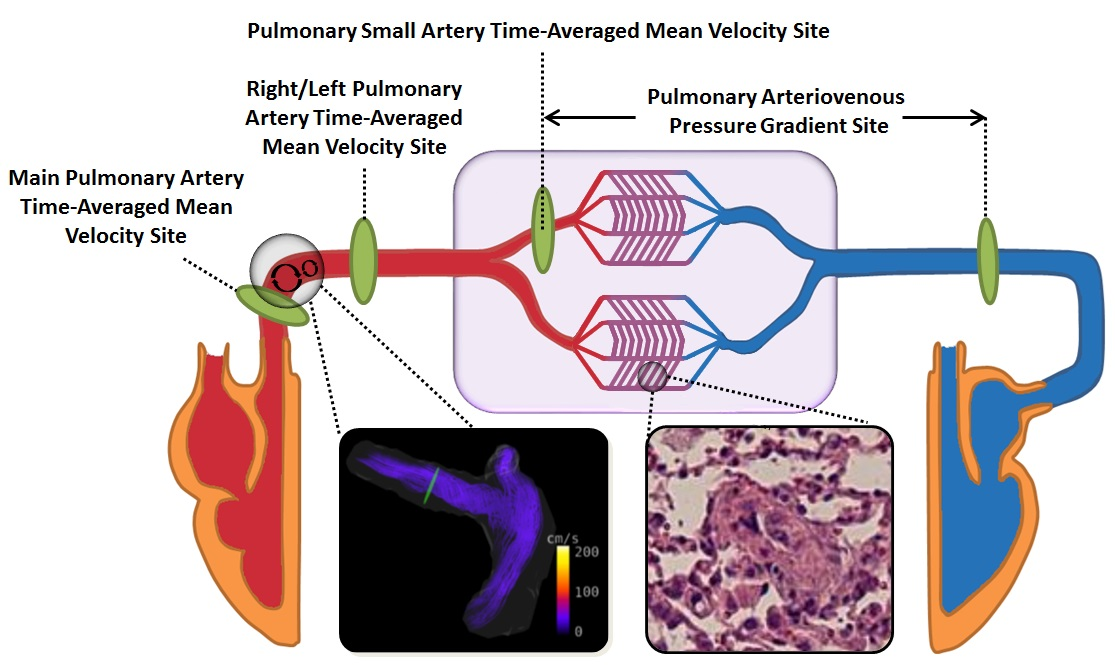
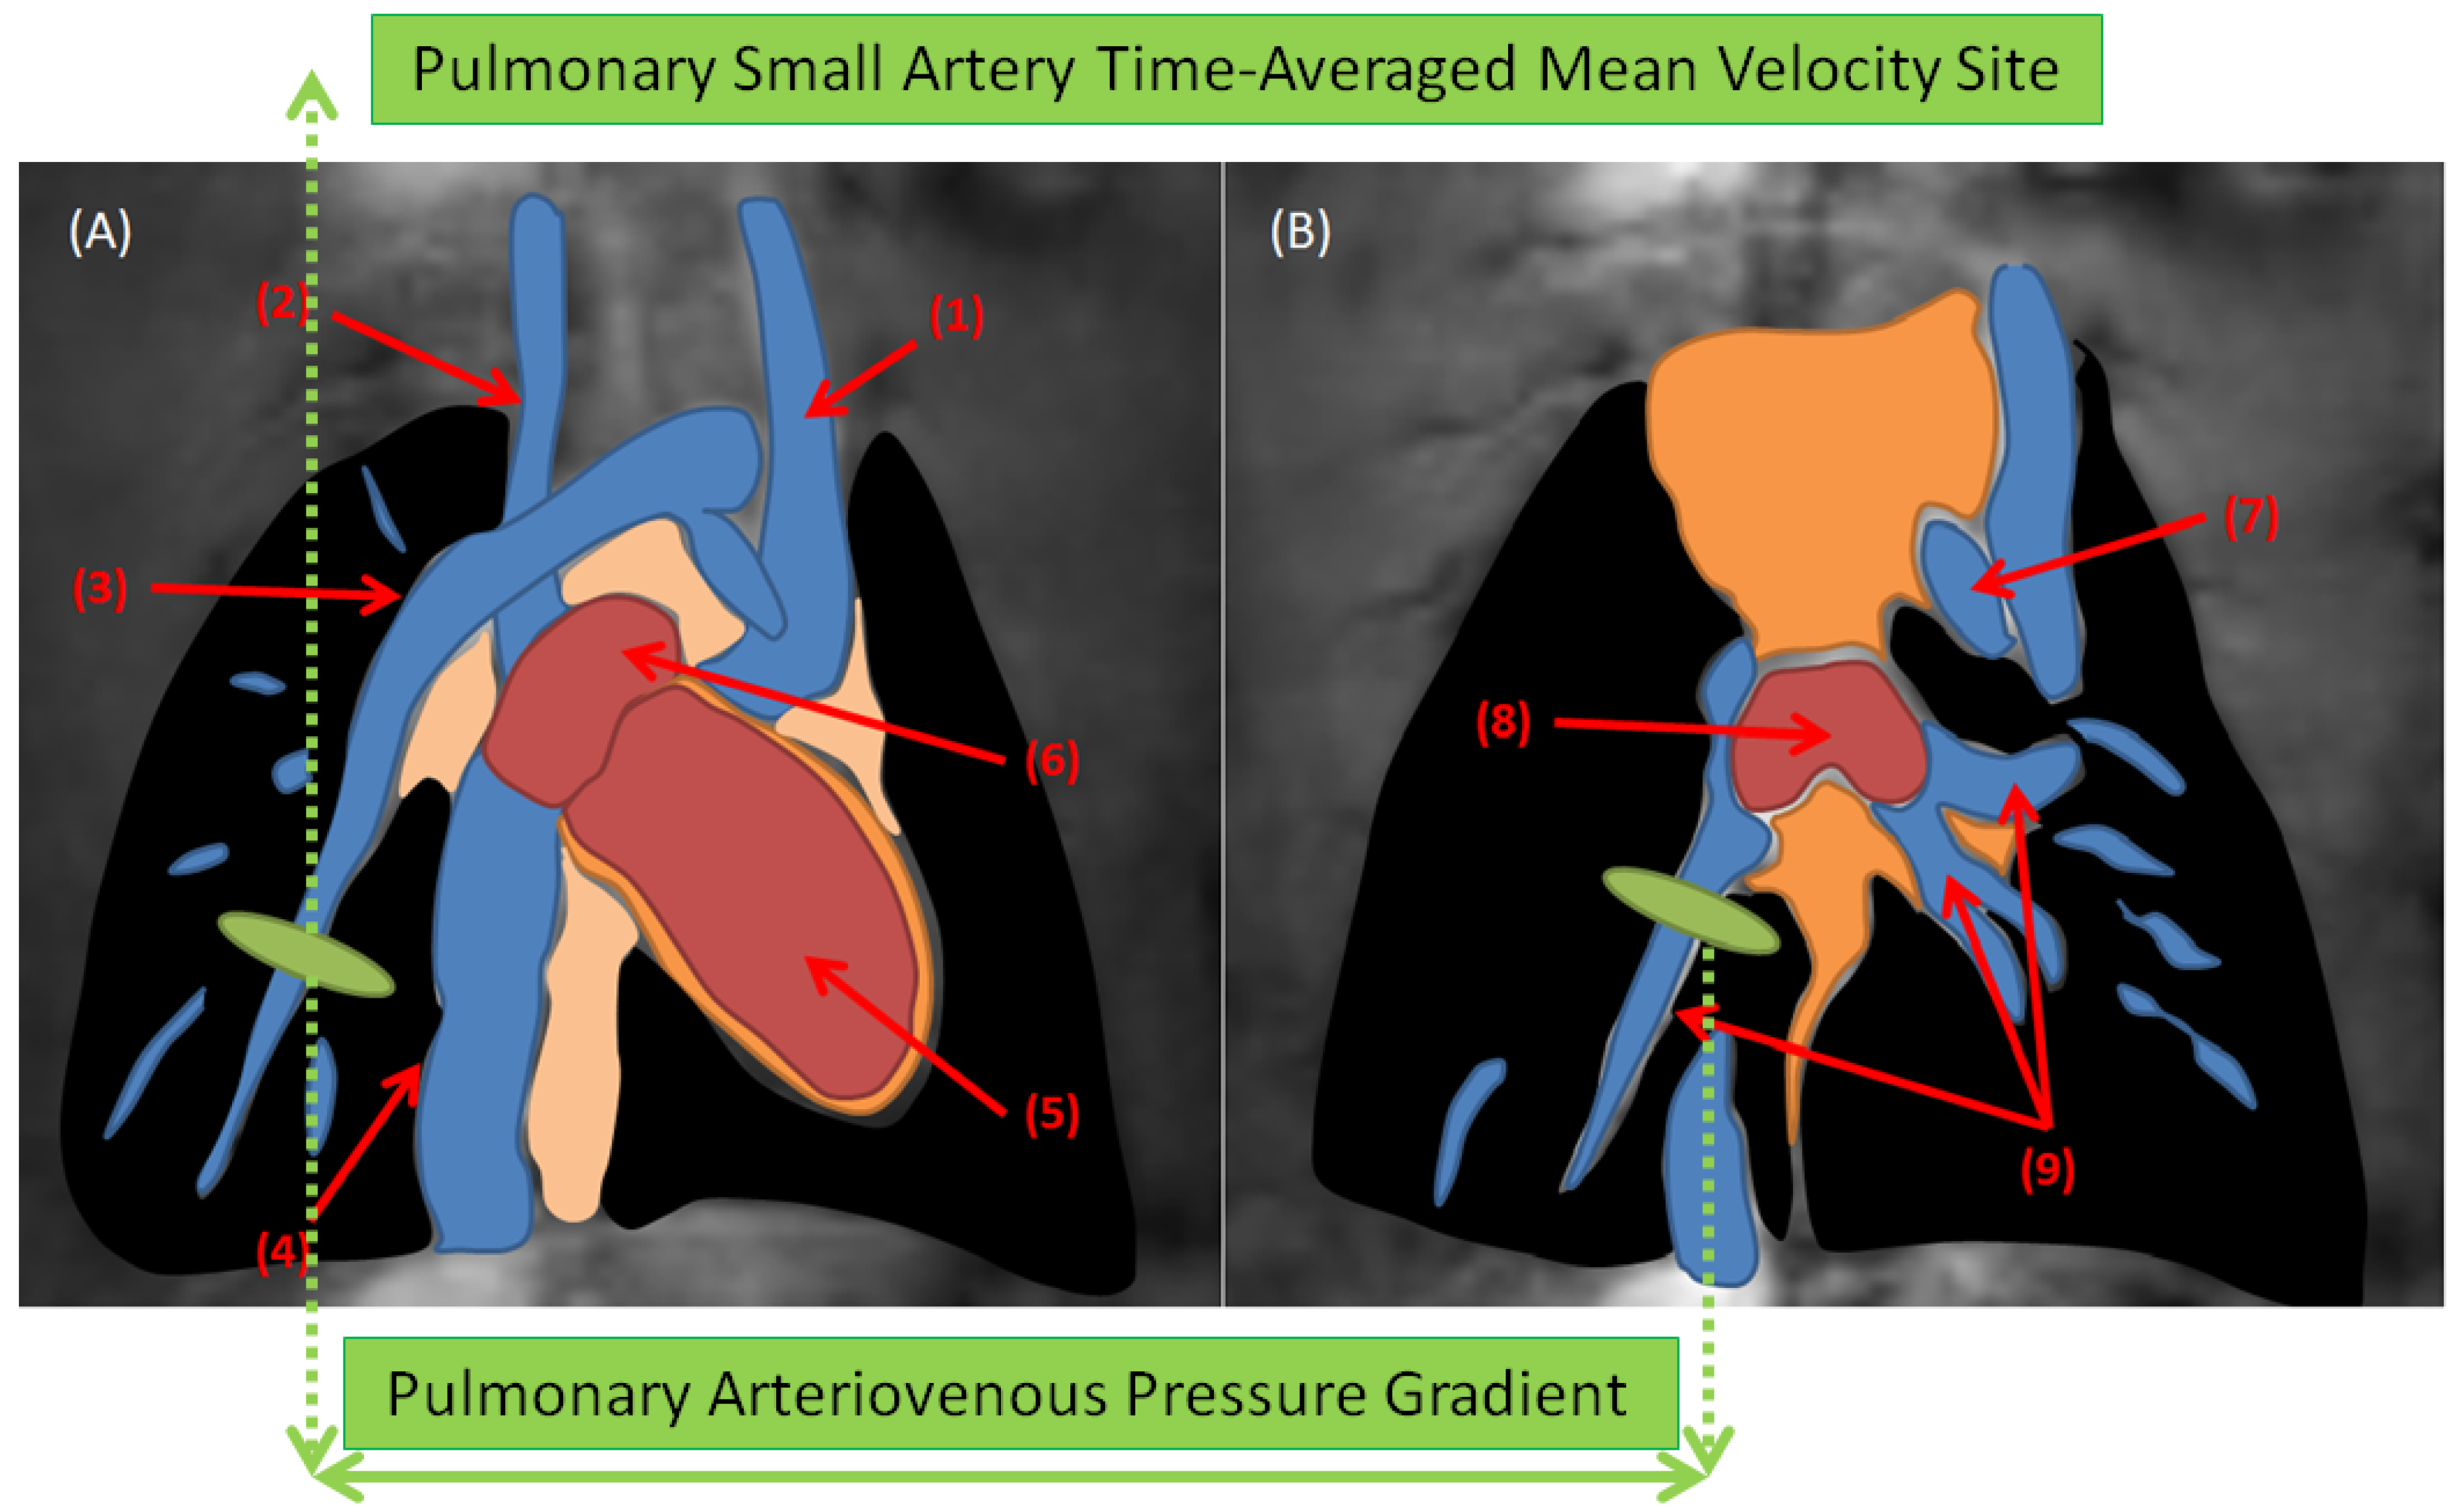
- Cardiac Magnetic Resonance: Prospectively, a cardiac and respiratory triggered 4D-flow stack-of-stars phase-contrast sequence was performed on a 9.4 T BioSpec USR 94/20 imaging scanner with ParaVision 6.0.1 software (Bruker, Ettlingen, Germany). All the animals were examined by a vendor-supplied 72 mm-diameter quadrature volume resonator with the following sequence parameters. Flow encoding scheme: HADAMARD; TR = 10 ms; TE = 1.1 ms; FA = 10°; BW = 100 kHz; under-sampling factor = 1.4–1.6; averages = 1; resolution = (375 × 375 × 375) µm3; VENC = 75–200 cm/s. The data were reconstructed offline using regridding with iterative sampling density estimation. All the functional and hemodynamic parameters were quantified using manual region-of-interests (ROI). The time-averaged mean-velocities were calculated in the large (main, right and left pulmonary arteries) and small pulmonary arteries. Furthermore, the pulmonary arteriovenous pressure gradients were calculated through the use of modified Bernoulli’s equation from 4D-flow data (Figure 1). All the parameters investigated by MRI are listed in Table 1 and Table 2.
- Transthoracic echocardiography: TTE was performed in all animals before CMR with a high-resolution ultrasound imaging system Vevo-770 (Visual Sonics, Toronto, ON, Canada) using a rodent specific 17 MHz probe. The recorded TTE movies were analyzed by an experienced cardiologist and the calculated parameter is listed in Table 2.
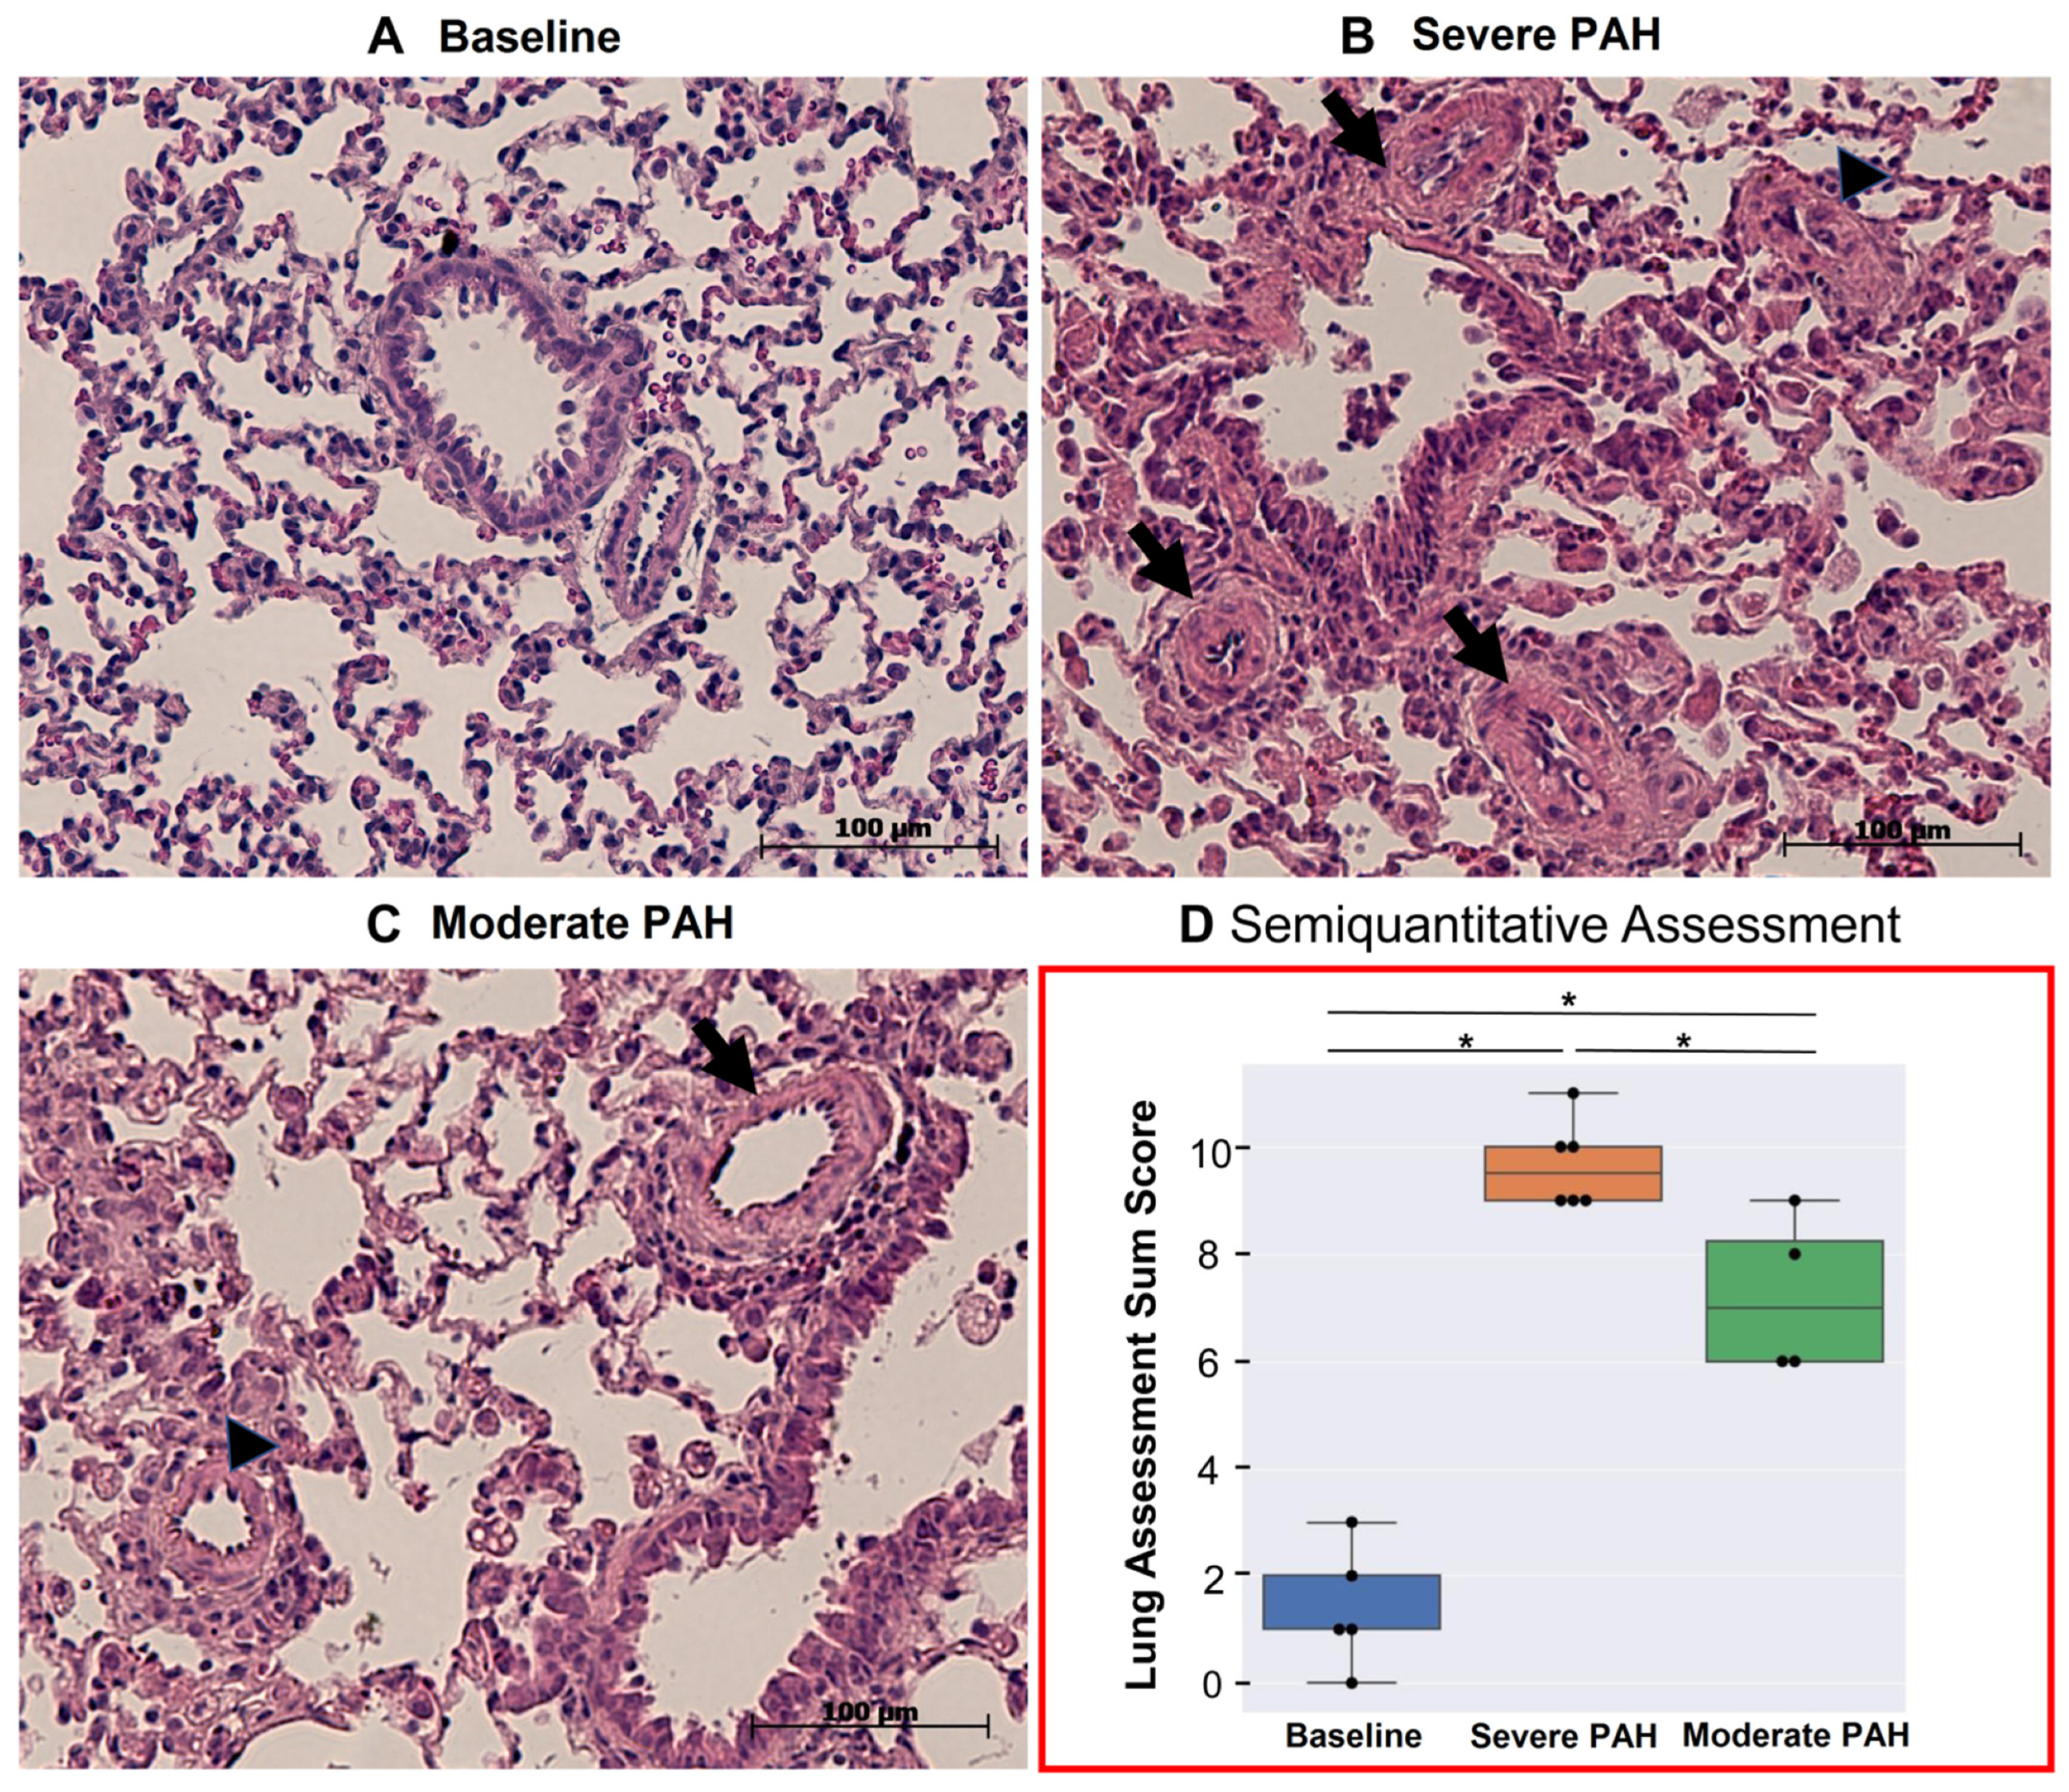
- Histological assessment of lungs: The formalin-fixed, paraffin-embedded, and H&E-stained lung tissue sections were evaluated by two experienced scientists. PAH-associated tissue damage of the lungs was evaluated semi-quantitatively using an established and validated sum-score system of our group [23,24]. The list of the evaluated histological indices is summarized in Table 3. According to the scoring system, atelectasis area (AA), emphysema area (EA), peribronchial artery media hypertrophy (PAMH), peribronchial artery perivascular cellular edema (PAPCE), and small artery media hypertrophy (SAMH) were evaluated and scored individually. Subsequently, all the scores were added up and summarized by an index called “Lung assessment sum-score”, or LASS, reflecting the overall pulmonary tissue changes due to PAH.
- Statistical Analysis: The pairwise Mann–Whitney U test was performed to compare the means of various variables among the experimental groups statistically with a p-value significance threshold of 5%. In addition, the Spearman correlation (between the scalar and ordinal variables) and Pearson correlation (between two scalar variables) tests were used for correlation analysis between two different parameters (Table 4). The strength of the correlation coefficients was classified according to the following scale: very strong correlation (r = 0.90 to 1.0), strong correlation (r = 0.70 to 0.90), moderate correlation (r = 0.50 to 0.70), low and negligible correlation (r < 0.50) [25].
3. Results
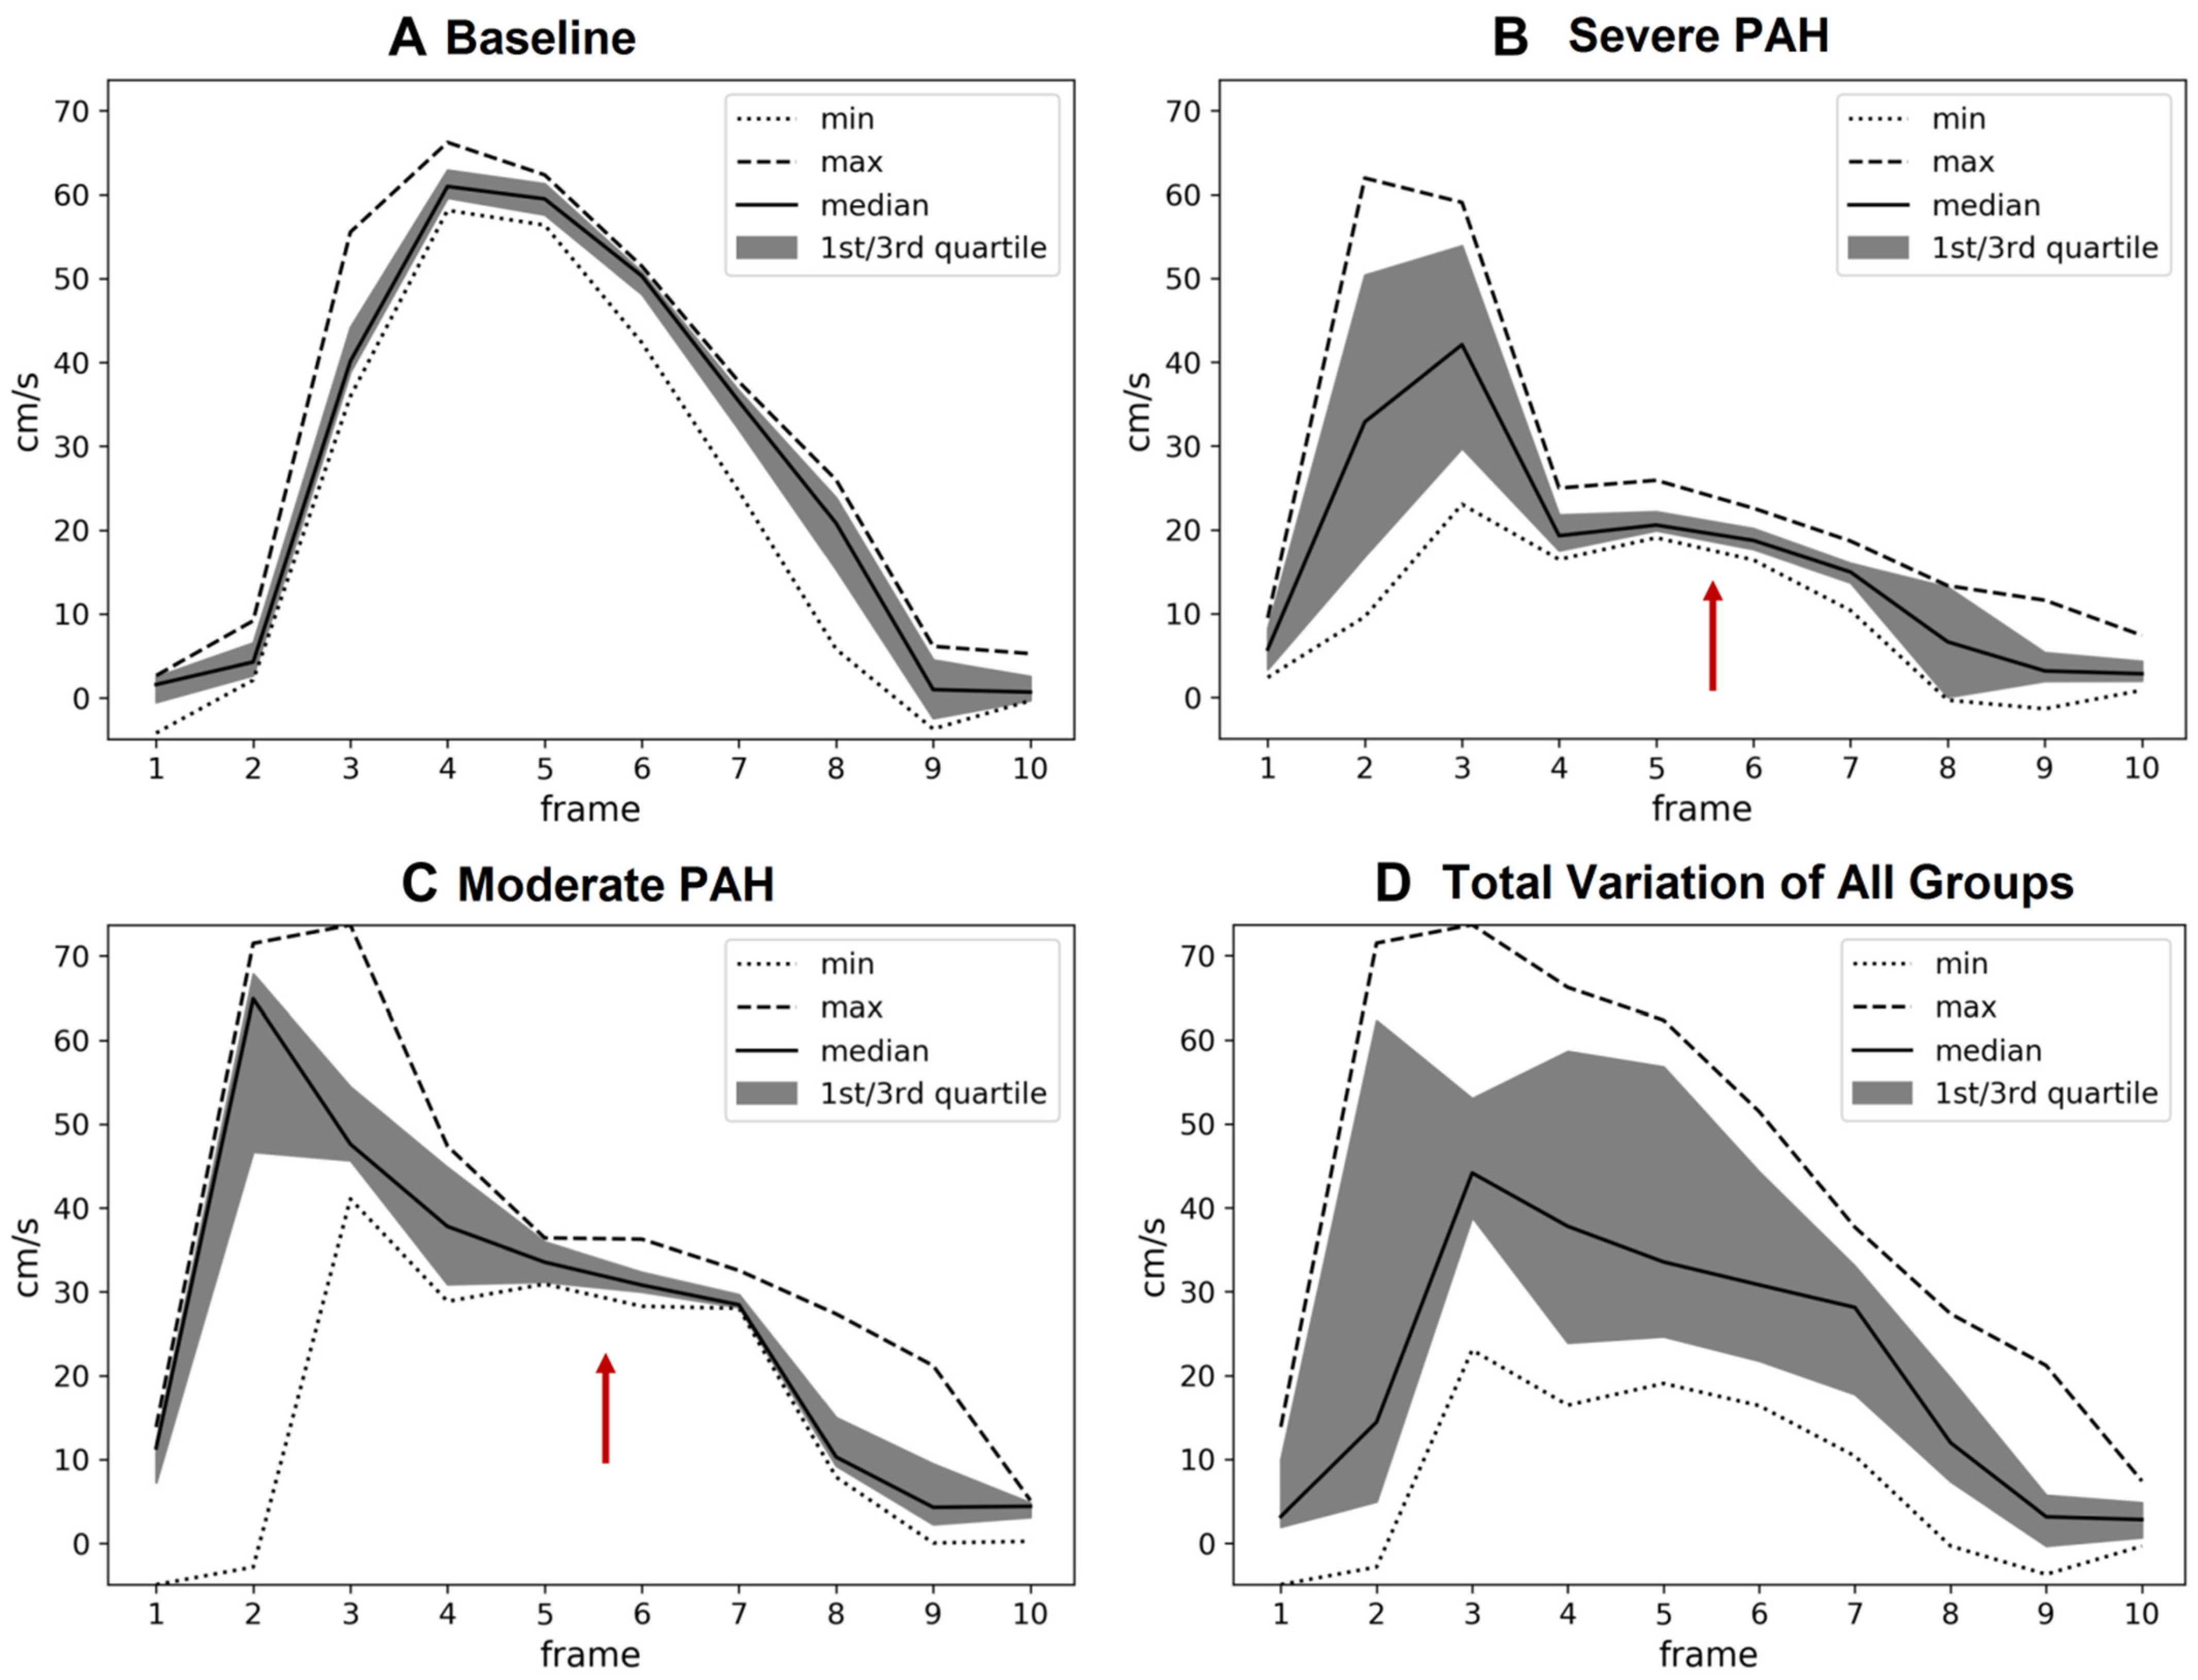
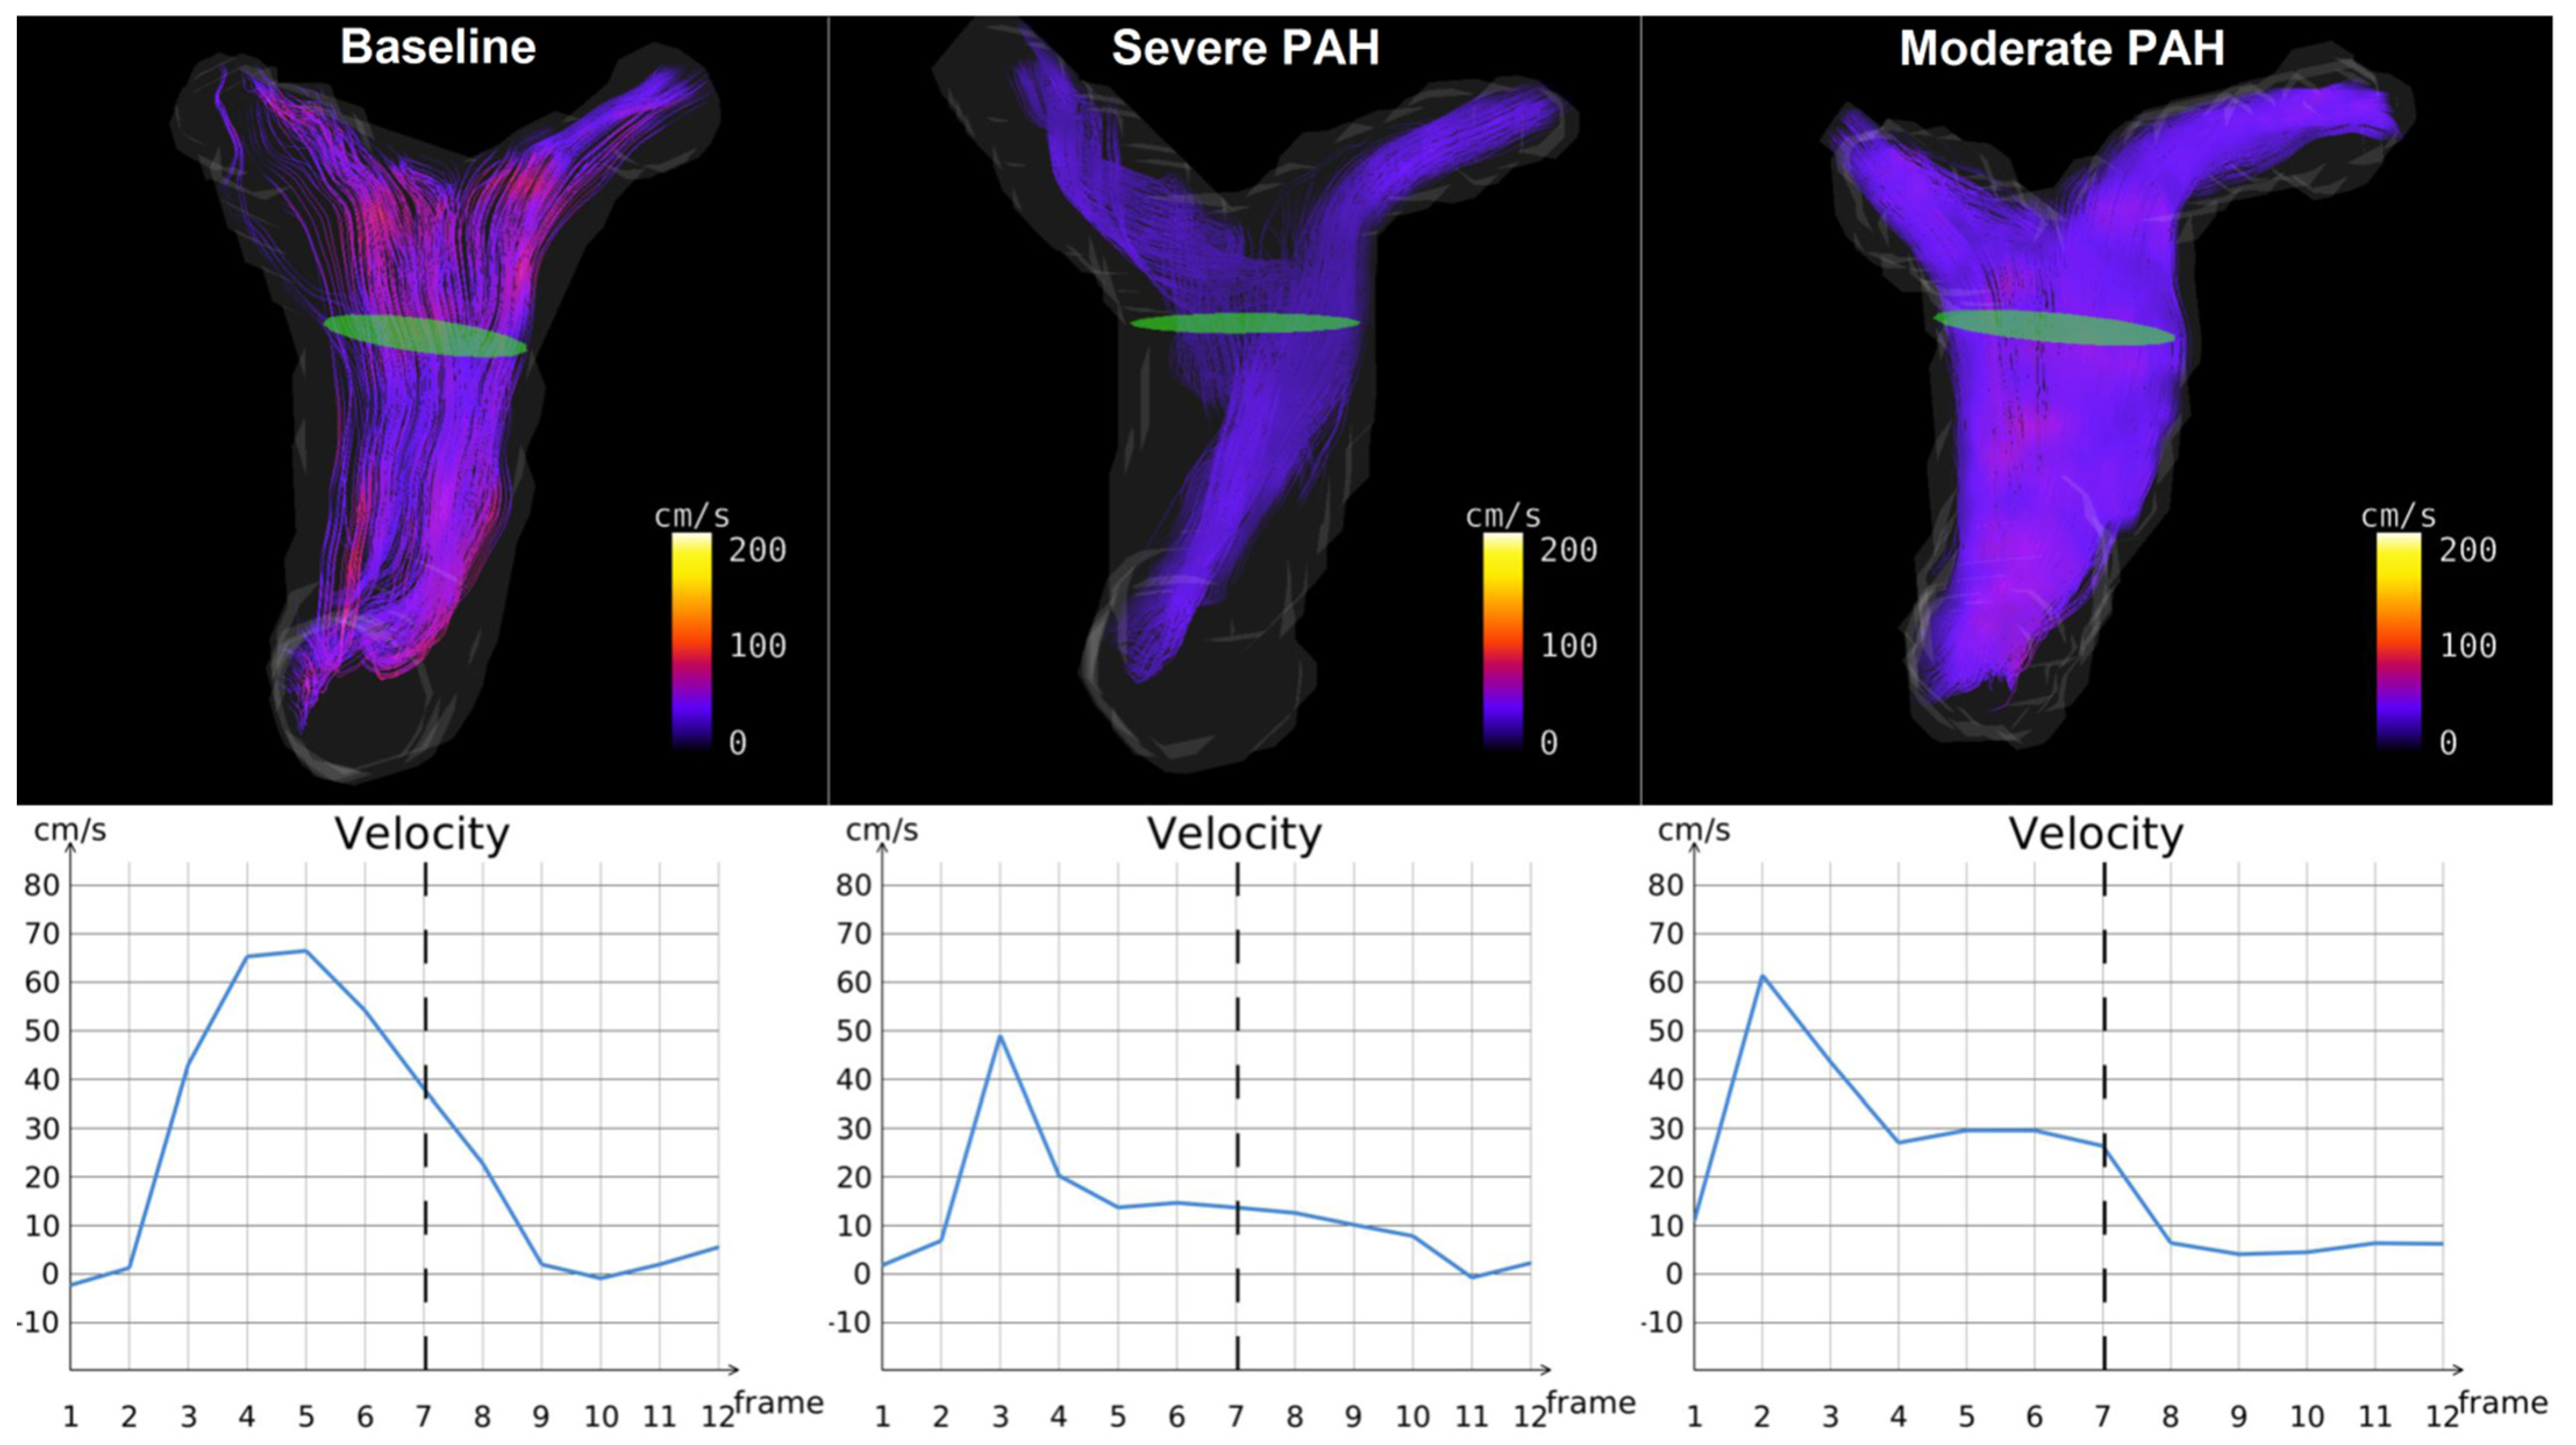
- CMR-Derived Hemodynamics: The time-averaged mean-velocities (Vmean) of the large and small pulmonary arteries were investigated in all the experimental groups. In addition, the right and left pulmonary arteriovenous pressure gradients (right: RPSA-RPV∆P-mean, left: LPSA-LPV∆P-mean) were calculated (Table 1). The Vmean-related indices in the large pulmonary arteries were only capable of distinguishing between severe PAH and baseline (p < 0.05), while the Vmean-related indices in the small pulmonary arteries were capable of differentiating not only between severe PAH and baseline, but also between the moderate and severe stages of the disease (p < 0.05). Notably, RPSA-RPV∆P-mean and LPSA-LPV∆P-mean could differentiate between baseline and severe PAH as well as the moderate and severe disease groups (p < 0.05), but with stronger statistical properties than Vmean, suggesting their suitability for the non-invasive diagnosis and follow-up of PAH.The qualitative assessments of the velocity-time curves in the pulmonary arteries indicated that the early and peak systolic velocities did not generally change in PAH. However, the late systolic velocities appeared more attenuated and flattened; i.e., velocity notches occurred (Figure 2, Figure 3 and Supplementary Material Video S1), which affected the Vmean values. This phenomenon was more dominant in the small pulmonary arteries compared to the large ones.
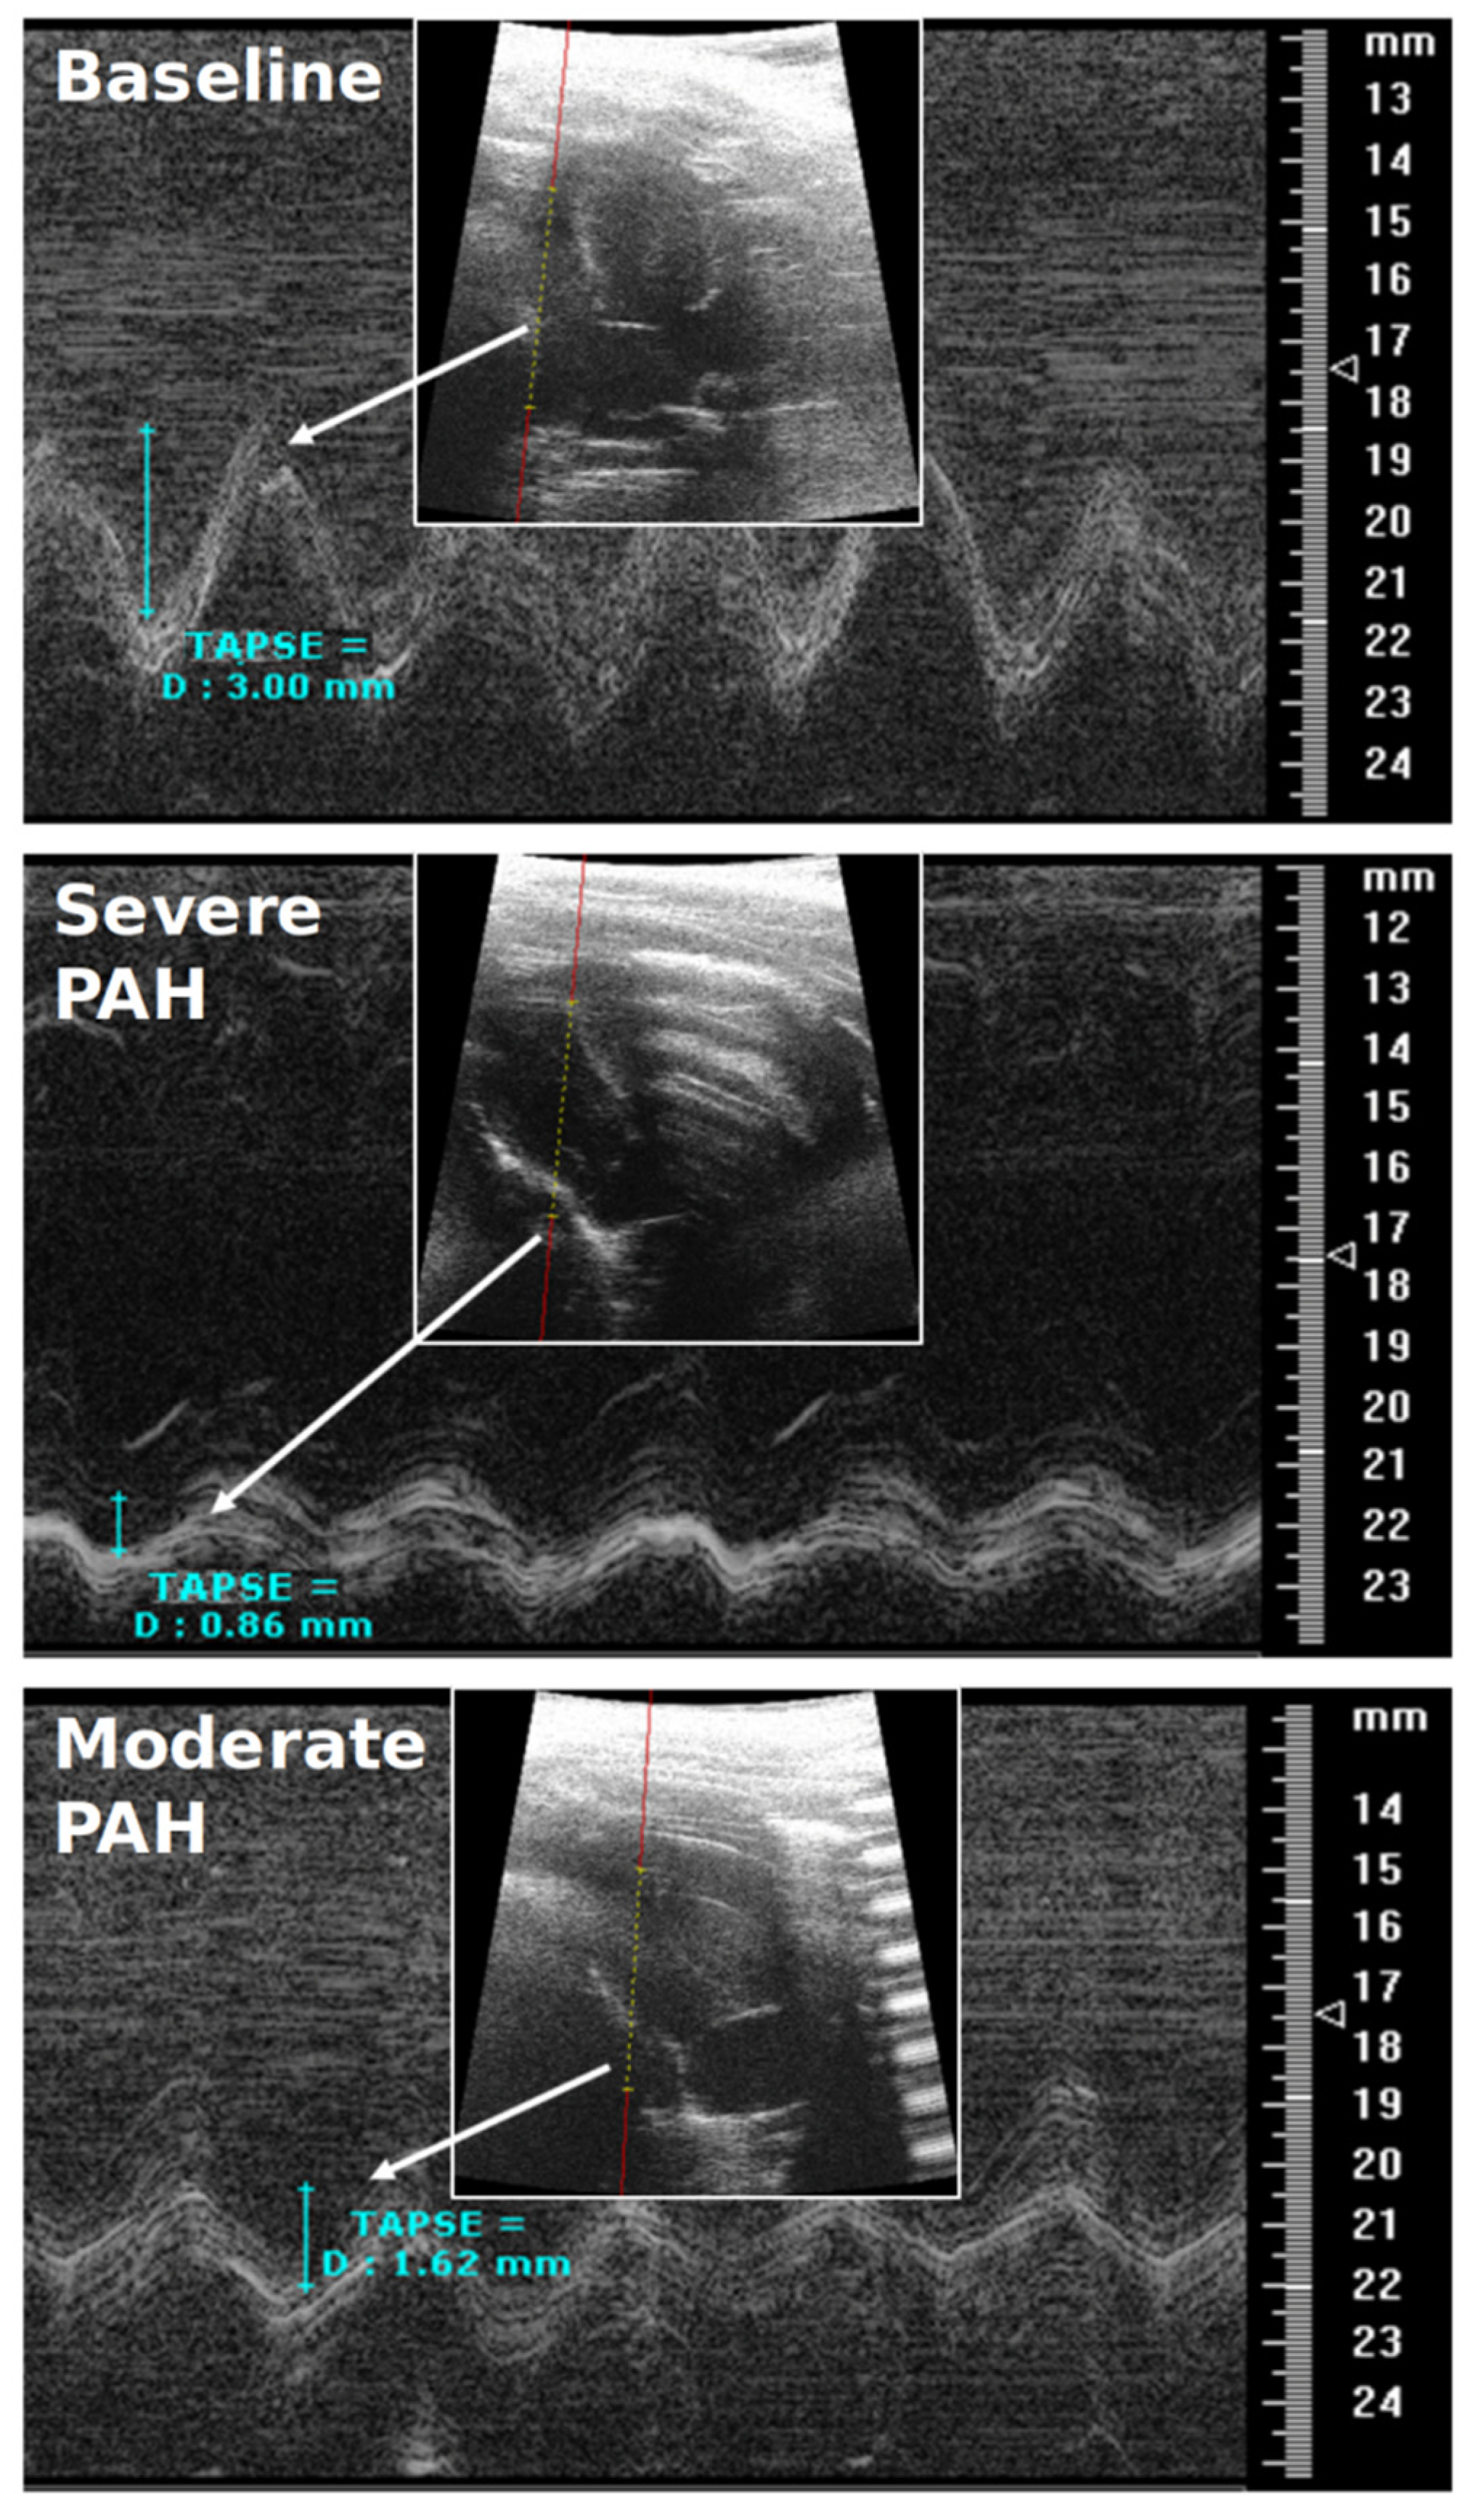
- RVEF & TAPSE: Due to the pitfalls and difficult procedure of RHC in rats, RVEF and TAPSE were investigated by CMR and TTE to prove all the animals were influenced by PAH. RVEF could reliably differentiate all the experimental groups from each other (p < 0.05), i.e., it was largely reduced in severe PAH and preserved in the moderate stage (Table 2). TAPSE could also differentiate well between baseline and severe PAH as well as between the severe and moderate disease groups (p < 0.05) (Table 2) (Figure 4). The RVEF and TAPSE results proved the effectiveness of the experimental design.
- Histological Assessment of Lung Tissue: In general, the animals with severe PAH demonstrated the highest individual scores in all the histological criteria except for emphysema among all the experimental groups. Therefore, severe PAH showed extensive signs of histological damage compared to baseline through significantly higher sum-scores (p < 0.05) (Figure 5). In moderate PAH, the sum-score was significantly lower compared to the severe group but still higher than the baseline (p < 0.05), reflecting a partial improvement in histological damage. With respect to the individual indices, moderate PAH showed a significant decrease for atelectasis and media hypertrophy in both the peribronchial and small pulmonary arteries compared to the animals at the severe stage of the disease (p < 0.05). However, the media hypertrophy of both arteries was still increased in severe and moderate PAH compared to baseline (p < 0.05) (Figure 5).
- Correlation analysis between 4D-flow parameters and histopathology: In general, the correlation analysis between the Vmean-related indices and the histological results showed moderate-to-strong correlation coefficient values, while the correlation analysis between the right/left pulmonary arteriovenous pressure gradients and histological results indicated a strong-to-very-strong associativity (Table 4).
4. Discussion and Conclusions
Supplementary Materials
Author Contributions
Funding
Institutional Review Board Statement
Informed Consent Statement
Data Availability Statement
Acknowledgments
Conflicts of Interest
References
- Galiè, N.; Humbert, M.; Vachiery, J.L.; Gibbs, S.; Lang, I.; Torbicki, A.; Simonneau, G.; Peacock, A.; Vonk Noordegraaf, A.; Beghetti, M.; et al. 2015 ESC/ERS Guidelines for the diagnosis and treatment of pulmonary hypertension: The Joint Task Force for the Diagnosis and Treatment of Pulmonary Hypertension of the European Society of Cardiology (ESC) and the European Respiratory Society (ERS): Endorsed by: Association for European Paediatric and Congenital Cardiology (AEPC), International Society for Heart and Lung Transplantation (ISHLT). Eur. Heart J. 2016, 37, 67–119. [Google Scholar] [CrossRef] [PubMed]
- Hoeper, M.M.; Bogaard, H.J.; Condliffe, R.; Frantz, R.; Khanna, D.; Kurzyna, M.; Langleben, D.; Manes, A.; Satoh, T.; Torres, F.; et al. Definitions and diagnosis of pulmonary hypertension. J. Am. Coll. Cardiol. 2013, 62, D42–D50. [Google Scholar] [CrossRef] [PubMed] [Green Version]
- Rich, J.D.; Rich, S. Clinical diagnosis of pulmonary hypertension. Circulation 2014, 130, 1820–1830. [Google Scholar] [CrossRef] [PubMed] [Green Version]
- Speich, R. Diagnosing pulmonary hypertension: Is there a revival of the electrocardiogram? Eur. Respir. J. 2011, 37, 994–996. [Google Scholar] [CrossRef] [PubMed] [Green Version]
- Barbosa, E.J.M.; Gupta, N.K.; Torigian, D.A.; Gefter, W.B. Current Role of Imaging in the Diagnosis and Management of Pulmonary Hypertension. Am. J. Roentgenol. 2012, 198, 1320–1331. [Google Scholar] [CrossRef]
- Grignola, J.C. Hemodynamic assessment of pulmonary hypertension. World J. Cardiol. 2011, 3, 10–17. [Google Scholar] [CrossRef]
- Rosenkranz, S.; Preston, I.R. Right heart catheterisation: Best practice and pitfalls in pulmonary hypertension. Eur. Respir. Rev. Off. J. Eur. Respir. Soc. 2015, 24, 642–652. [Google Scholar] [CrossRef] [Green Version]
- Mathier, M.A. The Nuts and Bolts of Interpreting Hemodynamics in Pulmonary Hypertension Associated With Diastolic Heart Failure. Adv. Pulm. Hypertens. 2011, 10, 33–40. [Google Scholar] [CrossRef] [Green Version]
- Hoeper, M.M.; Lee, S.H.; Voswinckel, R.; Palazzini, M.; Jais, X.; Marinelli, A.; Barst, R.J.; Ghofrani, H.A.; Jing, Z.C.; Opitz, C.; et al. Complications of right heart catheterization procedures in patients with pulmonary hypertension in experienced centers. J. Am. Coll. Cardiol. 2006, 48, 2546–2552. [Google Scholar] [CrossRef] [Green Version]
- Rudski, L.G.; Lai, W.W.; Afilalo, J.; Hua, L.; Handschumacher, M.D.; Chandrasekaran, K.; Solomon, S.D.; Louie, E.K.; Schiller, N.B. Guidelines for the echocardiographic assessment of the right heart in adults: A report from the American Society of Echocardiography endorsed by the European Association of Echocardiography, a registered branch of the European Society of Cardiology, and the Canadian Society of Echocardiography. J. Am. Soc. Echocardiogr. Off. Publ. Am. Soc. Echocardiogr. 2010, 23, 685–713. [Google Scholar] [CrossRef]
- Ascha, M.; Renapurkar, R.D.; Tonelli, A.R. A review of imaging modalities in pulmonary hypertension. Ann. Thorac. Med. 2017, 12, 61–73. [Google Scholar] [CrossRef]
- Meng, J.J.; Zhang, L.J.; Wang, Q.; Fang, W.; Dai, H.J.; Yan, J.; Wang, T.; Yao, Z.M.; He, J.; Li, M.; et al. A comparison of ventilation/perfusion single photon emission CT and CT pulmonary angiography for diagnosis of pulmonary embolism. Chin. J. Tuberc. Respir. Dis. 2013, 36, 177–181. (In Chinese) [Google Scholar]
- Tunariu, N.; Gibbs, S.J.; Win, Z.; Gin-Sing, W.; Graham, A.; Gishen, P.; Al-Nahhas, A. Ventilation-perfusion scintigraphy is more sensitive than multidetector CTPA in detecting chronic thromboembolic pulmonary disease as a treatable cause of pulmonary hypertension. J. Nucl. Med. Off. Publ. Soc. Nucl. Med. 2007, 48, 680–684. [Google Scholar] [CrossRef] [Green Version]
- Moledina, S.; Pandya, B.; Bartsota, M.; Mortensen, K.H.; McMillan, M.; Quyam, S.; Taylor, A.M.; Haworth, S.G.; Schulze-Neick, I.; Muthurangu, V. Prognostic significance of cardiac magnetic resonance imaging in children with pulmonary hypertension. Circ. Cardiovasc. Imaging 2013, 6, 407–414. [Google Scholar] [CrossRef] [Green Version]
- Bradlow, W.M.; Gibbs, J.S.; Mohiaddin, R.H. Cardiovascular magnetic resonance in pulmonary hypertension. J. Cardiovasc. Magn. Reson. Off. J. Soc. Cardiovasc. Magn. Reson. 2012, 14, 6. [Google Scholar] [CrossRef] [PubMed] [Green Version]
- Peacock, A.J.; Vonk Noordegraaf, A. Cardiac magnetic resonance imaging in pulmonary arterial hypertension. Eur. Respir. Rev. Off. J. Eur. Respir. Soc. 2013, 22, 526–534. [Google Scholar] [CrossRef]
- Freed, B.H.; Collins, J.D.; François, C.J.; Barker, A.J.; Cuttica, M.J.; Chesler, N.C.; Markl, M.; Shah, S.J. MR and CT Imaging for the Evaluation of Pulmonary Hypertension. JACC Cardiovasc. Imaging 2016, 9, 715–732. [Google Scholar] [CrossRef] [PubMed]
- Dyverfeldt, P.; Bissell, M.; Barker, A.J.; Bolger, A.F.; Carlhäll, C.J.; Ebbers, T.; Francios, C.J.; Frydrychowicz, A.; Geiger, J.; Giese, D.; et al. 4D flow cardiovascular magnetic resonance consensus statement. J. Cardiovasc. Magn. Reson. Off. J. Soc. Cardiovasc. Magn. Reson. 2015, 17, 72. [Google Scholar] [CrossRef] [Green Version]
- Reiter, U.; Reiter, G.; Fuchsjäger, M. MR phase-contrast imaging in pulmonary hypertension. Br. J. Radiol. 2016, 89, 20150995. [Google Scholar] [CrossRef]
- Roldán-Alzate, A.; Frydrychowicz, A.; Johnson, K.M.; Kellihan, H.; Chesler, N.C.; Wieben, O.; François, C.J. Non-invasive assessment of cardiac function and pulmonary vascular resistance in an canine model of acute thromboembolic pulmonary hypertension using 4D flow cardiovascular magnetic resonance. J. Cardiovasc. Magn. Reson. Off. J. Soc. Cardiovasc. Magn. Reson. 2014, 16, 23. [Google Scholar] [CrossRef] [PubMed] [Green Version]
- García-Alvarez, A.; Fernández-Friera, L.; Mirelis, J.G.; Sawit, S.; Nair, A.; Kallman, J.; Fuster, V.; Sanz, J. Non-invasive estimation of pulmonary vascular resistance with cardiac magnetic resonance. Eur. Heart J. 2011, 32, 2438–2445. [Google Scholar] [CrossRef] [Green Version]
- Sanz, J.; Kuschnir, P.; Rius, T.; Salguero, R.; Sulica, R.; Einstein, A.J.; Dellegrottaglie, S.; Fuster, V.; Rajagopalan, S.; Poon, M. Pulmonary arterial hypertension: Noninvasive detection with phase-contrast MR imaging. Radiology 2007, 243, 70–79. [Google Scholar] [CrossRef]
- Franz, M.; Grün, K.; Betge, S.; Rohm, I.; Ndongson-Dongmo, B.; Bauer, R.; Schulze, P.C.; Lichtenauer, M.; Petersen, I.; Neri, D.; et al. Lung tissue remodelling in MCT-induced pulmonary hypertension: A proposal for a novel scoring system and changes in extracellular matrix and fibrosis associated gene expression. Oncotarget 2016, 7, 81241–81254. [Google Scholar] [CrossRef] [PubMed] [Green Version]
- Rohm, I.; Grün, K.; Müller, L.M.; Bäz, L.; Förster, M.; Schrepper, A.; Kretzschmar, D.; Pistulli, R.; Yilmaz, A.; Bauer, R.; et al. Cellular inflammation in pulmonary hypertension: Detailed analysis of lung and right ventricular tissue, circulating immune cells and effects of a dual endothelin receptor antagonist. Clin. Hemorheol. Microcirc. 2019, 73, 497–522. [Google Scholar] [CrossRef] [PubMed]
- Mukaka, M.M. Statistics corner: A guide to appropriate use of correlation coefficient in medical research. Malawi Med. J. 2012, 24, 69–71. [Google Scholar]
- Guo, X.; Liu, M.; Ma, Z.; Wang, S.; Yang, Y.; Zhai, Z.; Wang, C.; Zhai, R. Flow characteristics of the proximal pulmonary arteries and vena cava in patients with chronic thromboembolic pulmonary hypertension: Correlation between 3.0 T phase-contrast MRI and right heart catheterization. Diagn. Interv. Radiol. 2014, 20, 414–420. [Google Scholar] [CrossRef] [PubMed] [Green Version]
- Helderman, F.; Mauritz, G.J.; Andringa, K.E.; Vonk-Noordegraaf, A.; Marcus, J.T. Early onset of retrograde flow in the main pulmonary artery is a characteristic of pulmonary arterial hypertension. J. Magn. Reson. Imaging JMRI 2011, 33, 1362–1368. [Google Scholar] [CrossRef]
- Ley, S.; Fink, C.; Risse, F.; Ehlken, N.; Fischer, C.; Ley-Zaporozhan, J.; Kauczor, H.U.; Klose, H.; Gruenig, E. Magnetic resonance imaging to assess the effect of exercise training on pulmonary perfusion and blood flow in patients with pulmonary hypertension. Eur. Radiol. 2013, 23, 324–331. [Google Scholar] [CrossRef]
- Moral, S.; Fernández-Friera, L.; Stevens, G.; Guzman, G.; García-Alvarez, A.; Nair, A.; Evangelista, A.; Fuster, V.; Garcia, M.J.; Sanz, J. New index α improves detection of pulmonary hypertension in comparison with other cardiac magnetic resonance indices. Int. J. Cardiol. 2012, 161, 25–30. [Google Scholar] [CrossRef]
- Swift, A.J.; Rajaram, S.; Condliffe, R.; Capener, D.; Hurdman, J.; Elliot, C.A.; Wild, J.M.; Kiely, D.G. Diagnostic accuracy of cardiovascular magnetic resonance imaging of right ventricular morphology and function in the assessment of suspected pulmonary hypertension results from the ASPIRE registry. J. Cardiovasc. Magn. Reson. Off. J. Soc. Cardiovasc. Magn. Reson. 2012, 14, 40. [Google Scholar] [CrossRef] [Green Version]
- Truong, U.; Fonseca, B.; Dunning, J.; Burgett, S.; Lanning, C.; Ivy, D.D.; Shandas, R.; Hunter, K.; Barker, A.J. Wall shear stress measured by phase contrast cardiovascular magnetic resonance in children and adolescents with pulmonary arterial hypertension. J. Cardiovasc. Magn. Reson. Off. J. Soc. Cardiovasc. Magn. Reson. 2013, 15, 81. [Google Scholar] [CrossRef] [PubMed] [Green Version]
- Cerne, J.W.; Pathrose, A.; Gordon, D.Z.; Sarnari, R.; Veer, M.; Blaisdell, J.; Allen, B.D.; Avery, R.; Markl, M.; Ragin, A.; et al. Evaluation of Pulmonary Hypertension Using 4D Flow MRI. J. Magn. Reson. Imaging 2021. [Google Scholar] [CrossRef] [PubMed]
- Kjellström, B.; Lindholm, A.; Ostenfeld, E. Cardiac Magnetic Resonance Imaging in Pulmonary Arterial Hypertension: Ready for Clinical Practice and Guidelines? Curr. Heart Fail. Rep. 2020, 17, 181–191. [Google Scholar] [CrossRef]
- Reiter, G.; Reiter, U.; Kovacs, G.; Olschewski, H.; Fuchsjäger, M. Blood flow vortices along the main pulmonary artery measured with MR imaging for diagnosis of pulmonary hypertension. Radiology 2015, 275, 71–79. [Google Scholar] [CrossRef] [PubMed] [Green Version]


| MRI-Derived Index | Abb. | Unit | Sig. (p < 0.05) | Group (Mean ± Standard Deviation) | ||
|---|---|---|---|---|---|---|
| Baseline | Severe | Moderate | ||||
| Main pulmonary artery averaged velocity | MPAV-mean | cm·s−1 | 1 | 30.43 ± 7.90 | 12.18 ± 4.32 | 22.28 ± 11.41 |
| Right pulmonary artery averaged velocity | RPAV-mean | cm·s−1 | 1 | 23.15 ± 4.97 | 13.78 ± 7.24 | 19.15 ± 10.78 |
| Left pulmonary artery averaged velocity | LPAV-mean | cm·s−1 | 1 | 22.65 ± 6.94 | 12.77 ± 2.23 | 20.44 ± 8.11 |
| Right pulmonary small artery averaged velocity | RPSAV-mean | cm·s−1 | 1 | 18.40 ± 3.72 | 7.43 ± 3.40 | 14.36 ± 7.62 |
| Left pulmonary small artery averaged velocity | LPSAV-mean | cm·s−1 | 1, 3 | 22.57 ± 4.66 | 7.47 ± 4.07 | 16.16 ± 8.50 |
| Right pulmonary arteriovenous averaged pressure | RPSA-RPV∆P-mean | mmHg | 1, 3 | 0.12 ± 0.06 | 0.018 ± 0.02 | 0.093 ± 0.095 |
| Left pulmonary arteriovenous averaged pressure gradient | LPSA-LPV∆P-mean | mmHg | 1, 3 | 0.19 ± 0.09 | 0.02 ± 0.02 | 0.11 ± 0.14 |
| Functional Index | Abb. | Unit | Sig. (p < 0.05) | Group (Mean ± Standard Deviation) | ||
|---|---|---|---|---|---|---|
| Baseline | Severe | Moderate | ||||
| CMR: Right ventricle ejection fraction | RVEF | % | 1, 2, 3 | 56.27 ± 3.67 | 17.97 ± 2.31 | 38.75 ± 10.42 |
| TTE: Tricuspid annular plane systolic excursion | TAPSE | mm | 1, 2 | 2.73 ± 0.64 | 1.03 ±0.17 | 1.27 ± 0.45 |
| Pulmonary Histopathology Index | Abb. | Sig. (p < 0.05) | Group (Mean ± Standard Deviation) | ||
|---|---|---|---|---|---|
| Baseline | Severe | Moderate | |||
| Atelectasis area | AA | 1, 3 | 0.80 ± 0.44 | 1.67 ± 0.51 | 1.00 ± 0.00 |
| Emphysema area | EA | 2 | 0.20 ± 0.447 | 0.67 ± 0.51 | 1.25 ± 0.50 |
| Peribronchial artery media hypertrophy | PAMH | 1, 2, 3 | 0.40 ± 0.54 | 2.83 ± 0.408 | 2.00 ± 0.00 |
| Peribronchial artery perivascular cellular edema | PAPCE | 1 | 0.00 ± 0.00 | 1.67 ± 0.816 | 1.00 ± 1.15 |
| Small artery media hypertrophy | SAMH | 1, 2, 3 | 0.00 ± 0.00 | 2.83 ± 0.40 | 2.00 ± 0.00 |
| Lung assessment sum score | LASS | 1, 2, 3 | 1.40 ± 1.14 | 9.67 ± 0.81 | 7.25 ± 1.50 |
| MRI Index | Corr. Index | AA | EA | PAMH | PAPCE | SAMH | LASS |
|---|---|---|---|---|---|---|---|
| MPAV-mean | −0.537 | −0.421 | −0.754 | −0.866 | −0.708 | −0.829 | |
| RPAV-mean | −0.342 | −0.383 | −0.495 | −0.619 | −0.550 | −0.613 | |
| LPAV-mean | −0.537 | −0.163 | −0.723 | −0.743 | −0.682 | −0.817 | |
| RPSAV-mean | −0.220 | −0.529 | −0.761 | −0.725 | −0.816 | −0.819 | |
| LPSAV-mean | −0.342 | −0.565 | −0.827 | −0.785 | −0.892 | −0.925 | |
| RPSA-RPV∆P-mean | −0.416 | −0.566 | −0.792 | −0.662 | −0.854 | −0.868 | |
| LPSA-LPV∆P-mean | −0.390 | −0.526 | −0.851 | −0.742 | −0.917 | −0.915 | |
Publisher’s Note: MDPI stays neutral with regard to jurisdictional claims in published maps and institutional affiliations. |
© 2021 by the authors. Licensee MDPI, Basel, Switzerland. This article is an open access article distributed under the terms and conditions of the Creative Commons Attribution (CC BY) license (https://creativecommons.org/licenses/by/4.0/).
Share and Cite
Nahardani, A.; Leistikow, S.; Grün, K.; Krämer, M.; Herrmann, K.-H.; Schrepper, A.; Jung, C.; Moradi, S.; Schulze, P.C.; Linsen, L.; et al. Pulmonary Arteriovenous Pressure Gradient and Time-Averaged Mean Velocity of Small Pulmonary Arteries Can Serve as Sensitive Biomarkers in the Diagnosis of Pulmonary Arterial Hypertension: A Preclinical Study by 4D-Flow MRI. Diagnostics 2022, 12, 58. https://doi.org/10.3390/diagnostics12010058
Nahardani A, Leistikow S, Grün K, Krämer M, Herrmann K-H, Schrepper A, Jung C, Moradi S, Schulze PC, Linsen L, et al. Pulmonary Arteriovenous Pressure Gradient and Time-Averaged Mean Velocity of Small Pulmonary Arteries Can Serve as Sensitive Biomarkers in the Diagnosis of Pulmonary Arterial Hypertension: A Preclinical Study by 4D-Flow MRI. Diagnostics. 2022; 12(1):58. https://doi.org/10.3390/diagnostics12010058
Chicago/Turabian StyleNahardani, Ali, Simon Leistikow, Katja Grün, Martin Krämer, Karl-Heinz Herrmann, Andrea Schrepper, Christian Jung, Sara Moradi, Paul Christian Schulze, Lars Linsen, and et al. 2022. "Pulmonary Arteriovenous Pressure Gradient and Time-Averaged Mean Velocity of Small Pulmonary Arteries Can Serve as Sensitive Biomarkers in the Diagnosis of Pulmonary Arterial Hypertension: A Preclinical Study by 4D-Flow MRI" Diagnostics 12, no. 1: 58. https://doi.org/10.3390/diagnostics12010058