Genetic Structure and Pod Morphology of Inga edulis Cultivated vs. Wild Populations from the Peruvian Amazon

 ,
,  ,
,  , , , ,
  ,
, 
Abstract
:1. Introduction
2. Materials and Methods
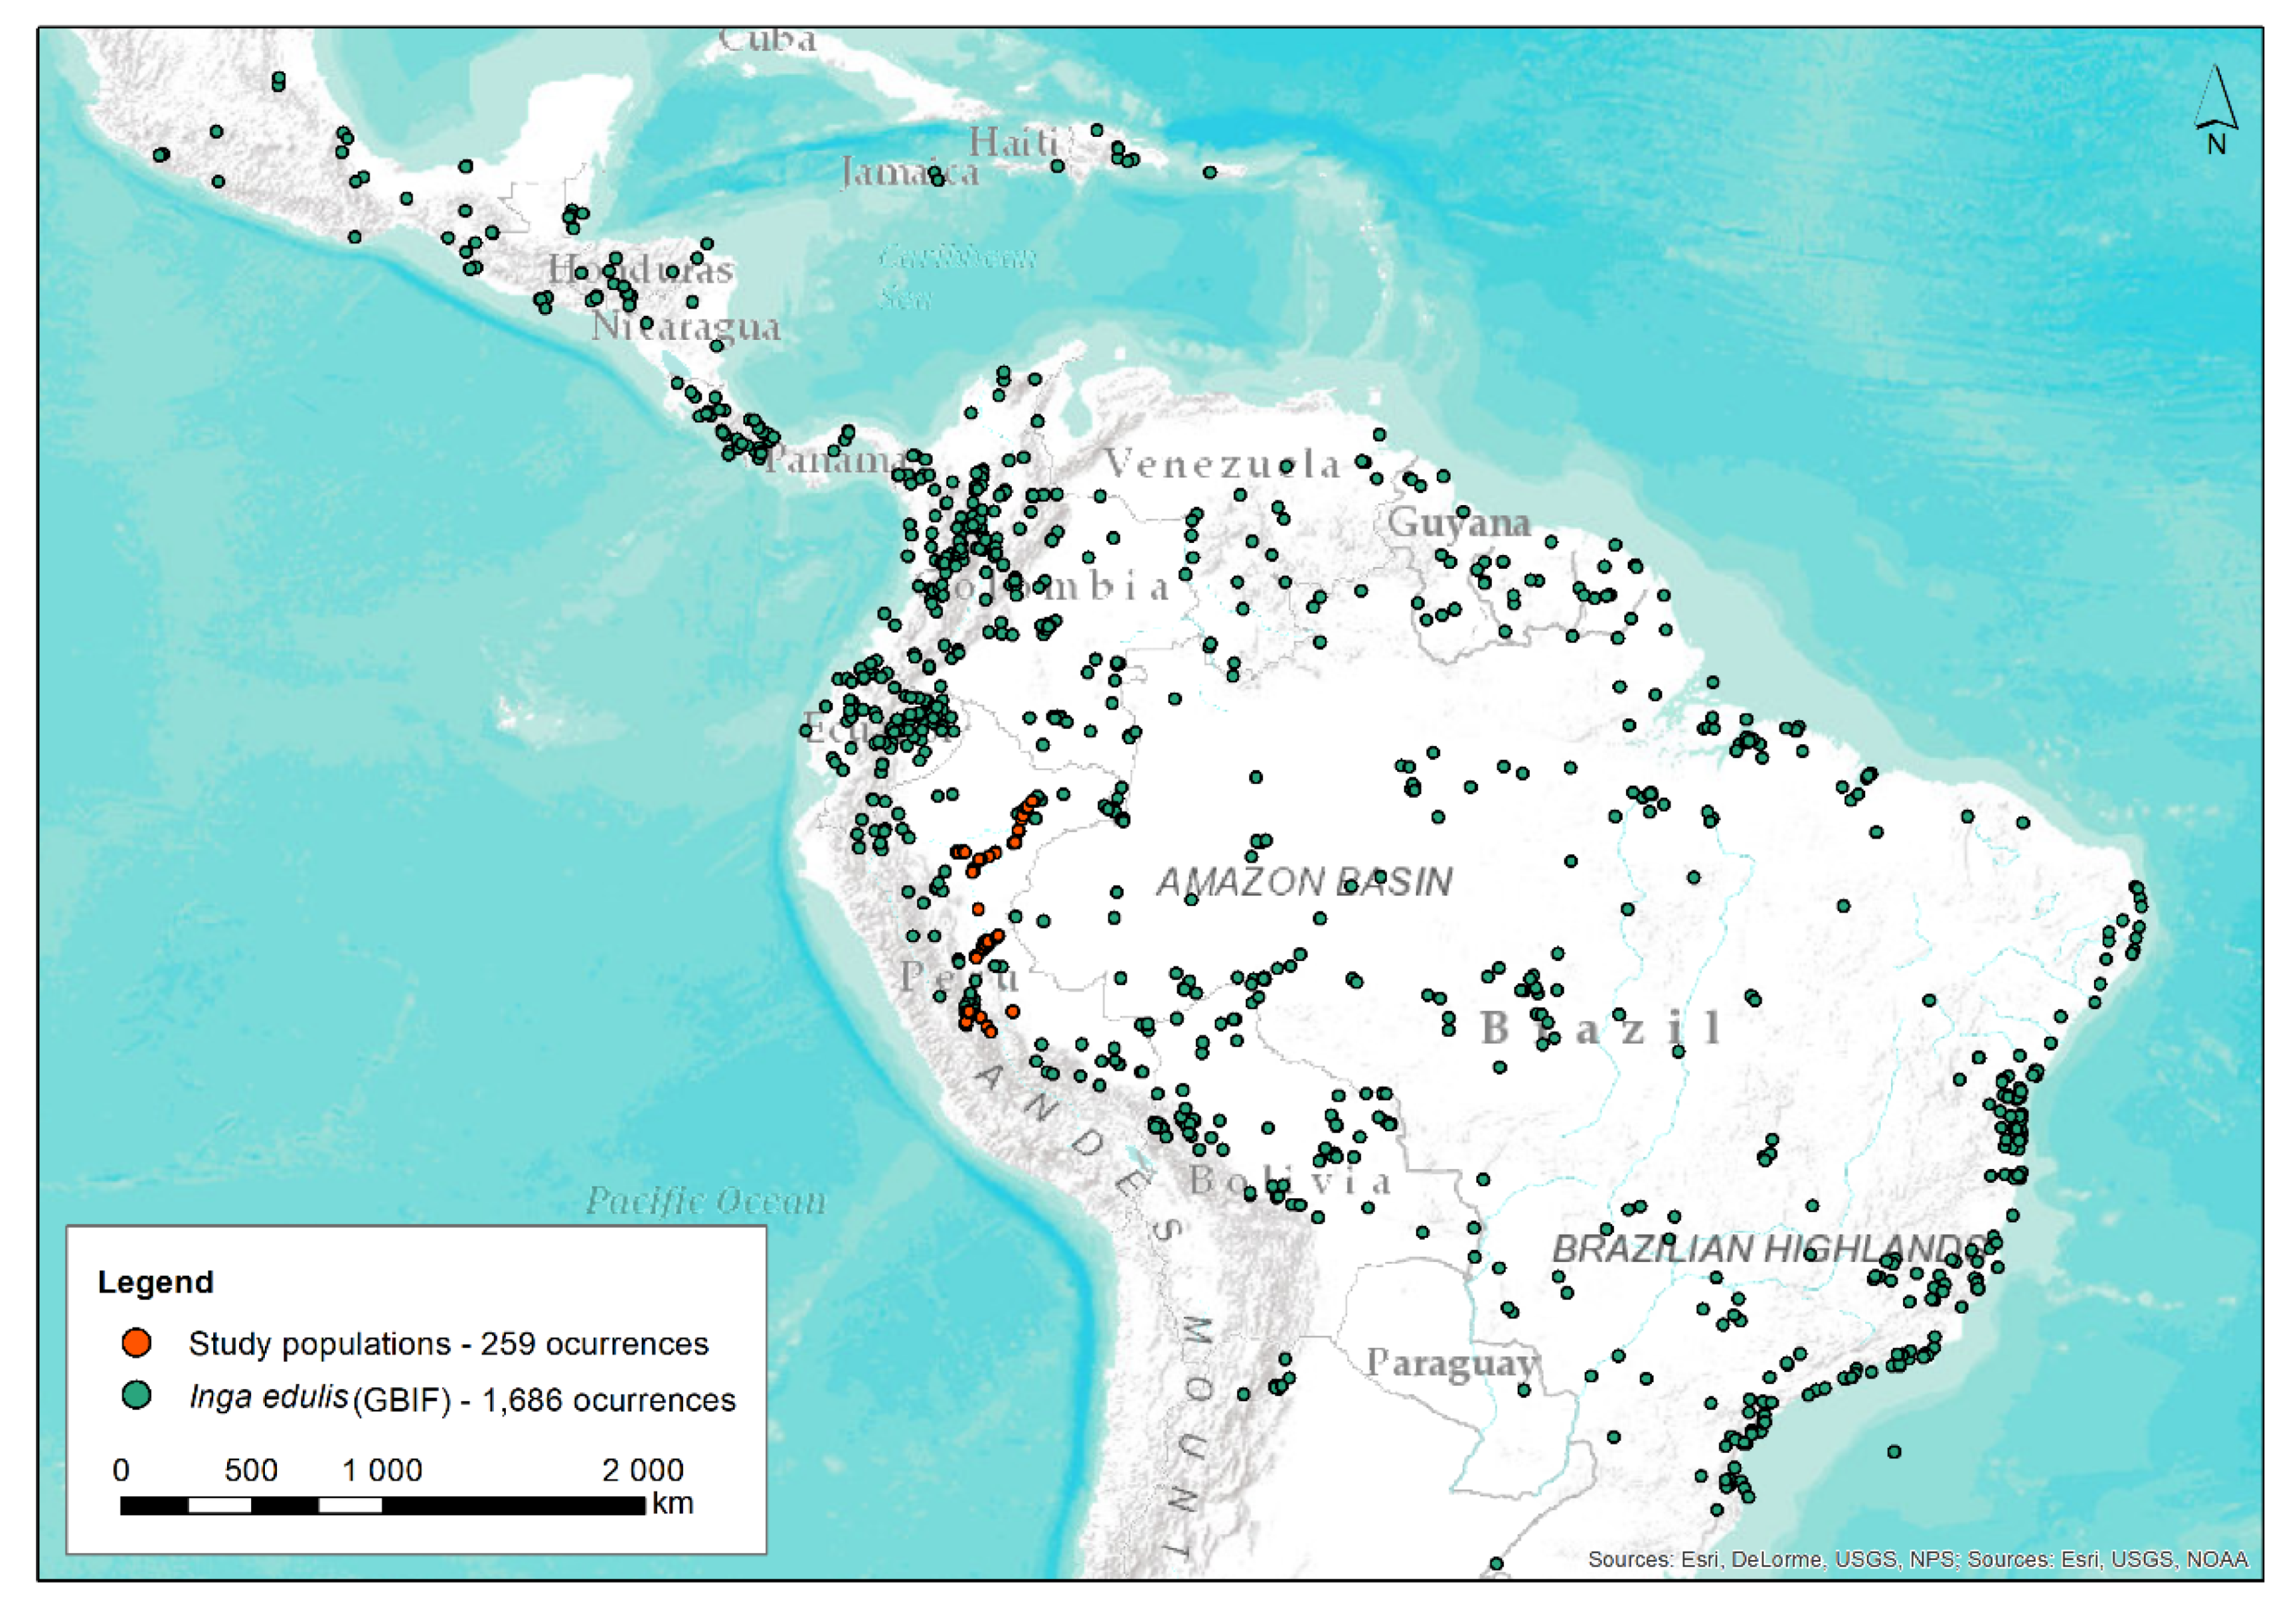
2.1. Plant Material Sampling
2.2. DNA Extraction and Amplification
2.3. Data Analysis
2.3.1. Morphological Data
2.3.2. Molecular Data
3. Results
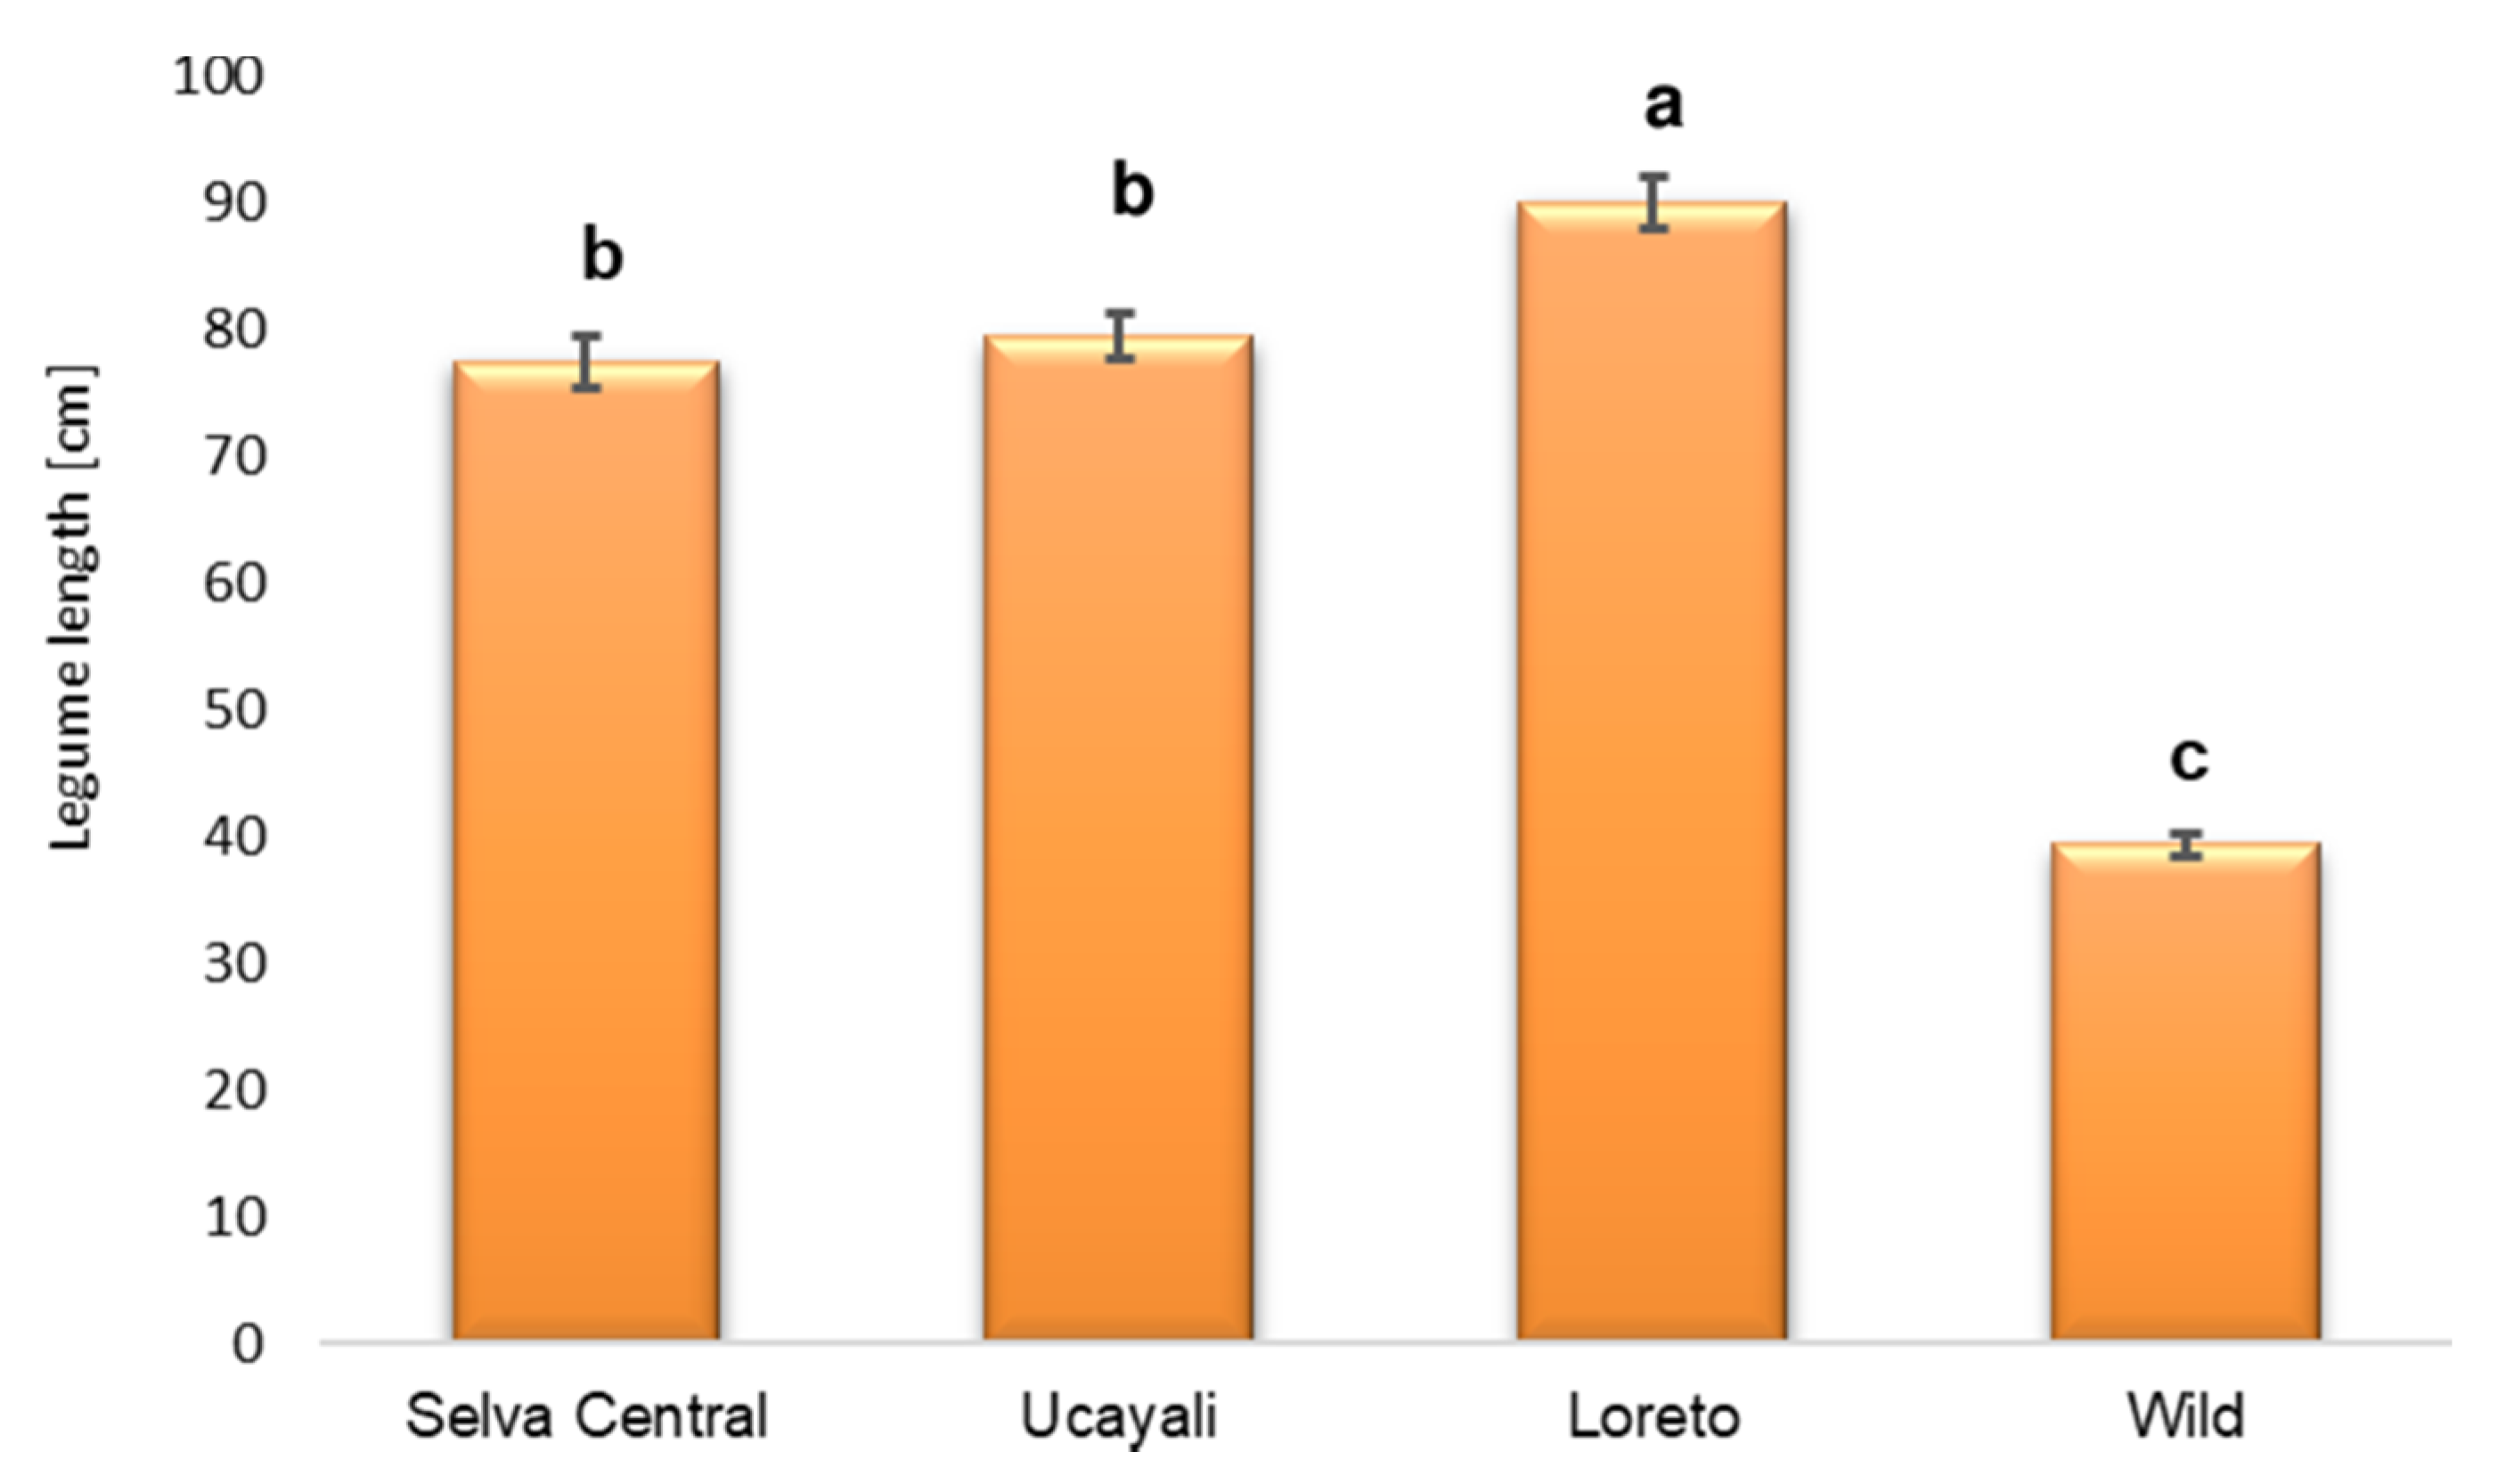
3.1. Pod Length
3.2. Genetic Diversity
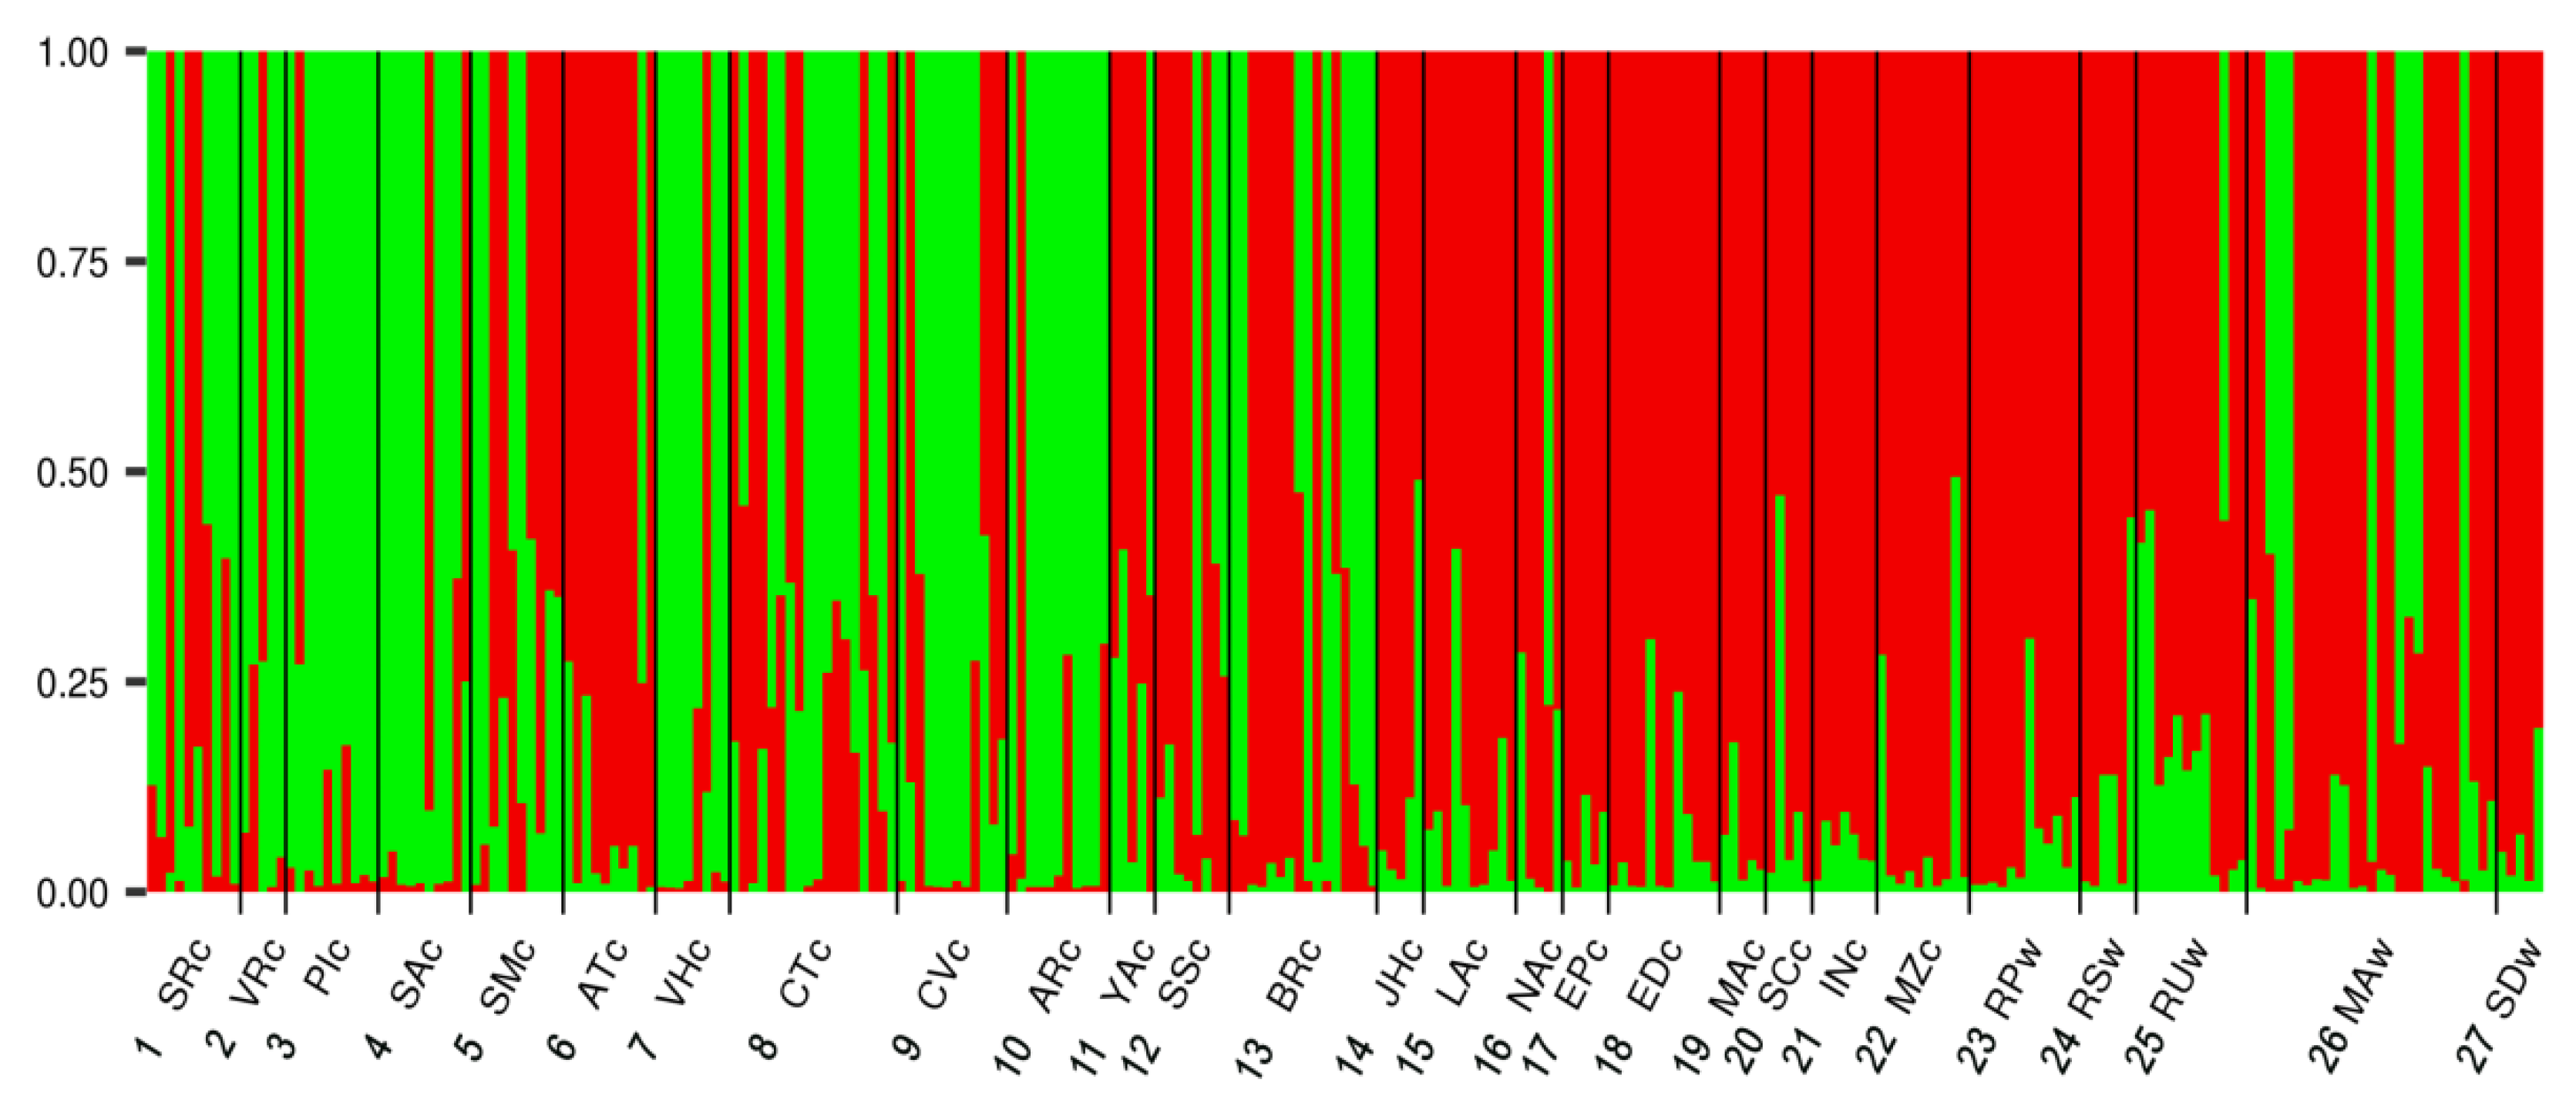
3.3. Population Structure
4. Discussion
4.1. Influence of Domestication on Fruit Length
4.2. Genetic Diversity of Wild and Cultivated Populations of I. edulis in the Peruvian Amazon
4.3. Population Structure
4.4. Practical Measures to Maintain I. edulis Genetic Resources
5. Conclusions
Supplementary Materials
Author Contributions
Funding
Acknowledgments
Conflicts of Interest
References
- Bodmer, R.; Fang, T.; Antunez, M.; Puertas, P.; Chota, K.; Pittet, M.; Kirkland, M.; Walkey, M.; Rios, C.; Perez-Peña, P.; et al. Impact of Climate Change on Wildlife and Indigenous Communities in Flooded Forests of the Peruvian Amazon. In The Lima Declaration on Biodiversity and Climate Change: Contributions from Science to Policy for Sustainable Development; Rodríguez, L., Anderson, I., Eds.; Secretariat of the Convention on Biological Diversity: Montreal, QC, Canada, 2017; Volume 89, pp. 81–90. [Google Scholar]
- Levis, C.; Flores, B.M.; Moreira, P.A.; Luize, B.G.; Alves, R.P.; Franco-Moraes, J.; Lins, J.; Konings, E.; Peña-Claros, M.; Bongers, F.; et al. How People Domesticated Amazonian Forests. Front. Ecol. Evol. 2018, 5. [Google Scholar] [CrossRef] [Green Version]
- Dawson, I.K.; Lengkeek, A.; Weber, J.C.; Jamnadass, R. Managing genetic variation in tropical trees: Linking knowledge with action in agroforestry ecosystems for improved conservation and enhanced livelihoods. Biodivers. Conserv. 2009, 18, 969–986. [Google Scholar] [CrossRef]
- Brooks, T.M.; Mittermeier, R.A.; da Fonseca, G.A.B.; Gerlach, J.; Hoffmann, M.; Lamoreux, J.F.; Mittermeier, C.G.; Pilgrim, J.D.; Rodrigues, A.S.L. Global biodiversity conservation priorities. Science 2006, 313, 58–61. [Google Scholar] [CrossRef] [PubMed] [Green Version]
- Oliveira, P.J.C.; Asner, G.P.; Knapp, D.E.; Almeyda, A.; Galván-Gildemeister, R.; Keene, S.; Raybin, R.F.; Smith, R.C. Land-use allocation protects the Peruvian Amazon. Science 2007, 317, 1233–1236. [Google Scholar] [CrossRef] [PubMed] [Green Version]
- Finkeldey, R.; Hattemer, H.H. Tropical Forest Genetics; Springer-Verlag: Berlin/Heidelberg, Germany, 2007; p. 315. [Google Scholar] [CrossRef]
- Wee, A.K.S.; Li, C.H.; Dvorak, W.S.; Hong, Y. Genetic diversity in natural populations of Gmelina arborea: Implications for breeding and conservation. New Forests 2012, 43, 411–428. [Google Scholar] [CrossRef]
- Pennington, T.D. The Genus Inga: Botany; Royal Botanic Gardens, Kew: London, UK, 1997; p. 854. [Google Scholar]
- Richardson, J.E.; Pennington, R.T.; Pennington, T.D.; Hollingsworth, P.M. Rapid diversification of a species-rich genus of neotropical rain forest trees. Science 2001, 293, 2242–2245. [Google Scholar] [CrossRef]
- Lavin, M. Floristic and geographical stability of discontinuous seasonally dry tropical forests explains patterns of plant phylogeny and endemism. In Neotropical Savannas and Seasonally Dry Forests: Plant Diversity, Biogeography, and Conservation; Pennington, R.T., Lewis, G.P., Ratter, J.A., Eds.; Crc Press-Taylor & Francis Group: Boca Raton, FL, USA, 2006; pp. 433–447. [Google Scholar]
- Cruz-Neto, O.; Machado, I.; Duarte, J., Jr.; Lopes, A. Synchronous phenology of hawkmoths (Sphingidae) and Inga species (Fabaceae-Mimosoideae): Implications for the restoration of the Atlantic forest of northeastern Brazil. Biodivers. Conserv. 2011, 20, 751–765. [Google Scholar] [CrossRef]
- Figueiredo, M.; Bruno, R.; Barros e Silva, A.; Nascimento, S.; Oliveira, I.; Felix, L. Intraspecific and interspecific polyploidy of Brazilian species of the genus Inga (Leguminosae: Mimosoideae). Genet. Mol. Res. 2014, 13, 3395–3403. [Google Scholar] [CrossRef]
- Dawson, I.; Hollingsworth, P.; Doyle, J.; Kresovich, S.; Weber, J.; Sotelo Montes, C.; Pennington, T.; Pennington, R. Origins and genetic conservation of tropical trees in agroforestry systems: A case study from the Peruvian Amazon. Conserv. Genet. 2008, 9, 361–372. [Google Scholar] [CrossRef]
- Pennington, T.D. Inga management. In The Genus Inga: Utilization; Pennington, T., Fernandes, E., Eds.; Royal Botanic Gardens, Kew: London, UK, 1998; pp. 159–167. [Google Scholar]
- Koptur, S. Outcrossing and pollinator limitation of fruit-set: Breeding systems of Neotropical Inga trees (Fabaceae: Mimosoideae). Evolution 1984, 38, 1130–1143. [Google Scholar] [CrossRef]
- Reynel, C.; Pennington, T.D. El Género Inga en el Perú: Morfología, Distribución y Usos; Royal Botanic Gardens, Kew: London, UK, 1997. [Google Scholar]
- León, J. Botánica de los Cultivos Tropicales; Servicio Editorial IICA: San José, Costa Rica, 1987; p. 445. [Google Scholar]
- Clement, C.R.; Denevan, W.M.; Heckenberger, M.J.; Junqueira, A.B.; Neves, E.G.; Teixeira, W.G.; Woods, W.I. The domestication of Amazonia before European conquest. Proc. R. Soc. Lond. B Biol. Sci. 2015, 282, 20150813. [Google Scholar] [CrossRef] [Green Version]
- Nichols, J.D.; Carpenter, F.L. Interplanting Inga edulis yields nitrogen benefits to Terminalia amazonia. For. Ecol. Manag. 2006, 233, 344–351. [Google Scholar] [CrossRef]
- Clement, C.R. 1492 and the loss of Amazonian crop genetic resources. I. The relation between domestication and human population decline. Econ. Bot. 1999, 53, 188. [Google Scholar] [CrossRef]
- Hollingsworth, P.M.; Dawson, I.K.; Goodall-Copestake, W.P.; Richardson, J.E.; Weber, J.C.; Sotelo Montes, C.; Pennington, R.T. Do farmers reduce genetic diversity when they domesticate tropical trees? A case study from Amazonia. Mol. Ecol. 2005, 14, 497–501. [Google Scholar] [CrossRef] [PubMed]
- Clement, C.; De Cristo-Araújo, M.; Coppens D’Eeckenbrugge, G.; Alves Pereira, A.; Picanço-Rodrigues, D. Origin and domestication of native Amazonian crops. Diversity 2010, 2, 72. [Google Scholar] [CrossRef] [Green Version]
- Cruz-Neto, O.; Aguiar, A.V.; Twyford, A.D.; Neaves, L.E.; Pennington, R.T.; Lopes, A.V. Genetic and ecological outcomes of Inga vera subsp affinis (Leguminosae) tree plantations in a fragmented tropical landscape. PLoS ONE 2014, 9. [Google Scholar] [CrossRef] [Green Version]
- Dawson, I.K.; Leakey, R.; Clement, C.R.; Weber, J.C.; Cornelius, J.P.; Roshetko, J.M.; Vinceti, B.; Kalinganire, A.; Tchoundjeu, Z.; Masters, E.; et al. The management of tree genetic resources and the livelihoods of rural communities in the tropics: Non-timber forest products, smallholder agroforestry practices and tree commodity crops. For. Ecol. Manag. 2014, 333, 9–21. [Google Scholar] [CrossRef] [Green Version]
- Rollo, A.; Lojka, B.; Honys, D.; Mandák, B.; Wong, J.A.C.; Santos, C.; Costa, R.; Quintela-Sabarís, C.; Ribeiro, M.M. Genetic diversity and hybridization in the two species Inga ingoides and Inga edulis: Potential applications for agroforestry in the Peruvian Amazon. Ann. For. Sci. 2016, 73, 425–435. [Google Scholar] [CrossRef] [Green Version]
- Dayanandan, S.; Bawa, K.; Kesseli, R. Conservation of microsatellites among tropical trees (Leguminosae). Am J Botany 1997, 84, 1658–1663. [Google Scholar] [CrossRef] [Green Version]
- Sokal, R.R.; Rohlf, F.J. Biometry, 2nd ed.; W.H. Freeman and Co.: San Francisco, CA, USA, 1981; p. 859. [Google Scholar]
- El Mousadik, A.; Petit, R.J. High level of genetic differentiation for allelic richness among populations of the argan tree [Argania spinosa (L.) Skeels] endemic to Morocco. Theor. Appl. Genet. 1996, 92, 832–839. [Google Scholar] [CrossRef]
- Nei, M. Molecular Evolutionary Genetics; Columbia University Press: New York, NY, USA, 1987; p. 333. [Google Scholar]
- Goudet, J. FSTAT (Version 1.2): A computer program to calculate F-statistics. J. Hered. 1995, 86, 485–486. [Google Scholar] [CrossRef]
- Peakall, R.; Smouse, P.E. GenAlEx 6.5: Genetic analysis in Excel. Population genetic software for teaching and research—an update. Bioinformatics 2012, 28, 2537–2539. [Google Scholar] [CrossRef] [PubMed] [Green Version]
- Rousset, F. Genepop’007: A complete re-implementation of the genepop software for Windows and Linux. Mol. Ecol. Resour. 2008, 8, 103–106. [Google Scholar] [CrossRef] [PubMed]
- Excoffier, L.; Lischer, H.E.L. Arlequin suite ver 3.5: A new series of programs to perform population genetics analyses under Linux and Windows. Mol. Ecol. Resour. 2010, 10, 564–567. [Google Scholar] [CrossRef] [PubMed]
- Pritchard, J.K.; Stephens, M.; Donnelly, P. Inference of population structure using multilocus genotype data. Genetics 2000, 155, 945–959. [Google Scholar]
- Hubisz, M.J.; Falush, D.; Stephens, M.; Pritchard, J.K. Inferring weak population structure with the assistance of sample group information. Mol. Ecol. Resour. 2009, 9, 1322–1332. [Google Scholar] [CrossRef] [Green Version]
- Wang, J. The computer program structure for assigning individuals to populations: Easy to use but easier to misuse. Mol. Ecol. Resour. 2017, 17, 981–990. [Google Scholar] [CrossRef]
- Evanno, G.; Regnaut, S.; Goudet, J. Detecting the number of clusters of individuals using the software structure: A simulation study. Mol. Ecol. 2005, 14, 2611–2620. [Google Scholar] [CrossRef] [Green Version]
- Earl, D.A.; vonHoldt, B.M. STRUCTURE HARVESTER: A website and program for visualizing STRUCTURE output and implementing the Evanno method. Conserv. Genet. Resour. 2012, 4, 359–361. [Google Scholar] [CrossRef]
- Jakobsson, M.; Rosenberg, N.A. CLUMPP: A cluster matching and permutation program for dealing with label switching and multimodality in analysis of population structure. Bioinformatics 2007, 23, 1801–1806. [Google Scholar] [CrossRef] [Green Version]
- Ramasamy, R.K.; Ramasamy, S.; Bindroo, B.B.; Naik, V.G. STRUCTURE PLOT: A program for drawing elegant STRUCTURE bar plots in user friendly interface. Springerplus 2014, 3, 431. [Google Scholar] [CrossRef] [PubMed] [Green Version]
- Ormsby, T.; Napoleon, E.; Burke, R.; Groessl, C.; Bowden, L. Getting to Know ArcGIS Desktop; ESRI Press: Redlands, CA, USA, 2010; p. 592. [Google Scholar]
- León, J. Inga as shade for coffee, cacao, and tea: Historical aspects and present day utilization. In The Genus Inga: Utilization; Pennington, T., Fernandes, E., Eds.; Royal Botanic Gardens, Kew: London, UK, 1998; pp. 101–115. [Google Scholar]
- Miller, R.P.; Nair, P.K.R. Indigenous agroforestry systems in Amazonia: From Prehistory to Today. Agrofor. Syst. 2006, 66, 151–164. [Google Scholar] [CrossRef]
- Nybom, H. Comparison of different nuclear DNA markers for estimating intraspecific genetic diversity in plants. Mol. Ecol. 2004, 13, 1143–1155. [Google Scholar] [CrossRef] [PubMed]
- Ribeiro, M.M.; Plomion, C.; Petit, R.; Vendramin, G.G.; Szmidt, A.E. Variation in chloroplast single-sequence repeats in Portuguese maritime pine (Pinus pinaster Ait.). Theor. Appl. Genet. 2001, 102, 97–103. [Google Scholar] [CrossRef]
- Jones, T.H.; Steane, D.A.; Jones, R.C.; Pilbeam, D.; Vaillancourt, R.E.; Potts, B.M. Effects of domestication on genetic diversity in Eucalyptus globulus. For. Ecol. Manag. 2006, 234, 78–84. [Google Scholar] [CrossRef]
- Petit, R.J.; Duminil, J.; Fineschi, S.; Hampe, A.; Salvini, D.; Vendramin, G.G. Comparative organization of chloroplast, mitochondrial and nuclear diversity in plant populations. Mol. Ecol. 2005, 14, 689–701. [Google Scholar] [CrossRef] [Green Version]
- Eidt, R.C. Pioneer settlement in Eastern Peru. Ann. Assoc. Am. Geogr. 1962, 52, 255–278. [Google Scholar] [CrossRef]


| I. edulis | Site | Pop. | N | Latitude S | Longitude W | Altitude (m) |
|---|---|---|---|---|---|---|
| Cultivated | San Ramon | 1 SRc | 10 | 11°08’ | 75°21´ | 828–1200 |
| Selva Central | Villa Rica | 2 VRc | 5 | 10°44´ | 75°16´ | 1467–1494 |
| Pichanaqui | 3 PIc | 10 | 10°55´ | 74°52´ | 497–631 | |
| Satipo | 4 SAc | 10 | 11°16´ | 74°38´ | 550–677 | |
| San Martín de Pangoa | 5 SMc | 10 | 11°26´ | 74°30´ | 788–949 | |
| Cultivated | Atalaya | 6 ATc | 10 | 10°43´ | 73°45´ | 223–244 |
| Ucayali | Von Humboldt | 7 VHc | 8 | 8°51´ | 75°00´ | 210–243 |
| Campo Verde-Tournavista | 8 CTc | 18 | 8°35´ | 74°46´ | 180–207 | |
| Campo Verde | 9 CVc | 12 | 8°31´ | 74°47´ | 198–210 | |
| Antonio Raimondi | 10 ARc | 11 | 8°29´ | 74°49´ | 147–158 | |
| Yarinacocha | 11 YAc | 5 | 8°20´ | 74°36´ | 144–154 | |
| Santa Sofia | 12 SSc | 8 | 8°09´ | 74°15´ | 152–159 | |
| Cultivated | Bretaña | 13 BRc | 16 | 5°15´ | 74°20´ | 103–108 |
| Loreto | Jenaro Herrera | 14 JHc | 5 | 4°54´ | 73°40´ | 100–127 |
| Lagunas | 15 LAc | 10 | 5°14´ | 75°37´ | 108–135 | |
| Nauta | 16 NAc | 5 | 4°30´ | 73°34´ | 106–139 | |
| Ex Petroleros | 17 EPc | 5 | 4° 5´ | 73° 27´ | 97–108 | |
| El Dorado | 18 EDc | 12 | 3° 57´ | 73° 25´ | 109–151 | |
| Manacamiri | 19 MAc | 5 | 3° 43´ | 73° 17´ | 95–97 | |
| Santa Clotylda | 20 SCc | 5 | 3° 40´ | 73° 15´ | 93–128 | |
| Indiana | 21 INc | 7 | 3°29´ | 73°02´ | 92–108 | |
| Mazán | 22 MZc | 10 | 3°30´ | 73°04´ | 93–122 | |
| Wild | Pacaya River | 23 RPw | 12 | 5° 41´ | 74° 57´ | 110–131 |
| Samiria River | 24 RSw | 6 | 5° 14´ | 75° 28´ | 105–123 | |
| Utiquinia River | 25 RUw | 12 | 8° 10´ | 74° 17´ | 150–160 | |
| Macuya | 26 MAw | 27 | 8° 53´ | 75° 0´ | 216–233 | |
| Sierra del Divisor | 27 SDw | 5 | 7° 13´ | 74° 57´ | 196–231 |
| I. edulis | Population | N | A | RS | Ne | HO | HE | FIS | Sig | f-Null |
|---|---|---|---|---|---|---|---|---|---|---|
| Cultivated | 1 SRc | 10 | 5.5 | 3.9 | 2.91 (0.42) | 0.53 (0.13) | 0.67 (0.06) | 0.18 (0.16) | NS | 0.06 |
| Selva Central | 2 VRc | 5 | 5.5 | 5.5 | 4.09 (0.52) | 0.70 (0.17) | 0.83 (0.03) | 0.06 (0.22) | NS | 0.08 |
| 3 PIc | 10 | 5.0 | 4.0 | 3.32 (0.91) | 0.55 (0.13) | 0.67 (0.08) | 0.15 (0.16) | NS | 0.06 | |
| 4 SAc | 10 | 5.8 | 4.1 | 2.96 (0.72) | 0.58 (0.15) | 0.63 (0.09) | 0.06 (0.19) | NS | 0.05 | |
| 5 SMc | 10 | 6.3 | 4.4 | 3.39 (0.84) | 0.60 (0.12) | 0.67 (0.10) | 0.07 (0.08) | NS | 0.04 | |
| Cultivated | 6 ATc | 10 | 4.8 | 3.7 | 2.72 (0.51) | 0.53 (0.18) | 0.61 (0.09) | 0.16 (0.19) | NS | 0.09 |
| Ucayali | 7 VHc | 8 | 5.3 | 4.5 | 3.86 (0.55) | 0.63 (0.09) | 0.77 (0.04) | 0.15 (0.09) | ** | 0.06 |
| 8 CTc | 18 | 7.3 | 4.6 | 4.17 (0.78) | 0.65 (0.08) | 0.76 (0.05) | 0.12 (0.07) | ** | 0.06 | |
| 9 CVc | 12 | 5.8 | 4.5 | 4.15 (0.78) | 0.67 (0.12) | 0.76 (0.05) | 0.11 (0.12) | NS | 0.05 | |
| 10 ARc | 11 | 5.5 | 4.3 | 3.48 (0.21) | 0.61 (0.15) | 0.74 (0.02) | 0.14 (0.21) | *** | 0.10 | |
| 11 YAc | 5 | 5.0 | 5.0 | 3.22 (0.77) | 0.65 (0.15) | 0.66 (0.16) | −0.10 (0.03) | NS | 0.00 | |
| 12 SSc | 8 | 5.5 | 4.6 | 4.03 (0.99) | 0.50 (0.21) | 0.75 (0.07) | 0.36 (0.25) | *** | 0.15 | |
| Cultivated | 13 BRc | 16 | 8.0 | 4.8 | 4.52 (1.45) | 0.64 (0.12) | 0.71 (0.10) | 0.08 (0.09) | NS | 0.04 |
| Loreto | 14 JHc | 5 | 3.8 | 3.8 | 2.55 (0.26) | 0.50 (0.19) | 0.66 (0.05) | 0.20 (0.31) | NS | 0.11 |
| 15 LAc | 10 | 6.8 | 4.8 | 4.42 (1.26) | 0.65 (0.12) | 0.73 (0.11) | 0.03 (0.14) | NS | 0.04 | |
| 16 NAc | 5 | 4.3 | 4.3 | 2.93 (0.64) | 0.60 (0.18) | 0.64 (0.15) | −0.04 (0.16) | NS | 0.03 | |
| 17 EPc | 5 | 3.8 | 3.8 | 2.79 (0.31) | 0.55 (0.19) | 0.69 (0.06) | 0.18 (0.29) | NS | 0.09 | |
| 18 EDc | 12 | 5.0 | 3.8 | 3.03 (0.68) | 0.46 (0.17) | 0.62 (0.12) | 0.33 (0.26) | ** | 0.11 | |
| 19 MAc | 5 | 3.8 | 3.8 | 2.59 (0.61) | 0.50 (0.13) | 0.61 (0.11) | 0.10 (0.15) | NS | 0.04 | |
| 20 SCc | 5 | 3.8 | 3.8 | 2.58 (0.33) | 0.45 (0.13) | 0.66 (0.07) | 0.25 (0.20) | NS | 0.12 | |
| 21 INc | 7 | 3.8 | 3.3 | 2.60 (0.84) | 0.43 (0.21) | 0.50 (0.17) | 0.20 (0.27) | NS | 0.06 | |
| 22 MZc | 10 | 5.5 | 4.3 | 3.76 (0.72) | 0.60 (0.16) | 0.73 (0.07) | 0.18 (0.18) | ** | 0.11 | |
| Mean | 5.3 | 4.2 | 3.37 (0.16) | 0.57 (0.03) | 0.69 (0.02) | 0.14 (0.04) | 0.07 | |||
| Wild | 23 RPw | 12 | 8.3 | 5.2 | 5.06 (1.17) | 0.63 (0.17) | 0.72 (0.13) | 0.09 (0.18) | NS | 0.07 |
| 24 RSw | 6 | 6.5 | 5.8 | 5.32 (1.37) | 0.75 (0.08) | 0.79 (0.13) | −0.08 (0.09) | NS | 0.02 | |
| 25 RUw | 12 | 7.3 | 5.2 | 4.58 (1.15) | 0.67 (0.14) | 0.76 (0.07) | 0.11 (0.17) | NS | 0.06 | |
| 26 MAw | 27 | 11.0 | 5.4 | 5.98 (1.99) | 0.66 (0.16) | 0.75 (0.12) | 0.12 (0.10) | NS | 0.06 | |
| 27 SDw | 5 | 4.0 | 4.0 | 2.77 (0.94) | 0.70 (0.13) | 0.60 (0.11) | −0.30 (0.07) | NS | 0.06 | |
| Mean | 7.4 | 5.1 | 4.74 (0.64) | 0.68 (0.06) | 0.72 (0.05) | −0.01 (0.06) | 0.04 | |||
| Cultivated and Wild | Mean | 5.7 | 4.4 | 3.62 (0.18) | 0.59 (0.03) | 0.69 (0.02) | 0.11 (0.03) | 0.07 | ||
| Source of Variation | d.f. | SS | Variance Components | % of Variation | Φ Statistics | p |
|---|---|---|---|---|---|---|
| Between groups (cultivated vs. wild) | 1 | 7.697 | 0.01486 | 0.97 | Φct = 0.010 | <0.0958 |
| Among populations within groups | 25 | 86.53 | 0.11103 | 7.24 | Φsc = 0.073 | <0.0001 |
| Within populations | 491 | 690.914 | 1.40716 | 91.79 | Φst = 0.082 | <0.0001 |
| Total | 517 | 785.141 | 1.53304 |
© 2020 by the authors. Licensee MDPI, Basel, Switzerland. This article is an open access article distributed under the terms and conditions of the Creative Commons Attribution (CC BY) license (http://creativecommons.org/licenses/by/4.0/).
Share and Cite
Rollo, A.; Ribeiro, M.M.; Costa, R.L.; Santos, C.; Clavo P., Z.M.; Mandák, B.; Kalousová, M.; Vebrová, H.; Chuqulin, E.; Torres, S.G.; et al. Genetic Structure and Pod Morphology of Inga edulis Cultivated vs. Wild Populations from the Peruvian Amazon. Forests 2020, 11, 655. https://doi.org/10.3390/f11060655
Rollo A, Ribeiro MM, Costa RL, Santos C, Clavo P. ZM, Mandák B, Kalousová M, Vebrová H, Chuqulin E, Torres SG, et al. Genetic Structure and Pod Morphology of Inga edulis Cultivated vs. Wild Populations from the Peruvian Amazon. Forests. 2020; 11(6):655. https://doi.org/10.3390/f11060655
Chicago/Turabian StyleRollo, Alexandr, Maria M. Ribeiro, Rita L. Costa, Carmen Santos, Zoyla M. Clavo P., Bohumil Mandák, Marie Kalousová, Hana Vebrová, Edilberto Chuqulin, Sergio G. Torres, and et al. 2020. "Genetic Structure and Pod Morphology of Inga edulis Cultivated vs. Wild Populations from the Peruvian Amazon" Forests 11, no. 6: 655. https://doi.org/10.3390/f11060655